Abstract
Common beans (Phaseolus vulgaris L.) are considered a socially and economically important crop, with the biggest growers in India, Myanmar, and Brazil. Traditionally, common beans are also grown in most parts of Europe, including Latvia, where cultivation areas have remained relatively constant since the middle of the last century. This is explained by the plant’s higher thermal requirements compared to peas and faba beans more widely grown here. Despite this, landraces adapted to local conditions have been developed, whose origin and potential relationship with another European common bean germplasm is very limited. Therefore, the study aimed to characterise the morphology of the common bean germplasm collected and grown in Latvia to identify the most valuable material for further crop development and evaluate the local landraces in the European common bean germplasm context. The 28 genotypes representing Latvian landraces and European reference genotypes were phenotyped using 26 traits of bean seeds, pods, leaves, flowers, and stems, which were evaluated according to an internationally applied methodology. Latvian varieties showed phenotypical variability and characteristics that were different from those found in other European regions, showing the significance of the germplasm under study and highlighting the need for conservation. Local varieties (landraces) are reservoirs of unique genetic traits. Their adaptability to local environmental conditions, resistance to pests and diseases, and their potential to enhance nutritional quality make them invaluable resources for in situ conservation efforts and targeted genetic improvement programmes. Emphasising the utilisation of these landraces can contribute to sustainable agriculture, climate resilience, and food security.
1. Introduction
Common beans (Phaseolus vulgaris L.) are annual plants from the Fabaceae family. They are native to the tropical regions of America and are cultivated for their edible dry seeds, variously called navy beans, kidney beans, red beans, black beans, pinto beans, and cranberry beans [1,2]. The green leaves and immature pods are widely popular vegetable foods, while young leaves are consumed as salad in various regions of Asia. The common bean can be considered a socially and economically important plant. Seventy-six species from the New World come under the genus of Phaseolus L., out of which the tepary bean (P. acutifolius A. Gary), runner bean (P. coccineous L.), lima bean (P. lunatus L.), year bean (P. polyanthus Greenman), and common bean (P. vulgaris L.) are under cultivation globally [3]. The majority of bean cultivation, at 90%, consists of common beans. The yield is processed as dry grains, snap beans as vegetables, and canned products, in the same way as other industrial crops. About 19.23% of the production comes from India, followed by Myanmar (13.88%), Brazil (12.42%), the USA (5.66%), China (5.26%), Mexico (4.52%), and Tanzania (4.28%) [4].
As a legume, it is a valuable source of high-quality protein, carbohydrates, vitamins, minerals, fibres, phytonutrients (mainly phytosterols and flavonoids), and antioxidants. The major proteins of beans are globulins (54–79%) and albumins (12–30%), and the presence of protease inhibitors (α-amylase, chymotrypsin and trypsin), lectins, and lipoxygenase was found. Thiamine, riboflavin, niacin, vitamin B6, and folic acid have been identified in the common beans. They also contain a diversity of mineral elements, including potassium (K), calcium (Ca), magnesium (Mg), zinc (Zn), copper (Cu), and iron (Fe). Phytic acid, tannins, ascorbic acid, thiamine, and protein digestibility are discovered in the common beans. High concentrations of health-promoting nutrients make beans a healthy and easily available component of the daily diet [5,6,7,8,9]. The consumption of beans decreases the risk of developing certain diseases, including heart disease, obesity, and many cancers. Beans treat eczema, diabetes, diuretics, burns, acne, cardiac disease, bladder disease, carminative issues, dropsy, dysentery, emollients, hiccups, itchiness, and rheumatism [5]. The 2010 Dietary Guidelines for Americans recommend consuming 1.5 cups of beans per week to take advantage of these potential health benefits [10]. Dry beans are considered to be an excellent source of low-fat proteins. Beans contain about 21–25% protein by weight, which is normally more than all other vegetables. In many parts of the world, they provide an important portion of the total protein intake for the population. Dried bean intake as a protein source is a popular yet affordable source of protein worldwide. The beans’ high yield and easy farming nature could be a key factor in providing an affordable solution for malnutrition in poor countries [3,11].
Genetic variability is a fundamental aspect of the common bean and is crucial in its adaptability, resilience, and contribution to human nutrition. A rich genetic diversity exists within the diverse world of common beans, spanning different varieties, colours, shapes, and sizes. This genetic variability is paramount as it gives the beans the ability to thrive in diverse ecological conditions, making them a staple crop in many parts of the world. Moreover, this diversity enhances the bean’s nutritional profile. Common beans are not just a dietary staple, but they are also integral to sustainable agriculture practices, promoting soil health and crop rotation [11]. As global challenges such as climate change and food security become increasingly pressing, the genetic diversity of common beans becomes a valuable resource for breeding programmes, ensuring this essential legume’s continued success and versatility in nourishing our growing population [12].
Enhancing the common bean’s characteristics necessitates a deep understanding of its genetic diversity, genome structure, and gene functions. This knowledge allows us to scrutinise the intricate pathways and networks responding to ever-changing environmental conditions. These strategies hinge on the availability of precise phenotypic data. Field experiments are subject to multifaceted interactions among the crop’s genetic makeup, environmental factors, population dynamics, and agricultural practices, all of which significantly influence the observable traits of the plants [13,14,15,16,17]. Therefore, new techniques must remain both cost-effective and resilient when applied under diverse field conditions while also allowing the monitoring of a broad spectrum of intricate traits.
Traditionally, common beans are an important crop in most parts of Europe, including Latvia. Common bean areas have remained relatively constant since the middle of the last century and amount to around 100 ha [18,19]. Common bean cultivation faces several agro-climatic and practical challenges that underscore the importance of local adaptation. The relatively short growing season and cool temperate climate limit the selection of suitable bean landraces, as many commercial cultivars require higher thermal sums and longer maturation periods than typically available in Latvia. This thermal constraint can lead to incomplete seed development or yield losses in cooler, wetter summers. Additionally, common beans in Latvia are often grown on small-scale farms or in home gardens, where mechanisation is limited. As a result, harvesting remains largely manual, making labour efficiency and ease of cultivation critical traits. Locally adapted landraces, selected over generations for their ability to thrive in these specific environmental and management conditions offer valuable solutions. They tend to have shorter growing cycles, better cold tolerance, and growth habits suited to small-scale cultivation and manual harvesting. These adaptations make them not only agronomically viable, but also strategically important for enhancing the resilience and sustainability of local bean production. There is still a relatively high diversity of landraces, but as new varieties and relatively cheap imported products enter the market, as well as the increasing infestation of seed pests, the interest of landraces‘ growers is declining. The Latvia University of Life Sciences and Technologies (LBTU) common bean collection used in this study was assembled from long-cultivated landraces found on farms and homesteads to preserve Latvian bean germplasm and encourage its broader cultivation. However, the collection remains poorly characterised, with unknown origins and no prior evaluation of genetic relatedness or diversity.
Considering the above information, the study aimed to morphologically characterise the common bean germplasm collected and grown in Latvia to identify the most valuable material for further crop development and evaluate the local material position in the European common bean germplasm.
2. Materials and Methods
Plant material. The 28 common bean (Phaseolus vulgaris L.) genotypes of different origins were included in the experiment (Table S1):
(1) Twenty-one common bean genotypes from the LBTU germplasm collection, comprising P. vulgaris seed material sourced from farms with established growing traditions and seed production expertise, ensuring the landrace’s suitability for long-term maintenance as a recognised variety;
(2) The commercial variety ‘Sundance’, used as a reference cultivar;
(3) Six reference varieties received in the frame of the project “INCREASE—Intelligent Collections of Food Legumes Genetic Resources for European Agrofood Systems Citizen Science” (INCREASE) experiment (https://www.pulsesincrease.eu/experiment, accessed on 9 October 2024), which included five lines (named with code INCBN) and the cv ‘Meccearly’.
Field experiments were organised in three locations:
- Location 1—
- The experimental field of the Latvia University of Life Sciences and Technologies (56°39′46.884″ N 23°45′13.411″ E). The soil in Location 1 was Calcaric Katogleyic, Hortic Phaeozem. The agrochemical characteristics of the soil were (mg L−1) N 44; P 149; K 170; Ca 585; Mg 140; S 100; Fe 1350; Mn 140; Zn 9.5; Cu 5.5; Mo 0.06; B 0.5. Soil pH KCl 7.48 and EC mS cm−1 0.69. Beans were sown on 8 June 2023, in 3 replicates per genotype with 10 plants in each replicate. A greater number of replicates was included at Location 1 to generate more data for integration with the INCREASE project.
- Location 2—
- The experimental field in Ķemeri (56°56′48.7″ N 23°28′18.5″ E); soil—Eutric Rheic Drainic Sapric Histosol. The agrochemical characteristics of the soil were (mg L−1) N 83; P 981; K 155; Ca 10200; Mg 1970; S 30; Fe 675; Mn 105; Zn 180; Cu 33; Mo 0.04; B 1.9. Soil pH KCl 6.52 and EC mS cm−1 1.19. Beans were sown on 10 June 2023, in 3 replicates per genotype with 4 plants in each replicate.
- Location 3—
- The experimental field in the Jelgava district (56.64′49.82″ N 23.664389”E). Soil: loamy sand. The agrochemical characteristics of the soil were (mg L−1) N 68; P 818; K 115; Ca 5500; Mg 625; S 18; Fe 545; Mn 75; Zn 22.5; Cu 5.5; Mo 0.06; B 0.3. Soil pH KCl 6.65 and EC mS cm−1 0.53. Beans were sown on 11 June 2023, in 3 replicates per genotype with 4 plants in each replicate.
In all the experiment locations, the crop was harvested gradually when about 3/4 of the pods of the respective variant were dry. The harvested pods were dried to an air-dried state, weighed, and peeled, and the seed parameters were determined.
Vegetation pot experiments were conducted at the Institute of Soil and Plant Sciences of Latvia University of Life Sciences and Technologies. As part of the INCREASE project, common beans were received from Italy at the end of June. The trial in vegetation containers was arranged on June 27 in three repetitions. From the beginning, the beans were sown in cassettes, with a cell size of 5 × 5 cm. Beans sprouted on average in 5–7 days. After germination, the beans were transplanted into 5 L vegetation containers, which were filled with the same soil in which the beans grew in the field experiment at Location 1. To make the obtained results comparable, control ‘Sundance’ and LV1 genotype beans were also sown in the vegetation containers. The vegetation pots were placed in the open air, and at the end of the vegetation period, to avoid autumn frosts, they were brought into the greenhouse, where the plants ripened and dried.
Phenotypical characterisation. Common bean seeds were analysed according to Basic Protocol 1: Characterising Common Bean Seeds for Seed Trait Descriptors [20], whereas plant phenotypic characterisation was conducted according to Basic Protocol 3: Characterising Bean Lines for Plant Trait Descriptors Specific for Common Bean Primary Seed INCREASE [20], as well as additional traits of phenotypical description (Table 1).

Table 1.
Traits used in the common bean (Phaseolus vulgaris L.) characterisation at the Latvia University of Life Sciences and Technologies collection.
Statistical analysis was conducted using average values derived from measurements taken at three study locations, with five repetitions each. The significance of variability in the traits, genotypes, and their groups, along with statistical differences between study sites and replicate measurements, was evaluated using analysis of variance (ANOVA) in the GNU PSPP Statistical Analysis Software (Free Software Foundation, Inc., Boston, MA, USA) [22], determining statistical significance using the least significant difference (LSD) and Bonferroni criteria (p-value < 0.05). Relationships among accessions were assessed through cluster analysis and principal component analysis (PCA) based on a correlation matrix. Cluster analysis utilised the unweighted pair group method with the arithmetic mean (UPGMA) method, employing Euclidean distances. Data were analysed using the PAST 4 for Windows Version 4.14 Statistics Software Package [23]. This software was also utilised to determine the Pearson linear correlation between the examined phenotypic traits and the Shannon index to evaluate the tested germplasm diversity.
3. Results
3.1. Common Bean Characterisation Trait Variability
Table 2 presents the values of the descriptive statistics, including the mean, standard error, range, and coefficient of variation for each phenotypic trait of the tested common beans. The traits used in characterisation displayed significant variability, with an average of 41.2%, ranging from 12.4% (leaf colour: anthocyanin) to 92.9% (seed coat pattern). This high variability provides valuable information for evaluating genotype diversity. The coefficient of variation exceeded the average for the following 11 traits: protein content in beans (% of dry matter), number of pods, pod mass (g), bean mass in pods (g), leaf shape, flower colour, pod colour at maturity (dry), seed coat pattern, seed coat ground colour, seed coat secondary colour, and seed shape. The reference genotypes (cultivars ‘Meccearly’ and ‘Sundance’ and INCREASE project genotypes INCBN_00338-b, INCBN_01551-c, INCBN_01700-d, INCBN_03510-f, and INCBN_09250-e) exhibited greater trait variability than in common bean genotypes of Latvian origin. Although the sample size was smaller, the variability averaged 39.2%, ranging from 0% for fresh pod cross-section and curvature to 84.8% for protein content in beans and 35.1%, ranging from 8.3% for protein content in beans to 80.5% for seed coat pattern (Table 2). Conversely, the Shannon index was calculated to assess the diversity of the studied germplasm. This index ranged from 2.9 (for seed coat secondary colours) to 3.7 (for determinacy), depending on the trait. Notably, the germplasm of Latvian origin exhibited higher Shannon index values for all traits compared to the reference genotypes, with average values of 3.1 and 1.9, respectively, indicating greater diversity.
Table 2.
Summary of the phenotypic evaluation of 28 common bean accessions evaluated at the Latvia University of Life Sciences and Technologies collection.
ANOVA was used to assess the significance of the differences between the studied genotypes (Table S2), repeats (Table S3), research locations (Table S4), and sample origin groups (Latvian and reference genotypes) (Table S5). Significant differences (p-value < 0.05) between the study sites were found for traits such as bean length (mm), bean width (mm), bean volume (mm3), 100-bean mass (g), number of pods, pod mass (g), bean mass in pods (g), hypocotyl pigmentation, leaf colour: chlorophyll, leaf colour: anthocyanin, growth habit, petioles/strings: anthocyanin, stem diameter, fresh pod curvature, determination, pod colour at maturity (dry), pod wall fibre, seed coat pattern, seed coat ground colours, seed coat secondary colours, and seed shape. Given these differences, the entire dataset, including data from all trial sites, was used for further analyses. When evaluating the significance of the differences in traits between genotypes, significant differences were found for all traits except for protein content in beans (% of dry matter). This indicates that the traits used in the evaluation are suitable for characterising local common bean germplasm and identifying genotypes.
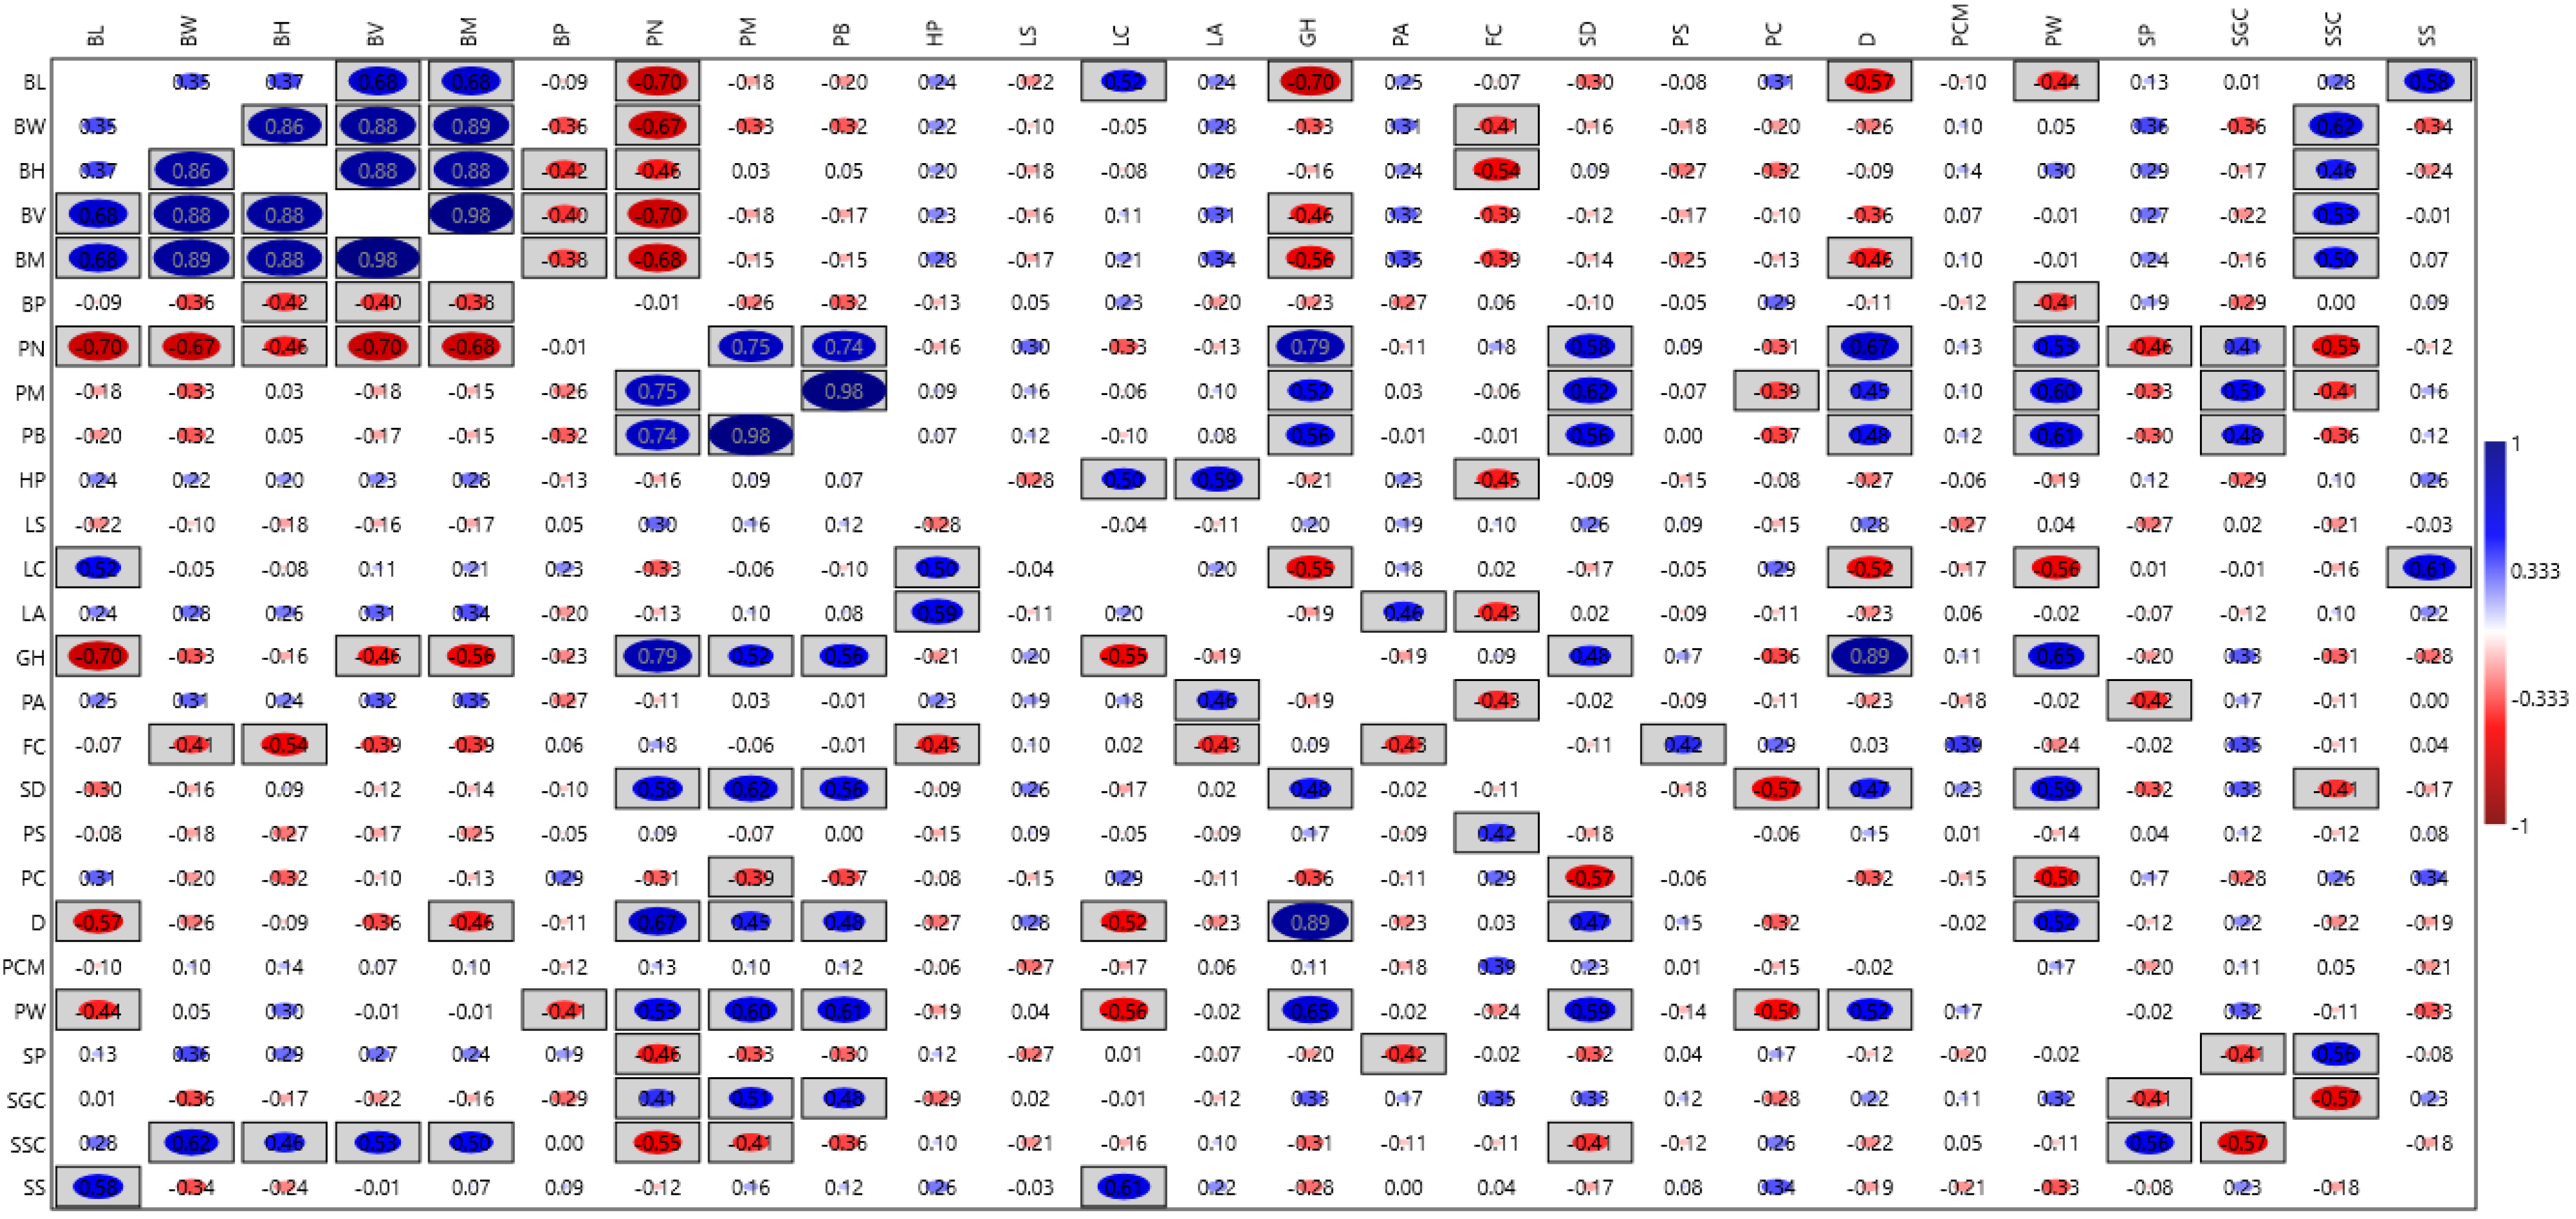
Pearson linear correlation analysis (Figure 1) was conducted to evaluate the relationships between various characteristics. The analysis revealed positive, statistically significant correlations among the following traits:

Figure 1.
The correlation matrix among evaluated common bean (Phaseolus vulgaris L.) traits evaluated at the Latvia University of Life Sciences and Technologies collection. Trait acronyms are seen in Table 3. Statistically significant correlation values (p < 0.05) are enclosed in rectangular boxes.
- Bean height (mm), bean volume (mm3), 100-bean mass (g), bean length (mm), and bean width (mm), with correlation coefficients ranging from 0.681 to 0.977.
- Number of pods, pod mass (g), and bean mass in pods (g), with coefficients from 0.738 to 0.984.
- Bean length (mm) and leaf colour: chlorophyll (0.519).
- Hypocotyl pigmentation and leaf colour: chlorophyll (0.504) and leaf colour: anthocyanin (0.595).
- Leaf colour: chlorophyll and seed shape (0.608).
- Growth habit and number of pods (0.794), pod mass (g) (0.519), and bean mass in pods (g) (0.561).
- Stem diameter and number of pods (0.577), pod mass (g) (0.621), and bean mass in pods (g) (0.563).
- Pod wall fibre and the number of pods (0.533), pod mass (g) (0.599), bean mass in pods (g) (0.612), growth habit (0.648), stem diameter (0.586), and determination (0.524).
- Determination and number of pods (0.670) and growth habit (0.893).
- Seed coat secondary colours and bean width (mm) (0.621), bean volume (mm3) (0.532), 100-bean mass (g) (0.503), and seed coat pattern (0.558).
- Bean length (mm) and seed shape (0.578).
- Seed coat ground colours and pod mass (g) (0.506).
Conversely, significant negative correlations were identified between the following traits:
- Number of pods and bean length (mm) (−0.695), bean width (mm) (−0.671), bean volume (mm3) (−0.695), and 100-bean mass (g) (−0.677).
- Growth habit and bean length (mm) (−0.697), 100-bean mass (g) (−0.559), and leaf colour: chlorophyll (−0.555).
- Seed coat secondary colours and number of pods (−0.550) and seed coat ground colours (−0.575).
- Leaf colour: chlorophyll and determination (−0.524) and pod wall fibre (−0.562).
- Flower colour and bean height (mm) (−0.539).
- Fresh pod curvature and stem diameter (−0.567).
3.2. Common Bean Phenotypic Diversity
The results of the PCA analysis are displayed in Table 3. Seven components with eigenvalues greater than 1.0 were identified, accounting for 81.3% of the variability in the original traits. The PCA ordination indicated that the phenotypical traits of common beans most useful for characterisation (Table 2) included bean length (mm), bean height (mm), bean volume (mm3), 100-bean mass (g), number of pods, growth habit, and determinacy. These traits had the highest impact on genotype clustering along the PC1 axis. The traits with the highest loadings on PC1 were the number of pods, growth habit, 100-bean mass (g), bean volume (mm3) and bean length (mm). For PC2, the highest loadings were bean height (mm), pod wall fibre, fresh pod curvature, protein content in beans (% of dry matter), and bean width (mm). PC3 was most strongly associated with seed shape, leaf colour: chlorophyll, seed coat secondary colours, seed coat pattern, and petiole/string anthocyanin. PC1 and PC2 were selected to describe the variability pattern in the collection as they exhibited high load values for various common bean characteristics, encompassing all groups of traits (seeds, plant, fruit, and flower characteristics).
Table 3.
Component weights in principal component analysis using morphological traits of common bean (Phaseolus vulgaris L.) accessions evaluated at the Latvia University of Life Sciences and Technologies collection.
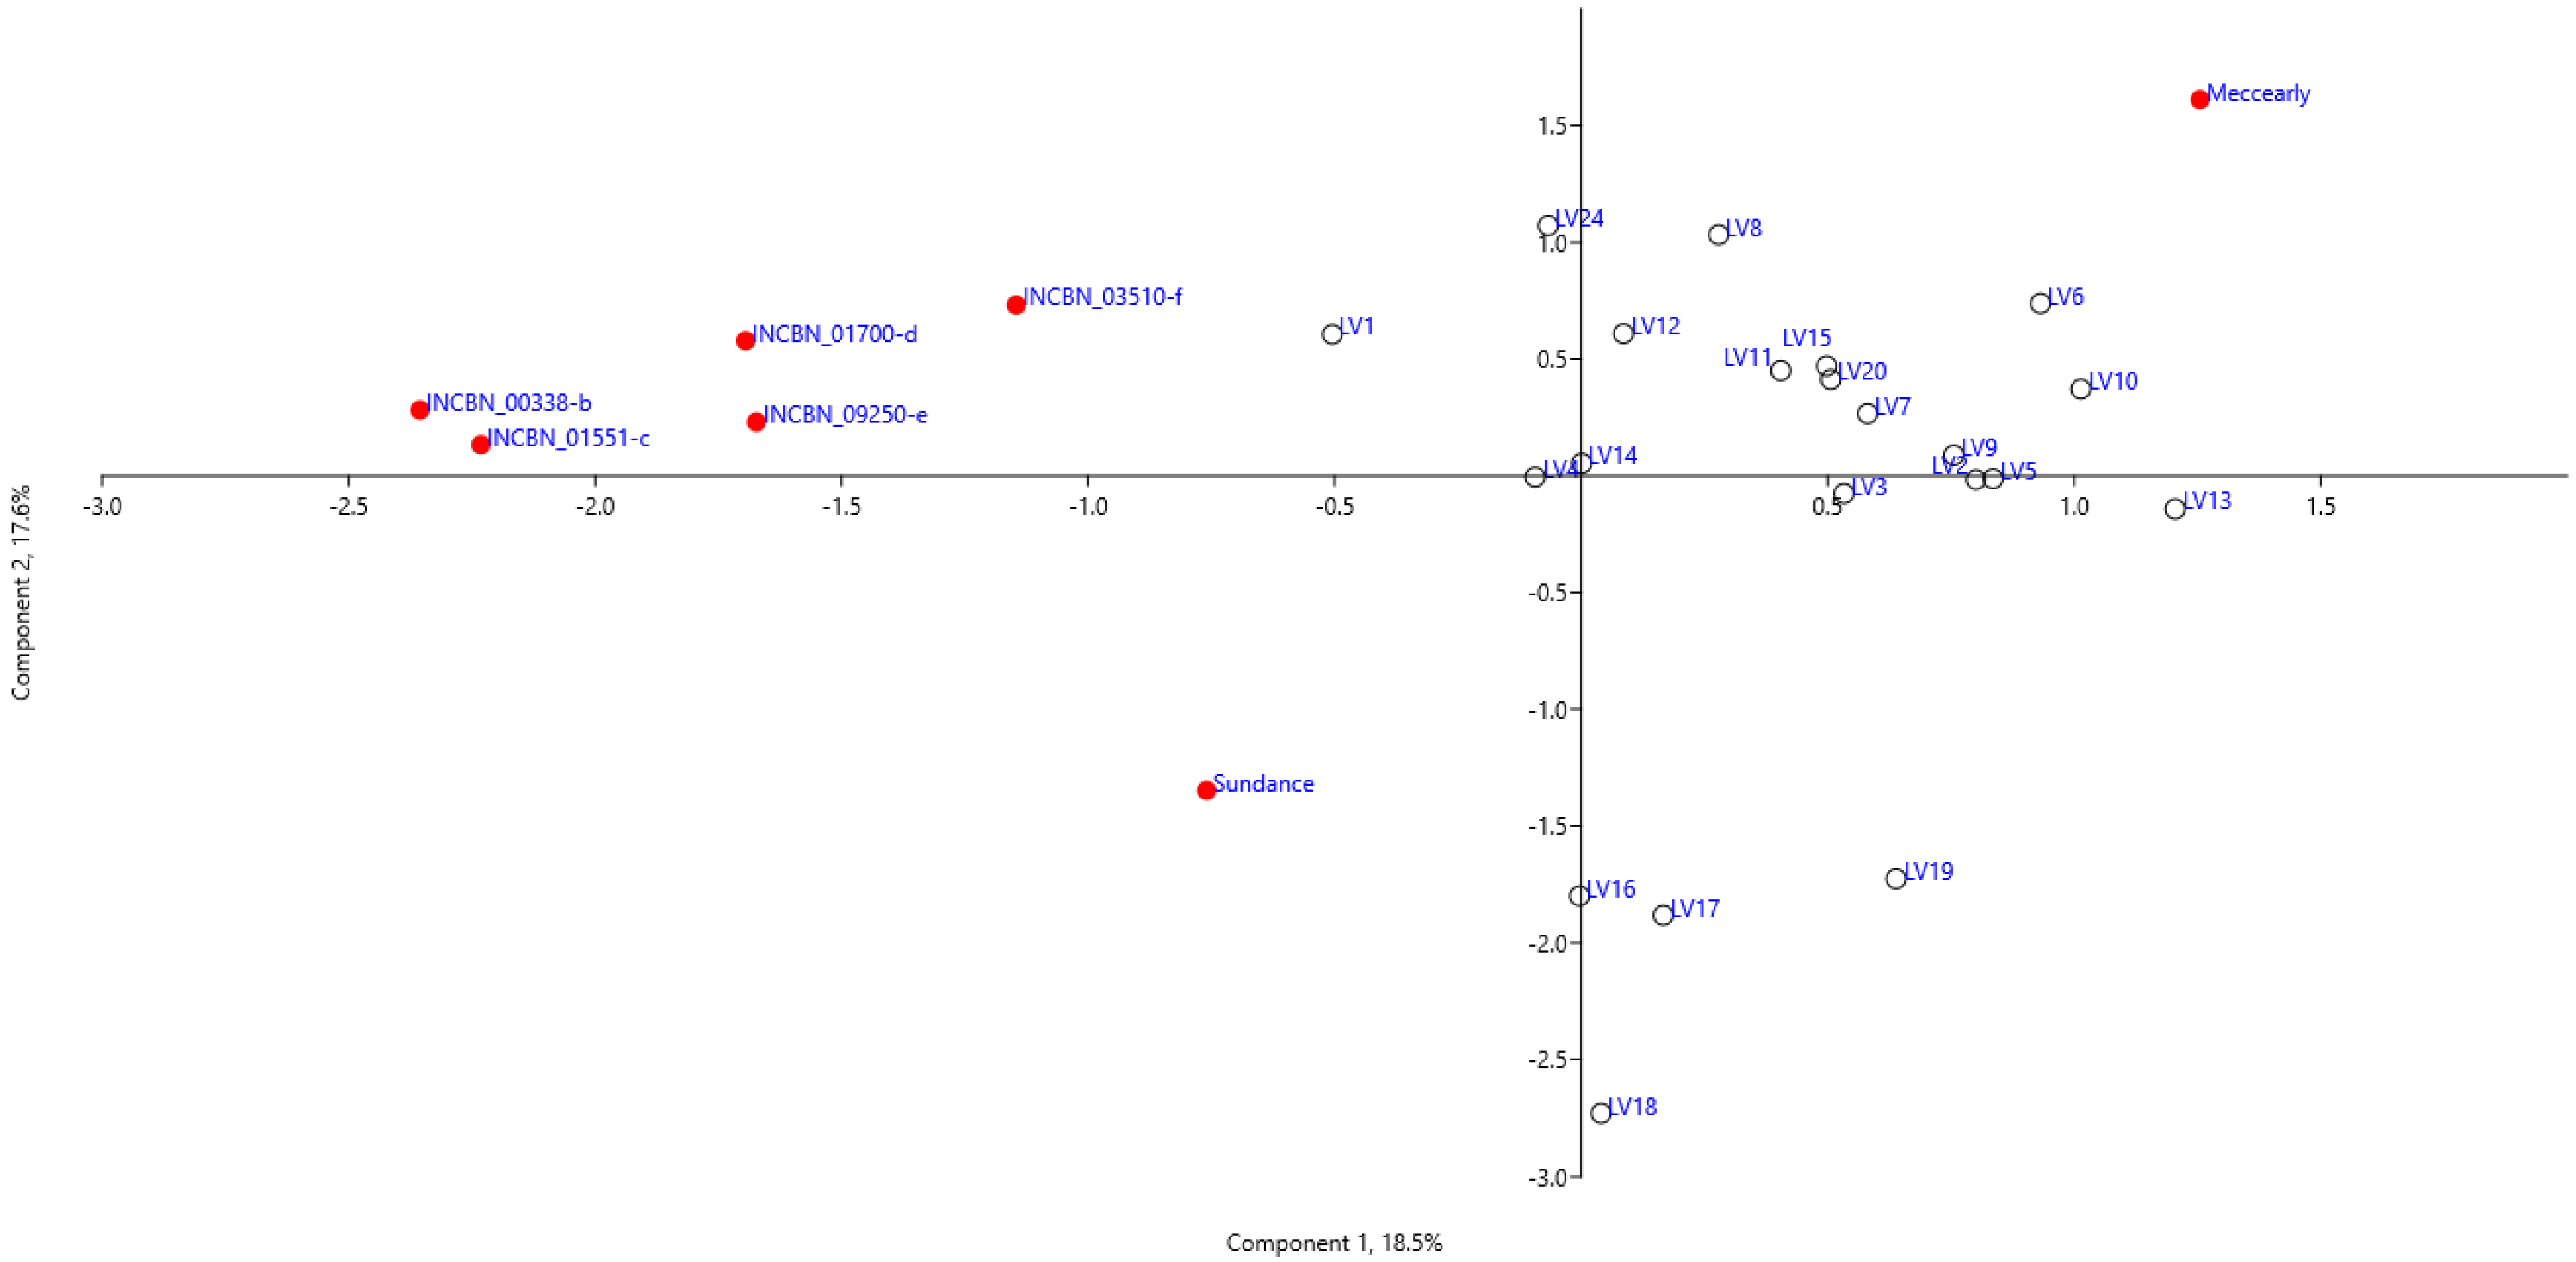
Figure 2 displays the ordination of common bean genotypes based on the first two principal components. The PCA sample distribution reveals three groups and two outlier genotypes, ‘Meccearly’ and ‘Sundance’. The cultivar ‘Meccearly’ is notable for its significantly larger bean size and mass compared to all other genotypes, with an average bean volume of 676.88 mm3 (versus 340.54 mm3 for all tested samples) and an average 100-bean mass of 87.28 g (versus 46.79 g for all tested samples). In contrast, the reference cultivar ‘Sundance’ is distinguished by its relatively smaller bean size, with an average bean volume of 126.38 mm3 and an average 100-bean mass of 17.41 g. The largest group of samples (17 genotypes) consists of germplasm of Latvian origin. Another group, comprising genotypes LV16, LV17, LV18, and LV19, which are also of Latvian origin, is characterised by a higher number of pods and growth habit rating but a lower 100-bean mass, bean volume, and bean length than the first group. A compact group of samples includes the reference genotypes from the INCREASE project (INCBN_00338-b, INCBN_01551-c, INCBN_01700-d, INCBN_03510-f, and INCBN_09250-e). These reference genotypes, as indicated by PC loadings (Table 2), differ from the Latvian-origin samples by having relatively smaller beans (indicated by bean height and width) and lower pod wall fibre ratings, but higher protein content in beans (% of dry matter) and higher fresh pod curvature ratings.
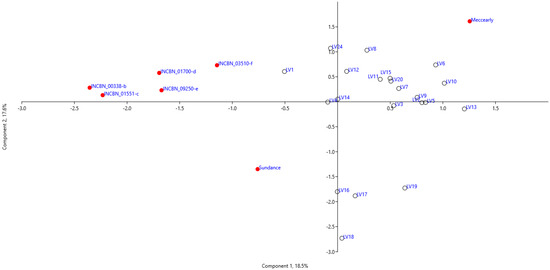
Figure 2.
Principal component analysis based on phenotypical traits of common bean (Phaseolus vulgaris L.) accessions evaluated at the Latvia University of Life Sciences and Technologies collection. Symbols used in the figure:  —reference common bean genotypes,
  —common bean genotypes of Latvian origin.
—reference common bean genotypes, —common bean genotypes of Latvian origin.
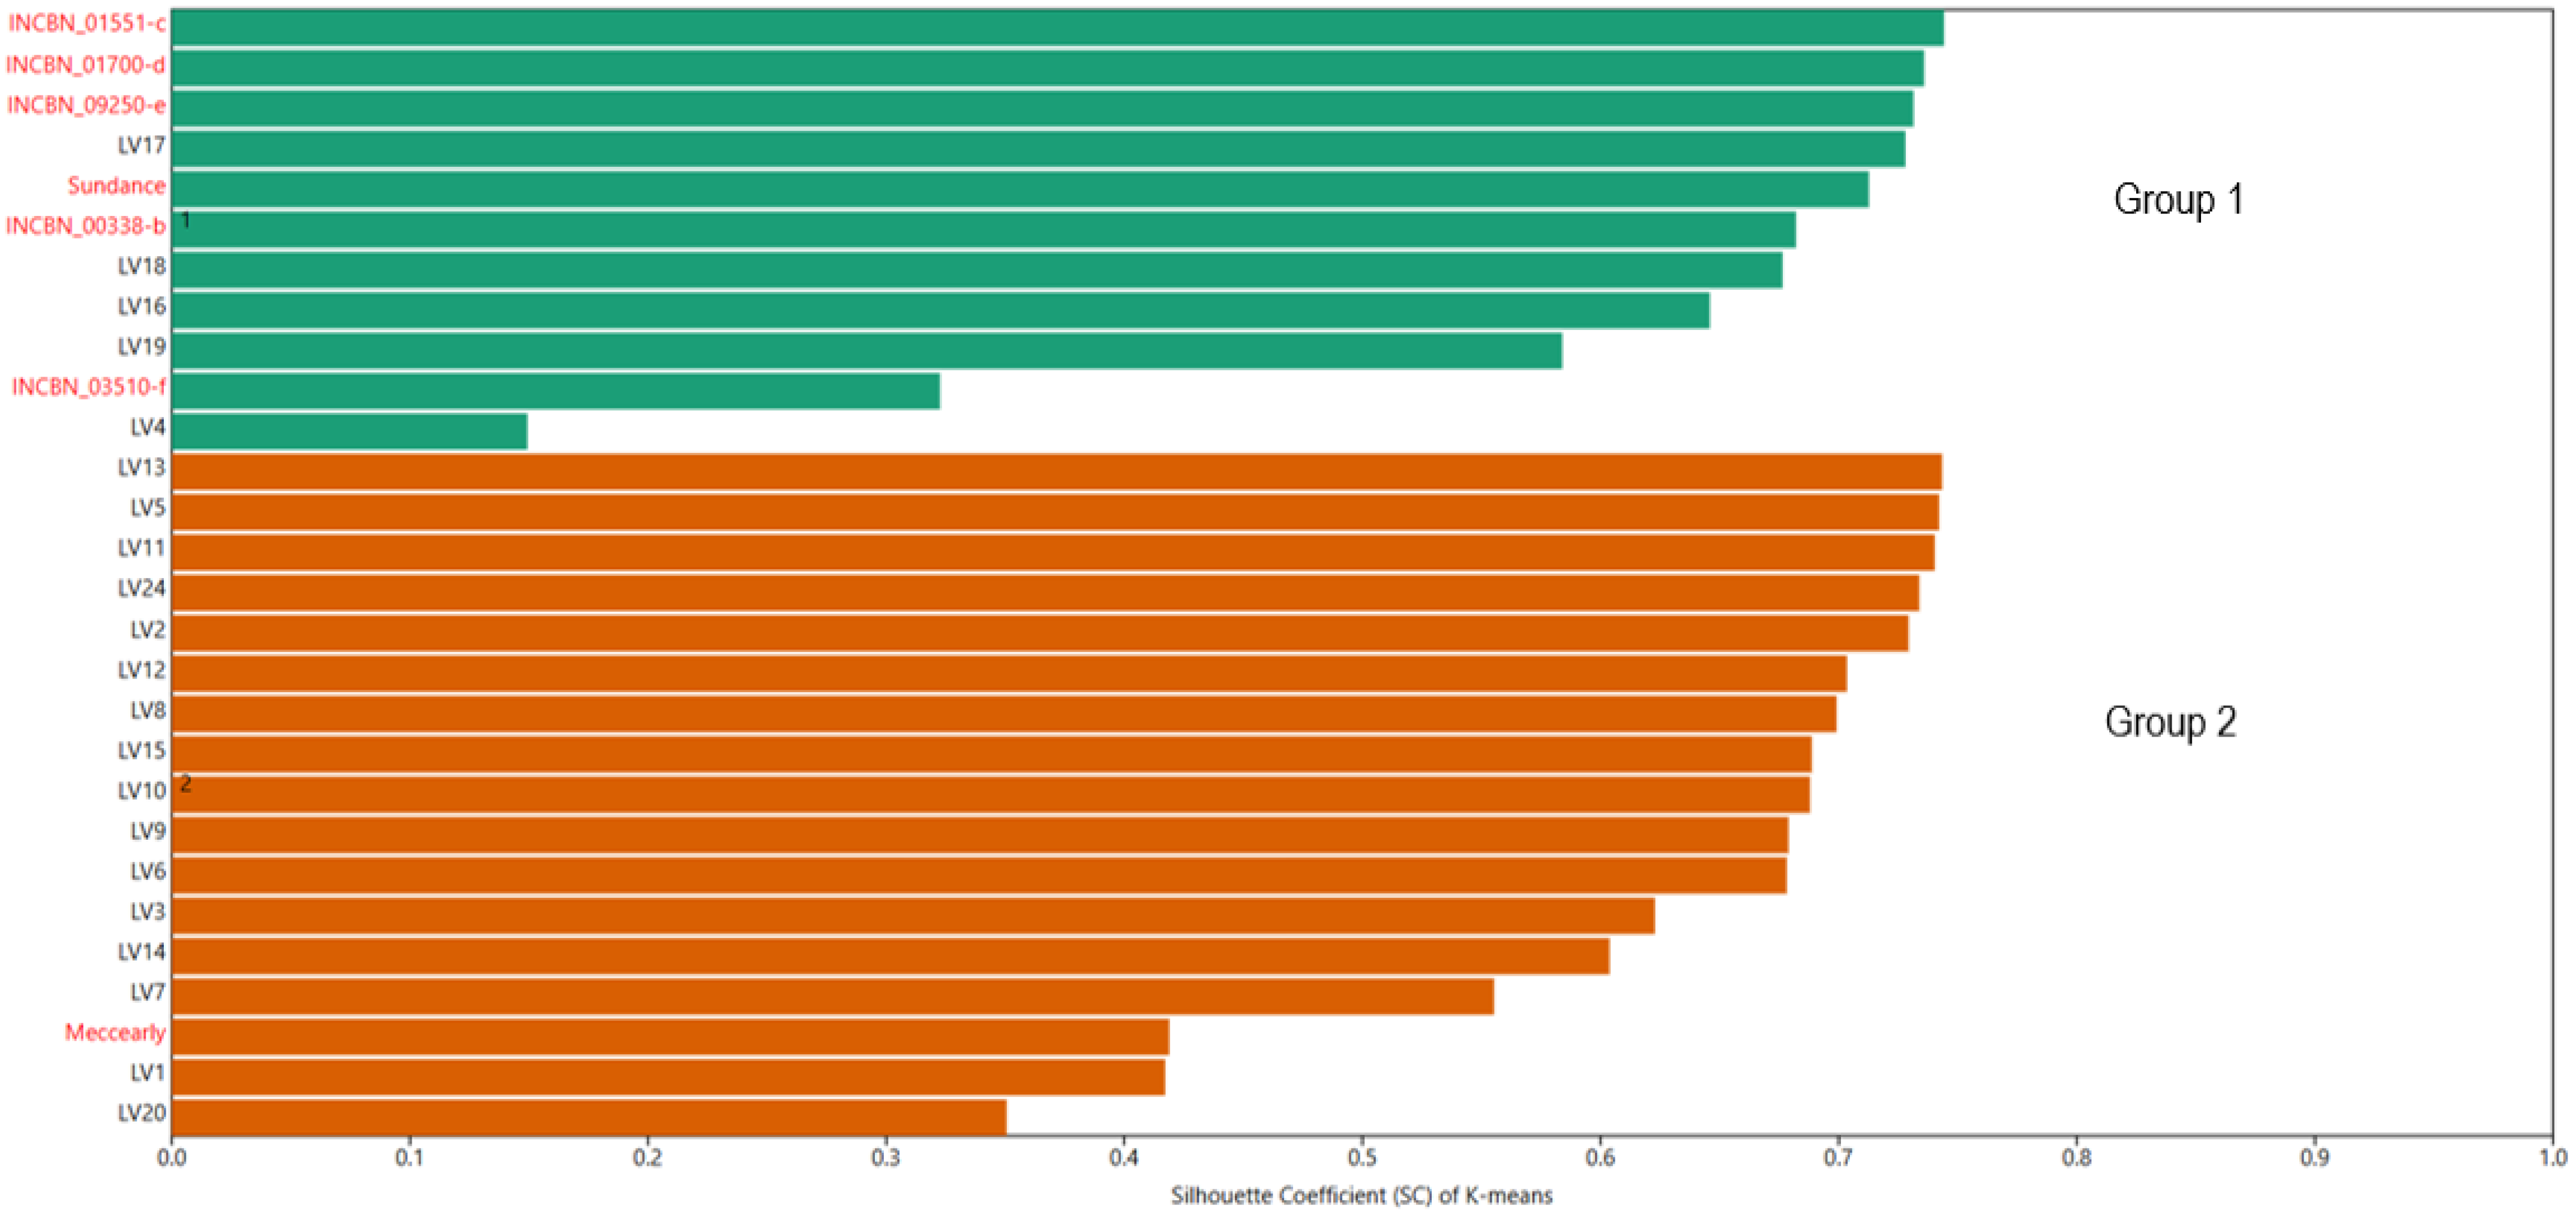
To determine the position of common bean germplasm of Latvian origin within the European gene pool, K-means clustering was utilised. This algorithm groups similar objects into a specified number of clusters. In this analysis, two conditional groups were defined: plant material of Latvian origin and reference genotypes representing the European gene pool. In the K-means clustering analysis, all reference varieties were grouped into Group 1, which included the INCREASE project genotypes INCBN_00338-b, INCBN_01551-c, INCBN_01700-d, INCBN_03510-f, and INCBN_09250-e, along with the reference varieties ‘Sundance’ and ‘Meccearly’. Additionally, five Latvian-origin genotypes—LV4, LV16, LV17, LV18, and LV19—were classified in this group (Figure 3). According to the ANOVA results (Table S6), statistically significant differences were observed between these two groups for 20 out of the 26 evaluated traits. No significant differences were found for traits such as protein content in beans, percentage of dry matter, hypocotyl pigmentation, leaf colour (anthocyanin), petiole/strings (anthocyanin), flower colour, and pod colour at maturity (dry).

Figure 3.
K-means-based grouping of 28 accessions of common beans (Phaseolus vulgaris L.) evaluated at the Latvia University of Life Sciences and Technologies collection. Reference common bean genotypes marked with names in red and common bean genotypes of Latvian origin—in black.
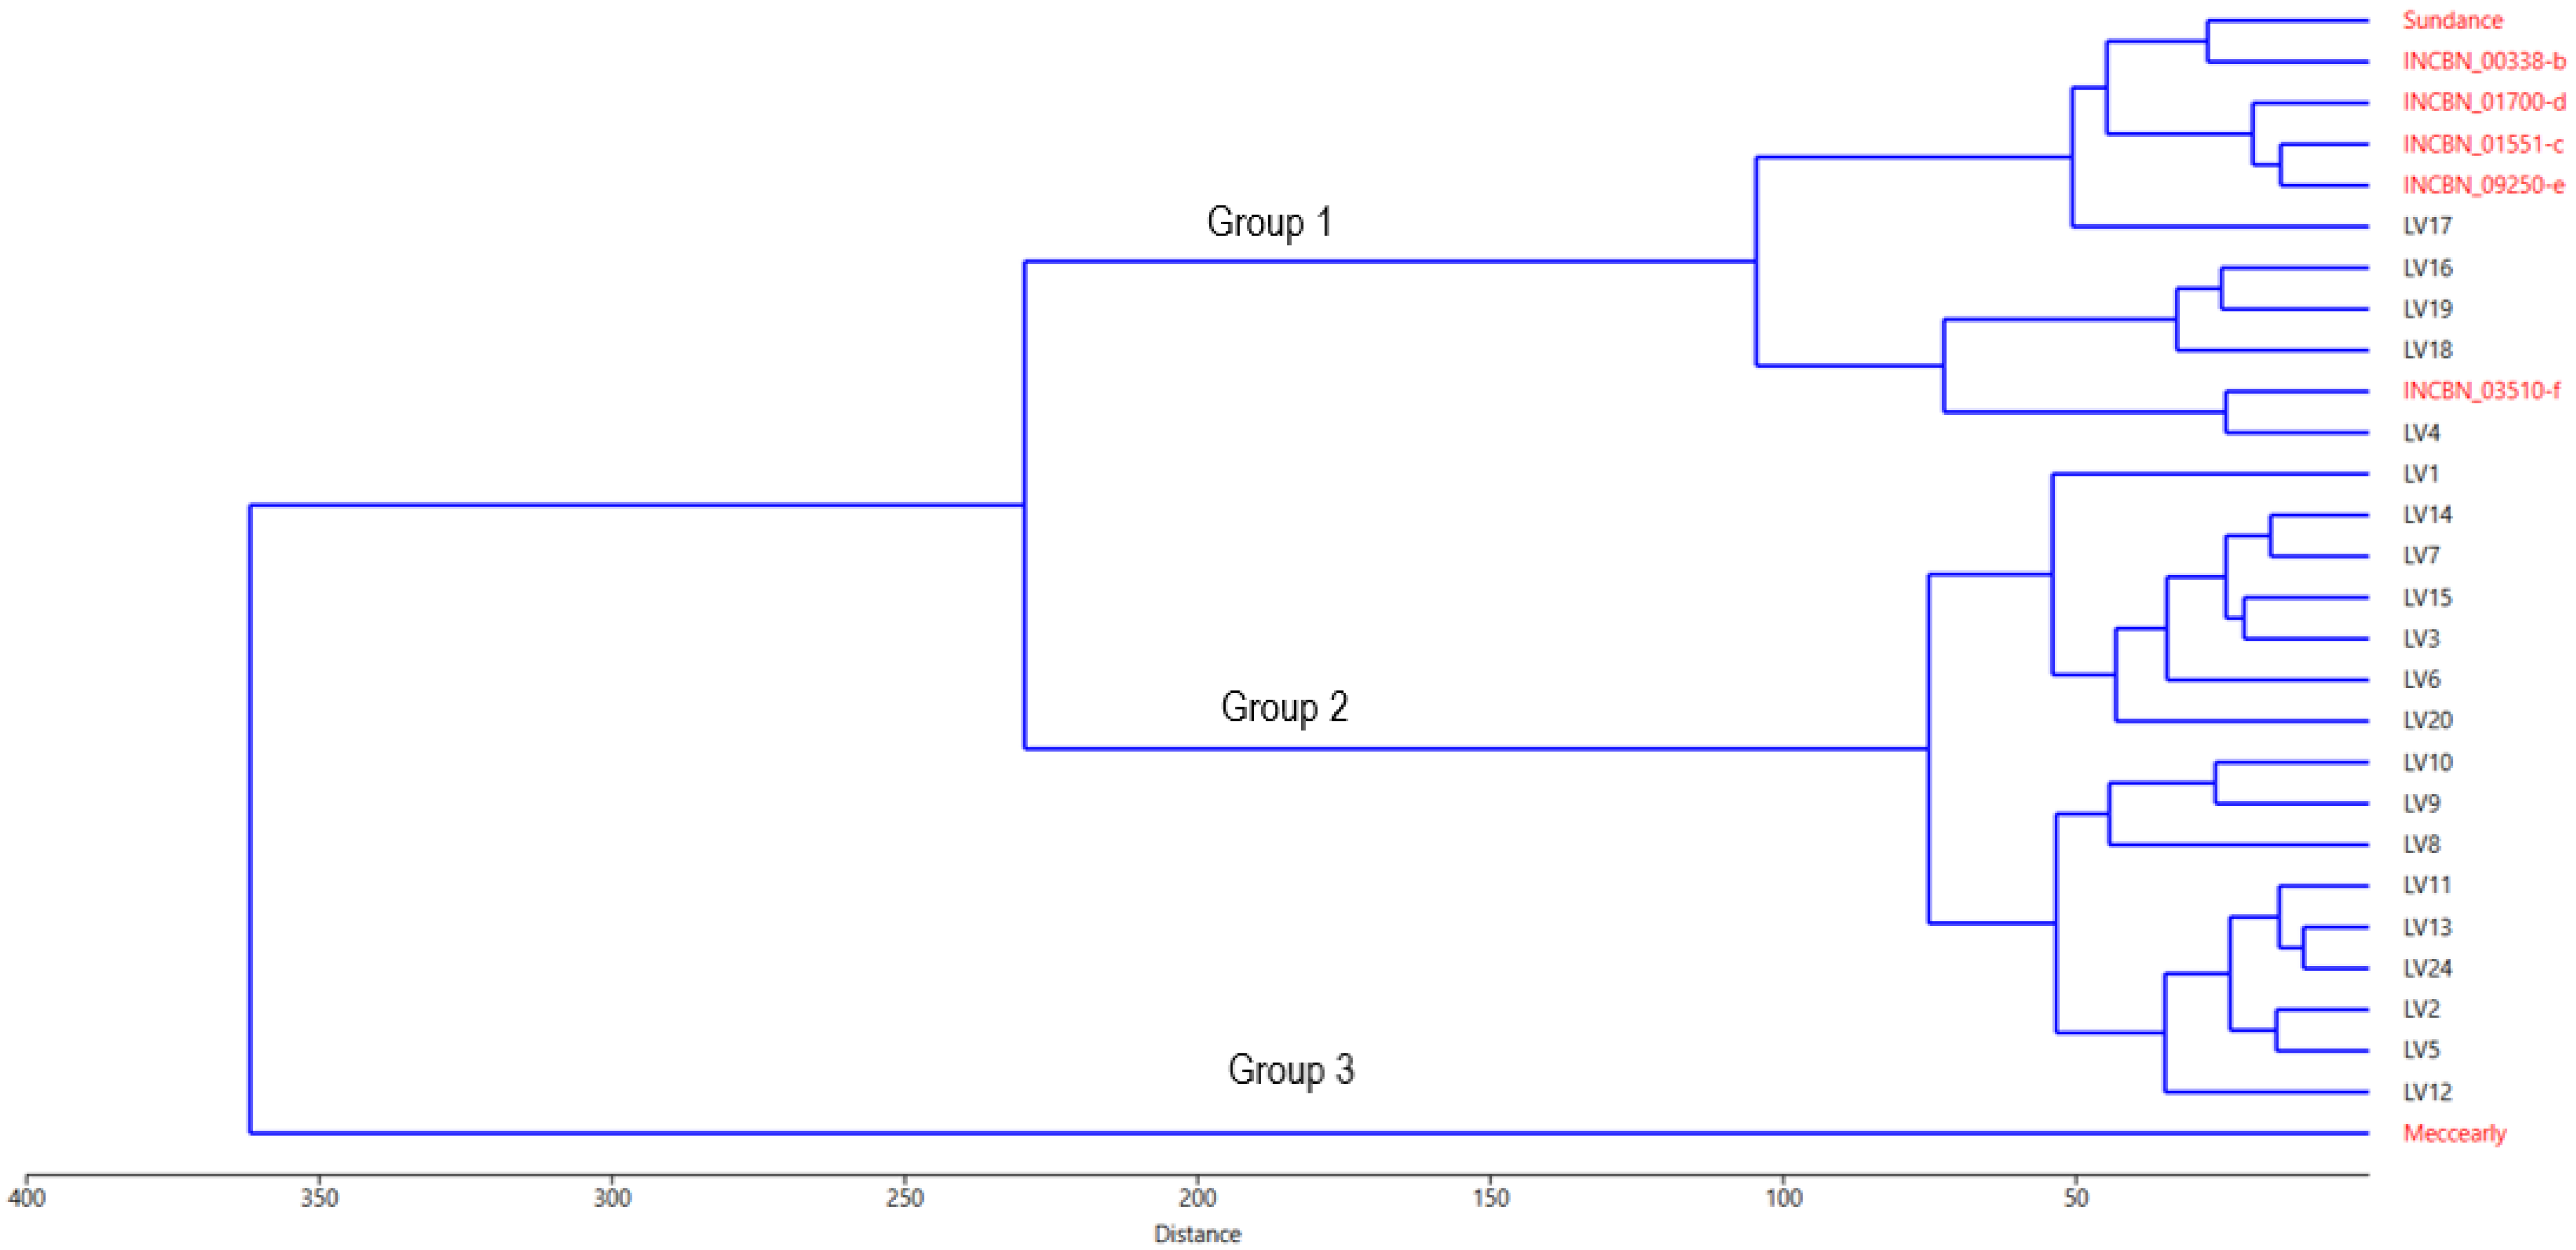
To further explore the internal structure of the common bean germplasm under study, a UPGMA clustering based on Euclidean distance was performed (Figure 4). Overall, the genotype distribution generated closely aligns with the PCA results depicted in Figure 2. The clustering coherence correlation for this analysis is 0.8553, indicating a high level of representativeness of the performed analysis in capturing the initial variability. Cluster analysis identified two groups of genotypes and the outlier cultivar ‘Meccearly’, which, as described in the PCA results, is characterised by significantly larger beans than all other genotypes in the study. The largest cluster, similar to the PCA results, consists of 16 samples of Latvian origin, revealing the internal similarities within this group and conditionally separating into two subgroups: (a) genotypes LV2, LV5, LV8, LV9, LV10, LV11, LV12, LV13, and LV24 and (b) genotypes LV1, LV3, LV6, LV7, LV14, LV15, and LV20. Unlike in the PCA, genotype LV4 is included in the second large group, which consists of Latvian-origin samples LV16, LV17, LV18, and LV19 (forming a subcluster) and the reference genotypes from the INCREASE project. Cluster analysis also revealed a close relationship between the Latvian genotype LV4 and the reference genotype INCBN_03510-f, a relationship that was not as pronounced in the PCA.
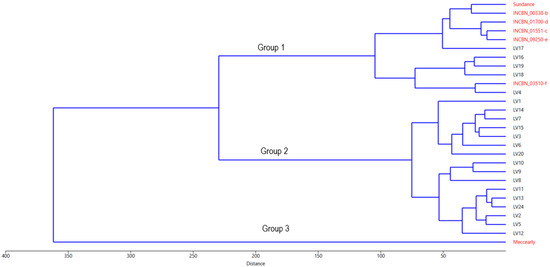
Figure 4.
Hierarchical analysis dendrogram obtained by group average method (UPGMA) based on phenotypical traits of common bean (Phaseolus vulgaris L.) accessions evaluated at the Latvia University of Life Sciences and Technologies collection. Reference common bean genotypes marked with names in red and common bean genotypes of Latvian origin—in black.
According to the ANOVA results (Table S7), the multiple comparisons and least significant difference (LSD and Bonferroni) tests revealed statistically significant differences (p-value < 0.05) between the identified clusters (Groups 1, 2, and 3, Figure 4) in 17 of the 26 studied traits. These traits include bean length (significant differences between Groups 1 and 3, 2 and 3), bean width, bean height, bean volume, 100-bean mass (differences among all groups), number of pods, leaf colour: anthocyanin, growth habit, petioles/strings: anthocyanin, flower colour, fresh pod cross-section, fresh pod curvature, determination, pod wall fibre, seed coat pattern, seed coat secondary colours (differences between Groups 2 and 3), and pod colour at maturity (differences between Groups 1 and 2). The most substantial differences were observed between sample clusters 2 and 3, affecting 13 traits. Group 1, represented only by the cultivar ‘Meccearly’, significantly differs from Group 2 for traits such as bean width, bean height, bean volume, and 100-bean mass. In contrast, differences in the other traits are not significant. This finding aligns with the PCA results and is confirmed by the K-means analysis (Figure 4), which identified two sample groups based on the germplasm of Latvian origin and the reference common bean genotypes. This clustering also confirmed that genotype LV4 belongs to UPGMA Group 3.
4. Discussion
Common beans (Phaseolus vulgaris) are a relatively recent addition to European agriculture, having been introduced in the 16th century [24]. Their introduction in Latvia occurred even later and is not well documented; there are no reliable historical records. Initially, they were not widely accepted, primarily due to their taste, which contrasted with that of the native faba bean (Vicia faba L.), a staple in the local diet [25]. Consequently, the integration of the local germplasm into the broader European common bean gene pool is particularly significant for understanding and advancing this crop [12]. Identifying traits essential for adapting to local conditions, as opposed to those found in beans from other regions, is crucial.
The tested local common bean genotypes are notable for their high variability, particularly in traits such as bean mass in pods (g), flower colour, seed coat pattern, seed coat ground colours, and seed coat secondary colour. On the other hand, for the reference genotypes, the highest variability was protein content in beans (% of dry matter), number of pods, seed coat ground colour, and seed coat secondary colour (Table 2). Thus, the study revealed that Latvian common bean genotypes exhibit a greater diversity in the colour composition of beans (Latvian beans have a more complex and varied colour speckle) compared to findings from other studies [26]. Similarly, a high colour diversity of beans was found when evaluating landraces collected in Serbia [17]. The high variability in seed coat patterns and colours observed among Latvian common bean landraces carries significant practical implications, particularly in the context of consumer preferences, market differentiation, and value-added product development. In many local and niche markets, visual appeal is a key factor influencing consumer choice, and distinctive seed appearances—ranging from mottled, speckled, and striped to solid hues—can create strong market identities for specific landraces. This diversity enables producers to cater to diverse aesthetic and culinary preferences, potentially commanding premium prices for unique or traditional varieties.
Moreover, such variation supports branding efforts that emphasise heritage, locality, and authenticity—qualities increasingly valued in gourmet, organic, and farm-to-table markets. The diversity in seed coat traits also opens opportunities for product segmentation, where different varieties can be marketed not only by taste or cooking characteristics but also by appearance, thus enhancing their overall marketability. On a broader scale, maintaining this diversity contributes to the cultural and gastronomic heritage of the region, further supporting agrobiodiversity conservation through economic incentives.
The 26 phenotypic traits utilised allowed a clear differentiation of all the studied common bean genotypes. Furthermore, the analysis effectively separated the reference genotypes—provided by the project “Intelligent Collections of Food Legumes Genetic Resources for European Agrofood Systems” (INCREASE): INCBN_00338-b, INCBN_01551-c, INCBN_01700-d, INCBN_03510-f, INCBN_09250-e, as well as cvs. ‘Meccearly’ and ‘Sundance’) [27]—from the Latvian local germplasm (see Figure 2 and Figure 3). In the cluster analysis (Figure 3), however, genotypes LV4, LV16, LV17, LV18, and LV19 were exceptions, suggesting that they may belong to a different introduction event—likely a more recent one—since their characteristics are more closely aligned with those of the reference genotypes. Although some evaluation bias may result from the limited number of genotypes and the unequal size of the comparison groups, the experiment’s design—spanning multiple locations and controlled agroecological conditions—helps to offset these limitations and ensures statistically meaningful results. The chosen methodology successfully met the research objective—to morphologically characterize the common bean germplasm collected and cultivated in Latvia and identify the most promising material for further crop improvement. However, a more in-depth evaluation of traits relevant to selection and breeding will require additional experiments with increased replication across sample sizes, growing seasons, and agrotechnical conditions. This will help to better assess the current adaptation level of the germplasm and its potential under changing climate conditions.
Based on the common beans’ response to moisture deficit, characteristics such as the number of pods, number of seeds per plant, and the weight of 100 seeds were found to decrease accordingly [28]. These traits were also significant in the sample grouping of this study (Table 2), contributing to the largest PC1 loads and highlighting the superior adaptability of local genotypes, which leads to higher yields. The only exception was the reference cv. ‘Meccearly’, which exhibited the largest seed size among all the genotypes studied (Figure 2). Considering the climate differences, the study was able to assess the reference genotype of common beans regarding its adaptability to Latvian conditions and to compare it with the local genotype under these circumstances. Traits that characterise bean seeds in genotype groupings have also been identified in other studies [29,30,31], and these patterns can be observed regardless of the sample size evaluated. Common bean seed characteristics (bean length (mm), bean width (mm), bean height (mm), bean volume (mm3), and 100-bean mass (g)) also show a close correlation. Close correlations can also be observed for such traits as number of pods, pod mass (g), bean mass in pods (g), growth habit, and determination (TA 1).
Multiple studies [15,31] found that the growth habit of common beans significantly affects genotype classification. In this study, this trait also played a substantial role in grouping, as evidenced by the high value of the PC1 load (Table 2). However, the variability of this trait is relatively low (Table 1), suggesting that the growth habit is specific to certain sample groups.
The phenotypic assessment of the Latvian landraces and reference common bean genotypes showed the diversity of the plant material, especially in terms of traits important for adaptation. This indicates the better adaptability of the local material, as well as the diversity that can be preserved in the further use of this crop. This assessment forms the basis for the development of a conservation strategy for Latvian local common bean germplasm and contributes to the European joint assessment within the project “Intelligent Collections of Food Legumes Genetic Resources for European Agrofood Systems” (INCREASE). The application of molecular markers, particularly through broad international screening, could provide a more accurate placement of Latvian common bean genotypes within the European germplasm and offer insights into their potential origins.
5. Conclusions
Throughout its historical development, Latvia has developed a gene pool that has adapted to local dietary preferences and environmental conditions, resulting in phenotypic characteristics that differ from those found in other European regions. This underscores the significance of the plant material under study and highlights the need for conservation through the development of a suitable strategy.
The Latvian common bean germplasm exhibits considerable phenotypical variability, demonstrating the greater adaptability and suitability of the local germplasm, as evidenced by higher values of agronomic characteristics than the reference genotypes.
The local common bean genotypes from Latvia included in this study serve as a foundation for supporting local cultivation and breeding efforts, acting as sources of traits that are well suited to local conditions and dietary needs.
Local varieties (landraces) hold valuable genetic traits, offering adaptability to specific environments, resistance to pests and diseases, and the potential to improve nutritional quality. They are crucial for in situ conservation and targeted breeding efforts. Promoting their use supports sustainable agriculture, strengthens climate resilience, and enhances food security.
The preservation of these landraces is largely due to the traditional knowledge, cultural heritage, and dedicated efforts of local communities. Over generations, they have carefully selected, cultivated, and maintained varieties based on traits such as taste, resilience, and adaptability. Their practices have shaped a valuable genetic resource that underpins future agricultural development. Acknowledging their role is vital for safeguarding biodiversity and supporting inclusive, community-driven strategies for crop enhancement.
Further research on the Latvian common bean germplasm should incorporate molecular marker analysis to minimise environmental and sample size influences. This approach will also generate datasets that facilitate the inclusion of Latvian material in international evaluations, helping to clarify its potential origin and genetic relatedness to germplasm from other regions.
Supplementary Materials
The following supporting information can be downloaded at https://www.mdpi.com/article/10.3390/ijpb16020059/s1, Table S1: Description of common bean (Phaseolus vulgaris L.) plant material at the Latvia University of Life Sciences and Technologies collection; Table S2: One-way ANOVA test showing the variation between 28 common bean (Phaseolus vulgaris L.) genotypes analysed at the Latvia University of Life Sciences and Technologies collection; Table S3: One-way ANOVA test showing the variation between evaluation experiment repeats of common bean (Phaseolus vulgaris L.) genotypes analysed at the Latvia University of Life Sciences and Technologies collection; Table S4: One-way ANOVA test showing the variation between evaluation experiment locations of common bean (Phaseolus vulgaris L.) genotypes analysed at the Latvia University of Life Sciences and Technologies collection; Table S5: One-way ANOVA test showing the variation between two common bean (Phaseolus vulgaris L.) genotype groups (Latvian origin and reference genotypes) analysed at the Latvia University of Life Sciences and Technologies collection; Table S6: One-way ANOVA test showing the variation between common bean (Phaseolus vulgaris L.) genotype groups, discovered by cluster analysis at the Latvia University of Life Sciences and Technologies collection; Table S7: One-way ANOVA test showing the variation between common bean (Phaseolus vulgaris L.) genotype groups, discovered by K-means analysis at the Latvia University of Life Sciences and Technologies collection.
Author Contributions
Conceptualisation, I.A. and G.L.; methodology, I.A. and L.D.; software, G.L.; formal analysis, G.L.; investigation, S.J., L.D., T.H., D.U. and L.Z.; resources, L.D.; data curation, L.D., I.A. and G.L.; writing—original draft preparation, S.J. and G.L.; writing—review and editing, G.L. and I.A.; visualisation, G.L. and L.D.; supervision, I.A.; project administration, I.A.; funding acquisition, I.A. All authors have read and agreed to the published version of the manuscript.
Funding
This research was funded by the Latvia Ministry of Agriculture, grant number S475.
Data Availability Statement
The raw datasets generated and analysed during the current study are available from the corresponding author upon reasonable request.
Acknowledgments
Common bean reference genotypes required for the research were provided by the group of the “Intelligent Collections of Food Legumes Genetic Resources for European Agrofood Systems” project (INCREASE), Programme: Horizon2020-SFS-2019-2, Grant number 862862.
Conflicts of Interest
The authors declare no conflicts of interest.
References
- Delgado-Salinas, A.; Bibler, R.; Lavin, M. Phylogeny of the Genus Phaseolus (Leguminosae): A Recent Diversification in an Ancient Landscape. Syst. Bot. 2006, 31, 779–791. [Google Scholar] [CrossRef]
- De Ron, A.M.; González, A.M.; Paula Rodiño, A.; Santalla, M.; Godoy, L.; Papa, R. History of the Common Bean Crop: Its Evolution Beyond Its Areas of Origin and Domestication. Arbor 2016, 192, a317. [Google Scholar] [CrossRef]
- Celmeli, T.; Sari, H.; Canci, H.; Sari, D.; Adak, A.; Eker, T.; Toker, C. The Nutritional Content of Common Bean (Phaseolus vulgaris L.) Landraces in Comparison to Modern Varieties. Agronomy 2018, 8, 166. [Google Scholar] [CrossRef]
- Statistics|FAO|Food and Agriculture Organization of the United Nations. Statistics. Available online: http://www.fao.org/statistics/en (accessed on 9 October 2024).
- Ganesan, K.; Xu, B. Polyphenol-Rich Dry Common Beans (Phaseolus vulgaris L.) and Their Health Benefits. Int. J. Mol. Sci. 2017, 18, 2331. [Google Scholar] [CrossRef]
- Sgarbieri, V.C.; Whitaker, J.R. Physical, Chemical, and Nutritional Properties of Common Bean (Phaseolus) Proteins. In Advances in Food Research; Elsevier: Amsterdam, The Netherlands, 1982; Volume 28, pp. 93–166. [Google Scholar] [CrossRef]
- Hayat, I.; Ahmad, A.; Masud, T.; Ahmed, A.; Bashir, S. Nutritional and Health Perspectives of Beans (Phaseolus vulgaris L.): An Overview. Crit. Rev. Food Sci. Nutr. 2014, 54, 580–592. [Google Scholar] [CrossRef]
- Barampama, Z.; Simard, R.E. Nutrient Composition, Protein Quality and Antinutritional Factors of Some Varieties of Dry Beans (Phaseolus vulgaris) Grown in Burundi. Food Chem. 1993, 47, 159–167. [Google Scholar] [CrossRef]
- Bernardi, C.; Cappellucci, G.; Baini, G.; Aloisi, A.M.; Finetti, F.; Trabalzini, L. Potential Human Health Benefits of Phaseolus vulgaris L. var Venanzio: Effects on Cancer Cell Growth and Inflammation. Nutrients 2024, 16, 2534. [Google Scholar] [CrossRef] [PubMed]
- Stoody, E.E.; Obbagy, J.; Pannucci, T.R.; Fu, S.L.; Rahavi, E.; Altman, J.; Adler, M.; Brown, C.; Scanlon, K.S.; de Jesus, J.; et al. Dietary Guidelines for Americans, 2020–2025, 9th ed.; U.S. Government Printing Office: Washington, DC, USA, 2020; 151p.
- Uebersax, M.A.; Cichy, K.A.; Gomez, F.E.; Porch, T.G.; Heitholt, J.; Osorno, J.M.; Kamfwa, K.; Snapp, S.S.; Bales, S. Dry Beans (Phaseolus vulgaris L.) as a Vital Component of Sustainable Agriculture and Food Security—A Review. Legume Sci. 2023, 5, e155. [Google Scholar] [CrossRef]
- Caproni, L.; Raggi, L.; Ceccarelli, S.; Negri, V.; Carboni, A. In-Depth Characterisation of Common Bean Diversity Discloses Its Breeding Potential for Sustainable Agriculture. Sustainability 2019, 11, 5443. [Google Scholar] [CrossRef]
- Foschiani, A.; Miceli, F.; Vischi, M. Assessing Diversity in Common Bean (Phaseolus vulgaris L.) Accessions at Phenotype and Molecular Level: A Preliminary Approach. Genet. Resour. Crop Evol. 2009, 56, 445–453. [Google Scholar] [CrossRef]
- García-Fernández, C.; Jurado, M.; Campa, A.; Brezeanu, C.; Geffroy, V.; Bitocchi, E.; Papa, R.; Ferreira, J.J. A Core Set of Snap Bean Genotypes Established by Phenotyping a Large Panel Collected in Europe. Plants 2022, 11, 577. [Google Scholar] [CrossRef] [PubMed]
- Long, J.; Zhang, J.; Zhang, X.; Wu, J.; Chen, H.; Wang, P.; Wang, Q.; Du, C. Genetic Diversity of Common Bean (Phaseolus vulgaris L.) Germplasm Resources in Chongqing, Evidenced by Morphological Characterization. Front. Genet. 2020, 11, 697. [Google Scholar] [CrossRef] [PubMed]
- Nogueira, A.F.; Moda-Cirino, V.; Delfini, J.; Brandão, L.A.; Mian, S.; Constantino, L.V.; Zeffa, D.M.; Dos Santos Neto, J.; Azeredo Gonçalves, L.S. Morpho-Agronomic, Biochemical and Molecular Analysis of Genetic Diversity in the Mesoamerican Common Bean Panel. PLoS ONE 2021, 16, e0249858. [Google Scholar] [CrossRef] [PubMed]
- Savić, A.; Zorić, M.; Brdar-Jokanović, M.; Zdravković, M.; Dimitrijević, M.; Petrović, S.; Živanov, D.; Vasić, M. Origin and Diversity Study of Local Common Bean (Phaseolus vulgaris L.) Germplasm from Serbia: Phaseolin and Phenotyping Approach. Genet. Resour. Crop Evol. 2020, 67, 2195–2212. [Google Scholar] [CrossRef]
- Baumane, M. Vegetable Cultivation I. Cultivation of Vegetables in the Open Field; Zvaigzne: Riga, Latvia, 1973; 313p. [Google Scholar]
- Centrālā Statistikas Pārvalde. Available online: https://www.csp.gov.lv/en (accessed on 8 October 2024).
- Cortinovis, G.; Oppermann, M.; Neumann, K.; Graner, A.; Gioia, T.; Marsella, M.; Alseekh, S.; Fernie, A.R.; Papa, R.; Bellucci, E.; et al. Towards the Development, Maintenance, and Standardized Phenotypic Characterization of Single-Seed-Descent Genetic Resources for Common Bean. Curr. Protoc. 2021, 1, e133. [Google Scholar] [CrossRef]
- LVS EN ISO 5983-2:2009; Animal feeding stuffs—Determination of nitrogen content and calculation of crude protein content—art 2: Block digestion and steam distillation method (ISO 5983-2:2009). Latvijas standarts: Rīga, Latvia, 2009.
- Pfaff, B. PSPP Users’ Guide. GNU PSPP Statistical Analysis Software. Release 2.0.1.; Free Software Foundation, Inc.: Boston, MA, USA, 2023; 309p. [Google Scholar]
- Hammer, Ø.; Harper, D.A.T.; Ryan, P.D. PAST: Paleontological Statistics Software Package for Education and Data Analysis. Palaeontol. Electron. 2001, 4, 9. [Google Scholar]
- Angioi, S.A.; Rau, D.; Attene, G.; Nanni, L.; Bellucci, E.; Logozzo, G.; Negri, V.; Spagnoletti Zeuli, P.L.; Papa, R. Beans in Europe: Origin and Structure of the European Landraces of Phaseolus vulgaris L. Theor. Appl. Genet. 2010, 121, 829–843. [Google Scholar] [CrossRef]
- Gailītis, P. Mass Production of Vegetables; Latvijas Valsts izdevniecība: Riga, Latvia, 1946; 368p. [Google Scholar]
- Bellucci, E.; Benazzo, A.; Xu, C.; Bitocchi, E.; Rodriguez, M.; Alseekh, S.; Di Vittori, V.; Gioia, T.; Neumann, K.; Cortinovis, G.; et al. Selection and Adaptive Introgression Guided the Complex Evolutionary History of the European Common Bean. Nat. Commun. 2023, 14, 1908. [Google Scholar] [CrossRef]
- Bellucci, E.; Mario Aguilar, O.; Alseekh, S.; Bett, K.; Brezeanu, C.; Cook, D.; De La Rosa, L.; Delledonne, M.; Dostatny, D.F.; Ferreira, J.J.; et al. The INCREASE Project: Intelligent Collections of Food-legume Genetic Resources for European Agrofood Systems. Plant J. 2021, 108, 646–660. [Google Scholar] [CrossRef]
- Papathanasiou, F.; Ninou, E.; Mylonas, I.; Baxevanos, D.; Papadopoulou, F.; Avdikos, I.; Sistanis, I.; Koskosidis, A.; Vlachostergios, D.N.; Stefanou, S.; et al. The Evaluation of Common Bean (Phaseolus vulgaris L.) Genotypes under Water Stress Based on Physiological and Agronomic Parameters. Plants 2022, 11, 2432. [Google Scholar] [CrossRef]
- Vidak, M.; Šatović, Z.; Liber, Z.; Grdiša, M.; Gunjača, J.; Kilian, A.; Carović-Stanko, K. Assessment of the Origin and Diversity of Croatian Common Bean Germplasm Using Phaseolin Type, SSR and SNP Markers and Morphological Traits. Plants 2021, 10, 665. [Google Scholar] [CrossRef] [PubMed]
- Boros, L.; Wawer, A.; Borucka, K. Morphological, Phenological and Agronomical Characterisation of Variability Among Common Bean (Phaseolus vulgaris L.) Local Populations from The National Centre for Plant Genetic Resources: Polish Genebank. J. Hortic. Res. 2014, 22, 123–130. [Google Scholar] [CrossRef]
- Nawaz, I.; Zeb, T.; Zeb, B.S.; Sherani, J. Evaluation of Common Beans (Phaseolus vulgaris L.) Land Races Based on Qualitative Traits Derived from Himalayan, Andean and Mesoamerican Regions. Sarhad J. Agric. 2021, 38, 275–286. [Google Scholar] [CrossRef]
Disclaimer/Publisher’s Note: The statements, opinions and data contained in all publications are solely those of the individual author(s) and contributor(s) and not of MDPI and/or the editor(s). MDPI and/or the editor(s) disclaim responsibility for any injury to people or property resulting from any ideas, methods, instructions or products referred to in the content. |
© 2025 by the authors. Licensee MDPI, Basel, Switzerland. This article is an open access article distributed under the terms and conditions of the Creative Commons Attribution (CC BY) license (https://creativecommons.org/licenses/by/4.0/).