1. Introduction
This paper is an extended version of the conference paper presented at the 38th International Electric Vehicle Symposium and Exhibition (EVS38) in Göteborg, Sweden, in June 2025 [
1].
1.1. Background
The electrification of transport is a crucial measure for reducing global greenhouse gas emissions, yet progress varies widely across vehicle classes. An example of this variation is represented by the case of Norway, where, despite achieving an 85% electric passenger car sales rate in 2024, the electrification of heavy-duty vehicles (HDVs) and trucks lags considerably, with only an 11% sales share for electric trucks and 23% for electric long-distance buses in the same year [
2]. Such contrast reveals the complexities of scaling sustainable solutions for commercial transport sectors.
Increasing regulatory pressure, particularly from governing bodies like the European Union, seeks to enforce stricter emission standards and potentially mandate minimum charging infrastructure availability for heavy-duty transport [
3,
4]. A major barrier to the widespread electrification of commercial HDVs is, in fact, the current inadequacy of charging infrastructure in delivering megawatt-scale power. Establishing such infrastructure necessitates a coordinated effort between charging point operators, distribution system operators and transport companies to ensure sufficient charging availability and power levels that meet operational requirements.
To facilitate the transition toward electric truck transport, it is fundamental to develop smart solutions for planning and operating the future charging infrastructure. In this context, understanding EV charging load profiles is essential for power system operators, infrastructure planners, and policymakers [
5,
6]. Accurate characterization of charging patterns provides valuable insights into peak demand periods, which, when combined with the knowledge of load distribution across the network and of potential grid bottlenecks, plays a central role in developing effective strategies for load management, grid reinforcement, and connection agreements [
7].
In the face of these challenges, researchers have employed various methodologies to gain insights into EV charging load profiles. However, as the widespread adoption of EVs, especially electrified HDVs, is relatively recent, the available real-world data for detailed characterization remains limited. Consequently, modeling techniques are essential to bridge these data gaps. A review by Amara-Ouali et al. [
8] categorizes electric vehicle (EV) load modeling techniques into three main groups: (1) Statistical characterization: Approaches based on statistical analysis of input and output variables, often leveraging travel survey data or other exogenous factors to infer charging behavior; (2) Stochastic processes: Methods that explicitly represent the probabilistic nature of EV travel and charging, including Markov Chains, Monte Carlo simulations, and Agent-Based Models (ABM); (3) Machine learning models: Data-driven techniques such as Artificial Neural Networks (ANN), clustering, and Support Vector Machines (SVM), which uncover charging patterns from large datasets of historical charging events. For a broader and comprehensive review of charging infrastructure planning approaches, from data acquisition to demand modeling, charging station (CS) sizing and grid impact analysis, readers are referred to [
9].
Modeling the load demand of electric long-haul trucks presents unique challenges compared to passenger vehicles. A significant barrier in contemporary research is the heavy reliance on exhaustive empirical records (e.g., high-resolution GPS trajectories or comprehensive logs of past charging events) for sizing and optimizing new charging stations. Such granular information is frequently location-specific and difficult to obtain, especially when the necessity concerns projecting future, unobserved scenarios or designing infrastructure from scratch. Because the adoption of electrified HDVs is still limited, comprehensive datasets required for statistical or machine learning approaches are not yet widely available. This highlights a pressing demand for versatile modeling techniques that can synthesize realistic traffic flows and charging loads even when baseline operational data is severely limited.
To address this data gap, methods based on stochastic processes offer a flexible framework for capturing the inherent variability in truck operations and charging behavior. Unlike passenger vehicles, where charging decisions are highly variable and individualistic, heavy-duty vehicle operations follow more structured and predictable patterns governed by logistical requirements and regulations, such as mandatory driver rest times. In this context, Agent-Based Modeling (ABM) has proven highly valuable for analyzing the dynamic variation of EV traffic [
10] and for simulating charging patterns by effectively incorporating the specific driving behaviors and operational constraints of vehicle users [
11,
12]. ABM allows for a bottom-up simulation where individual vehicle agents behave according to defined rules, schedules, and constraints (e.g., route, battery capacity, regulatory stops). By simulating the actions and interactions of numerous individual agents, ABM can accurately capture the emergent, system-level charging demand patterns arising from these operations. While charging load modeling for light-duty electric vehicles has been extensively explored, literature addressing HDVs is still developing. Early HDV modeling efforts predominantly focused on return-to-base logistics. For instance, Borlaug et al. [
13] utilized real-world telemetry to synthesize data-driven load profiles for commercial depot charging in the United States, concluding that scheduled, off-shift charging could often be managed without extensive grid upgrades. However, the dynamics of public, en-route fast charging introduce severe spatial and temporal stochasticity that depot models cannot capture. To address public charging demand, recent literature has shifted toward large-scale spatial planning, heavily utilizing synthetic transport flow databases. Speth et al. [
14] employed analytical models based on regional traffic flow volumes to estimate the required density of public fast-charging infrastructure across Germany. Building upon aggregate flow data, Menter et al. [
15] utilized macro-level ABM to dimension a demand-oriented nationwide network. Their approach models charging events triggered by agent route completion and maximum range limits, effectively mapping aggregate spatial energy demand across the country. Klausmann and Otteny [
16] developed a bottom-up probabilistic tool to evaluate the infrastructure sizing of specific truck charging parks at German highway rest areas. Their model calculates charging demand based primarily on the deterministic assignment of European statutory driving breaks (e.g., mandatory 45 min rests). In Northern Europe, Karlsson and Grauers [
17] utilized an ABM framework to simulate heavy-duty traffic along a Swedish highway corridor. Their research focused on market dynamics, highlighting how range limits and queue avoidance behaviors affect charger utilization and wait times across competing stations. However, while these models successfully capture macro-spatial network demands, their charging triggers are predominantly tied to route completion distances or European statutory driving limits (e.g., mandatory 45 min breaks). Similarly, Ingelstrom et al. [
18] integrated a MATSim transport model with a probabilistic load-flow simulation to quantify regional grid impacts in Southern Sweden, highlighting the volatility of uncoordinated public charging.
1.2. Contribution
In this paper, we propose a methodology employing agent-based modeling to determine the expected load profiles from long-haul electric trucks charging. The methodology is implemented in a Python software tool named ABChargingSim, built upon the MESA framework [
19]. Within this tool, vehicle agents operate using a Finite State Machine (FSM) architecture, transitioning between distinct operational states (e.g., driving, queueing, and charging) based on specific behavioral rules. The aggregate charging demand naturally emerges from the collective decisions made by these individual agents. Key inputs of the model include national statistics on electric truck adoption rates, regulatory frameworks (e.g., mandatory breaks), vehicle technical specifications, behavioral characterization of HDV drivers, and the location of charging infrastructure along major long-haul routes.
The key contributions of this work are threefold: (1) the development of the Mesa-based ABChargingSim framework, which moves beyond standard stochastic processes by integrating bottom-up modeling of the charging stations’ load demand, and state-of-charge-dependent intra-session charging curves; (2) the introduction of a dual-layer behavioral framework that captures both the cognitive drivers of charging (regulatory schedule-compliance vs. range anxiety) and a novel dwell-time logic that distinguishes between urgent mid-shift charging and long-dwell off-shift charging; (3) a comprehensive evaluation of fleet electrification scenarios that illustrates how driver behavior and battery charging management fundamentally shape expected load profiles. This approach provides valuable insights for infrastructure planning and grid capacity requirements as heavy-duty transport transitions toward electrification.
Table 1 contextualizes the ABChargingSim framework within the broader landscape of heavy-duty charging demand literature. While early methodologies relied heavily on statistical or data-driven extrapolations (e.g., Speth et al. in [
14]; Borlaug et al. in [
13]) or probabilistic assignments of statutory breaks (e.g., Klausmann and Otteny in [
16]), recent advancements have increasingly adopted Agent-Based Modeling (ABM). However, existing ABM approaches (even those applied within the Nordic context, e.g., [
17,
18]) predominantly target macro-spatial routing or queue optimization based on strict range limits.
This macro-level focus creates a critical research gap: by relying on deterministic routing triggers and ignoring the complexities behind variable charging decision triggers, existing models artificially synchronize charging events, potentially leading to an overestimation of localized peak demand. The proposed framework fills this gap by shifting the focus to micro-temporal node dynamics. By introducing stochastic behavioral triggers and explicitly modeling SOC-dependent power tapering, ABChargingSim captures the natural dispersion of heavy-duty charging sessions, providing Distribution Systems Operators (DSOs) and Charging Point Operators (CPOs) a more nuanced, scenario-driven assessment of specific nodal demand dynamics for charging infrastructure planning.
The remainder of this paper is structured as follows:
Section 2 describes the agent-based modeling methodology and the processing of the input data.
Section 3 details the case study design and scenario definitions.
Section 4 presents the simulation results, which are thoroughly discussed in detail in
Section 5. Finally,
Section 6 summarizes the main findings and outlines directions for future research.
2. Methodology
The methodology employs a bottom-up approach where individual vehicle movements and charging decisions are simulated to generate aggregate system metrics. By modeling the micro-decisions of hundreds of independent agents, we can observe emergent macro-phenomena such as peak load formation and queue dynamics.
2.1. Modeling Architecture
This work represents an evolution from previous works [
1,
11]. The whole software base has been migrated from the SOIL framework [
20] to Mesa [
19]. While SOIL provided a robust foundation for network-based ABM, Mesa has emerged as the de facto standard for Python-based ABM due to its modularity, active community support and continuous maintenance and development of the library.
The software, named ABChargingSim, is designed with a modular architecture. The input data, contained in an input YAML configuration file, allows us to define complex scenarios without needing to modify the underlying codebase. This separation of concerns between the model logic and the scenario configuration enhances the usability of the framework, making it accessible to a wider range of users, including those without extensive programming experience, and facilitates sensitivity analysis.
2.1.1. System Components
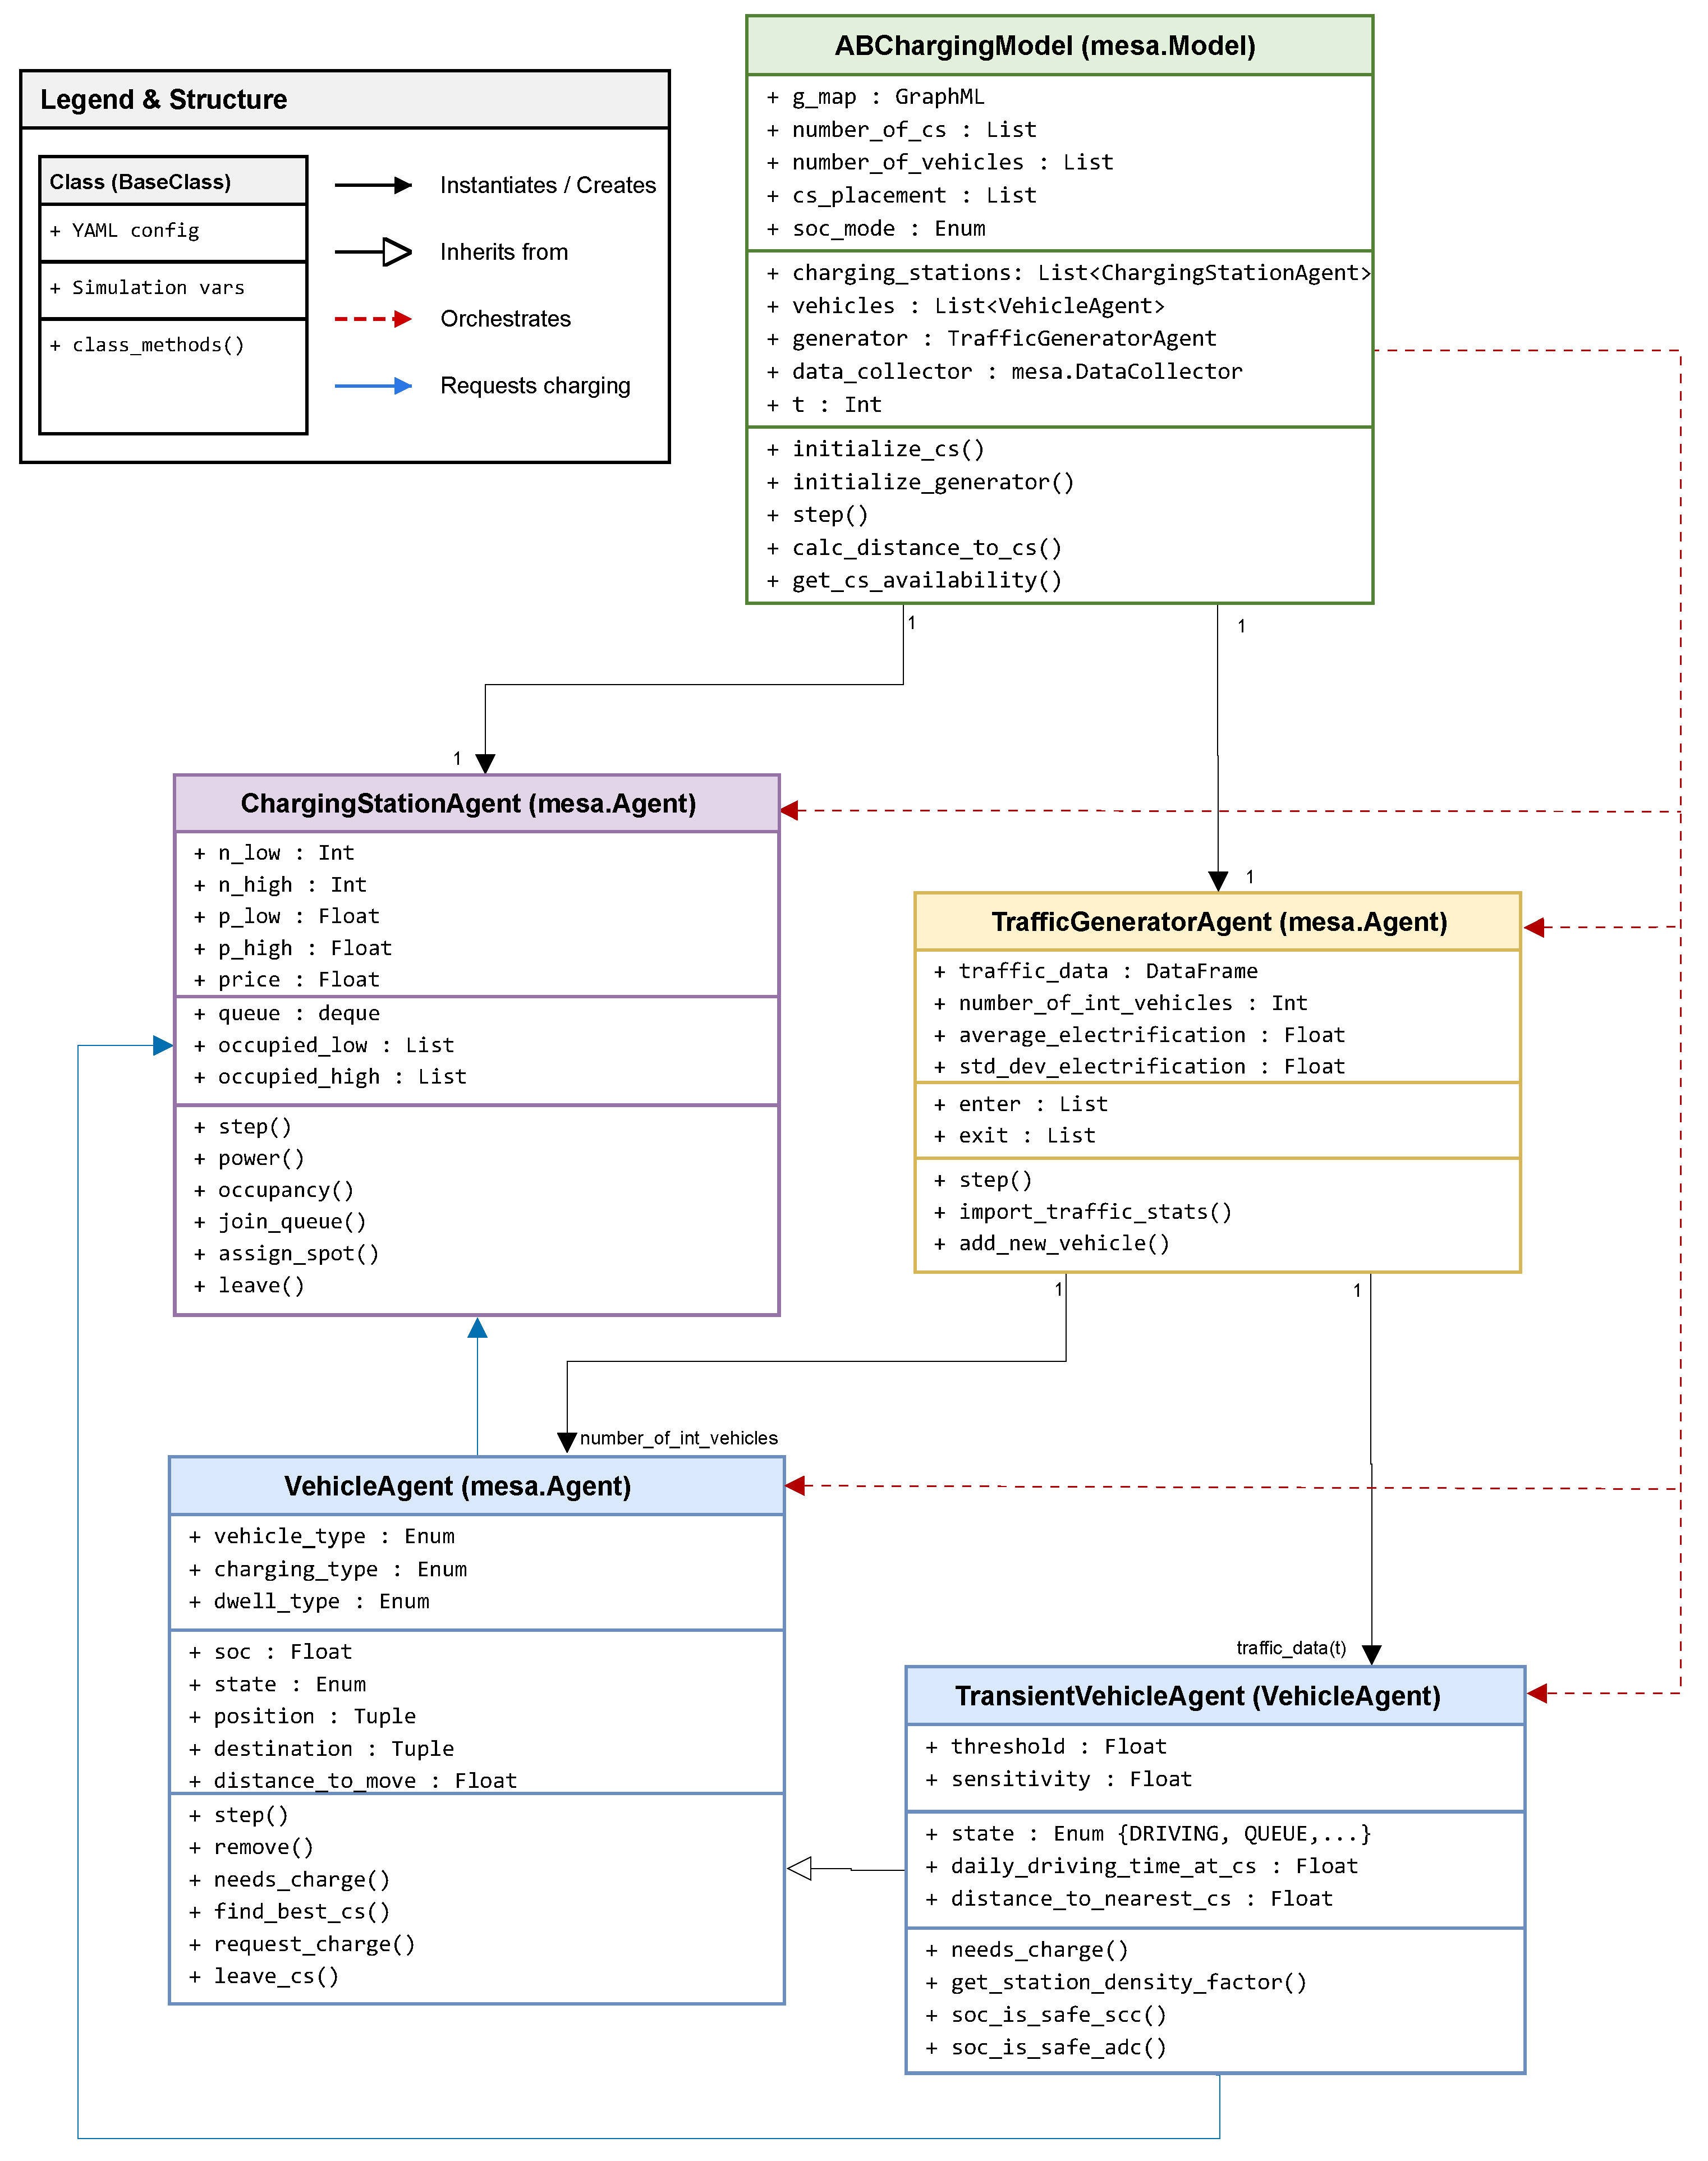
The proposed Multi-Agent System (MAS) is composed of three primary agent types that interact within a common environment. The UML diagram in
Figure 1 illustrates the high-level architecture of the simulator and the relationships between the core classes. Each class is represented with three sections, where the upper section represents object parameters defined by the YAML input configuration files, the middle section represents the variables stored during the agent-based simulation, and the bottom section lists the class methods that define the behavior of each class.
The core components are defined as follows:
ABChargingModel: The central orchestrator class inheriting from mesa.Model. It represents the environment of the MAS and is responsible for initializing the simulation environment and orchestrating the simulation steps. It parses the YAML configuration file to instantiate the required agents and set environment parameters and shared variables. Shared variables include the spatial grid (based on OpenStreetMap GraphML data collected via the osmnx library), the global time clock and model-level data (e.g., power demand, queue lengths) that is collected at each step in the data_collector.
VehicleAgent: Autonomous entities representing individual electric vehicles. The agent is initialized with a set of parameters imported from an input library of pre-defined vehicle types: battery capacity (
, kWh), maximum charging power (
, kW), and energy consumption rate (
, kWh/km). Additional attributes for behavioral modeling have been modeled:
charging_type (“mid-shift” or “off-shift”) and
dwell_type define the preference of the vehicle driver toward certain charging behaviors (see
Section 2.2.3 for details). After estimating the initial SOC based on a given Origin-Destination (OD) matrix, at each simulation step, the vehicle updates its position, traveled distance, and SOC (see
Section 2.2.4 for details). It continuously evaluates the need for charging based on SOC thresholds, destination distance, and driver anxiety models. The agent
TransientVehicleAgent is inherited by the
VehicleAgent class and customized for HDVs that are generated at the entry points of the observed street map and destroyed when they leave the map.
VehicleAgent and
TransientVehicleAgent implement a Finite State Machine (FSM) with four primary states:
DRIVING,
QUEUE,
CHARGING, and
FINISHED (see
Section 2.2).
TrafficGeneratorAgent: A specialized agent responsible for the stochastic generation of vehicle agents. Unlike standard agents that represent physical entities, this agent operates at the street map network entry points and creates new TransientVehicleAgent instances according to temporal distributions derived from real-world traffic data. At time t, the number of vehicles is sampled from a distribution ranging from 0 to traffic_data(t), following the hourly statistical distribution of the input data. Vehicle types and charging strategies of the new vehicles are assigned based on an input table of pre-defined vehicle models and adoption rates, enabling the simulation of mixed fleets.
ChargingStationAgent: An agent representing the physical charging infrastructure. It manages a finite set of charging plugs, categorized by power level (e.g., Low Power AC/DC [50–150 kW] vs. High Power DC/MCS [350–1000 kW]). These agents assign available plugs to vehicles based on internal assignment logic (e.g., off-shift vehicles assigned to low-power plugs). A First-In-First-Out (FIFO) queue is also maintained for managing temporarily unserved vehicles. Finally, this agent also logs the granular data on occupancy and power utilization for off-line analysis.
2.1.2. Configuration and Data Flow
The simulation is driven by a config_loader module that reads scenario definitions from YAML files. This allows for the definition of:
NetworkParams: Path to the GraphML topology file.
TrafficParams: Paths to CSV files containing traffic volume data, fleet electrification rates, and vehicle mix distributions.
StationParams: Location, number of plugs, and power capacities for each station.
BehavioralParams: Probabilities governing the behavior of vehicle drivers, including the split between off-shift and mid-shift behaviors, definition of Schedule-Compliant Charging (SCC) and Anxiety-Driven Charging (ADC) models, and Time-Constrained Strategy (TCS) and Energy-Targeted Strategy (ETS) models (see
Section 2.2.3 for details).
2.2. Agent-Based Simulation
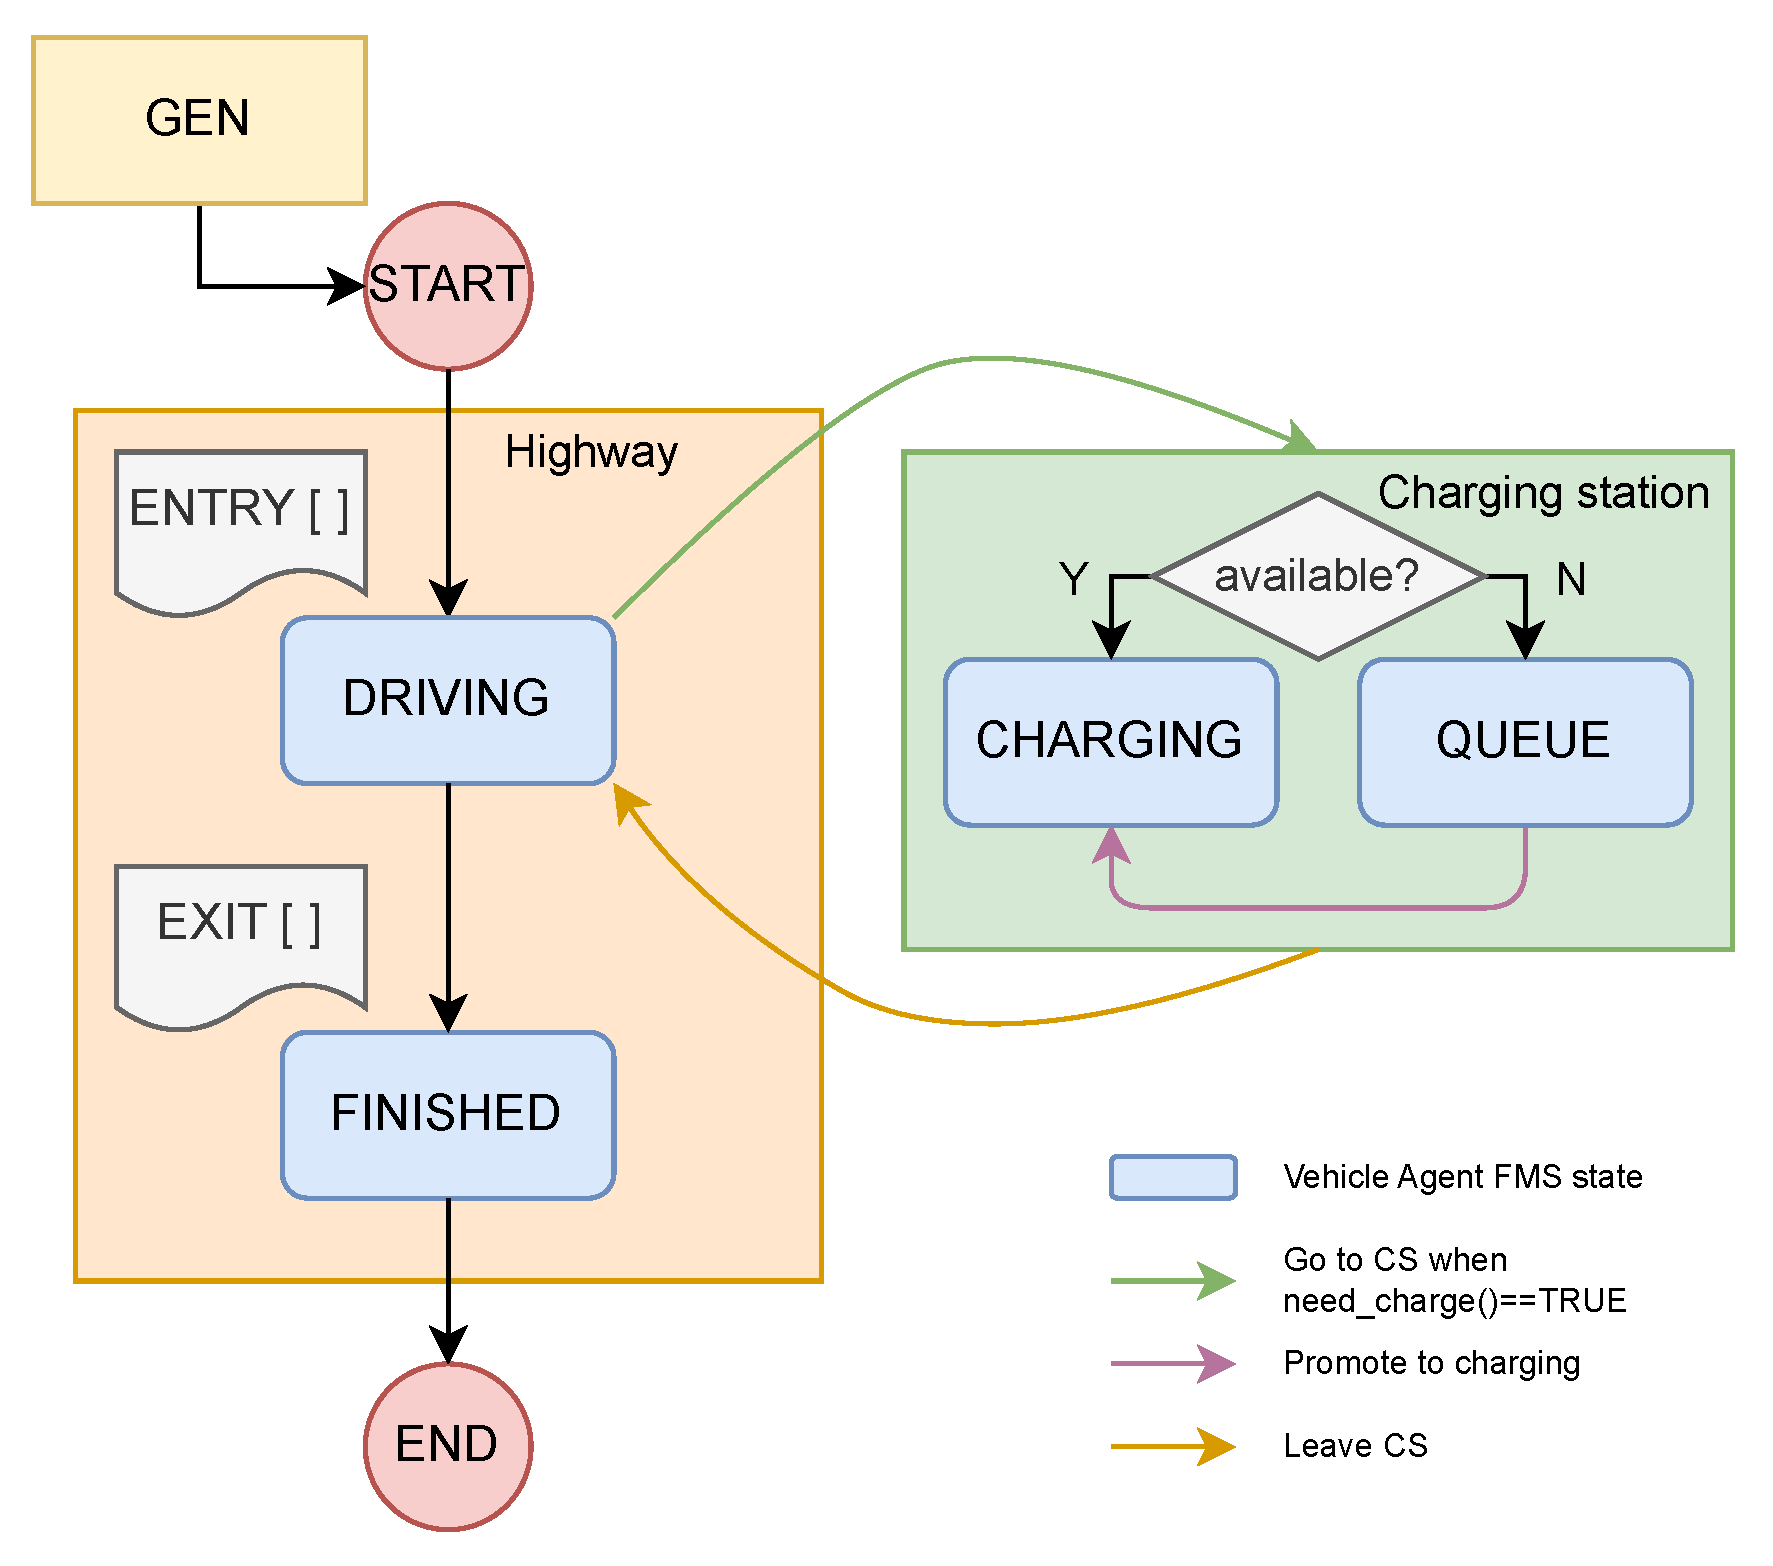
The simulation employs a Finite State Machine (FSM) architecture for each vehicle agent, which advances through several distinct operational states. In the context of long-haul electric truck simulation,
TransientVehicleAgent models are used, with their respective main states and processes represented in
Figure 2. The process begins with vehicle generation (GEN), where individual truck agents are stochastically instantiated according to temporal traffic patterns derived from the input data (see
TrafficParams in
Section 2.1.2). Each generated vehicle is assigned key attributes including vehicle model (determining battery capacity, consumption rate, and charging power), origin and destination of the travel, initial State of Charge and potential entry points to the simulation area.
The ENTRY property represents the vehicle’s introduction to the modeled road network at specific entry points. After entering the network, the agent is by default in the DRIVING state. A critical decision point occurs when evaluating whether to transition to the CHARGING state. This transition is triggered when charging behavior conditions are met, either the vehicle’s SOC falls below a minimum threshold, or the driver’s anxiety level exceeds a maximum threshold (see
Section 2.2.4 for details).
When a vehicle seeks to transition into the CHARGING state, it interacts with a charging station agent at its current location, requesting an available charging port. If it is not available, the vehicle enters a waiting QUEUE state. The charging station agent maintains a record of all connected vehicles, calculates instantaneous power demand, and tracks occupancy levels. Each vehicle’s charging session is modeled with vehicle-specific parameters including maximum charging power, battery capacity, charging curve (see
Section 2.2.4), and current SOC.
The charging duration is calculated based on a combination of the following factors (see
Section 2.2.3 for details):
The energy deficit (difference between current SOC and maximum battery capacity)
The vehicle’s maximum charging power
Mandatory break times
The maximum power of the available charging port
Upon completion of charging, the vehicle transitions back to the DRIVING state, advancing toward its FINISHED state where it leaves the simulation area through one of several possible EXIT points. Upon reaching the FINISHED state and exiting the geographical boundaries of the mapped corridor, the agents are immediately destroyed to conserve computational memory; however, all their transit and charging metrics are permanently logged by the central data_collector before deletion, alongside aggregate metrics such as queue lengths and power demand.
2.2.1. Initial SOC Estimation
The decision-making process of a VehicleAgent is determined by the global soc_mode and its individual charging_type. Two different charging behavior models are implemented to represent the diversity of driver decision-making processes: Schedule-Compliant Charging (SCC) and Anxiety-Driven Charging (ADC). The choice between these models is determined by the soc_mode parameter, which can be set at the model level or assigned stochastically to individual agents based on configured probabilities. To formalize the agents’ attributes description, in the following paragraphs we use an object-oriented notation, where denotes property x of a vehicle agent v.
Schedule-Compliant Charging (SCC): A model representing regulated fleet operations. In this model, drivers strictly adhere to legal break times. The vehicle plans its charging stops to coincide with mandatory breaks. Charging is triggered if the SOC is insufficient to reach the next scheduled stop or the final destination while reserving a defined safety buffer (
). This safety margin is defined dynamically as a fraction of the vehicle’s total battery capacity:
where
is the fractional safety parameter (e.g., 0.20 for a 20% reserve) assigned by the fleet operator, and
is the vehicle’s maximum battery energy capacity. It is important to distinguish this planning buffer from the agent’s absolute minimum state of charge (
), which represents the hard constraint below which the vehicle cannot safely operate without potentially damaging the battery. The
acts as an additional cushion on top of
during the pre-simulation route planning. During the pre-simulation, the vehicle ensures that its available energy (
E) satisfies the condition necessary to reach the next scheduled charging station (distant
km) without dipping below this combined reserve:
If this condition cannot be met, a charging session is mandated to accumulate the required energy deficit.
Anxiety-Driven Charging (ADC): A stochastic model driven by a risk-averse behavior based on an individually defined range-anxiety variable. In this model, the probability of charging
increases non-linearly as the
decreases. The application of a logistic or sigmoid function to map battery depletion to a probabilistic charging decision is a well-established approach in EV behavioral modeling for capturing the non-linear threshold effects of human range anxiety [
21,
22]. In our framework, this is modeled using a sigmoid function modulated by the density of charging stations in the vicinity:
where
is the vehicle’s current state of charge,
is the driver’s comfort threshold (e.g., 0.3 for 30%), and
is a behavioral parameter determining the steepness of the anxiety curve. The variable
is a dimensionless station density factor, which scales linearly based on the average distance between charging stations along the route (
), ranging from 0.5 for sparse infrastructure (
km) to 1.5 for dense infrastructure (
km). A higher
value reduces the baseline probability of charging, reflecting reduced range anxiety in well-covered networks.
To initialize vehicle energy levels upon entering the network, the pre-simulation phase assumes that en-route charging sessions are capped at 45 min for SCC agents to match European statutory rest requirements, while ADC agents perform standard 30 min fast charging.
While real-world long-haul logistics involve a complex mix of central fleet planning and individual driver constraints, the SCC and ADC models are implemented to serve as robust bounding cases. The SCC model represents the ideal, centrally planned scenario where decisions are perfectly rational and synchronized. In contrast, the ADC model captures the highly stochastic, less predictable behavior of individual range anxiety. By simulating both extremes, this framework defines the full envelope of potential load profiles, providing planners with a comprehensive assessment of grid impacts under behavioral uncertainty.
2.2.2. Charging Trigger
When each vehicle agent is in the proximity of the monitored charging station node, we check the Charging Decision Rule (
). An agent
v will initiate a charging session at the current station if
evaluates to true. For the SCC mode, the decision is deterministic and triggered by the necessity to maintain the safety buffer for the next leg of the journey:
For the ADC mode, the decision is stochastic, representing individual variability and range anxiety:
To analyze the resilience of the charging infrastructure to these divergent behaviors, both the SCC safety buffer and the ADC anxiety threshold are parameterized for sensitivity analysis. It is important to specify that varying these behavioral parameters affects the initial SOC estimation and the probability of initiating a charging session; they do not alter the duration of the actual charging state, which remains governed by the distinct logistical strategies detailed below.
2.2.3. Agents’ Charging Behavior
A major limitation of standard EV models is the assumption that charging is the primary purpose of a stop. In heavy-duty logistics, stops are often mandated by regulations (rest) or operations (logistics). To address this, we introduce a dual-layer behavioral framework. The first layer defines the specific charging strategy adopted by the driver during a stop, representing varying behavioral priorities. We model two distinct charging target strategies:
Time-Constrained Strategy (TCS): Represents strict compliance with rest regulations (e.g., the European 45 min mandatory pause). The vehicle departs exactly when the mandated rest time concludes, prioritizing schedule adherence over maximizing battery energy. The charging session duration is strictly limited by the available dwell time.
Energy-Targeted Strategy (ETS): Represents a range-anxious or conservative approach. The vehicle remains at the station until a safe operational SOC (e.g., 80%) is achieved, prioritizing range assurance over strict schedule adherence, even if it requires extending the stop beyond the minimum regulatory rest period.
The second layer classifies the overall operational constraint by assigning a primary Charging Type to each vehicle upon generation. Borlaug et al. [
13,
23] demonstrated that off-shift, long-dwell charging is critical for heavy-duty electrification. Public highway infrastructure will inevitably need to support a mix of mid-shift (fast) and off-shift (slow) charging as trucks are driven for long distances and require both en-route short breaks and long rests, e.g., overnight. To capture this diversity, we assign each vehicle a
charging_type attribute:
Mid-Shift Charging: Represents a short, en-route break. Priority is given to high-power chargers (e.g., >350 kW) to minimize downtime. The departure condition for a mid-shift stop is governed dynamically by either the Time-Constrained Strategy or the Energy-Targeted Strategy, depending on the modeled fleet behavior.
Off-Shift Charging: Represents a long rest (e.g., overnight sleep or loading). The vehicle does not require high power, as it will be parked for an extended duration (, e.g., 8 h). The charging power is reduced (e.g., at 50 kW) to simulate smart charging or battery health preservation. The vehicle occupies the plug for the full duration of the dwell time, and the station prioritizes allocating these vehicles to low-power plugs.
The process is synthesized in Algorithm 1. To clarify the computational steps, several vehicle-specific and environmental variables are evaluated continuously:
denotes the vehicle’s maximum battery energy capacity [kWh],
the energy consumption rate [kWh/km],
the vehicle’s maximum charging power [kW], and
the average driving speed [km/h]. The algorithm is structured in two main phases: Phase A focuses on the pre-simulation estimation of the vehicle’s state of charge (
) based on its planned route and the chosen charging behavior model (
Section 2.2.1). In SCC mode, drivers anticipate the time to reach the next scheduled charging station (
) and ensure they retain a minimum safety energy buffer (
). Conversely, in ADC mode, the route is discretized into time legs (
) that correspond to the frequency of charging station encounters, and for each time leg the anxiety level is reassessed. By simulating in Phase A the vehicle’s historical approach up to the boundaries of the study area, the initial SOC upon entering the map becomes a function of the Origin-Destination matrix and the macroscopic charging infrastructure density. After this pre-simulation, in case the charging trigger evaluates to True (
Section 2.2.2), phase B assigns a behavioral type to the vehicle for real-time simulation, determining its charging strategy and target power based on its assigned type (
Section 2.2.3).
Standard Profile: Represents a standard generic BMS strategy.
Early Taper Profile: Represents strategies that prioritize battery health or older chemistries by tapering power earlier.
Flat Profile: Represents an ideal model with constant maximum power demand, in addition to advanced systems capable of maintaining maximum power until very high SOC.
| Algorithm 1 Vehicle Agent Logic: SOC Estimation and Behavioral Assignment |
| Require: Vehicle v, Mode , Station density |
| Ensure: Initial , Behavioral , Target Power |
| // Phase A: Pre-simulation state of charge estimation |
| 1:
| | ▹ Battery energy [kWh]
|
| 2:
| calc_distance() / |
| 3:
| if then | ▹ Schedule-Compliant: Regulated breaks
|
| 4:
| | ▹ Number of 4.5 h driving shifts
|
| 5:
| for to n do |
| 6:
| |
| 7:
| |
| 8:
| | ▹ Max 45 min charge
|
| 9:
| |
| 10:
| end for |
| 11:
| else | ▹ Anxiety-Driven: Stochastic evaluation
|
| 12:
| | ▹ Evaluation points based on |
| 13:
| for to n do |
| 14:
| |
| 15:
| |
| 16:
| if then |
| 17:
| | ▹ 30 min charge
|
| 18:
| end if |
| 19:
| end for |
| 20:
| end if |
| 21:
| |
| // Transition: Real-time charging decision |
| 22:
| if = True (Equation (4) or Equation (5)) then | ▹ Check SCC/ADC condition
|
| // Phase B: Real-time behavioral assignment |
| 23:
| |
| 24:
| if then |
| 25:
| |
| 26:
| Condition to leave: |
| 27:
| else | ▹ Mid-Shift options
|
| 28:
| |
| 29:
| if Strategy = TCS then | ▹ Time-Constrained
|
| 30:
| |
| 31:
| Condition to leave: |
| 32:
| else | ▹ Strategy = ETS (Target SOC)
|
| 33:
| Condition to leave: |
| 34:
| end if |
| 35:
| end if |
| 36:
| else |
| 37:
| | ▹ Bypass charging station
|
| 38:
| end if |
Simulating HDVs that start their sessions at different times and SOC levels with different BMS strategies creates a more accurate aggregate load compared to flat power demand assumptions. Algorithm 2 details the resource allocation logic implemented within the ChargingStationAgent to handle heterogeneous requests based on charging socket availability and incoming vehicle power requirements. The algorithm prioritizes mid-shift vehicles for high-power plugs while assigning off-shift vehicles to low-power plugs, with fallback logic to manage overload and queueing when demand exceeds capacity. This approach ensures efficient utilization of charging infrastructure while respecting the distinct needs of different vehicle types.
| Algorithm 2 Charging Station Allocation Logic |
| Require: Vehicle v, Station S |
| 1: | function AssignSpot() |
| 2: | if then |
| 3: | if then |
| 4: | Assign |
| 5: | |
| 6: | return True |
| 7: | else if then |
| 8: | Assign |
| 9: | | ▹ Limit draw on High Power plug |
| 10: | return True |
| 11: | end if |
| 12: | else | ▹ Mid-Shift: Priority for |
| 13: | if then |
| 14: | Assign |
| 15: | return True |
| 16: | else if then |
| 17: | Assign |
| 18: | return True |
| 19: | end if |
| 20: | end if |
| 21: | | ▹ No plugs, enter FIFO queue |
| 22: | return False |
| 23: | end function |
2.2.4. SOC-Dependent Charging Demand
In traditional models, vehicles are often assumed to draw their maximum rated power () throughout the entire session. However, real-world battery behavior follows a charging curve where the power is limited by the interaction between the vehicle’s battery management system (BMS) and the charging station energy/power management system (EMS/PMS).
The instantaneous power demand of a vehicle agent
v at time
t,
, is defined as:
where
is the power limit of the assigned charging port,
is the vehicle’s maximum acceptance rate, and
is the power acceptance ratio. We implement three distinct profile types for
to represent various battery chemistries and BMS strategies; the specific assignment of these curve types to vehicle models is detailed later in
Section 3.1.
Due to the proprietary nature of commercial Battery Management Systems (BMS) and a scarcity of open-source electric HDVs charging logs, exact high-power charging trajectories remain largely inaccessible. The framework utilizes piecewise linear approximations to synthesize the standard Constant Current-Constant Voltage (CC-CV) charging protocol. This approach aligns with established methodological standards in electric vehicle infrastructure and power system modeling (e.g., [
24,
25]). By assigning these specific tapering configurations and defining distinct
-dependent charging stages, the framework approximates the non-linear power attenuation that physically occurs at high
levels.
3. Case Study
The methodology presented in
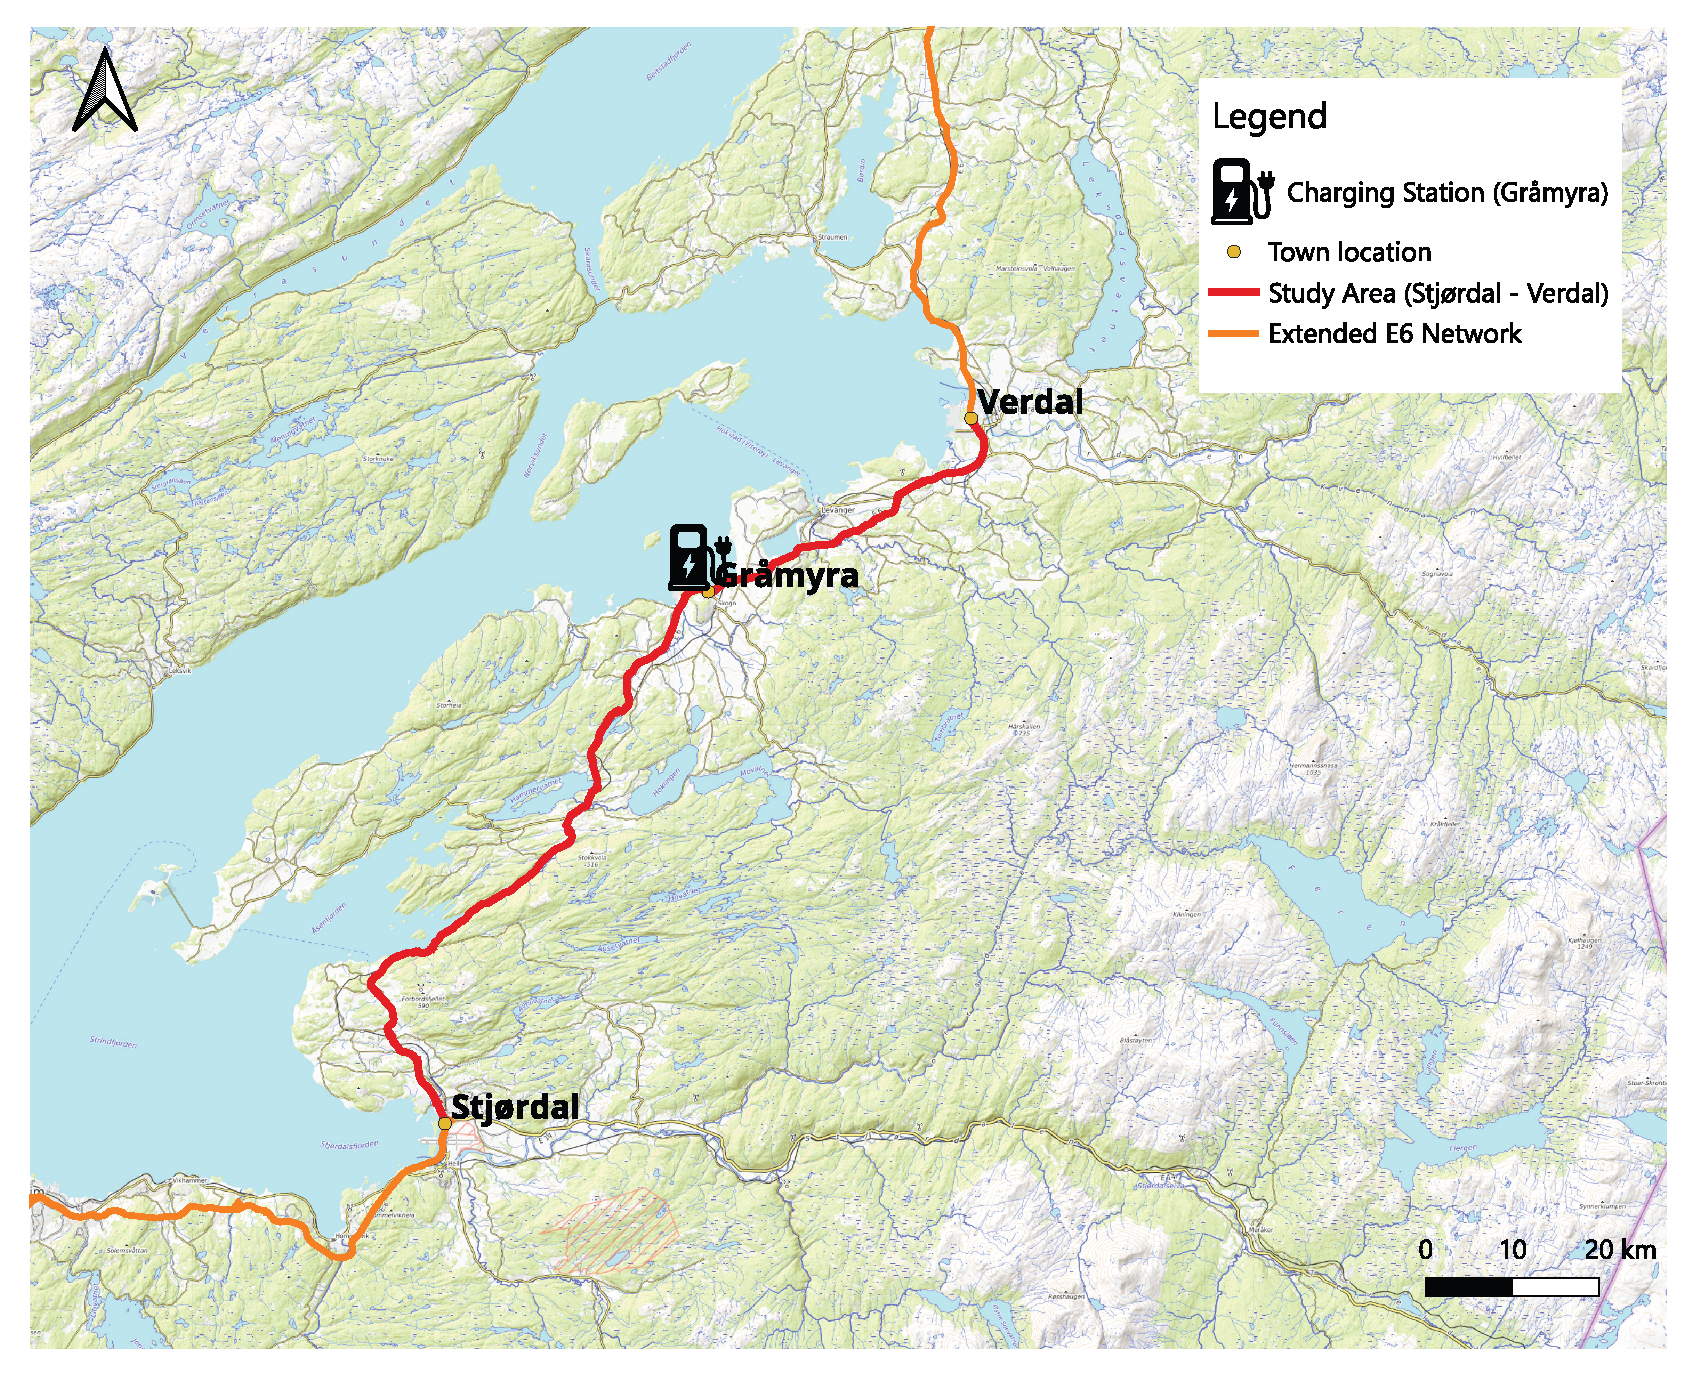
Section 2 has been applied to a case study located in an area of the highway E6 in Norway between Stjørdal and Verdal. The highway stretch is part of the TEN-T comprehensive network, and spans approximately 60 km. The stretch was chosen because it is located away from large urban areas, making it suitable to investigate the behavior of long-haul transport without considerable noise from vehicles circulating within the area. Additionally, there are few roads branching out of the main road, with relatively little traffic, making the assumption of one exit and one entry on each endpoint reasonable.
Topologically, this specific 60 km segment runs predominantly along the area of the Trondheimsfjord. The terrain is characterized by low-elevation coastal agricultural land, resulting in a relatively flat profile without steep gradients. The simulated charging station is in Gråmyra, Levanger. There exists both a fuel and a charging station there today. A dedicated charging station for HDVs is also planned for this site, having already received support from Enova [
26]. To evaluate long-haul routing, this central node is analyzed in relation to adjacent charging stations located 100 to 120 km away (depending on the specific time horizon analyzed, see
Table 2 for comprehensive network). Beyond the immediate study area, the highway terrain shifts; continuing south past Stjørdal toward Trondheim introduces denser traffic nodes while extending north beyond Verdal transitions into rolling inland forested landscapes.
3.1. Input Data
The case study is based on input data from open source datasets publicly available, that make the methodology widely replicable in any context in Europe. More specifically:
Street topology: The road network is modeled using a graph from the
osmnx library in Python. The simulation considers the simple case of a single charging station per driving direction. As these charging stations are placed in close proximity, they may be served by the same power substation; therefore, the power demand is studied as a single aggregated charging load served by the same power system feeder. The road stretch and the location of the charging station are depicted in
Figure 3.
Truck models: The vehicle model types used in the simulation are based on existing electric trucks on the market. The models used in the simulation together with their specifications are summarized in
Table 3. Only E-trucks with a driving range of 350 km or more are included. Given the emerging state of the electric long-haul HDV market, empirical market-share distributions for these specific models do not yet exist. To prevent introducing speculative bias into the simulation, the vehicle agents are therefore assigned using a uniform sampling distribution. Concerning the charging control profiles, the
curve types (Standard, Early Taper, Flat) defined in
Section 2.2.4 are assigned as presented in
Table 3. In the absence of comprehensive standardized testing data for all models, these assignments are heuristic assumptions intended to simulate a realistic, heterogeneous mix of Battery Management System (BMS) strategies and analyze their effect on the aggregate charging station load demand. The rate of electrification of the fleet is obtained from the statistics reported by the Norwegian Statistics Bureau [
27], which reports, for 2024, 1789 electric trucks over a total of about 66,000 trucks. Based on this figure, a rate of electrification of 3% is assumed for 2025. By considering a growing rate of electrification of the truck fleet (12.5% of new trucks sold in 2024 in Norway were electric, and considering a continuous 4% increase in this market share in the next years and a 5% fleet turnover rate), an electrification rate of 10% is assumed as a plausible value for a future scenario set in 2030.
HDV traffic: Several National Road Administrators (NRAs) provide free access to traffic historical data. In Norway, the Norwegian Public Roads Administration (Statens Vegvesen-SVV) provides traffic records from a system of inductive loops deployed in Norwegian streets and highways through a public API [
28]. This API provides hourly traffic counts filtered by different vehicle lengths. This feature is used to filter the traffic data for vehicles longer than 12.5 m, which are assumed to be heavy-duty vehicles for our case study.
Transport routes: The Synthetic European Road freight transport dataset describes estimated European truck traffic flows between 1675 regions all over Europe and is based on the publicly available ETISplus project from 2010 [
29,
30]. The project collected Europe-wide freight volumes and calibrated the resulting origin-destination matrices with real-world traffic flows. With Stjørdal and Verdal being own nodes in this dataset, the choice of the two also simplified the traffic flow modeling.
Data Limitations and Mitigation Strategies
While the reliance on open-source data allows the proposed framework to be highly replicable, it introduces specific uncertainties that must be acknowledged. First, the traffic volume data sourced from the Norwegian Public Roads Administration (SVV) relies on inductive loop classifications by vehicle length. This metric cannot cleanly distinguish between heavy-duty long-haul trucks and regional distribution vehicles. Because regional trucks primarily utilize private depot charging, deriving broad electrification scenarios from raw SVV counts may lead to an overestimation of the public en-route charging demand. Second, the synthetic European road freight data (ETISplus) utilized for origin-destination mapping provides general route volumes but lacks the micro-temporal resolution needed to capture the daily stochasticity of real-world logistics, such as arrivals bursts due to traffic conditions or dynamic fleet behaviors. Finally, the vehicle parameterization is heavily based on domestic registry data from Statistics Norway (SSB). Given that the E6 is a major international transit corridor, domestic statistics may not perfectly represent the heterogeneous operational behaviors of transiting foreign fleets.
To mitigate the inaccuracy of single-point averages, the raw historical traffic data is mathematically grouped into statistical bins based on seasonal variations and working-day hourly classifications. During execution, the TrafficGeneratorAgent dynamically samples from the full empirical distribution of these groupings, ensuring the simulation represents a comprehensive spectrum of historical occurrences rather than flattened averages. To address the lack of micro-temporal resolution, this sampled volume drives a Poisson process evaluated every 15 simulation minutes. The model is executed over an extended continuous duration of 5760 h (equivalent to 48 working-day weeks). These measures ensure that the resulting percentile metrics reflect the demand to be expected by the fleet driving in the observed corridor, while the absolute peak demands should be interpreted as boundary projections.
The assignment of charging profile types and the uniform sampling of truck models are deliberate methodological choices intended to represent the maximum possible heterogeneity of the future fleet. In the absence of established market-share data for long-haul electric trucks, uniform sampling serves as a neutral baseline that prevents model-specific bias. Similarly, by mixing ‘Early Taper’, ‘Standard’, and ‘Flat’ profiles, the simulation captures the aggregate ‘smoothing’ effect of diverse Battery Management Systems (BMS). This moves the analysis beyond the standard literature assumption of a 100% constant power draw, providing a more conservative estimate of concurrent peak demand.
An additional limitation of the input dataset is represented by the early stage of heavy-duty electric vehicle adoption. Although early dedicated charging points for HDV are beginning to be deployed (for instance, in Norway), the actual number of electric trucks in active operation along the corridor is still small. The resulting lack of comprehensive, real-world high-power charging logs impedes direct empirical validation of the simulated load profiles. To ensure a deep analysis and understanding of the findings, the framework relies on sensitivity analysis and the evaluation of trend stability across a wide range of behavioral parameters. Sensitivity parameters used along the different analyzed scenarios and related assumptions are summarized in
Table 4. It is therefore acknowledged that direct empirical validation against real operational charging logs represents a known limitation of the present study, and an essential direction for future research as megawatt-scale HDV charging infrastructure matures and deployment data becomes available.
Because the agent-based framework relies heavily on stochastic processes to simulate traffic arrivals and behavioral decisions, deterministic single-point forecasts are insufficient. Instead, the simulation outputs are analyzed as statistical distributions. Throughout the results, non-parametric boxplots are utilized where the whiskers and outlier markers explicitly serve as the uncertainty bounds for the expected behavior, capturing the full spectrum of simulation variability required for robust infrastructure planning. To further mitigate the impact of input uncertainties and stochastic outliers, daily representative metrics are calculated for each scenario. These metrics are defined as follows:
Peak Demand (
), Peak Occupancy (
), and Peak Queue (
): Represent the expected daily maximum values for power demand, station occupancy, and queue length, respectively. They are calculated as the mean of the peak values for day
d over the simulation period of
N days:
where
X can be
P (Power),
O (Occupancy), or
Q (Queue).
Peak-to-Valley Difference (
): Measures the daily volatility of the demand, defined as the expected difference between the daily maximum and minimum loads:
Ramp-Up Duration (
): Measures the expected time to react to the daily volatility, quantified as the expected time between the daily valley time (
) and the daily peak time (
):
High-Demand Duration (
): Measures the expected peak stress on the charging station by measuring the cumulative hours per day where the demand exceeds 80% of that specific day’s peak (
):
where
is the indicator function.
Load Factor (
): Evaluates the utilization efficiency of the charging station, defined as the ratio of the average daily load to the peak daily load:
Ramping Intensity (
): Quantifies the severity of the load increase from valley to peak, defined as the required power variation per hour during the ramp phase:
The single-corridor setup along the E6 simplifies complex routing and queue dynamics. Although this simplification can limit the capacity to observe the complex spatial interactions that occur on meshed network topologies and multiple charging station agents within a large area, the individual agent logic integrates key macro-area properties, such as station density () and inter-station distances, to implicitly capture adjacent infrastructure interdependencies. These factors govern the vehicle agents’ decision triggers, determining their dynamic arrival rates and dictating if vehicles execute immediate charging or postpone it. This streamlined representation of vehicles’ charging model therefore allows capturing essential dependencies while preserving a high computational efficiency for high-resolution simulations over an extended time period.
3.2. Simulation Scenarios
The case study aims at determining the expected load profiles from long-haul truck charging demand and utilizes the charging station located in the observed area. We define two simulation periods to represent the temporal evolution of the system, based on projected fleet electrification rates:
Scenario 2025: Early adoption phase. Fleet electrification is set at 3%. The charging station is modeled with a capacity of 2400 kW (e.g., two charging stations serving opposite traffic directions, each with two 350 kW plugs plus two 250 kW plugs).
Scenario 2030: Mass adoption phase. Fleet electrification rises to 10%. The charging station capacity is upgraded to 3600 kW (two charging stations serving opposite traffic directions, each with three 350 kW plugs plus three 250 kW plugs).
To comprehensively evaluate the impact of the implemented behavioral features and target charging strategies, we define three analytical case groups:
Case 1 (Behavioral Comparison): Compares the impact of Schedule-Compliant Charging (SCC) versus Anxiety-Driven Charging (ADC) behaviors across early (2025) and mass adoption (2030) phases. Furthermore, this group contrasts two distinct mid-shift charging strategies: Time-Constrained Strategy (TCS) (a fixed mandatory 45 min break) and Energy-Targeted Strategy (ETS) (departure once 80% SOC is reached).
Case 2 (Off-Shift Probability): Evaluates how increasing the share of off-shift charging affects peak load and station utilization under both TCS and ETS strategies.
Case 3 (Charge Control): Evaluates the impact of SOC-dependent power limits. It compares a “Flat” case (constant maximum power) against a “Mixed” case combining various charging profiles.
We include an additional
Case 4 (Sensitivity to Assumptions) to analyze the sensitivity of the results to some input parameters, such as the Energy Buffer for SCC and the Anxiety Threshold for ADC. All simulation assumptions, parameters and bounds are summarized in
Table 4, whereas
Table 5 summarizes the specific parameter configurations for all analyzed scenarios.
The simulation utilizes baseline traffic data collected by the Norwegian Public Roads Administration (SVV) from the inspected area during the summer of 2025. To capture the most intense periods of commercial logistics, the analysis strictly isolates working days (Monday–Friday). The results are presented and discussed in
Section 4.
4. Results
4.1. Case 1: Behavioral Comparison
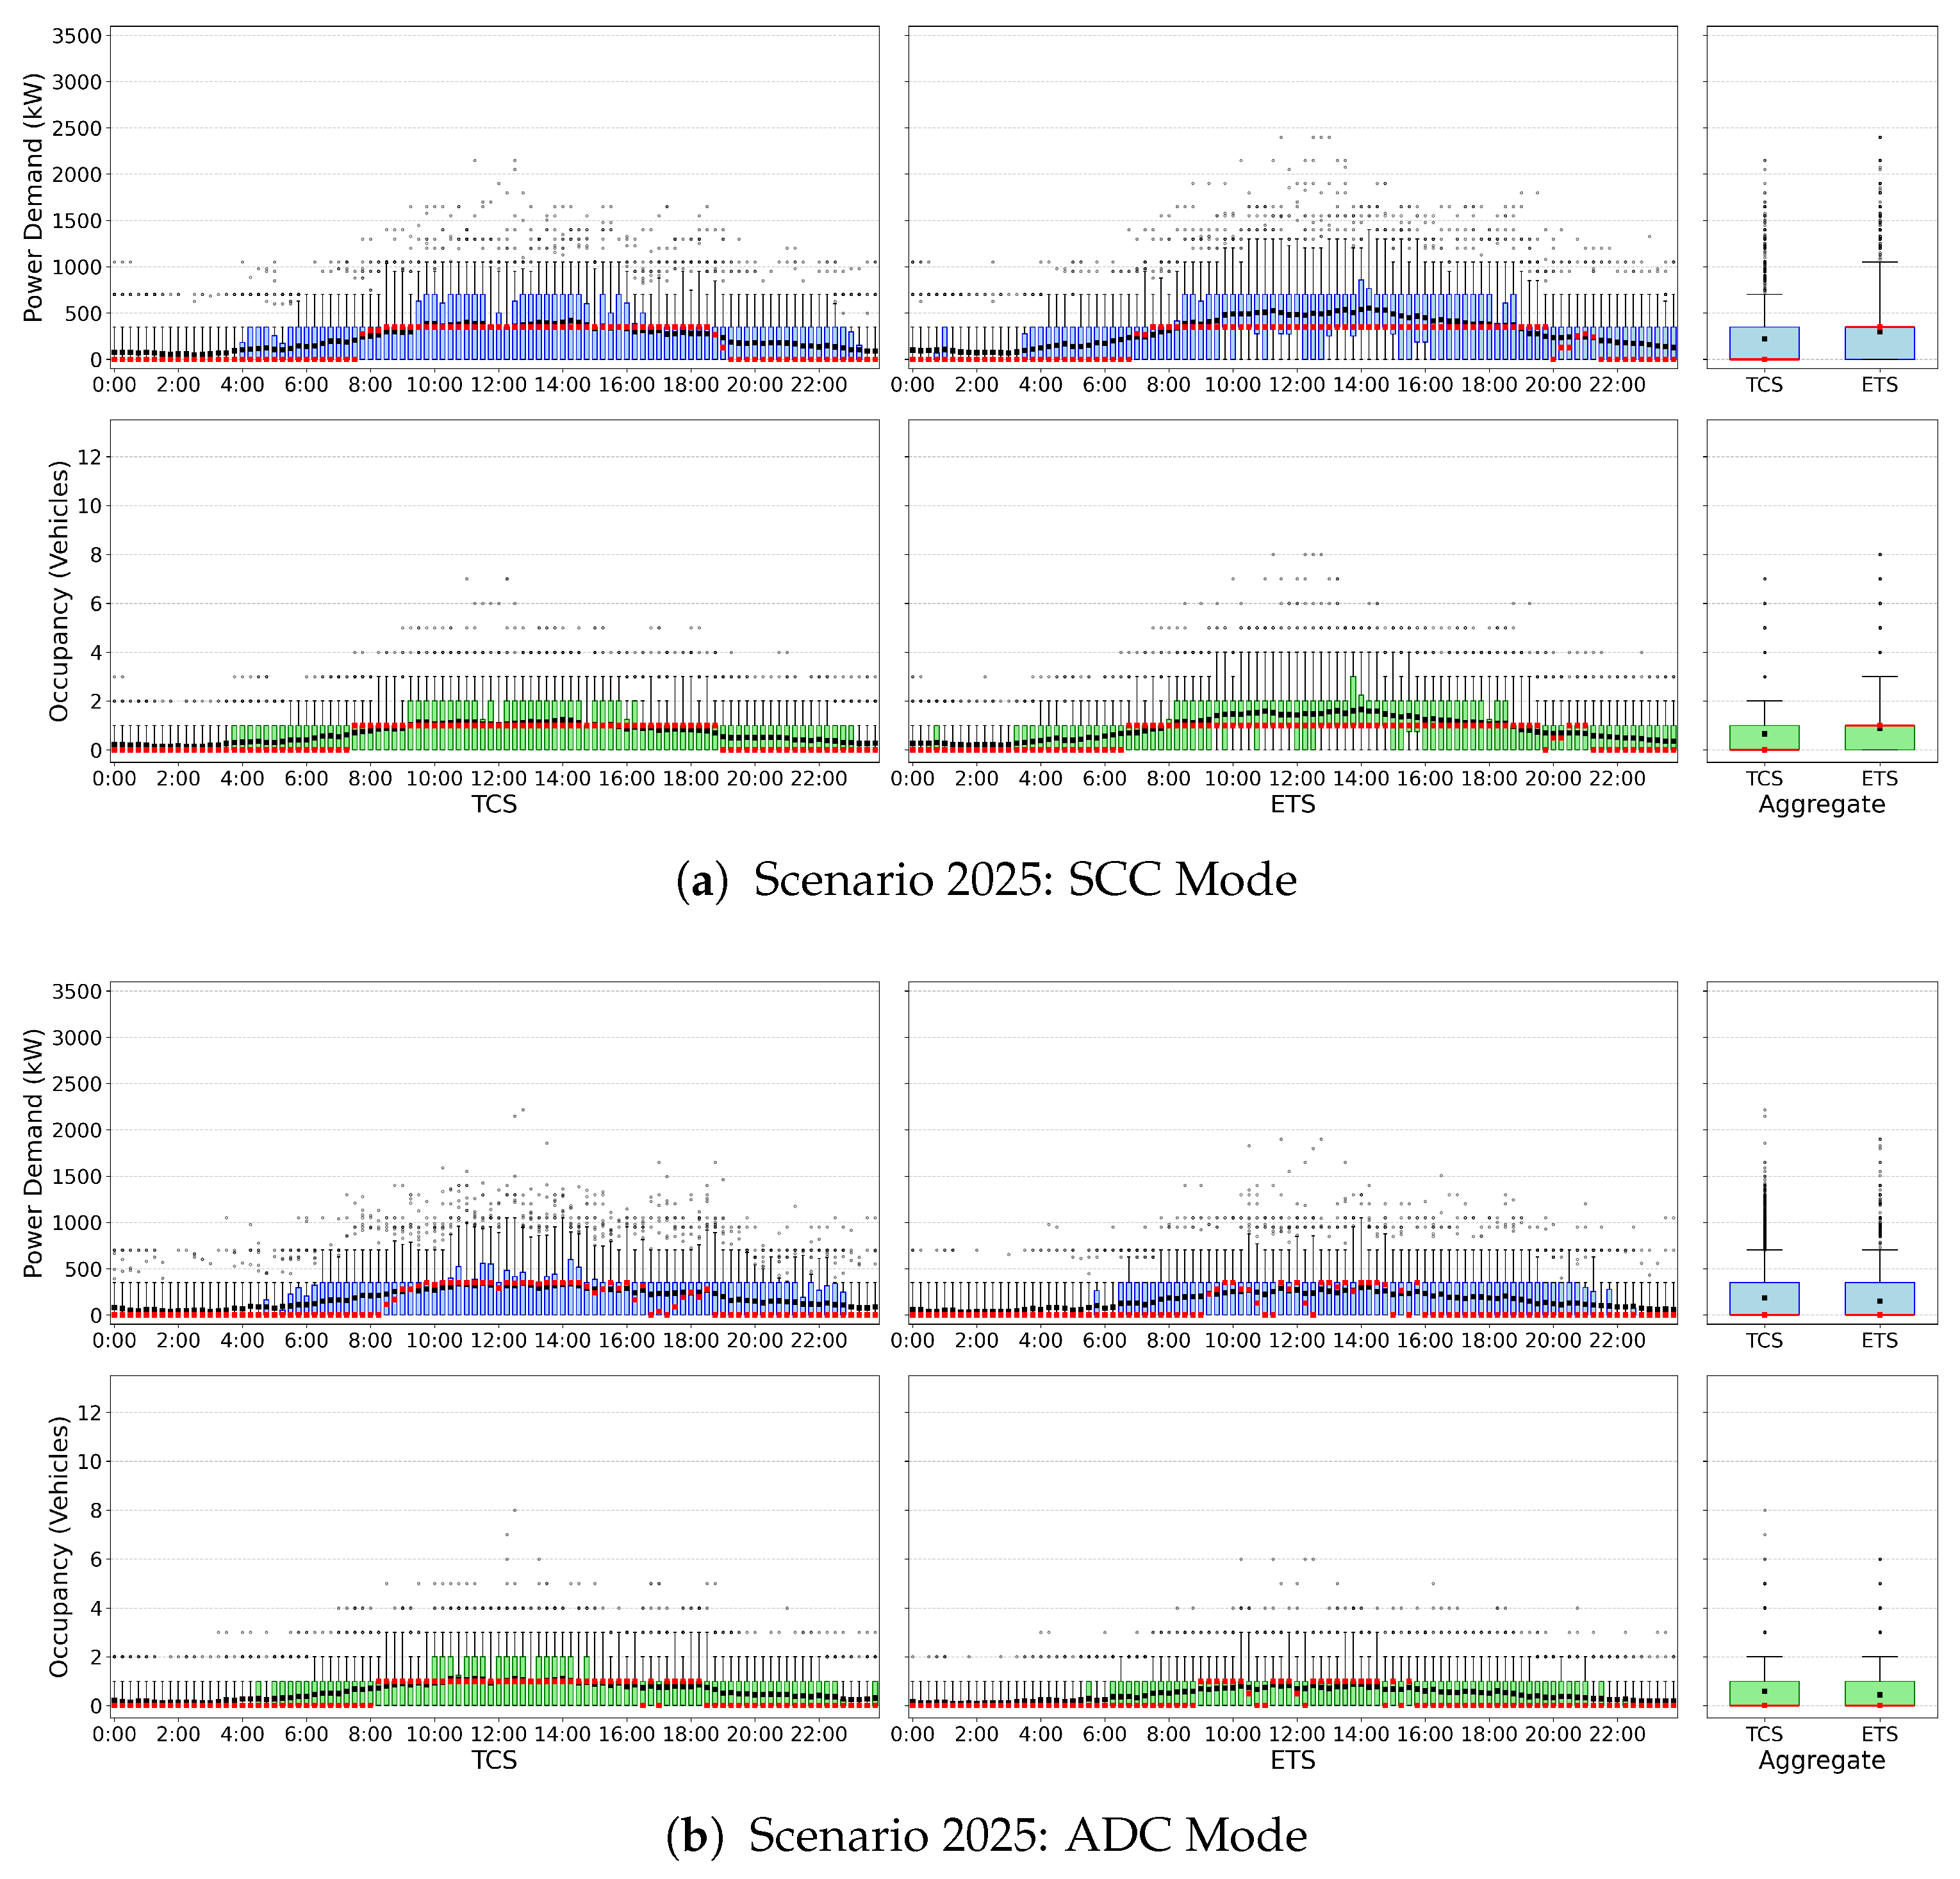
Figure 4 presents the simulation results for Scenario 1 (2025), comparing both strategy approaches (TCS on the left column, ETS on the right column of the figure), where the two behavioral approaches are shown in the two subplots (subplot (a) for SCC mode, subplot (b) for ADC mode). The same results are reported in
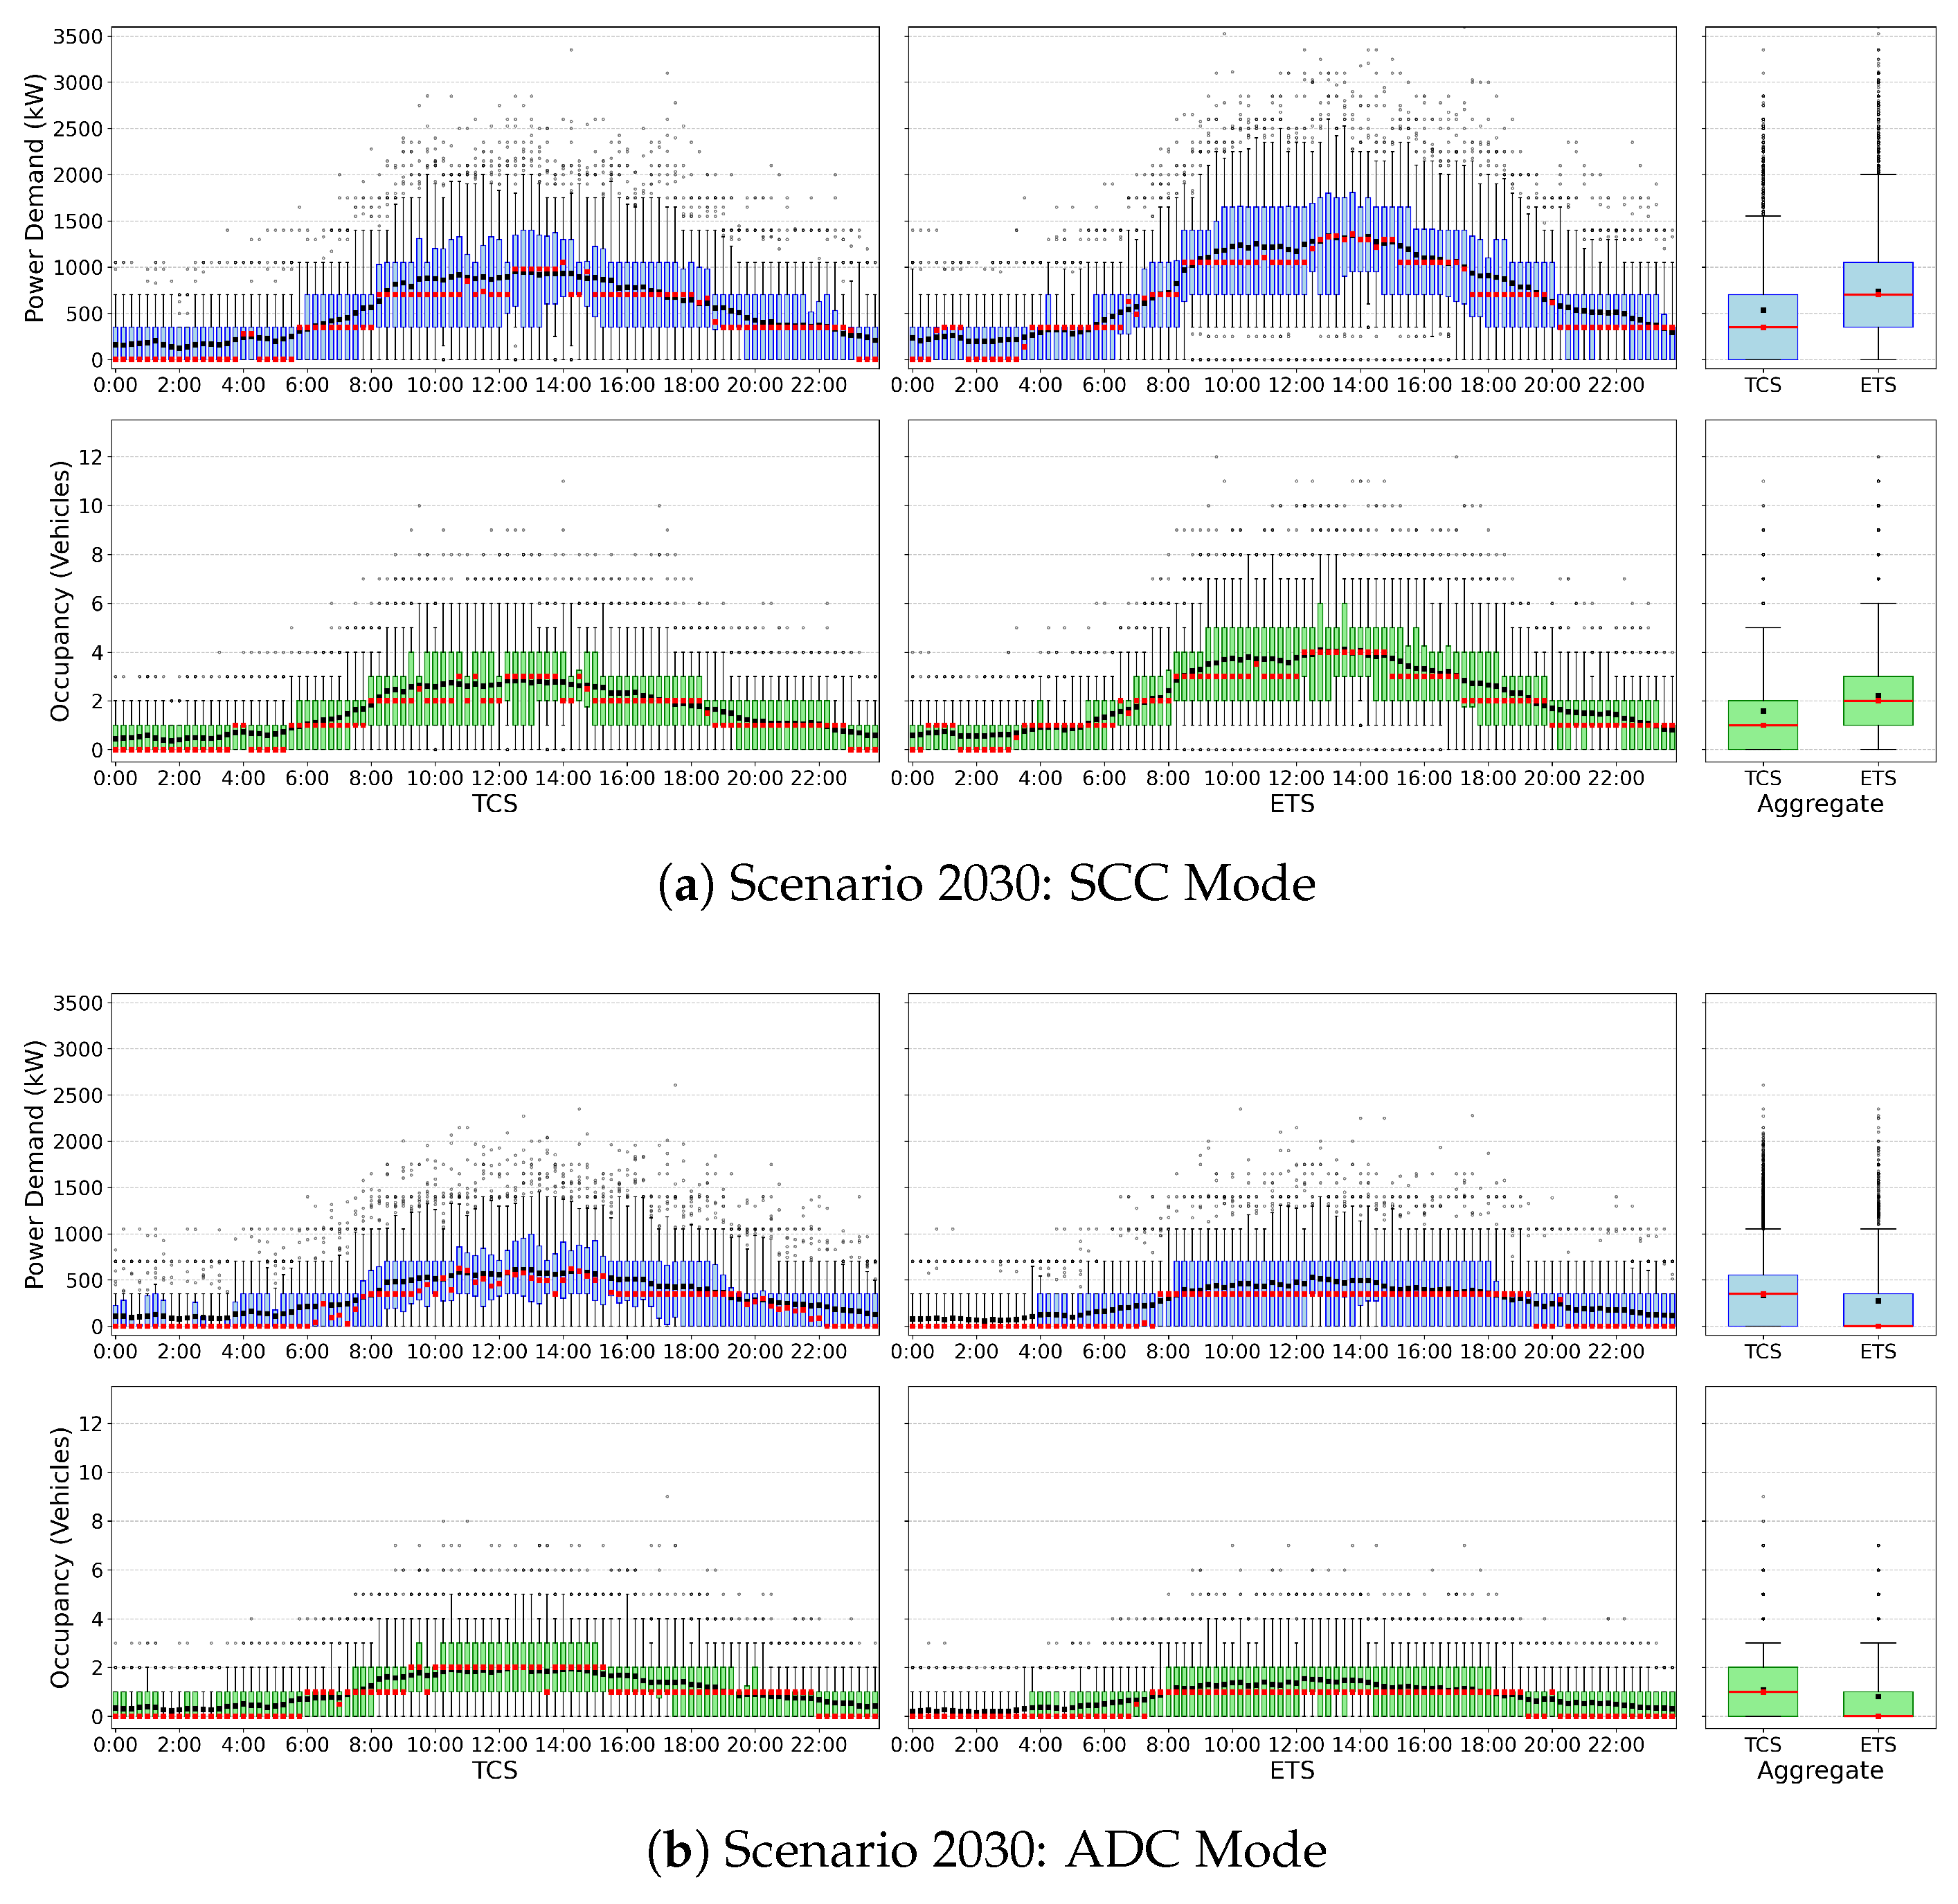
Figure 5 for Scenario 2 (2030), showing notable divergences as electrification rates and infrastructure capabilities evolve between 2025 and 2030, and between the subcases representing the two different SOC estimation models. The results are quantitatively presented and summarized in
Table 6, which reports the expected daily metrics discussed in
Section 3.1 for all the simulation scenarios for this case.
The comparison between Schedule-Compliant Charging (SCC) and Anxiety-Driven Charging (ADC) models demonstrates remarkable consistency in the 2025 scenario. Considering the results for the Time-Constrained Strategy (TCS), both SCC and ADC approaches generate similar load patterns with 95th percentile demands of approximately 1 MW during the 10:00–14:00 period, plus outlier values for both behavioral models reach over 2 MW. The aggregated statistical indicators (mean, median, and quartiles) exhibit strong correspondence between the two models, suggesting that despite their fundamentally different behavioral frameworks, the expected charging patterns under the limited electrification conditions in 2025 are consistent, maintaining a manageable expected daily peak () from 1235.8 kW for ADC to 1371.6 for SCC, and a Ramping Intensity () of around 220 kW/h for both modes.
Comparing the Time-Constrained Strategy (TCS) against the Energy-Targeted Strategy (ETS) reveals a key insight. In the Schedule-Compliant (SCC) mode, where vehicles arrive typically with low State of Charge (SOC), the fixed 45 min break of TCS results in lower values than the ETS for both power demand and occupancy as reaching the 80% SOC target takes significantly longer. On the other hand, the Anxiety-Driven Charging (ADC) drivers, influenced by range anxiety, statistically arrive with higher SOCs. Consequently, the Energy-Targeted Strategy allows them to reach their 80% SOC target and depart in a shorter time than TCS, where drivers are forced into an unnecessary overstay to complete the mandatory 45 min break, which artificially inflates station occupancy and power demand. This demonstrates that for stochastic, anxiety-driven traffic, flexible, energy-based charging targets are far more efficient than rigid, time-based regulatory breaks, improving overall infrastructure throughput. This trend is even more pronounced in the 2030 scenario (
Figure 5).
As fleet electrification increases by 2030, the results between the two behavioral models diverge significantly. The boxplots in
Figure 5 reveal that extreme stochastic outliers can push concurrent power demand as high as 3.5 MW under the SCC model, compared to a 2.5 MW maximum for the ADC model. However, analyzing the metrics in
Table 6 reveals the statistical expected values: the average daily peak (
) for the SCC-TCS model settles at 2318.5 kW, driven by the synchronized arrivals of schedule-compliant drivers, which generates an aggressive Ramping Intensity (
) of 419.2 kW/h. Conversely, the behavioral dispersion inherent to the ADC-TCS model smooths the load curve, reducing the expected
to 1732.7 kW and flattening
to 290.8 kW/h. This disparity extends to station occupancy, where SCC presents concurrent charging for up to 11 trucks (max outlier in
Figure 5), while ADC estimates a maximum of nine simultaneously charging vehicles. In the ETS case, this disparity is even more pronounced; as empty SCC trucks overstay to reach 80% SOC, anxious ADC trucks reach the target quickly. This amplifies the divergence across both load demand and occupancy metrics.
4.2. Case 2: Sensitivity to Off-Shift Integration
The integration of off-shift charging behaviors alters the station’s operational profile. Because a portion of the vehicles park for extended periods (e.g., 8 h rests) and draw a limited, steady 50 kW slow charge, the high-power assets (350+ kW) are frequently underused. This results in an effective peak shaving and valley filling dynamic, flattening the overall load distribution across the 24 h cycle.
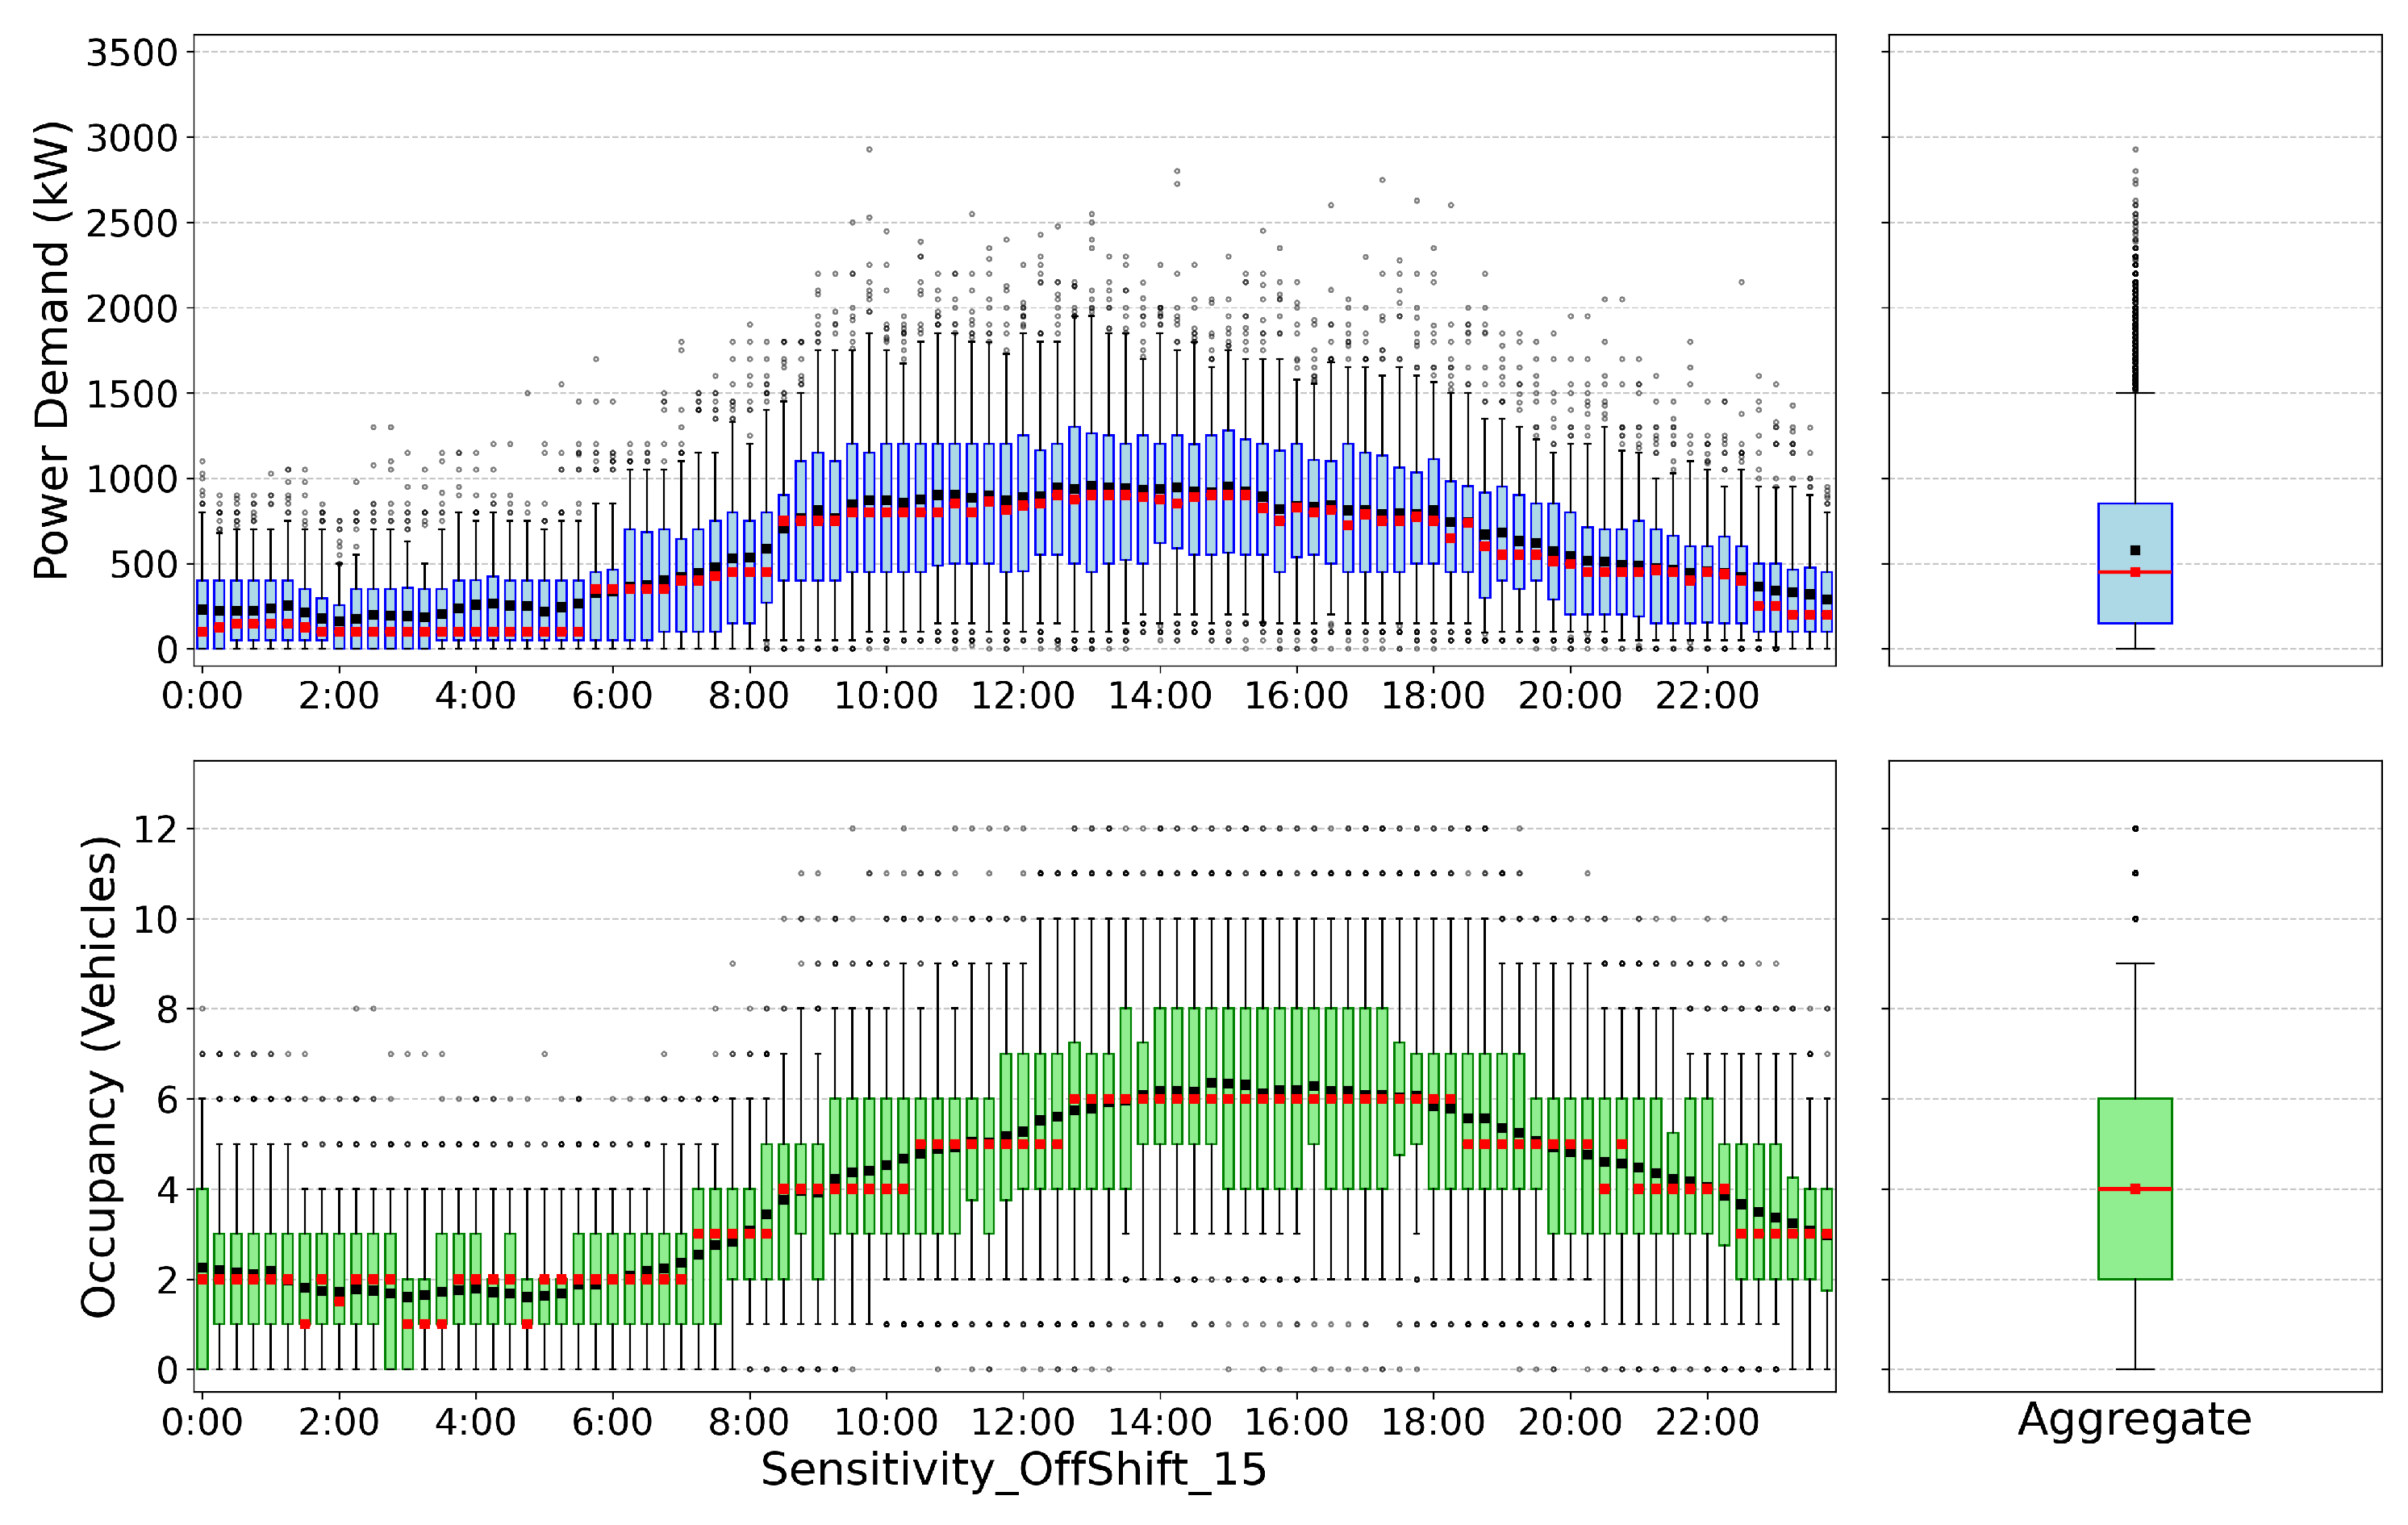
Figure 6 shows an off-shift integration scenario assuming a 15% probability of arriving vehicles engaging in off-shift behavior, with a SCC behavior and TCS strategy, scenario 2030: it displays how the aggregate power demand profile undergoes a significant transformation compared to a purely mid-shift system (see
Figure 5a) in terms of reduced power demand peaks and increased occupancy levels.
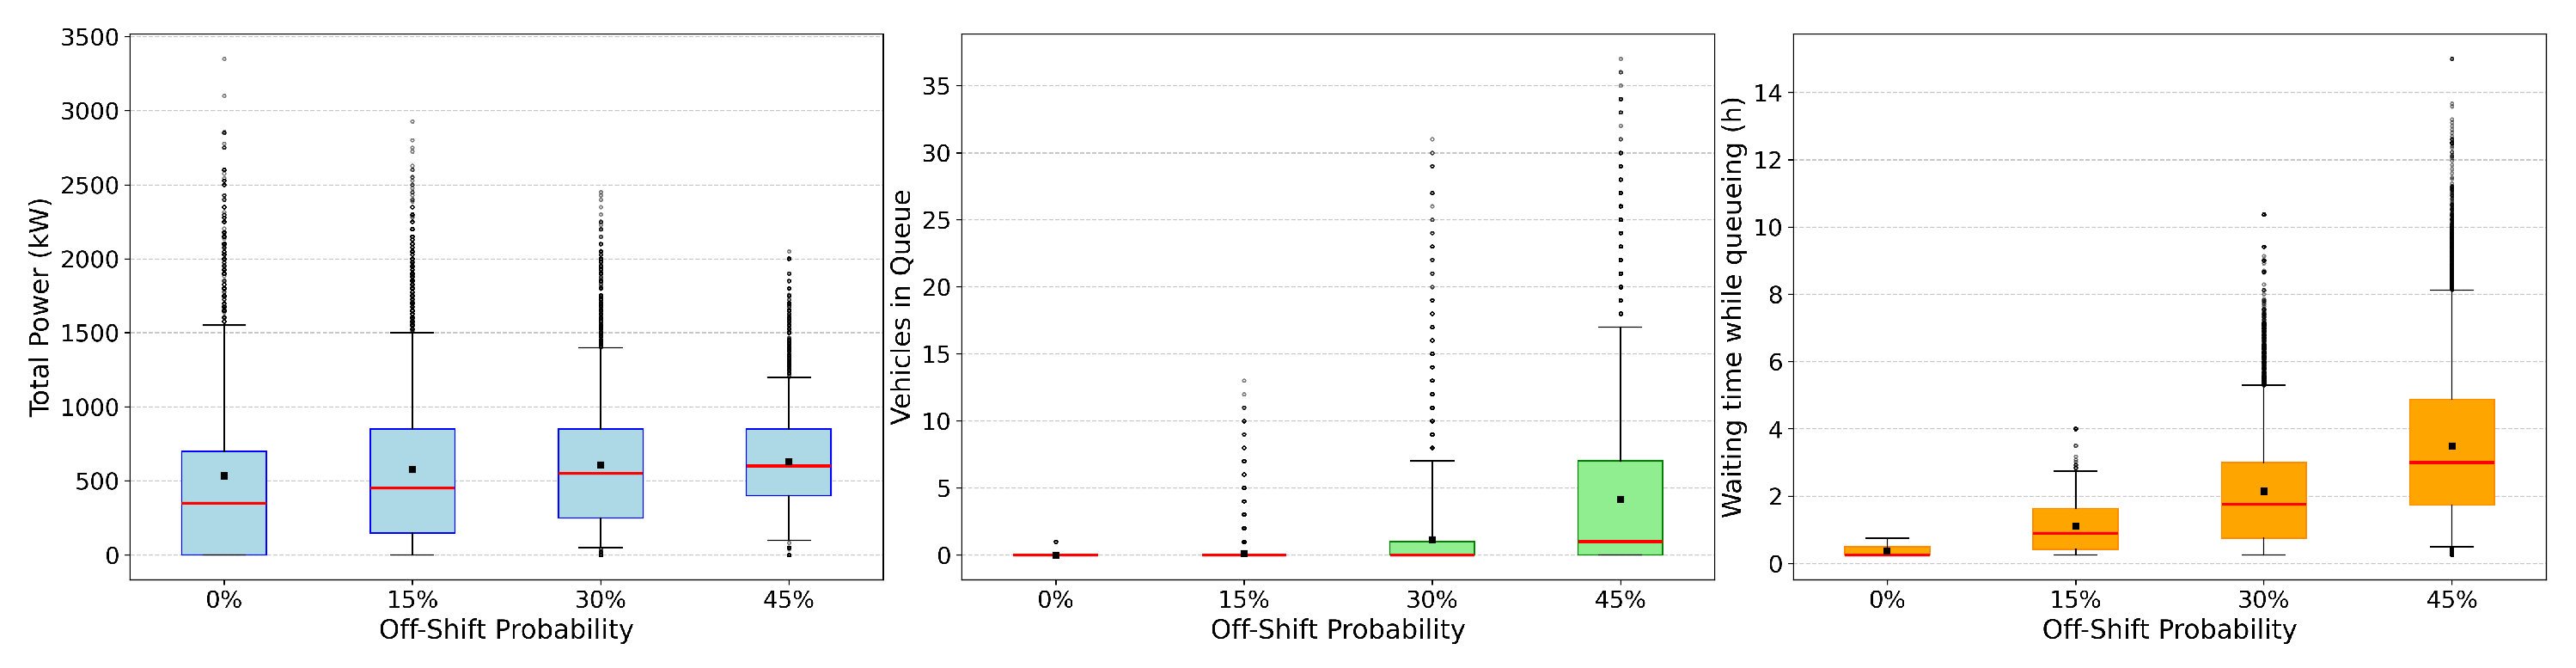
We performed a sensitivity analysis, treating the off-shift probability as a variable (up to 45%) to inspect the overall impact of off-shift breaks in the charging station utilization.
What can be observed visually in
Figure 7 is that as the proportion of off-shift vehicles increases, a saturation effect emerges. The boxplots indicate that while extreme peak power spikes are slightly dampened, the median and lower quartiles of total power demand are driven upward due to the elimination of idle periods. This visual trend is quantitatively confirmed by the metrics in
Table 7. Integrating a 45% off-shift probability effectively shaves the expected daily peak (
) from 2318.5 kW down to 1631.1 kW, and significantly improves the Load Factor (
) from 24.1% to 39.3%. From the definition of the Load Factor
(
14), this implies an increase in the daily median power served by the charging station from 558.7 kW to 641.02 kW. Yet, this high exploitation of the station’s electrical capacity comes at a severe spatial cost. The extended 8 h dwell times lock up the charging bays, causing the expected daily maximum queue (
) to surge from a negligible 0.1 vehicles to nearly 16 vehicles. This mathematical reality confirms that while the electrical grid benefits heavily from off-shift load spreading, the physical infrastructure (parking slots) quickly becomes the critical bottleneck.
4.3. Case 3: Charge Control
In the charge control case, we compared a 100% flat charging curve against a mix of SOC-dependent charging profiles (Early Taper, Standard, Flat).
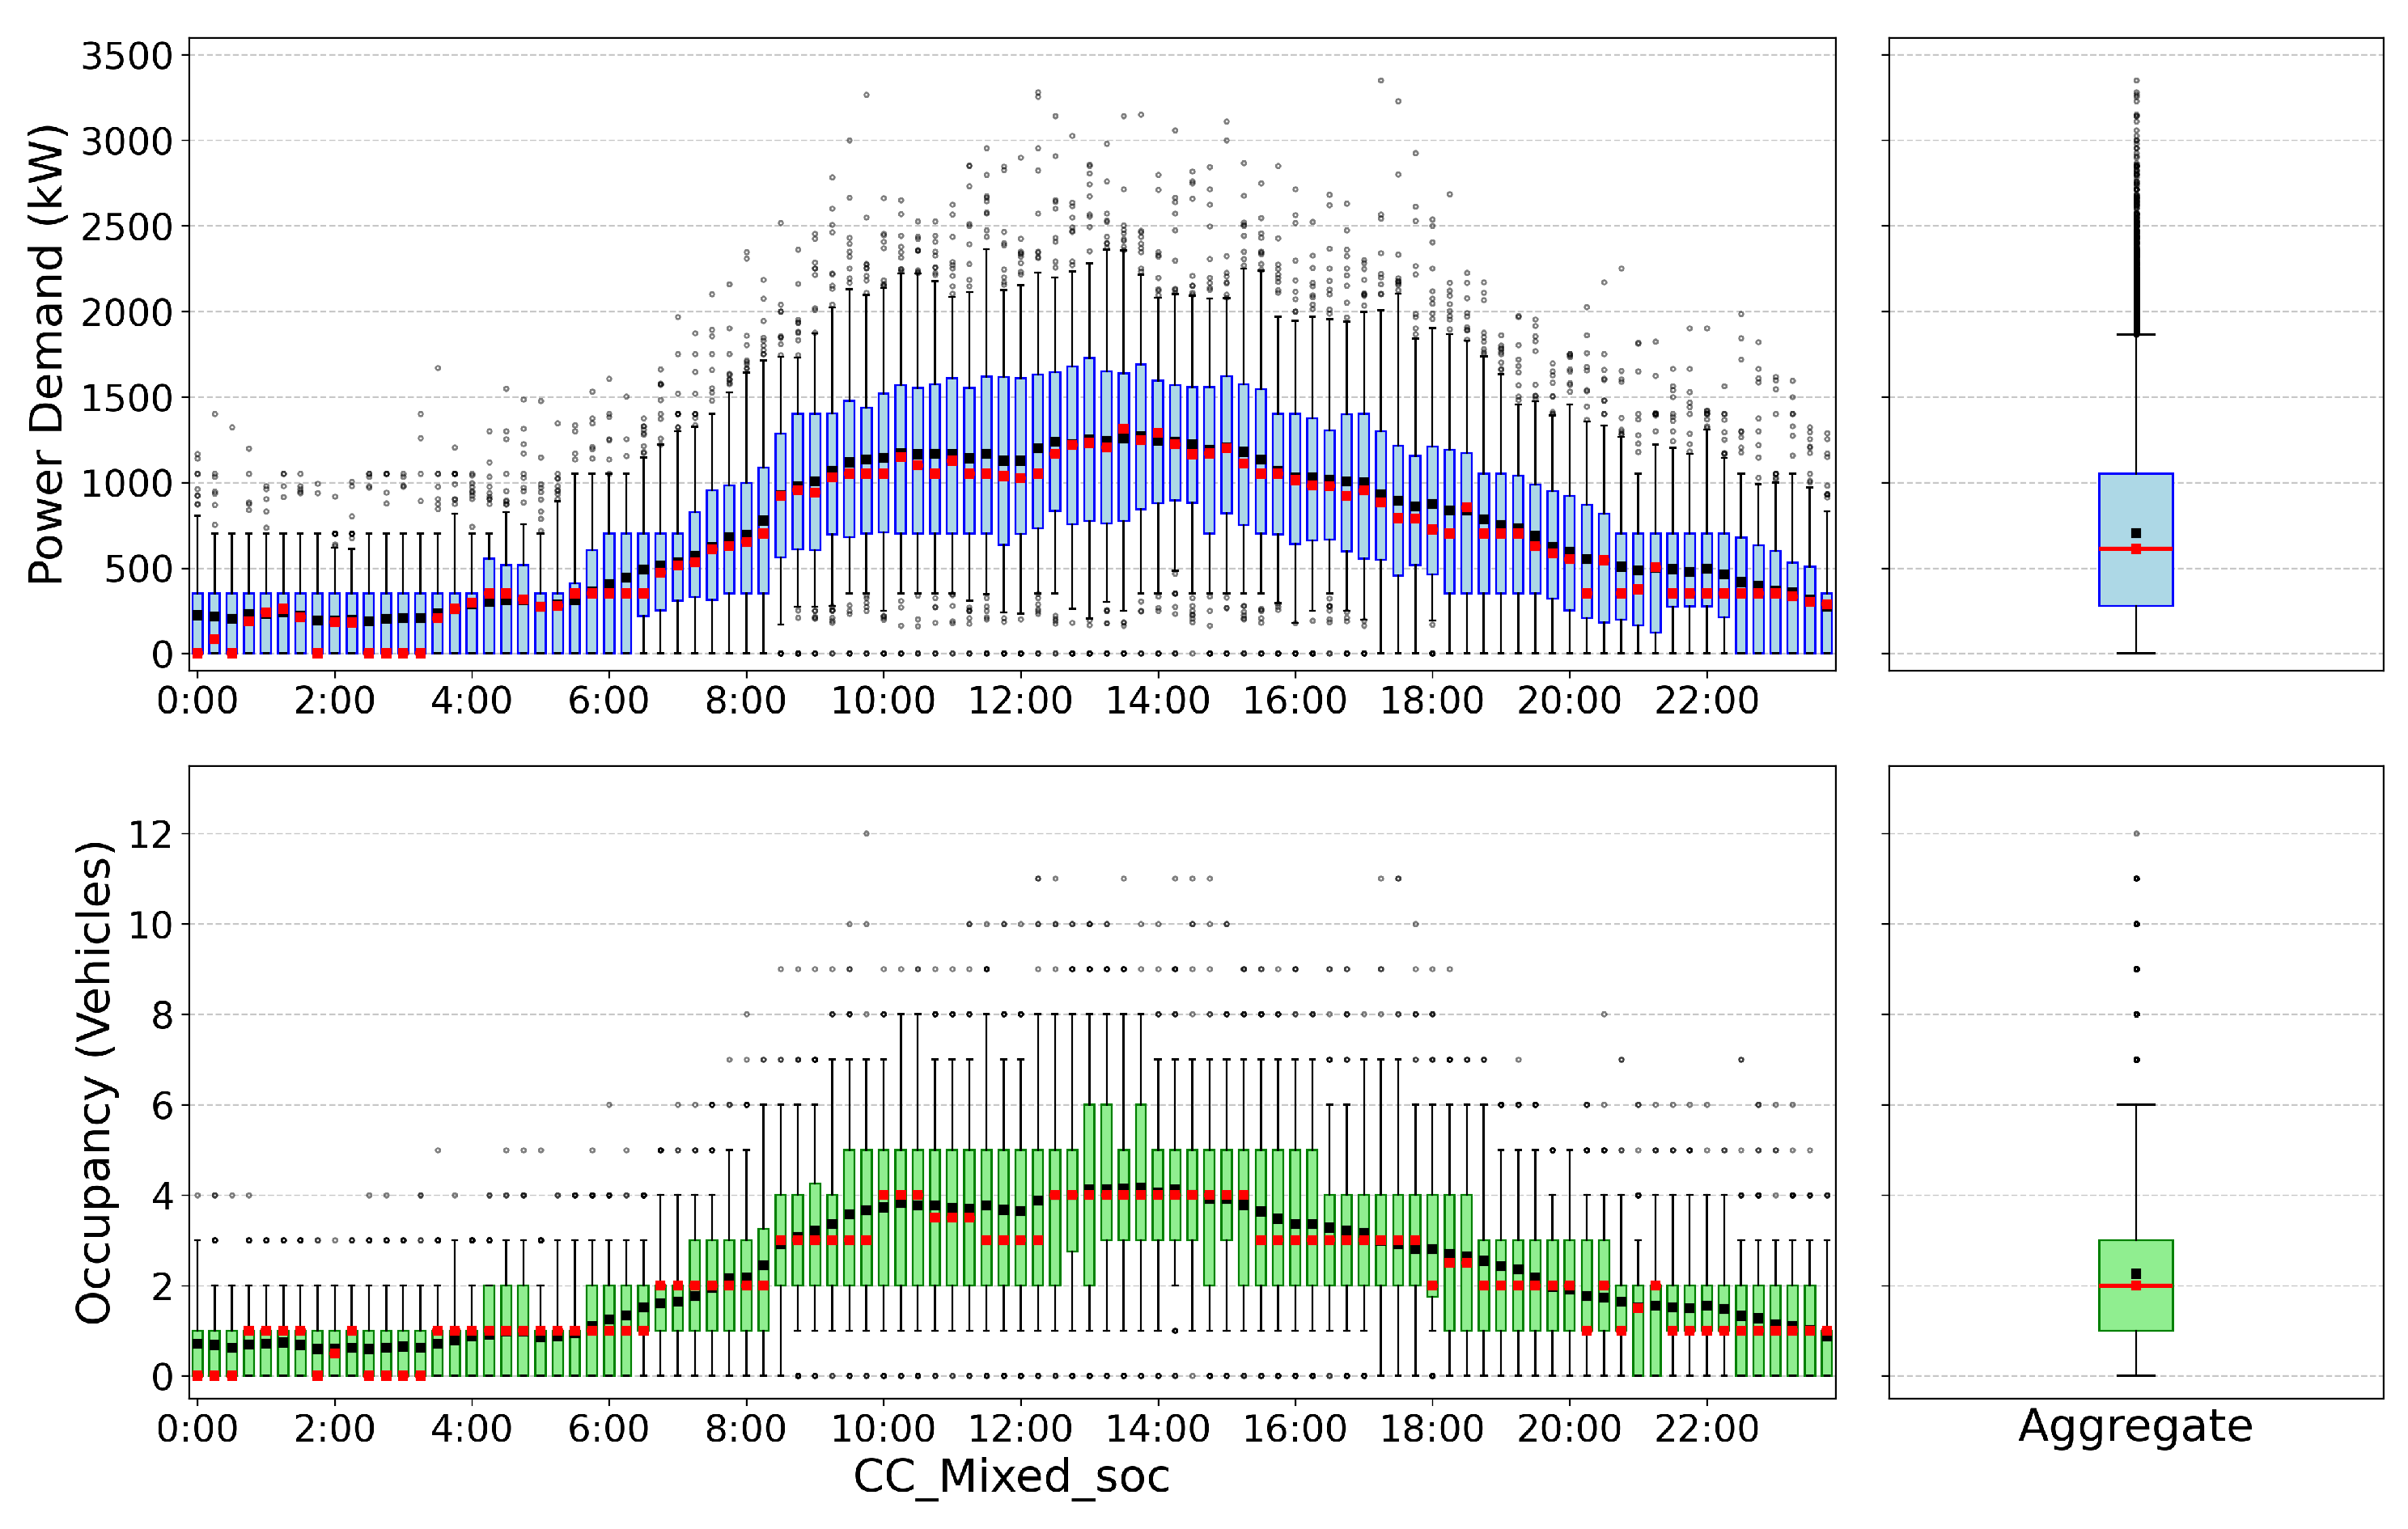
In
Figure 8, showing results related to the 2030 scenario with SCC behavior and TCS strategy, the boxplots illustrate that while the overall spread of station occupancy stays roughly similar across flat and mixed models, the extreme power demand outliers are noticeably curtailed when compared to the corresponding case with flat intra-session profiles (
Figure 5a). Quantitatively, as detailed in
Table 8, the integration of mixed profiles yields a moderate reduction in the expected daily peak (
drops from 2318.5 kW to 2277.7 kW).
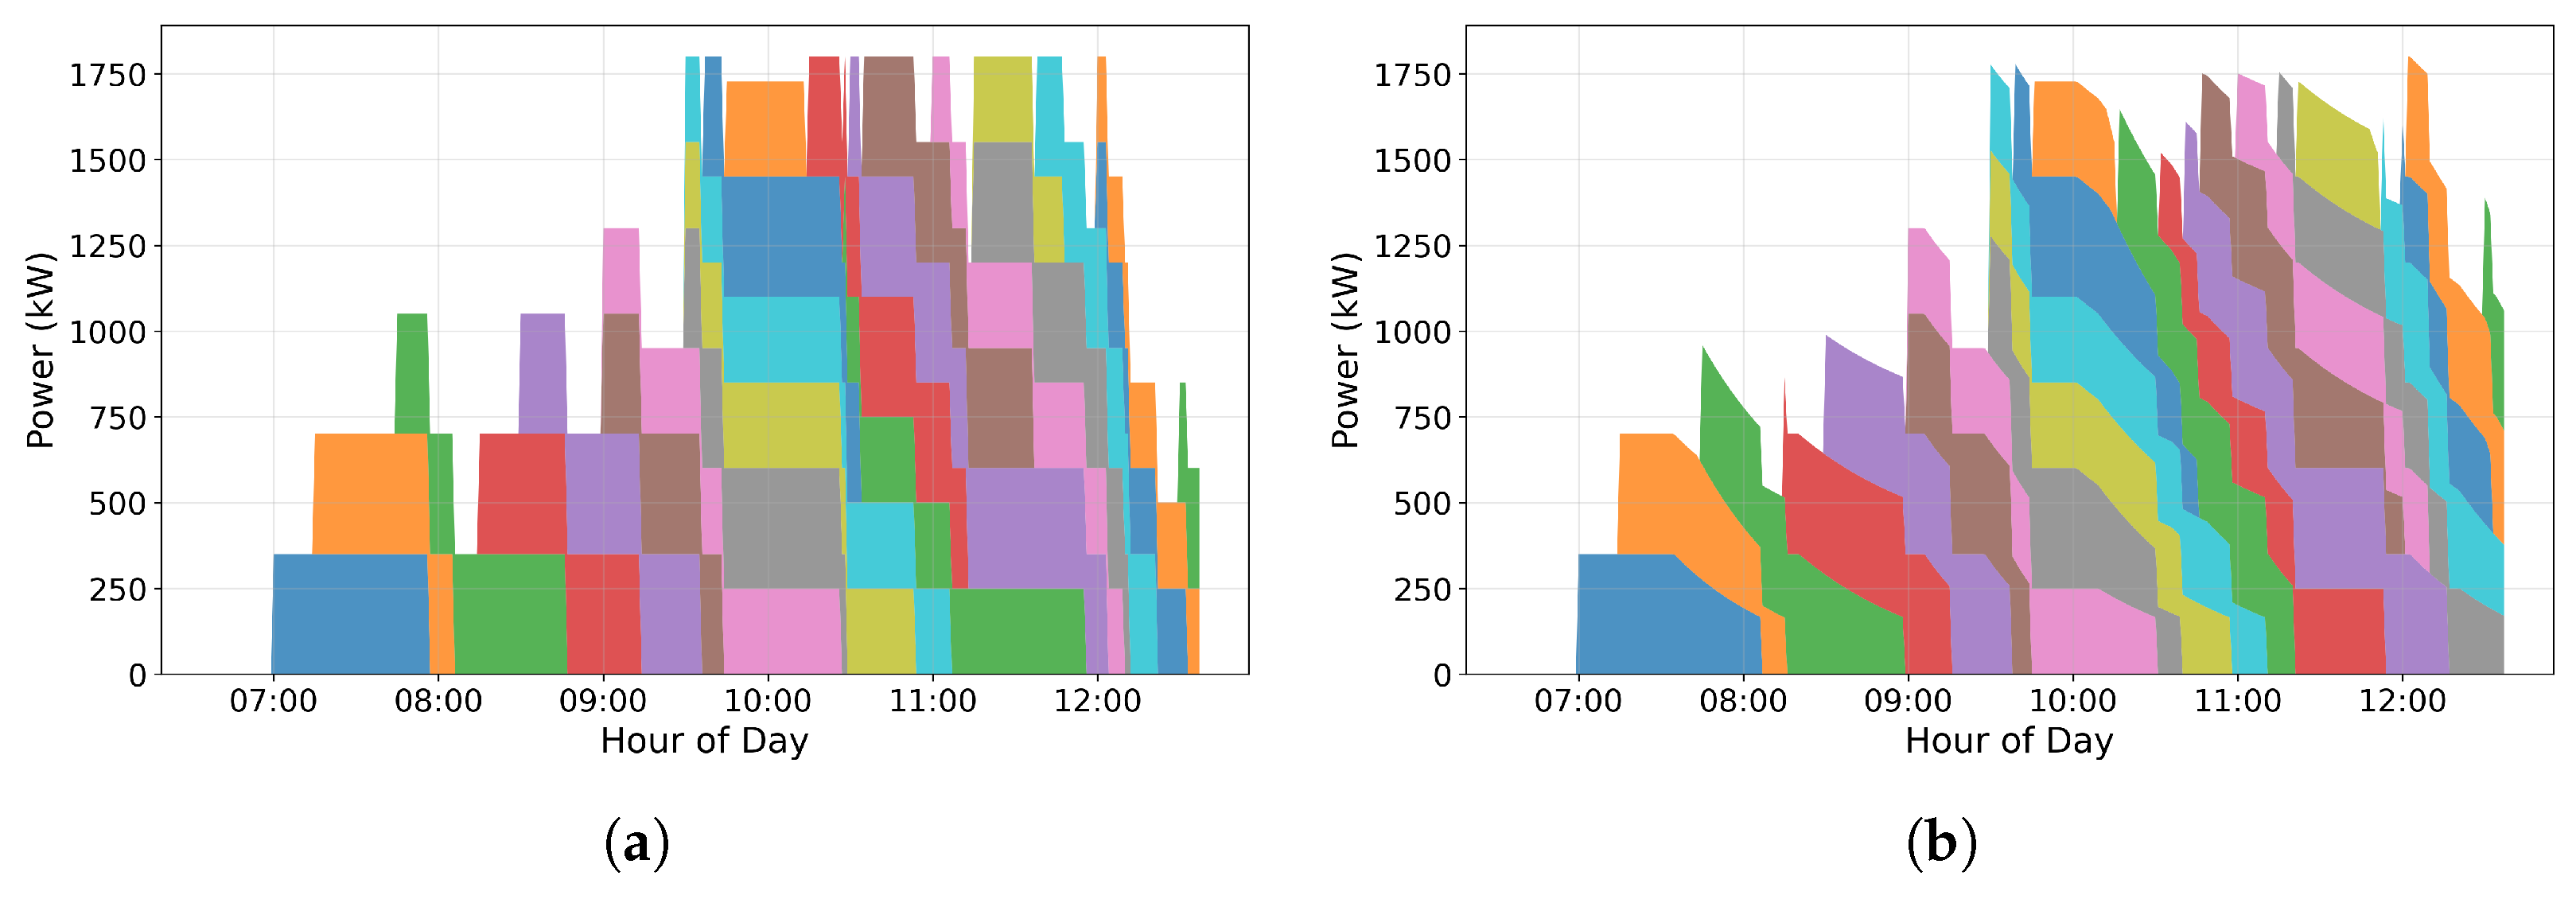
However, the true value of accurate profile modeling is evident in the high-resolution time domain. A zoomed-in timeline comparison of the station’s aggregate load (
Figure 9), where the focus is on one of the two charging stations, with SCC and TCS approaches, reveals the impact of the piecewise linear profiles defined in
Section 2.2.4. As individual vehicles approach their target SOC, their Battery Management Systems (BMS) artificially reduce the power draw. Unlike the case where all the vehicles follow the same flat charging profile and where the aggregate load would appear as a sum of discrete steps, the realistic demand model shows the power demand gradually declining as vehicles approach their target SOC. This intra-step charging characterization results in a significant benefit for grid management: because vehicles do not all reach their peak power acceptance simultaneously, the actual peak demand observed at the station level is lower than the theoretical maximum.
4.4. Case 4: Sensitivity to Assumptions
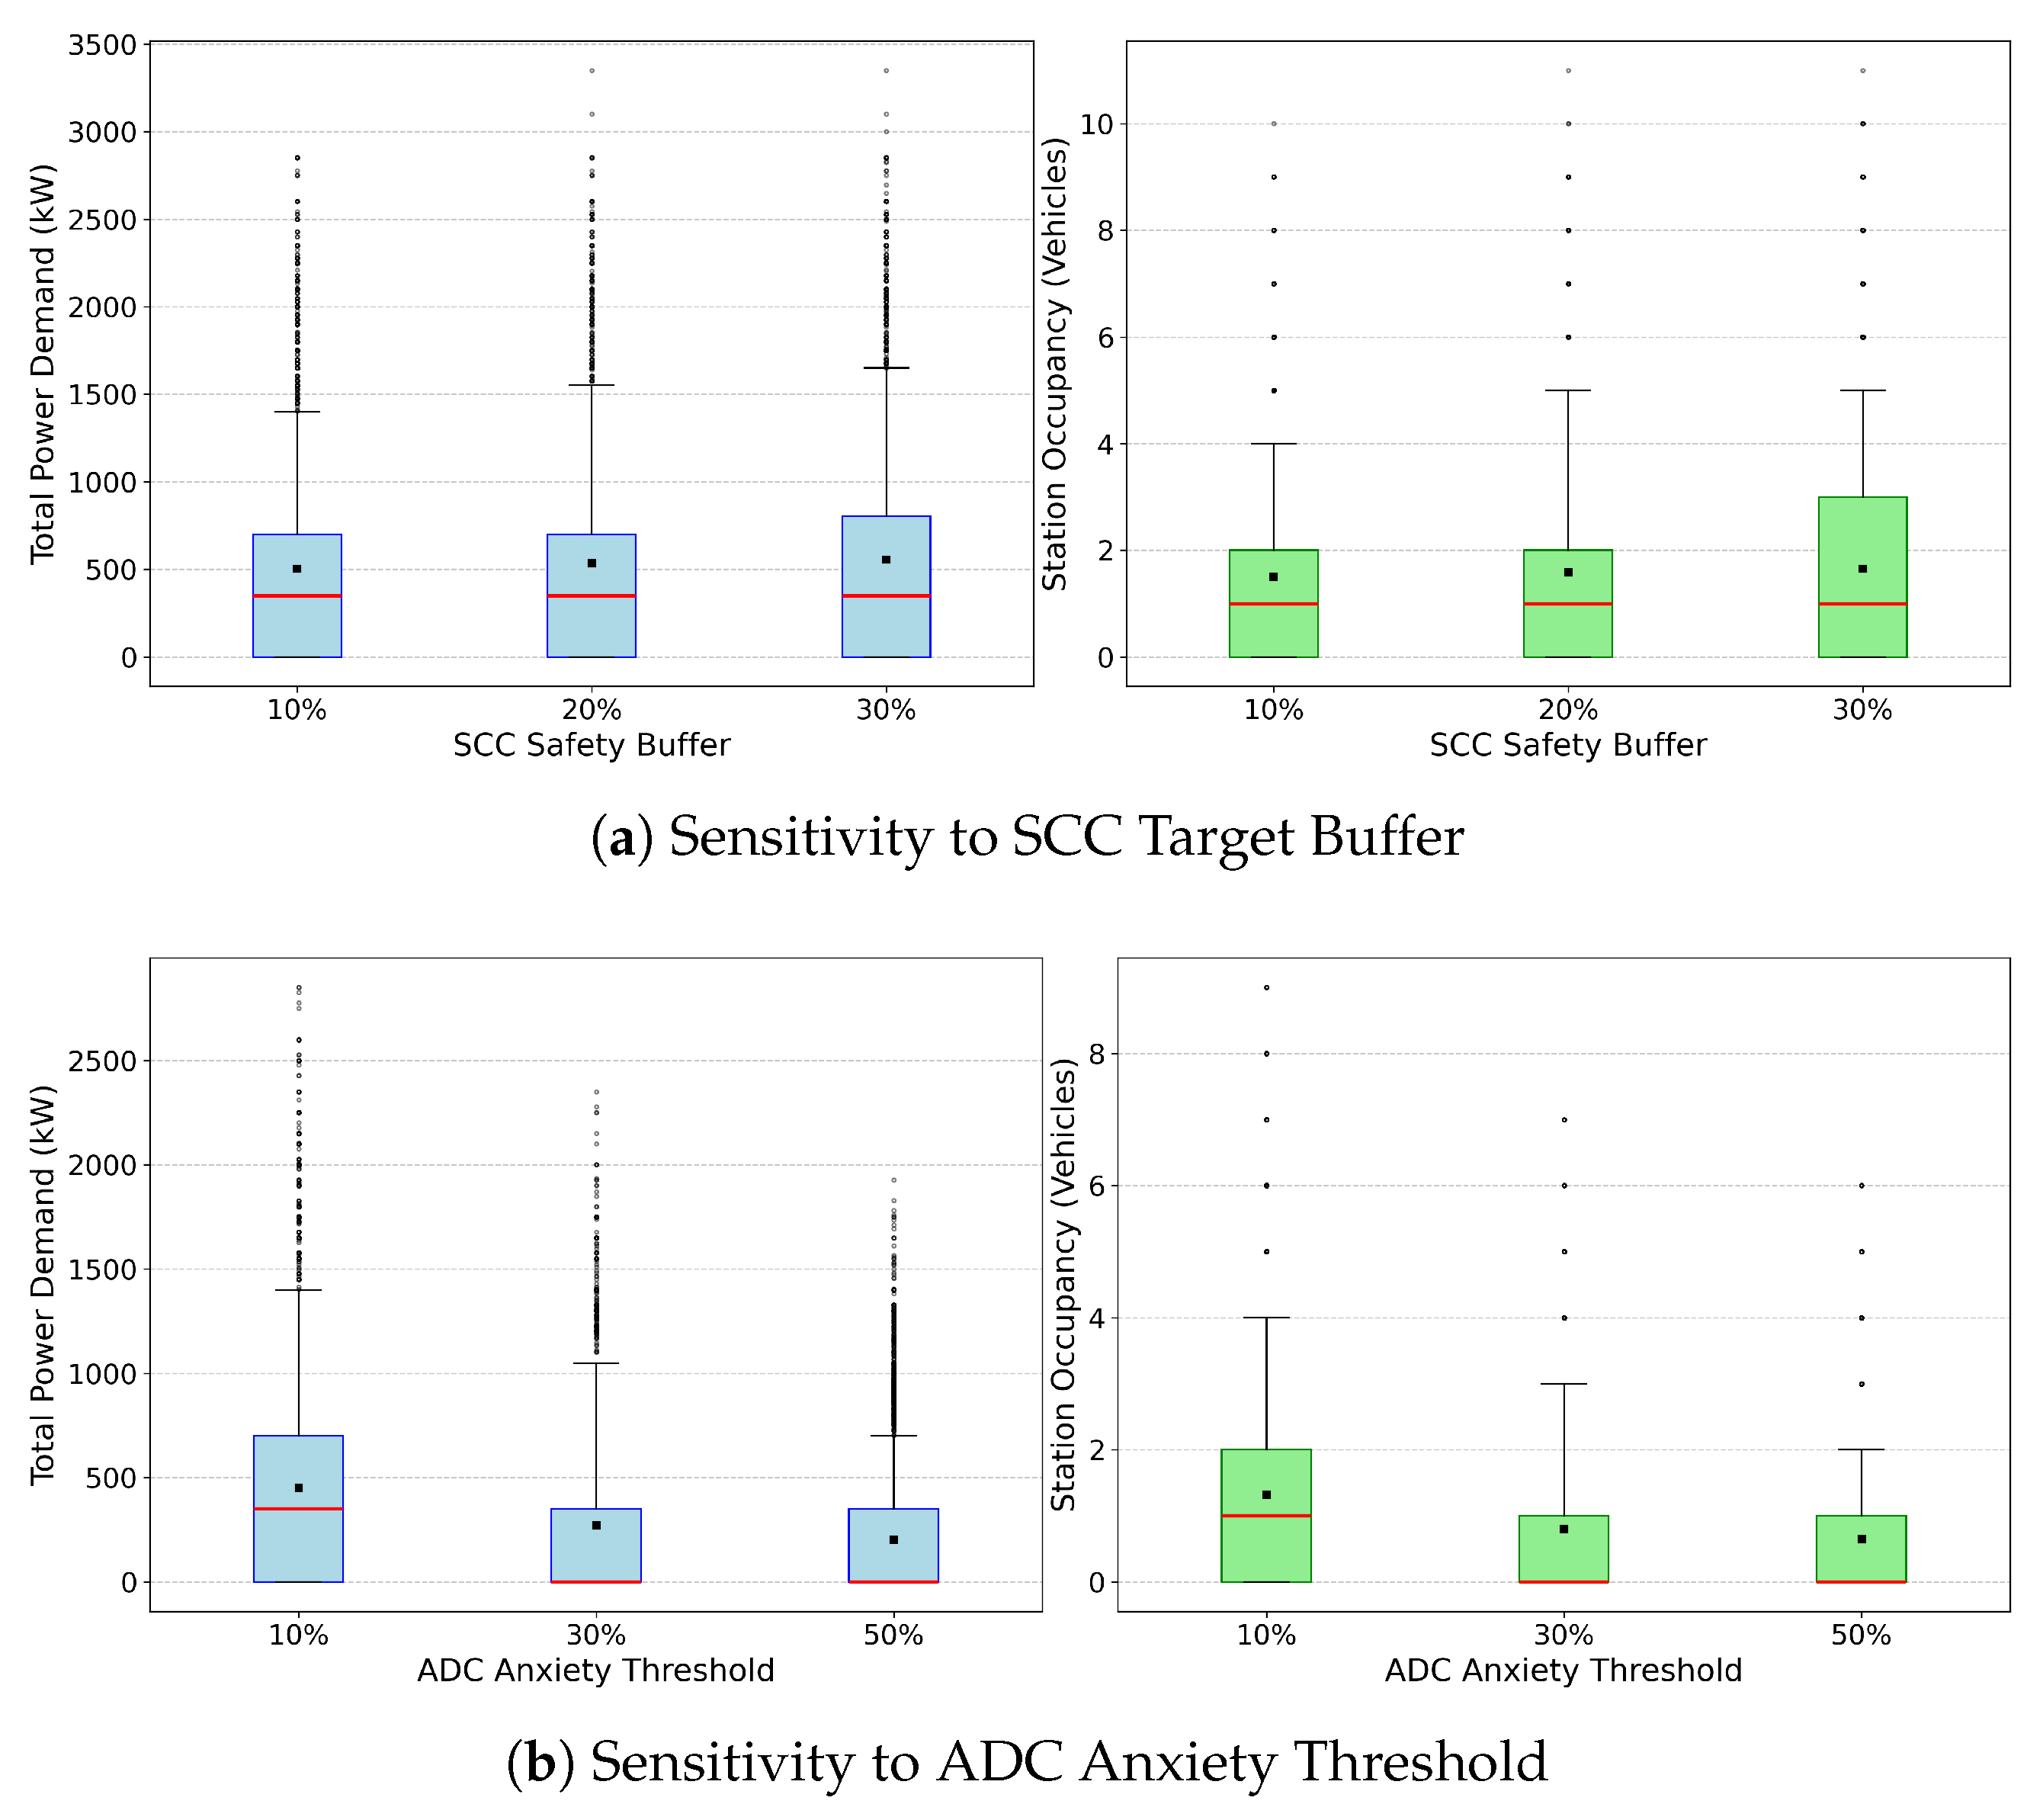
To ensure the reliability of the agent-based logic and quantify the impact of behavioral uncertainties, a dedicated parametric sensitivity analysis was conducted on the core decision triggers: the Anxiety-Driven Charging comfort threshold (
) and the Schedule-Compliant Charging safety buffer (
). Unlike the infrastructural focus in the previous cases, this analysis serves as an internal methodological analysis to inspect the assumptions defined in
Section 2.2.1.
Figure 10 illustrates the system’s response to varying these behavioral parameters, specifically tracking total power demand and aggregate station occupancy. As observed in subplot (a), the Schedule-Compliant Charging (SCC) model proves to be highly robust against variations in the assigned safety buffer. The quantitative data in
Table 9 confirms this stability: the expected daily peak (
) fluctuates by only about 7% (from 2214.0 kW to 2376.0 kW) across the tested buffer range. Because the dominant charging trigger in SCC remains the rigid adherence to the 4.5 h statutory driving schedule, increasing the energy buffer slightly raises the overall power demand but preserves the core temporal structure of the load. Conversely, subplot (b) demonstrates that the Anxiety-Driven Charging (ADC) model is highly sensitive to the driver’s comfort threshold.
Table 9 reveals that increasing the anxiety threshold causes the expected
to drop by over 35% (from 2074.8 kW to 1344.3 kW). This is motivated by an increased behavioral randomness: highly anxious drivers stop more frequently for shallow battery refills rather than using the full battery capacity. This stochasticity effectively distributes the power demand both spatially (among all charging stations located along the highway corridor) and temporally. By reducing schedule-based synchronization of arrivals, daily energy use spreads more evenly and yields a flatter load profile with lower peak demand.
5. Discussion
The simulation results highlight that forecasting high-power charging demand for HDVs requires moving beyond simplistic assumptions. As demonstrated across the various scenarios, the interplay between driver behavior, battery management and infrastructure availability can alter expected load profiles.
In early adoption phases (Scenario 2025), different behavioral models yield similar charging patterns. However, as electrification scales and infrastructure density increases (as projected for 2030), the divergence between Schedule-Compliant Charging (SCC) and Anxiety-Driven Charging (ADC) becomes prominent. Enhanced station availability naturally reduces driver range anxiety, allowing for more flexible charging decisions and a more efficient distribution of load across the infrastructure. In contrast, rigid adherence to regulatory breaks (SCC) inflates concurrent charging peaks. This highlights the sensitivity of load forecasting to behavioral assumptions: while the SCC model provides a conservative upper bound suitable for worst-case capacity planning, the ADC model offers an insight into how flexible decision-making can optimize infrastructure utilization.
Future validation against empirical data from early electric truck deployments will be essential to calibrate these behavioral models accurately. Until then, the sensitivity analysis indicates that for fleet-managed logistics, captured by the SCC mode, the simulation provides robust and stable projections, with expected peaks remaining consistent despite variations in operational safety buffers. However, as the system moves toward behavior-driven charging (ADC), the precise characterization of the driver becomes increasingly relevant for load forecasting. Notably, the results show that this behavioral dispersion presents a potential for shaving load profiles and promoting more uniform infrastructure utilization compared to the rigid synchronization of statutory breaks, with the expected absolute daily peak reduced by nearly 40% (from 2672.5 kW down to 1605.1 kW in the ETS 2030 scenario). These quantitative findings confirm that while logistic scheduling threatens to overwhelm local grid nodes, driver-level flexibility can act as a natural mechanism of load shifting that must be captured in high-resolution infrastructure planning.
Further methodological context can be drawn from macroscopic transport energy models, such as the work of Ingelström et al. [
18], which models long-haul HDV charging across Southern Sweden. Analysis of their published dataset for public charging reveals a highly smoothed, system-wide load profile with a Load Factor of approximately 61% and a regional peak-to-valley demand ratio of 7.7. While such macro-spatial aggregation, coupled with simplifying assumptions like unconstrained charger access, is highly effective for capturing the total energy volume across a vast area, it inherently smooths out local extremes, precluding a direct numerical cross-validation. Our node-specific ABChargingSim framework uncovers this hidden localized stress. Under the rigid, externally defined breaks of the Schedule-Compliant Charging (SCC) model, synchronized arrivals cause sharp load spikes at the specific highway node, resulting in a much more volatile profile where demand frequently drops to zero during night (an effectively infinite peak-to-valley ratio) and the Load Factor falls to 24.1% (where peak demand is over four times the median). This demonstrates that macro-level spatial models may significantly underestimate the grid connection capacity required for individual highway stations. Furthermore, the simulation highlights how internal fleet dynamics shape this localized peak as discussed previously with the SCC vs ADC comparison.
Traditional models often assume a constant demand for vehicle charging, which significantly simplifies the impact of charging sessions on the grid. By integrating SOC-dependent charging profiles, our simulations reveal an intrinsic tapering effect. As individual vehicles approach their target SOC, their Battery Management Systems (BMS) naturally reduce power intake. This intra-session diversity provides built-in peak shaving, suggesting that infrastructure planners can support a higher volume of vehicles with a given grid connection capacity simply by acknowledging the natural tapering effect of modern BMSs. Whereas the impact can be quantitatively low (a 1.7% reduction in expected daily peak in the 2030 SCC-TCS scenario and 4.1% reduction in the SCC-ETS scenario), this reduction can bring significant savings in charging station design and grid connection approval timelines. Additionally, the lower average power draw during tapering slightly increases station occupancy, showing that the choice of charging profile bounds the trade-off between peak power and station utilization.
Moreover, future projections of different types of demand show a fundamental tension in the planning of future charging infrastructure: the trade-off between electrical capacity (Grid) and spatial capacity (Land). Traditionally, securing a multi-megawatt grid connection in rural or topologically constrained areas has been viewed as the primary barrier to MCS deployment. Integrating off-shift behavior significantly alleviates this constraint as demonstrated in
Table 7, with a potential reduction in expected peak demand of 6%, and an improvement of the overall load factor up to 27.6% in the benchmark case of probability of off-shift charging equal to 15%. This scenario would offer substantial savings on costly substation upgrades. Yet, this grid-side relief imposes a severe spatial penalty. The sensitivity analysis demonstrates that as the proportion of off-shift charging grows, the station’s service shifts from being energy-constrained to time-constrained. An off-shift vehicle occupies a charging bay for up to 8 h, compared to less than an hour for a mid-shift vehicle. Consequently, physical queue lengths grow exponentially (from almost non-existent in case of 0% off-shift, to almost 16 vehicles in case of 45% off-shift probability), requiring significantly more land for parking slots. This has profound implications for land-use planning, particularly in geographically constrained regions like Norway. Furthermore, this dynamic challenges the conventional business models of CPOs, which rely on high energy turnover (kWh sold per minute) to amortize capital-intensive high-power chargers. Allowing vehicles to occupy a megawatt-capable bay for hours while drawing only 50 kW severely diminishes the asset’s return on investment. Mandating high power output for every charging point may inadvertently force CPOs to over-invest in electrical capacity while lacking physical parking space. To resolve this tension, future infrastructure should pivot toward the development of Hybrid Hubs, where two zones may be served by the same grid connection but are designed to accommodate different charging behaviors and power requirements:
MCS Zone: A concentrated cluster of Megawatt Charging System (MCS) bays dedicated exclusively to mid-shift, urgent charging, served at a premium price to discourage long dwell times.
Overnight Zone: An expansive parking area equipped with low-cost, low-power (50–100 kW) DC chargers, priced competitively to attract off-shift drivers during their mandatory rest periods.
Ultimately, these interconnected dynamics confirm the importance of using probabilistic, multi-faceted simulations during the initial phases of infrastructure design. By generating representative operational profiles without relying on vast, often unavailable historical datasets, this framework enables planners to stress-test system robustness, identify critical bottlenecks, and uncover efficiency opportunities in heavy-duty vehicle electrification.
6. Conclusions
This study presented an agent-based modeling framework, ABChargingSim, for simulating high-power charging station load profiles for long-haul electric trucks. By integrating real-world telemetry, regulatory dwell-time constraints, and advanced parameters such as off-shift probabilities and intra-session SOC-dependent charging curves, we demonstrated the importance of employing probabilistic, multi-faceted simulations during the initial phases of infrastructure design, allowing planners to stress-test system robustness and pinpoint efficient planning measures even when historical baseline data is severely limited.
More specifically, our scenario analysis across a Norwegian highway corridor (evaluating 2025 and 2030 time horizons) yielded three key findings. First, behavioral models (Schedule-Compliant vs. Anxiety-Driven) produce similar load patterns in early adoption scenarios but diverge significantly as infrastructure scales. In the 2030 high-adoption scenario, the synchronized arrivals of the SCC model produced an expected peak demand () 66% higher than that of the stochastic ADC model. This highlights that SCC provides a conservative upper bound for grid sizing, while ADC offers a more variable operational profile by accounting for driver-level demand dispersion. Second, modeling of off-shift behavior can significantly reduce grid peak power requirements, causing savings in grid connection costs, though at the expense of drastically increased parking space requirements. Specifically, introducing a 45% probability for off-shift charging reduced grid-side peak demand by 30%. However, the increased station occupancy led to non-linear growth in queue lengths for mid-shift traffic, quantifying the direct trade-off between optimizing for grid connection costs and ensuring sufficient spatial capacity for serving vehicles. Finally, the integration of SOC-dependent charging profiles illustrates a natural tapering effect. The power reduction as batteries approach a full state of charge introduces demand variations at the plug level, which inherently desynchronizes the aggregate load and results in a peak demand reduction of 1.8% under the TCS strategy and 4.1% under the ETS strategy in the 2030 scenario.
In conclusion, a key finding of this study is that future heavy-duty charging infrastructure should not be designed solely around electrical peak power but must adopt a holistic approach capable of resolving the non-linear trade-offs between grid-side capacity, driver behavioral patterns, and the spatial and operational constraints of the charging station’s site. Frameworks like ABChargingSim serve as essential decision-support tools to balance these complex interdependencies, guiding the robust design and cost-effective dimensioning of future charging networks across broader European TEN-T corridors.
A recognized limitation of the present study is the absence of empirical validation against real-world MCS charging logs, which are not yet available due to the early adoption stage of long-haul electric truck fleets. Future work will therefore prioritize validating these simulated load profiles and SOC-dependent curves against data from emerging Megawatt Charging System (MCS) pilot projects. Furthermore, we aim to integrate economic layers to simulate price-driven behavioral changes and refine agent decision-making parameters based on real-world driver behavior studies.
Author Contributions
Conceptualization and methodology, M.G.; software, validation, formal analysis, investigation and data curation, M.G. and I.B.S.; writing—original draft preparation, M.G. and I.B.S.; writing—review and editing, M.G., I.B.S. and O.A.H.; visualization, M.G.; supervision, project administration and funding acquisition, O.A.H. All authors have read and agreed to the published version of the manuscript.
Funding
This research was funded by the Research Council of Norway grant number 346825 under project MegaCharge.
Data Availability Statement
The datasets generated in this study are available from the authors upon request.
Conflicts of Interest
Michele Garau, Ida Buttingsrud Stokke and Odd André Hjelkrem were employed by SINTEF Energy Research AS. All authors declare that the research was conducted in the absence of any commercial or financial relationships that could be construed as a potential conflict of interest.
References
- Garau, M.; Stokke, I.B.; Hjelkrem, O.A. Load profiles of charging stations for long-haul electric trucks. In Proceedings of the 38th International Electric Vehicle Symposium and Exhibition, Gothenburg, Sweden, 15–18 June 2025. [Google Scholar]
- Updated Status of Zero-Emission Vehicles. Available online: https://www.vegvesen.no/fag/fokusomrader/baerekraftig-mobilitet/nullutslippsmalene/ (accessed on 20 April 2026).
- Regulation (EU) 2023/1804 of the European Parliament and of the Council on the Deployment of Alternative Fuels Infrastructure, and Repealing Directive 2014/94/EU. 2023. Available online: https://eur-lex.europa.eu/eli/reg/2023/1804/oj (accessed on 20 April 2026).
- Tietz, T.; Fay, T.A.; Schlenther, T.; Göhlich, D. Electric Long-Haul Trucks and High-Power Charging: Modelling and Analysis of the Required Infrastructure in Germany. World Electr. Veh. J. 2025, 16, 96. [Google Scholar] [CrossRef]
- Zuo, W.; Li, K. Reliability Assessment of Integrated Power and Road System for Decarbonizing Heavy-Duty Vehicles. Energies 2024, 17, 934. [Google Scholar] [CrossRef]
- Garau, M.; Torsæter, B.N. A methodology for optimal placement of energy hubs with electric vehicle charging stations and renewable generation. Energy 2024, 304, 132068. [Google Scholar] [CrossRef]
- Gonzalez Venegas, F.; Petit, M.; Perez, Y. Active Integration of Electric Vehicles into Distribution Grids: Barriers and Frameworks for Flexibility Services. Renew. Sustain. Energy Rev. 2021, 145, 111060. [Google Scholar] [CrossRef]
- Amara-Ouali, Y.; Goude, Y.; Massart, P.; Poggi, J.M.; Yan, H. A Review of Electric Vehicle Load Open Data and Models. Energies 2021, 14, 2233. [Google Scholar] [CrossRef]
- Danese, A.; Torsæter, B.N.; Sumper, A.; Garau, M. Planning of High-Power Charging Stations for Electric Vehicles: A Review. Appl. Sci. 2022, 12, 3214. [Google Scholar] [CrossRef]
- Zhai, Z.; Su, S.; Liu, R.; Yang, C.; Liu, C. Agent–Cellular Automata Model for the Dynamic Fluctuation of EV Traffic and Charging Demands Based on Machine Learning Algorithm. Neural Comput. Appl. 2019, 31, 4639–4652. [Google Scholar] [CrossRef]
- Garau, M.; Torsæter, B.N. Agent-Based Analysis of Spatial Flexibility in EV Charging Demand at Public Fast Charging Stations. In Proceedings of the 2021 IEEE Madrid PowerTech, Madrid, Spain, 28 June–2 July 2021; pp. 1–6. [Google Scholar] [CrossRef]
- Macaluso, P. Estimating Charging Demand by Modelling EV Drivers’ Parking Patterns and Habits. Eur. Transp. Eur. 2023, 90, 1–14. [Google Scholar] [CrossRef]
- Borlaug, B.; Muratori, M.; Gilleran, M.; Woody, D.; Muston, W.; Canada, T.; Ingram, A.; Gresham, H.; McQueen, C. Heavy-duty truck electrification and the impacts of depot charging on electricity distribution systems. Nat. Energy 2021, 6, 673–682. [Google Scholar] [CrossRef]
- Speth, D.; Plötz, P.; Funke, S.; Vallarella, E. Public Fast Charging Infrastructure for Battery Electric Trucks—a Model-Based Network for Germany. Environ. Res. Infrastruct. Sustain. 2022, 2, 025004. [Google Scholar] [CrossRef]
- Menter, J.; Fay, T.A.; Grahle, A.; Göhlich, D. Long-Distance Electric Truck Traffic: Analysis, Modeling and Designing a Demand-Oriented Charging Network for Germany. World Electr. Veh. J. 2023, 14, 205. [Google Scholar] [CrossRef]
- Klausmann, F.; Otteny, F. Simulation-Based Tool for Strategic and Technical Planning of Truck Charging Parks at Highway Sites. World Electr. Veh. J. 2024, 15, 521. [Google Scholar] [CrossRef]
- Karlsson, J.; Grauers, A. Agent-Based Investigation of Competing Charge Point Operators for Battery Electric Trucks. Energies 2024, 17, 2901. [Google Scholar] [CrossRef]
- Ingelström, M.; Callanan, A.; Márquez-Fernández, F.J. Investigating the Impact of Public En-Route and Depot Charging for Electric Heavy-Duty Trucks Using Agent-Based Transport Simulation and Probabilistic Grid Modeling. World Electr. Veh. J. 2026, 17, 172. [Google Scholar] [CrossRef]
- Hoeven, E.t.; Kwakkel, J.; Hess, V.; Pike, T.; Wang, B.; rht; Kazil, J. Mesa 3: Agent-based modeling with Python in 2025. J. Open Source Softw. 2025, 10, 7668. [Google Scholar] [CrossRef]
- Sánchez, J.M.; Iglesias, C.A.; Sánchez-Rada, J.F. Soil: An Agent-Based Social Simulator in Python for Modelling and Simulation of Social Networks. In Proceedings of the Advances in Practical Applications of Cyber-Physical Multi-Agent Systems: The PAAMS Collection; Lecture Notes in Computer Science; Demazeau, Y., Davidsson, P., Bajo, J., Vale, Z., Eds.; Springer: Cham, Switzerland, 2017; pp. 234–245. [Google Scholar] [CrossRef]
- Fotouhi, Z.; Hashemi, M.R.; Narimani, H.; Bayram, I.S. A General Model for EV Drivers’ Charging Behavior. IEEE Trans. Veh. Technol. 2019, 68, 7368–7382. [Google Scholar] [CrossRef]
- Sun, W.; Xie, E.; Yang, W. Bi-Level Decision-Making for Commercial Charging Stations in Demand Response Considering Nonlinear User Satisfaction. Sustainability 2026, 18, 907. [Google Scholar] [CrossRef]
- Borlaug, B.; Moniot, M.; Birky, A.; Alexander, M.; Muratori, M. Charging needs for electric semi-trailer trucks. Renew. Sustain. Energy Transit. 2022, 2, 100038. [Google Scholar] [CrossRef]
- Montoya, A.; Guéret, C.; Mendoza, J.E.; Villegas, J.G. The electric vehicle routing problem with nonlinear charging function. Transp. Res. Part B Methodol. 2017, 103, 87–110. [Google Scholar] [CrossRef]
- Schücking, M.; Jochem, P. Two-stage stochastic program optimizing the cost of electric vehicles in commercial fleets. Appl. Energy 2021, 293, 116649. [Google Scholar] [CrossRef]
- Underveislading for Tunge Kjøretøy. Available online: https://www.enova.no/bedrift/landtransport/underveislading-for-tunge-kjoretoy/ (accessed on 20 April 2026).
- Registered Vehicles-Statistics 2024. Available online: https://www.ssb.no/en/transport-og-reiseliv/landtransport/statistikk/bilparken (accessed on 20 April 2026).
- Statens Vegvesen. Available online: https://www.vegvesen.no/trafikkdata/start/kart (accessed on 20 April 2026).
- Speth, D.; Sauter, V.; Plötz, P.; Signer, T. Synthetic European Road Freight Transport Flow Data Based on ETISplus. Mendeley Data 2021, 40, 107786. [Google Scholar] [CrossRef]
- Szimba, E.; Kraft, M.; Ihrig, J.; Schimke, A.; Schnell, O.; Kawabata, Y.; Newton, S.; Breemersch, T.; Versteegh, R.; Meijeren, J.; et al. ETISplus Database Content and Methodology. Tech. Rep. 2012, 311. [Google Scholar] [CrossRef]
Figure 1.
UML class diagram of ABChargingSim software architecture.
Figure 1.
UML class diagram of ABChargingSim software architecture.
Figure 2.
Finite State Machine (FSM) representation of TransientVehicleAgent logic.
Figure 2.
Finite State Machine (FSM) representation of TransientVehicleAgent logic.
Figure 3.
The road stretch used in the case study. The 60 km study stretch between the towns of Stjørdal and Verdal is highlighted in red, while the surrounding highway network is shown in orange. The observed HDV charging station in Gråmyra, Levanger, is marked centrally along the coastal terrain.
Figure 3.
The road stretch used in the case study. The 60 km study stretch between the towns of Stjørdal and Verdal is highlighted in red, while the surrounding highway network is shown in orange. The observed HDV charging station in Gråmyra, Levanger, is marked centrally along the coastal terrain.
Figure 4.
Results of the 2025 scenario simulation for the two SOC modeling approaches: (a) Schedule-Compliant Charging (SCC); (b) Anxiety-Driven Charging (ADC). On the left side are the Time-Constrained Strategy Results (TCS) and on the right side are the Energy-Targeted Strategy Results (ETS). Red squares represent the median values, while black squares denote the mean values for each time interval.
Figure 4.
Results of the 2025 scenario simulation for the two SOC modeling approaches: (a) Schedule-Compliant Charging (SCC); (b) Anxiety-Driven Charging (ADC). On the left side are the Time-Constrained Strategy Results (TCS) and on the right side are the Energy-Targeted Strategy Results (ETS). Red squares represent the median values, while black squares denote the mean values for each time interval.
Figure 5.
Results of the 2030 scenario simulation for the two SOC modeling approaches: (a) Schedule-Compliant Charging (SCC); (b) Anxiety-Driven Charging (ADC). On the left side are the Time-Constrained Strategy Results (TCS) and on the right side are the Energy-Targeted Strategy Results (ETS). Red squares represent the median values, while black squares denote the mean values for each time interval.
Figure 5.
Results of the 2030 scenario simulation for the two SOC modeling approaches: (a) Schedule-Compliant Charging (SCC); (b) Anxiety-Driven Charging (ADC). On the left side are the Time-Constrained Strategy Results (TCS) and on the right side are the Energy-Targeted Strategy Results (ETS). Red squares represent the median values, while black squares denote the mean values for each time interval.
Figure 6.
Results of the 2030 scenario simulation with 15% off-shift probability, (Schedule-Compliant Charging and Time-Constrained Strategy).
Figure 6.
Results of the 2030 scenario simulation with 15% off-shift probability, (Schedule-Compliant Charging and Time-Constrained Strategy).
Figure 7.
Sensitivity analysis showing the non-linear relationship between off-shift probability and charging station demand, vehicles in queue and waiting time while queueing.
Figure 7.
Sensitivity analysis showing the non-linear relationship between off-shift probability and charging station demand, vehicles in queue and waiting time while queueing.
Figure 8.
Results of the 2030 scenario simulation with Charge Control-Mixed Profiles (Schedule-Compliant Charging and Time-Constrained Strategy).
Figure 8.
Results of the 2030 scenario simulation with Charge Control-Mixed Profiles (Schedule-Compliant Charging and Time-Constrained Strategy).
Figure 9.
Timeline comparison of the station’s aggregate load, Scenario 2030, SCC-ETS driver behavior models. (a) Flat charging profile. (b) Mixed charging profile (Flat, Standard, Early Taper).
Figure 9.
Timeline comparison of the station’s aggregate load, Scenario 2030, SCC-ETS driver behavior models. (a) Flat charging profile. (b) Mixed charging profile (Flat, Standard, Early Taper).
Figure 10.
Behavioral Parameter Analysis. Distributions of total power demand and station occupancy across varying SCC safety buffers and ADC thresholds for the 2030 scenario.
Figure 10.
Behavioral Parameter Analysis. Distributions of total power demand and station occupancy across varying SCC safety buffers and ADC thresholds for the 2030 scenario.
Table 1.
Synthesis of state-of-the-art HDV charging simulation frameworks in relation to the proposed ABChargingSim framework (PW = Present Work).
Table 1.
Synthesis of state-of-the-art HDV charging simulation frameworks in relation to the proposed ABChargingSim framework (PW = Present Work).
| Ref. | Year | Geographic Context | Target Scope | Modeling Approach | Primary Charging Trigger Logic |
|---|
| [13] | 2021 | USA | Depot Charging | Data-driven | Temporal/Shift-based |
| [14] | 2022 | Germany | Public Fast Charging | Analytical/Statistical | Spatial/Flow-based |
| [15] | 2023 | Germany | Public Fast Charging | ABM | Range-based |
| [16] | 2024 | Germany | Public Fast Charging | Probabilistic | Regulatory/Rule-based |
| [17] | 2024 | Sweden | Public Fast Charging | ABM | Range limit/Queue avoidance |
| [18] | 2026 | Sweden | Public Fast Charging | ABM | Range limit |
| PW | 2026 | Norway | Public Fast Charging | ABM | Heterogeneous charging strategies |
Table 2.
Minimal requirements for charging stations for HDVs along the TEN-T network [
3].
Table 2.
Minimal requirements for charging stations for HDVs along the TEN-T network [
3].
| TEN-T Network, per Direction | Year | Distance Between Charging Stations (km) | Total Power at Station (kW) | Power per Charging Point (kW) |
|---|
| Corenetwork | 2025 | 120 for 15% of TEN-T | 1400 | 1·350 |
| 2027 | 120 for 50% of TEN-T | 2800 | 2·350 |
| 2030 | 60 | 3600 | 2·350 |
| Comprehensivenetwork | 2025 | 120 for 15% of TEN-T | 1400 | 1·350 |
| 2027 | 120 for 50% of TEN-T | 1400 | 1·350 |
| 2030 | 100 | 1500 | 2·350 |
Table 3.
Technical specifications for selected electric heavy-duty trucks. The assigned ‘Profile’ dictates which parameterization (Standard for Equation (7), Early Taper for Equation (8), and Flat for Equation (9)) the vehicle’s BMS uses during simulation.
Table 3.
Technical specifications for selected electric heavy-duty trucks. The assigned ‘Profile’ dictates which parameterization (Standard for Equation (7), Early Taper for Equation (8), and Flat for Equation (9)) the vehicle’s BMS uses during simulation.
| Manufacturer | Model |
[kWh]
|
[kW]
| Range
[km] | Profile |
|---|
| Mercedes-Benz | eActros400 | 420 | 160 | 400 | Standard |
| MAN | eTGS | 500 | 375 | 650 | Standard |
| Iveco/Nikola | Tre BEV | 733 | 350 | 530 | Standard |
| DAF | XF Electric | 525 | 325 | 350 | Standard |
| Scania | P45 Electric | 520 | 375 | 395 | Standard |
| Volvo | FH Electric | 540 | 250 | 395 | Early Taper |
| Volvo | FM Electric | 450 | 250 | 380 | Early Taper |
| Mercedes-Benz | eActros600 | 600 | 1000 | 600 | Flat |
| MAN | MAN eTruck | 520 | 750 | 700 | Standard |
Table 4.
Summary of input parameters, scenario bounds, and description. Values in bold represent the default scenario used for the main analysis.
Table 4.
Summary of input parameters, scenario bounds, and description. Values in bold represent the default scenario used for the main analysis.
| Parameter | Evaluated Values | Description |
|---|
| Fleet Scale | | |
| Electrification Rate | 3% (2025), 10% (2030) | Aligns with Norwegian registry data (SSB) projecting near-term HDV adoption. |
| Dwell-Time Behavior | | |
| Off-Shift Probability () | 0%, 15%, 30%, 45% | Captures proportion of drivers utilizing public fast chargers for long (8 h) rests. |
| Mid-Shift Strategy | TCS (45 min, default for SCC mode)
ETS (80% SOC, default for ADC mode) | Contrasts duration-based against energy-oriented charge duration. |
| SOC Decision Logic | | |
| SCC Safety Buffer () | 10%, 20%, 30% | Represents varying robustness levels in fleet routing operations. |
| ADC Anxiety Threshold () | 10%, 30%, 50% | Models human range anxiety, dictating the comfort level until stop is triggered. |
| Hardware Interactions | | |
| BMS Charging Profiles () | Flat, Standard, Early Taper | Addresses the lack of OEM data by sampling heterogeneous intra-session power control curves. |
Table 5.
Detailed parameter configurations for all analyzed simulation scenarios.
Table 5.
Detailed parameter configurations for all analyzed simulation scenarios.
| Case Group | Scenario Name | Electrification | Off-Shift Prob. | Behavior | Strategy | Profile | SCC Buffer | ADC Threshold |
|---|
| Case 1: BehavioralComparison | Y2025_SCC_TCS | 3% | 0% | SCC | TCS | Flat | 20% | - |
| Y2025_SCC_ETS | 3% | 0% | SCC | ETS | Flat | 20% | - |
| Y2025_ADC_TCS | 3% | 0% | ADC | TCS | Flat | - | 30% |
| Y2025_ADC_ETS | 3% | 0% | ADC | ETS | Flat | - | 30% |
| Y2030_SCC_TCS | 10% | 0% | SCC | TCS | Flat | 20% | - |
| Y2030_SCC_ETS | 10% | 0% | SCC | ETS | Flat | 20% | - |
| Y2030_ADC_TCS | 10% | 0% | ADC | TCS | Flat | - | 30% |
| Y2030_ADC_ETS | 10% | 0% | ADC | ETS | Flat | - | 30% |
| Case 2: Sensitivity(Off-Shift) | OffShift_00 | 10% | 0% | SCC | TCS | Flat | 20% | - |
| OffShift_15 | 10% | 15% | SCC | TCS | Flat | 20% | - |
| OffShift_30 | 10% | 30% | SCC | TCS | Flat | 20% | - |
| OffShift_45 | 10% | 45% | SCC | TCS | Flat | 20% | - |
| Case 3: ChargeControl | Profile_Flat_TCS | 10% | 0% | SCC | TCS | Flat | 20% | - |
| Profile_Mixed_TCS | 10% | 0% | SCC | TCS | Mixed | 20% | - |
| Profile_Flat_ETS | 10% | 0% | SCC | ETS | Flat | 20% | - |
| Profile_Mixed_ETS | 10% | 0% | SCC | ETS | Mixed | 20% | - |
| Case 4: Sensitivity to Assumptions | ADC_Thresh_10 | 10% | 0% | ADC | ETS | Flat | - | 10% |
| ADC_Thresh_30 | 10% | 0% | ADC | ETS | Flat | - | 30% |
| ADC_Thresh_50 | 10% | 0% | ADC | ETS | Flat | - | 50% |
| SCC_Buffer_10 | 10% | 0% | SCC | TCS | Flat | 10% | - |
| SCC_Buffer_20 | 10% | 0% | SCC | TCS | Flat | 20% | - |
| SCC_Buffer_30 | 10% | 0% | SCC | TCS | Flat | 30% | - |
Table 6.
Case 1: Daily representative metrics for scenarios 2025 and 2030.
Table 6.
Case 1: Daily representative metrics for scenarios 2025 and 2030.
| Scenario |
(kW) |
(veh |
(veh) | PVD
(kW) |
(h)
|
(h)
| LF
(%) |
(kW/h) |
|---|
| 2025 Scenarios | | | | | | | | |
| Y2025_SCC_TCS | 1371.6 | 4.2 | 0.1 | 1371.6 | 9.9 | 1.0 | 16.0 | 220.0 |
| Y2025_SCC_ETS | 1531.3 | 4.7 | 0.2 | 1531.3 | 9.5 | 1.3 | 19.1 | 250.4 |
| Y2025_ADC_TCS | 1235.8 | 4.0 | 0.1 | 1235.8 | 9.0 | 1.0 | 14.7 | 221.8 |
| Y2025_ADC_ETS | 1129.5 | 3.4 | 0.0 | 1129.5 | 9.6 | 0.8 | 13.1 | 229.2 |
| 2030 Scenarios | | | | | | | | |
| Y2030_SCC_TCS | 2318.5 | 7.2 | 0.1 | 2312.8 | 8.7 | 1.3 | 24.1 | 419.2 |
| Y2030_SCC_ETS | 2672.5 | 8.5 | 0.5 | 2666.8 | 9.8 | 1.9 | 28.6 | 448.2 |
| Y2030_ADC_TCS | 1732.7 | 5.7 | 0.1 | 1726.9 | 9.1 | 1.1 | 20.5 | 290.8 |
| Y2030_ADC_ETS | 1605.1 | 4.8 | 0.0 | 1599.3 | 9.1 | 0.9 | 18.3 | 282.0 |
Table 7.
Case 2: Daily representative metrics for increasing probability of off-shift charging.
Table 7.
Case 2: Daily representative metrics for increasing probability of off-shift charging.
| Scenario |
(kW) |
(veh) |
(veh) | PVD
(kW) |
(h)
|
(h)
| LF
(%) |
(kW/h) |
|---|
| Sensitivity Analysis | | | | | | | | |
| OffShift_00 | 2318.5 | 0.0 | 0.1 | 2312.8 | 8.7 | 1.3 | 24.1 | 419.2 |
| OffShift_15 | 2180.8 | 0.0 | 2.6 | 2169.3 | 10.6 | 1.7 | 27.6 | 349.0 |
| OffShift_30 | 1934.4 | 0.0 | 8.8 | 1909.9 | 9.4 | 1.8 | 32.3 | 397.4 |
| OffShift_45 | 1631.1 | 0.0 | 15.9 | 1572.6 | 8.6 | 2.3 | 39.3 | 373.2 |
Table 8.
Case 3: Daily representative metrics for flat vs. mixed charging profiles.
Table 8.
Case 3: Daily representative metrics for flat vs. mixed charging profiles.
| Scenario |
(kW) |
(veh) |
(veh) | PVD
(kW) |
(h)
|
(h)
| LF
(%) |
(kW/h) |
|---|
| Charge Control | | | | | | | | |
| Profile_Flat_TCS | 2318.5 | 7.2 | 0.1 | 2312.8 | 8.7 | 1.3 | 24.1 | 419.2 |
| Profile_Mixed_TCS | 2277.7 | 7.3 | 0.1 | 2272.0 | 9.5 | 1.4 | 24.2 | 378.0 |
| Profile_Flat_ETS | 2672.5 | 8.5 | 0.5 | 2666.8 | 9.8 | 1.9 | 28.6 | 448.2 |
| Profile_Mixed_ETS | 2561.6 | 8.6 | 0.6 | 2553.1 | 9.2 | 1.8 | 28.4 | 463.4 |
Table 9.
Case 4: Daily representative metrics for the sensitivity analysis on behavioral parameters.
Table 9.
Case 4: Daily representative metrics for the sensitivity analysis on behavioral parameters.
| Scenario |
(kW) |
(veh) |
(veh) | PVD
(kW) |
(h)
|
(h)
| LF
(%) |
(kW/h) |
|---|
| Validation-SCC Buffer | | | | | | | | |
| SCC_Buffer_10 | 2214.0 | 6.9 | 0.1 | 2208.2 | 8.4 | 1.4 | 23.9 | 410.5 |
| SCC_Buffer_20 | 2318.5 | 7.2 | 0.1 | 2312.8 | 8.7 | 1.3 | 24.1 | 419.2 |
| SCC_Buffer_30 | 2376.0 | 7.5 | 0.1 | 2370.3 | 8.9 | 1.4 | 24.5 | 425.6 |
| Validation-ADC Threshold | | | | | | | | |
| ADC_Thresh_10 | 2074.8 | 6.4 | 0.1 | 2069.1 | 8.5 | 1.4 | 23.0 | 404.1 |
| ADC_Thresh_30 | 1605.1 | 4.8 | 0.0 | 1599.3 | 9.1 | 0.9 | 18.3 | 282.0 |
| ADC_Thresh_50 | 1344.3 | 4.2 | 0.0 | 1344.3 | 10.7 | 1.0 | 14.9 | 197.8 |
| Disclaimer/Publisher’s Note: The statements, opinions and data contained in all publications are solely those of the individual author(s) and contributor(s) and not of MDPI and/or the editor(s). MDPI and/or the editor(s) disclaim responsibility for any injury to people or property resulting from any ideas, methods, instructions or products referred to in the content. |
© 2026 by the authors. Published by MDPI on behalf of the World Electric Vehicle Association. Licensee MDPI, Basel, Switzerland. This article is an open access article distributed under the terms and conditions of the Creative Commons Attribution (CC BY) license.