Article

Coordinated Regulation Strategy for Electric Vehicles and Air-Conditioning Based on a Stackelberg–Evolutionary Game Framework

State Grid Chongqing Electric Power Company Economic Research Institute, Yubei District, Chongqing 401120, China
*
Author to whom correspondence should be addressed.
World Electr. Veh. J. 2026, 17(7), 352; https://doi.org/10.3390/wevj17070352
Submission received: 7 May 2026 / Revised: 3 July 2026 / Accepted: 6 July 2026 / Published: 8 July 2026

Abstract

Load aggregators play a pivotal role in demand-side regulation by coordinating flexible resources between electricity retailers and end users. However, existing studies have rarely considered their dual-role attribute, namely acting as followers of electricity retailers while serving as leaders of end users. Moreover, most studies assume fully rational user behavior, which may not accurately reflect practical decision-making processes under heterogeneous preferences. To address these gaps, this paper proposes a coordination strategy for EV and air-conditioning loads based on a Stackelberg–evolutionary game framework. A three-layer Stackelberg–evolutionary game model is first constructed, with the electricity retailer serving as the leader and the load aggregator acting both as a follower and a leader, thereby revealing the interest interactions among multiple stakeholders. Subsequently, an evolutionary game based on the Logit protocol is introduced to establish a dynamic evolution equation for users’ collective strategy choices, which captures users’ heterogeneous trade-offs between electricity costs and thermal comfort, as well as their strategic interactions. Next, a genetic algorithm was used to solve the problem. Finally, case study results demonstrate that, compared with the pure Stackelberg game, the proposed strategy increases the aggregator’s profit by 56.7% while reducing users’ electricity costs by 41.2%, thereby validating its effectiveness.

1. Introduction

With the proposal of the carbon peaking and carbon neutrality goals, the ownership of electric vehicles (EVs) continues to grow rapidly. The uncoordinated, chaotic charging of EVs imposes enormous pressure on power grid operation. In the summer peak electricity consumption period of southern China, air conditioning load, as a major power consumer, accounts for 30% of the total social power load [1,2]. Considering that users’ EV charging behavior highly overlaps with the air conditioning load peak, the operational pressure on the power grid is further intensified [3]. Air-conditioning loads and electric vehicles possess strong regulation capabilities. As typical flexible loads on the consumer side [4,5], they enable coordinated control by charging during valley periods and discharging during peak periods to compensate for air-conditioning demand. This approach overcomes the limitations of individual flexible resources with limited regulation capacity and provides a new solution for alleviating pressure on the power grid.
Scholars have researched demand response for both single-type and multi-type flexible resources. References [6,7] have thoroughly demonstrated that dispatching flexible resources through demand response can improve the economic efficiency of system operation. Demand response primarily guides users through price mechanisms [8] or incentive signals [9], and current research mainly employs Stackelberg game models to characterize the interactive processes among responding entities. Reference [10] constructs a “one-leader–multiple-followers” game model led by the system operator, using subsidies to incentivize user participation in demand response. Reference [11] constructs a leader-follower game model led by an integrated energy system aggregator. Reference [12] develops a two-level game model to achieve coordinated control among the operator, microgrids, and the distribution network.
However, actual power system operations involve collaborative decision-making among multiple stakeholders across multiple levels. The aforementioned studies primarily analyze two-party interactions between a single dominant party and its subordinates, without considering that participating entities may assume dual roles as both followers and leaders. As a follower of the electricity retailer and a leader of end-users, the load aggregator is embedded in a complex interplay among these three parties. How to achieve a balance of interests through electricity pricing or incentive signals while guiding user behavior has therefore become an urgent issue to address. To this end, this paper constructs a Stackelberg–evolutionary game model to achieve coordinated regulation of electric vehicle and air-conditioning loads through alternating iterations of time-of-use pricing and load information.
Existing Stackelberg game models typically assume that users are “perfectly rational.” In reality, however, users are “boundedly rational” [13]; different users exhibit heterogeneous preferences regarding comfort and electricity costs, and the strategic choices of some users may influence others. Consequently, users’ strategic decision-making is a dynamic and mutually influential process. Since the Stackelberg game framework cannot capture these characteristics of bounded rationality and strategic interaction, this paper introduces an evolutionary game to characterize dynamic decision-making and strategic interactions at the user level, thereby capturing user behavior more realistically.
In summary, this paper proposes a coordinated regulation strategy for electric vehicle and air-conditioning loads based on a Stackelberg–evolutionary game framework, which integrates the hierarchical optimization of the Stackelberg game with the dynamic evolution of the evolutionary game. The main innovations of this paper are as follows:
(1)
A three-tier Stackelberg–evolutionary game model is constructed. The electricity retailer acts as the leader in the upper tier; the load aggregator serves as both a follower of the retailer and a leader of the users in the middle tier; and users act as followers of the load aggregator in the lower tier. Time-of-use pricing is employed to guide user participation in demand response, thereby achieving benefit optimization for all stakeholders.
(2)
A dynamic evolution equation considering users’ bounded rationality based on the Logit protocol is formulated to characterize users’ heterogeneous preferences regarding electricity costs and thermal comfort, as well as their strategic interactions.
(3)
Given the mixed-integer nonlinear characteristics of the two-tier coupled game, this paper employs a genetic algorithm to solve the three-tier Stackelberg–evolutionary game model, thereby avoiding the risk of conventional gradient-based algorithms becoming trapped in local optima within non-convex solution spaces.

2. Stackelberg–Evolutionary Game Market Mechanism and Game Framework

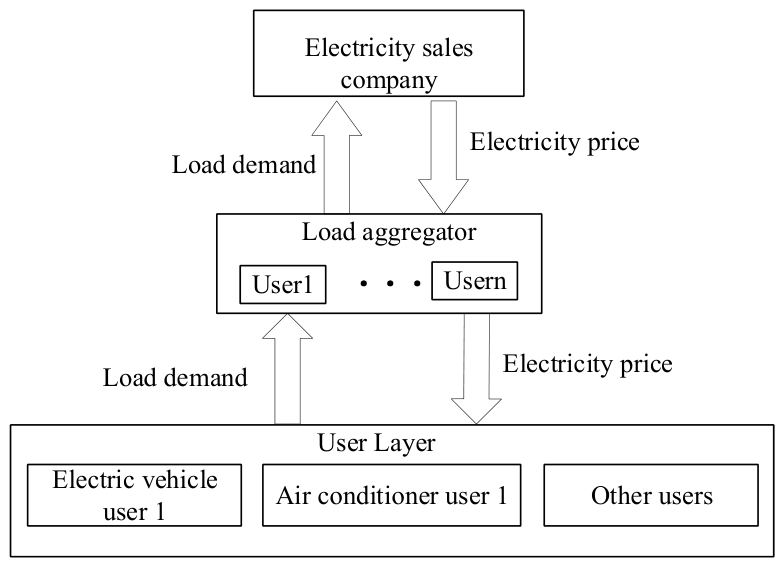
Figure 1 illustrates the three-tier control framework mediated by the load aggregator, within which a complex game-theoretic relationship exists among the three stakeholders. The electricity retailer, acting as the leader in the upper-level Stackelberg game, coordinates the power supply demands of the load aggregators under its jurisdiction. By balancing its own generating capacity against the aggregate load demands reported by the aggregators, the retailer determines the electricity purchase and sale prices to maximize profit and subsequently transmits these price signals to the aggregators.
At the intermediate level, the load aggregator serves a dual role, functioning both as a follower of the retailer and as a leader of the end-users. Its primary function is to consolidate the load demand within its agency area, including EV charging and discharging quantities and air-conditioning power reported by users, and to forward this aggregated information to the retailer. Based on the aggregated user load profile and the purchase and sale prices set by the retailer, the aggregator formulates time-of-use tariffs to maximize its own profit and disseminates these tariffs to the users.
At the lower level, users respond to the time-of-use tariffs established by the aggregator by coordinating their EV and air-conditioning loads to minimize their individual electricity costs. The strategic interactions among users are formulated as an evolutionary game problem, which is solved using the Logit dynamic equation.
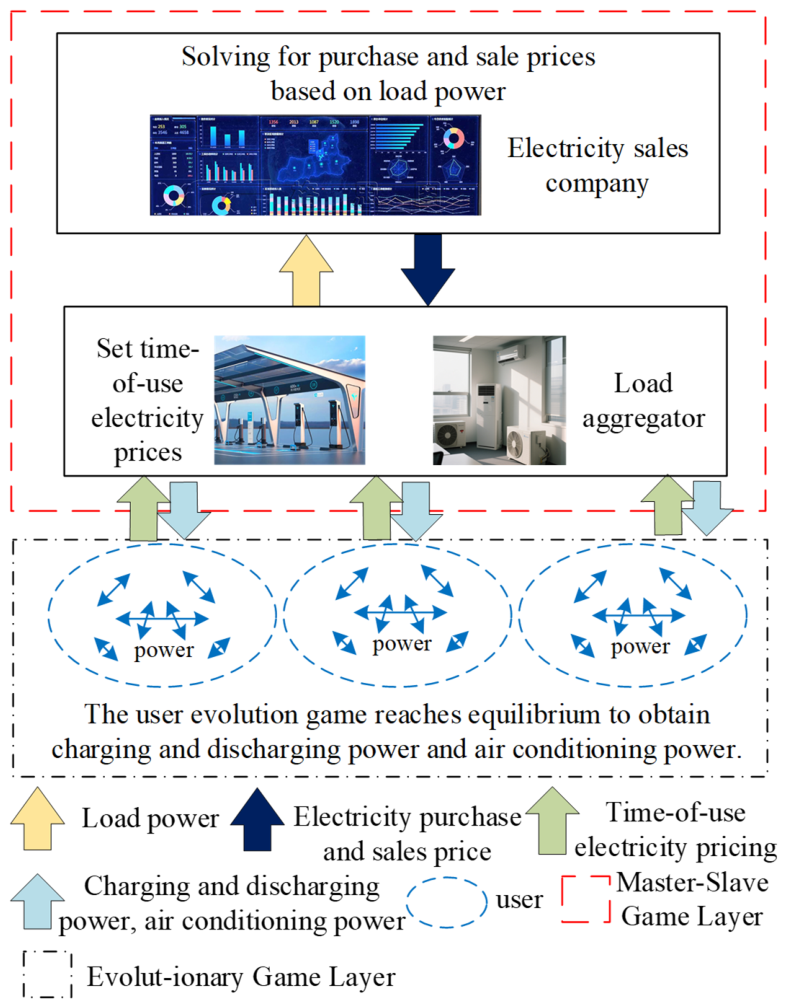
Within the three-tier regulatory framework mediated by the load aggregator, complex interest-based interactions and game-theoretic relationships exist among the participants, ultimately enabling overall system optimality through hierarchical optimization and collaborative decision-making. To address this complex problem, this section employs a Stackelberg–evolutionary game approach to solve the optimization scheduling problem. The primary objective is to guide users in adjusting their loads in response to the electricity retailer through time-of-use tariffs set by the load aggregator. The specific game-theoretic framework is illustrated in Figure 2.
The iterative cycle of this two-layer game begins with the lower-level users. Under the initial time-of-use tariffs, users determine their EV charging and discharging quantities and air-conditioning loads, and report these decisions to the load aggregator. Upon consolidating the reported data, the load aggregator forwards the aggregate load demand to the electricity retailer. In turn, the retailer sets the electricity purchase and sale prices based on its own generation capacity and the aggregated load demand, and communicates these price signals to the aggregator. The aggregator then recalculates the time-of-use tariffs according to the updated purchase and sale prices, and disseminates the revised tariffs to the users. Users subsequently adjust their electricity consumption behavior in response to the new tariffs and update their reported load demands accordingly. Through this iterative process of continuous interaction and strategy refinement, the two-level game gradually converges to a stable equilibrium state.

3. Three-Level Game Model

For the electricity retailer, the main goal of participating in regulation is to maximize its own electricity sales revenue as much as possible. For the load aggregator, the main goal of participating in the mutual-aid regulation of EV and air conditioning loads is to formulate reasonable electricity prices to guide users to participate in regulation so as to improve its own interests. For users, the goal of participating in mutual-aid regulation is to reduce electricity costs while ensuring their own comfort and electricity demand. Therefore, the game mainly considers the revenue of the electricity retailer R grid , the aggregator revenue R agg and the revenue of the user R user .

3.1. Master–Slave Game Model

(1)
Dynamic Pricing Game Model of the Leader (Electricity Retailer): The game strategy adopted by the electricity retailer is the purchasing and selling electricity prices formulated for the load aggregator in each time period γ t s and γ t b .
The revenue function represents the economic benefits of the electricity retailer under its own purchasing and selling electricity price strategy, including three parts: the levelized comprehensive cost of the power generation equipment constructed by the electricity retailer, the cost of purchasing electricity from the external power grid, and the revenue from purchasing and selling electricity, which is shown in the following formula Subsubsection.
max R grid = t = 1 T [ γ t s E t s γ t b E t b ] t = 1 T L C O E D S O E t G t = 1 T b 0 E t k
where E t b and E t s represent the electricity purchase volume and sales volume of the power sales company and the load aggregator at time t, respectively; L C O E D S O is the generation cost coefficient; E t G is the power generation volume of the power sales company at time t; b 0 is the unit cost of purchasing electricity from the external grid; E t k is the volume of electricity purchased from the external grid at time t.
This paper employs the levelized cost theory to calculate the power generation cost coefficient L C O E D S O , as shown in Equation (2), taking into account the levelized annual construction cost C C L and the levelized annual operation and maintenance cost of the power generation equipment O M L , as shown in Equations (3) and (4).
L C O E D S O = CC L + O M C L t = 1 n E t ( 1 + r ) t
C C L = C s × C R F C R F = r ( 1 + r ) n ( 1 + r ) n 1
O M L = O M o R O M ( 1 R O M n ) 1 R O M C R F R O M = 1 + r n O M 1 + r n r n = 1 + r r 1 + r i 1
where r is the discount rate, n is the equipment service life, E t is the power generation volume of the power retailer in year t, C s is the equipment purchase and installation cost, C R F is the capital recovery factor that converts the one-time investment C s into equivalent annual investment costs, O M o is the operating and maintenance cost in the first year, r n is the annual nominal growth rate, representing the total annual rate of change in operating and maintenance costs, r r is the real growth rate, r i is the Inflation Rate, and r n O M is the annual growth rate of operating and maintenance costs.
To ensure that the load aggregator is willing to conduct transactions with the electricity retailer, the purchasing and selling electricity prices formulated by the electricity retailer shall satisfy the following constraints:
ω t γ t b γ t s α t
where α t and ω t are the time-of-use electricity price of the load aggregator and the user subsidy electricity price at time t, respectively.
The real-time power supply and demand balance constraint is expressed as:
E t k + E t G = E t s E t b
(2)
Game Model of the Follower (Load Aggregator):
The game strategies of the load aggregator are the electricity purchase volume, the electricity sales volume in each time period, E t s and E t b —the time-of-use electricity prices α t for users. The load aggregator takes profit maximization as the utility function of the game, including EV charging/discharging revenue, air conditioning regulation revenue, and regulation costs, which are shown as follows:
max R agg = t = 1 T i = 1 I [ ( α t γ t s ) E t , c h i , E V + ( γ t b ω t ) E t , d i s i , E V ] + t = 1 T i = 1 I [ ( α t γ t s ) E t , i n i , A C + ( γ t b ω t ) E t , d e i , A C ] L C O E a g g t = 1 T i = 1 I ( E t , c h i , E V + E t , d i s i , E V + E t , i n i , A C + E t , d e i , A C )
E t , c h i , E V = P i , t c h Δ t E t , d i s i , E V = P i , t d i s Δ t E t , i n i , A C = P i , t i n Δ t E t , d e i , A C = P i , t d e Δ t
where E t , c h i , E V is the EV charging volume of user i at time t; E t , d i s i , E V is the EV discharging volume of user i at time t; E t , i n i , A C is the increased air conditioning electricity volume of user i at time t; E t , d e i , A C is the reduced air conditioning electricity volume of user i at time t; L C O E a g g is the cost coefficient of the load aggregator’s regulation volume, whose calculation formula is the same as that shown in Equation (2); P i , t c h and P i , t d i s are the EV charging and discharging powers of user i at time t, respectively; P i , t i n and P i , t d e are the increased and reduced air conditioning powers of user i at time t, respectively. Among them, Equation (8) is determined by the evolutionary game of users in the lower layer.
The supply and demand balance constraint is expressed as follows:
E t s E t b = i = 1 I ( E t , c h i , E V + E t , i n i , A C E t , d i s i , E V E t , d e i , A C ) + E t b a s e
where E t b a s e is the user base load at time t.

3.2. Evolutionary Game Model

(1)
User Evolutionary Game Model:
For large-scale grid-connected EV users and air conditioning users, when adopting a single-unit refined modeling strategy, the system needs to process massive amounts of information simultaneously, such as the charging and discharging time of EV units [14], the set temperature of air conditioners [15], etc. This will lead to an exponential increase in the dimension of decision variables and significantly increase the computational difficulty of the optimization problem. In this paper, a cluster-equivalent modeling method is adopted to characterize the charging behavior and its constraints of the EV group as well as the air conditioning group.
According to user behaviors, power consumption strategies are randomly generated, and the set of all strategies forms a strategy set M 3 , which is expressed as:
M 3 = s 1 , s 2 , s 3 , s 4 s n = P 1 , n i , P 2 , n i , , P t , n i P t , n i = P i , t c h , P i , t d i s , P i , t i n , P i , t d e
where s n is the generated n strategy, and P t , n i is the load power of user i in time period t under the n strategy.
The mathematical model for a single EV is shown in the following formula:
S i , t + Δ t E V = S i , t E V + E t , c h i , E V η i c h E t , d i s i , E V η i d i s U i , t c h + U i , t d i s 1 0 P i , t c h U i , t c h P i , max c h 0 P i , t d i s U i , t d i s P i , max d i s S i , min E V S i , t E V S i , max E V
where S i , t E V is the EV power of user i at time t; η i c h and η i d i s are the charging and discharging efficiencies of the EV, respectively; U i , t c h and U i , t d i s are the EV charging/discharging flags, where 1 indicates the charging/discharging state and 0 indicates the non-charging/discharging state; P i , max c h and P i , max d i s are the maximum charging and discharging powers of the EV, respectively; S i , max E V and S i , min E V are the maximum and minimum power of the EV, respectively.
The heat exchange relationship between the system composed of a single air conditioner and the surrounding buildings and the external environment can be represented by an equivalent thermal parameter model [16,17,18], and its first-order linear approximation model is shown in Equation (12):
T i n i , t + 1 = T o u t i , t + 1 Q d e v R T o u t i , t + 1 Q d e v R T i n i , t e Δ t R C
Subtract T i n i , t from both sides of Equation (12) yields Equation (13).
T i n i , t + 1 T i n i , t = T o u t i , t + 1 T i n i , t Q d e v R T o u t i , t + 1 Q d e v R T i n i , t e Δ t R C
Substituting Q d e v = η ( P i , t i n P i , t d e ) into Equation (13) yields Equation (14).
T i n i , t + 1 T i n i , t = 1 e Δ t R C ( T o u t i , t + 1 T i n i , t ) η R ( P i , t i n P i , t d e ) e Δ t R C
where T i n i , t is the indoor temperature, T o u t i , t is the outdoor temperature, R is the equivalent thermal resistance of the building system for air-conditioning loads, Q d e v is the air conditioning cooling capacity, C is the equivalent heat capacity of the air in an air-conditioned room, η represents the energy efficiency ratio of the air conditioning unit. The values for the above parameters are taken from Reference [10].
The objective function of users in the game process R user is defined as minimizing their own electricity costs, which is shown as follows:
min R user = β t = 1 T i = 1 I ( α t ( E t , c h i , E V + E t , i n i , A C ) ω t ( E t , d i s i , E V + E t , d e i , A C ) ) 1 β t = 1 T i = 1 I k T i n i T s e t i 2
where β is the preference coefficient, representing the user’s preference for comfort and electricity costs, and its value varies under different strategies; detailed parameter settings can be found in Reference [19]. T i n i is the indoor temperature of user i; T s e t i is the set temperature of the air conditioner of user i; and k is the comfort value coefficient.
(2)
Dynamic Evolution Equation Based on Logit Protocol
Under the Logit protocol, users do not need to account for the specific strategies of other users. Instead, they switch strategies probabilistically by comparing the payoff of their current strategy with the average payoff of other strategies. This aligns more closely with the bounded rationality observed in actual decision-making contexts. Moreover, previous studies have confirmed that this protocol can effectively capture the evolutionary convergence of group strategies [20,21].
As electricity consumption strategies continue to be optimized, the overall utility of the user cluster gradually increases and converges toward an evolutionary stable equilibrium. The utility obtained by users from their chosen electricity consumption strategies is standardized as follows:
U u s e r n = R u s e r n min ( R u s e r n ) max ( R u s e r n ) min ( R u s e r n )
where U u s e r n is the utility obtained by a user from strategy n.
Users adjust their strategies based on the utilities of different electricity consumption strategies. This paper adopts the Logit protocol [22] for strategy adjustment, and the conditional transition probability is defined as:
ρ n , m [ R u s e r ( t ) ] = exp [ U u s e r m ( t ) ] n = 1 N exp [ U u s e r n ( t ) ]
where ρ n , m [ R u s e r ( t ) ] is the conditional transition probability from electricity consumption strategy n to strategy m, representing the proportion of users who transition from strategy n to strategy m during time period t.
From this, we can derive the dynamic differential equation describing the evolution process of the user population and express it in discrete form:
x m w + 1 = x m w + λ { ρ n , m [ R u s e r ( X ) ] x m w }
where x m w is the proportion of users who choose strategy m at iteration w , w is the number of evolutionary iterations, and λ is the evolutionary step size. Its value is solely influenced by the convergence rate of the evolutionary game and falls within the range (0, 1) [23,24]; in this paper, it is set to 0.1. The termination criterion is:
x m w + 1 x m w < ε
where ε is an arbitrarily small positive number.
The evolutionary game can prove the existence of a convergent equilibrium for the logit model using the Lyapunov method. The convergence conditions are detailed in Reference [24]. Since the user utility in this paper satisfies the convergence conditions after standardization, the evolutionary game possesses an equilibrium solution.

4. Master–Slave Evolutionary Game Solution Process

Since the objective functions of both the electricity retailer and the aggregator in the strategy described in this paper are non-empty, closed, and bounded over their respective strategy sets, and are either convex or first-order linear, the retailer’s revenue, given a fixed electricity consumption, is a linear function of the purchase and sale prices, which is a quasi-convex function. Therefore, an optimal solution for the optimization of purchase and sale prices necessarily exists. Similarly, given the purchase and sale prices, the aggregator’s objective function is also quasi-convex, and there exists a unique optimal solution to the time-of-use pricing problem. Hence, an equilibrium solution to the Stackelberg game exists.
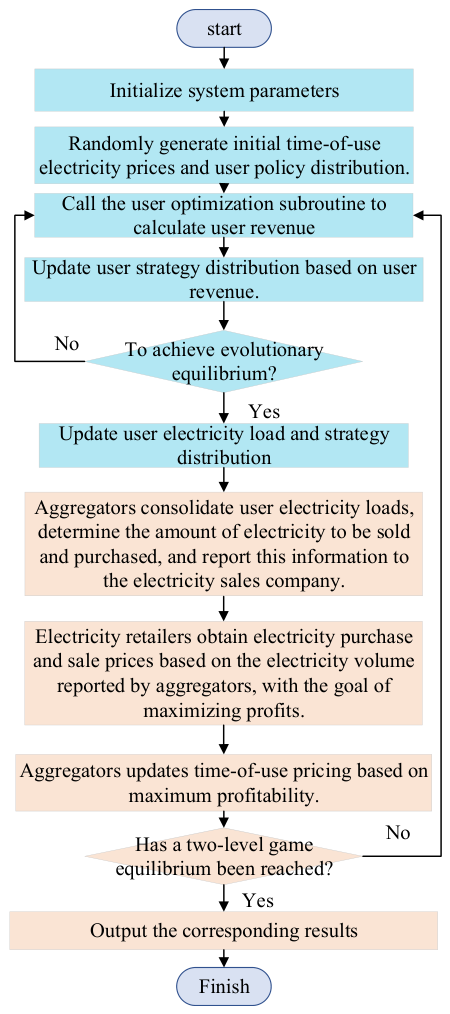
The specific solution process is shown in Figure 3:
Step 1: Initialize system parameters, including the upper limits for charging and discharging power, the upper limit for air conditioning power, the convergence threshold, and the limit on the number of convergence attempts;
Step 2: Generate an initial user strategy distribution. The aggregator generates an initial time-of-use electricity price α t and transmits it to the users;
Step 3: Based on the time-of-use electricity price α t , users update their EV charging volume E t , c h i , E V , EV discharging volume E t , d i s i , E V , additional air-conditioning power consumption E t , i n i , A C , and reduced air-conditioning power consumption E t , d e i , A C following the evolutionary game solution procedure in Section 3.2 and Equation (15);
Step 4: The aggregator calculates the electricity purchase and sale volumes using Equation (9) based on the user load information from Step 3 and reports them to the electricity retailer. The retailer then computes new purchase γ t b and sale prices γ t s using Equation (1);
Step 5: The aggregator updates the time-of-use electricity prices α t using Equation (7) and redistributes them to the users. Users reevaluate their electricity consumption strategies based on the new time-of-use electricity prices α t and feed back their updated load information;
Step 6: Update the aggregator’s time-of-use electricity rates using the selection, crossover, and mutation operations of the genetic algorithm. Repeat Steps 3–5 to compute Equations (1), (7) and (15);
Step 7: If the time-of-use electricity rates satisfy α t ( k + 1 ) α t ( k ) < ε , terminate the program and output the final results; otherwise, return to Step 3.

5. Case Analysis

5.1. Parameter Settings

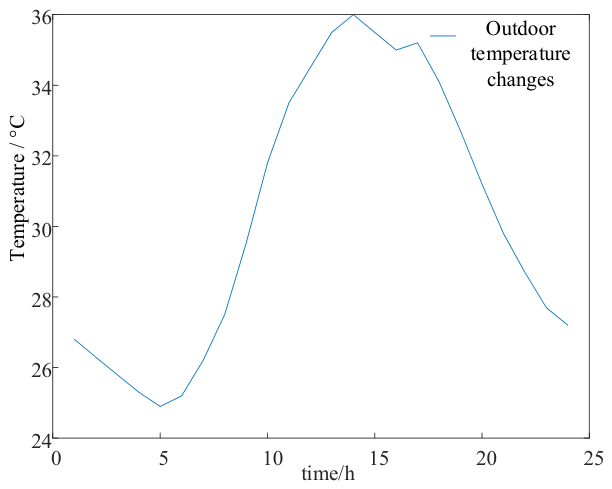
It is assumed that the users within the jurisdiction of the load aggregator are residential users. The EV charging and discharging efficiency is set to 0.95, the scheduling cycle is 24 h, and the scheduling time interval is 1 h. The outdoor temperature curve is shown in Figure 4.
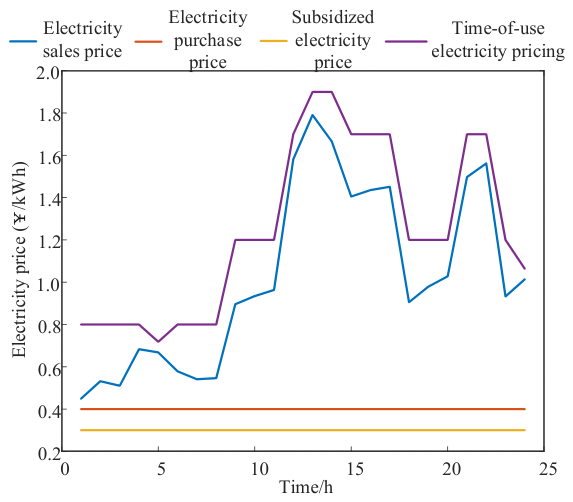
The subsidy electricity price for residential users is 0.3 ¥/kWh, and the initial time-of-use electricity prices are listed in Table 1.

5.2. Operating Revenue Analysis

To verify the rationality of the proposed strategy in this paper, three schemes are set for comparative analysis:
(1)
The electricity retailer and load aggregator adopt fixed electricity prices, and there is no game among the three stakeholders.
(2)
Only the Stackelberg game between the electricity retailer and the load aggregator is considered. Users are assumed to be completely rational individuals, and the evolutionary game at the user level is ignored.
(3)
The Stackelberg–evolutionary game strategy proposed in this paper is adopted.
The power consumption strategies at the user level are divided into the following four types:
Strategy 1: EV participates in V2G, and air conditioning operation prioritizes electricity cost;
Strategy 2: EV only charges, and air conditioning operation prioritizes comfort;
Strategy 3: EV participates in V2G, and air conditioning operation prioritizes comfort;
Strategy 4: EV only charges, and air conditioning operation prioritizes electricity cost.
The benefits of each stakeholder under different schemes are presented in Table 2.
A comparison of Scenario 1 and Scenario 2 shows that, when considering only the master–slave game, the electricity retailer’s revenue increases by 1143.7 ¥, the aggregator’s revenue rises by 1107.3 ¥, while users’ electricity costs increase by 2241.0 ¥. This is because, in the master–slave game, users are assumed to be perfectly rational. The aggregator directly adjusts load-side resources to respond to the electricity retailer’s demands, and in pursuing profit maximization, it may compromise users’ interests. The increase in the retailer’s revenue stems from its capacity to raise electricity prices.
Comparing Scenario 2 with Scenario 3 reveals that in Scenario 3, the retailer’s revenue decreases by 3.9%, the aggregator’s revenue increases by 56.7%, while users’ electricity costs decrease by 41.2%. This is because the profits of all parties are interdependent in the two-level game; aggregators cannot enhance their own profits by sacrificing users’ interests. Users are free to choose electricity consumption strategies based on their preferences and receive compensation, which incentivizes them to discharge more EV power to offset the increase in air-conditioning loads during high temperatures, thereby reducing electricity costs. The rise in EV discharging boosts the aggregator’s revenue from managing EVs while simultaneously reducing the electricity purchased from the retailer. Consequently, the aggregator’s revenue increases while the retailer’s revenue decreases.

5.3. Game Result Analysis

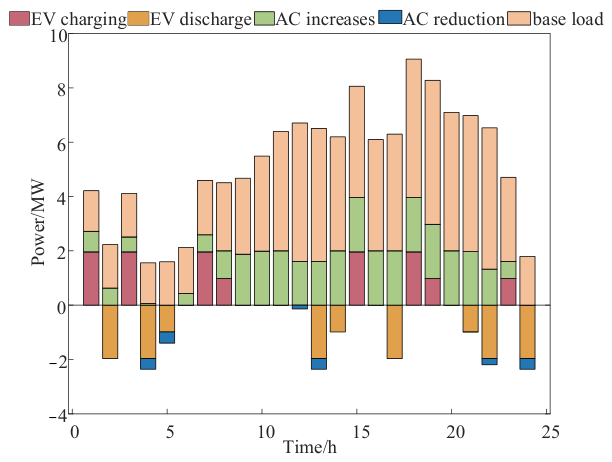
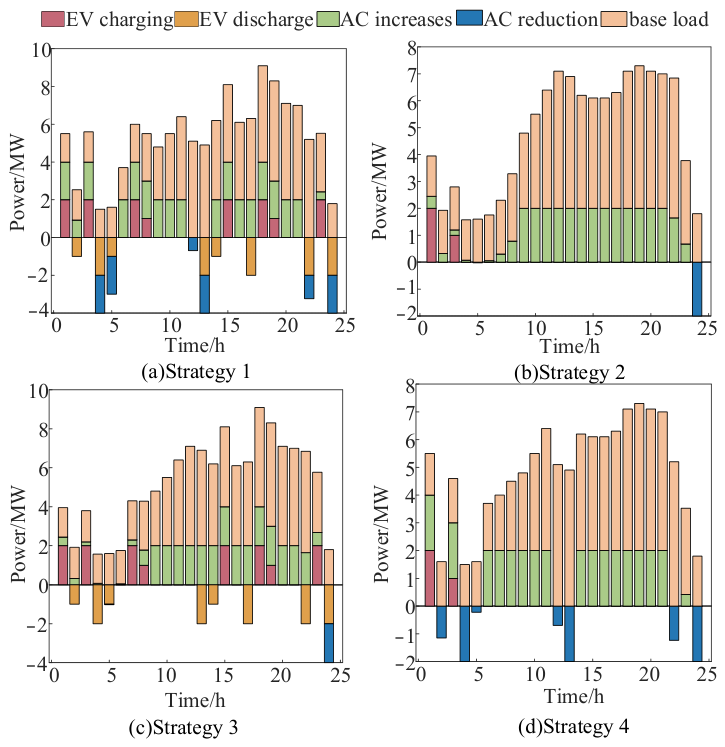
Figure 5 shows the results of the electricity price game, Figure 6 presents the game outcomes, and Figure 7 illustrates the load distribution. At this point, the user strategy distribution is [0.187, 0.009, 0.795, 0.009]. Most users choose Strategy 3, while very few opt for Strategies 2 and 4. This is because Strategies 2 and 4 lack the benefits of EV charging and discharging, and thus yield much lower utility than Strategies 1 and 3. Therefore, the subsequent analysis focuses primarily on the differences between Strategies 1 and 3.
As shown in Figure 7a,c, both Strategies 1 and 3 generate benefits through EV charging and discharging. During the sharp peak period (13:00–14:00), EVs discharge; during the shoulder periods (15:00, 18:00–19:00), they charge; and during the peak period (21:00–22:00), they discharge again. During the valley period (00:00–08:00), Strategy 1 exhibits significant fluctuations in air-conditioning load, whereas Strategy 3 shows smaller fluctuations, resulting in higher comfort levels. During peak hours, due to high outdoor temperatures, it is difficult to curtail air-conditioning load. However, because of the sharp peak electricity tariffs, Strategy 1 tends to moderately curtail air-conditioning load to reduce costs, causing indoor temperatures to rise rapidly during this period. In contrast, Strategy 3 continues to increase air-conditioning output to maintain a higher level of comfort, thereby maximizing utility from electricity consumption.
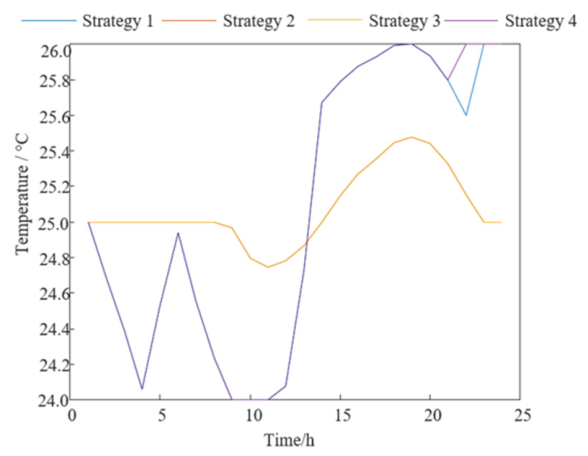
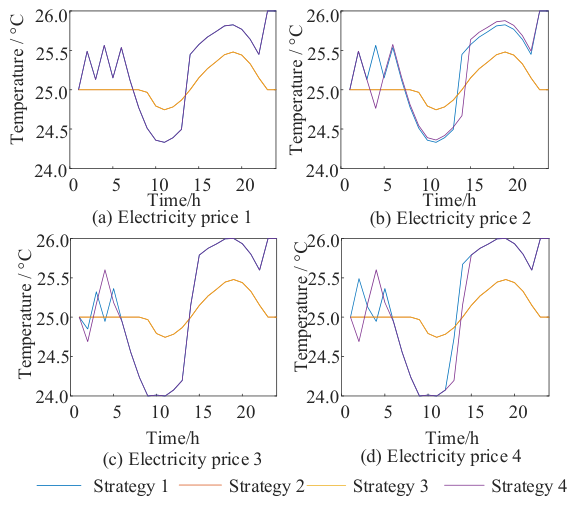
The indoor temperature variation is shown in Figure 8. Since both Strategy 1 and Strategy 4 prioritize air-conditioning electricity costs, and EV charging and discharging affect the overall user cost, the air-conditioning usage patterns of Strategies 1 and 4 are similar, with roughly identical temperature profiles. The same holds for Strategies 2 and 3.
By comparing the temperature curves of Strategies 2 and 4, it can be observed that air-conditioning load is reduced during the sharp peak price periods, leading to a rapid rise in indoor temperature under Strategy 4. Consequently, the air conditioner needs to increase its output in subsequent periods to maintain the indoor temperature within an acceptable range.

5.4. User Electricity Price Sensitivity Analysis

To analyze users’ response differences to different electricity prices, four electricity price scenarios are established in this section for user price sensitivity analysis. The electricity price scenarios are listed in Table 3, where the time division of each price period is consistent with Table 1, and the unit of electricity price is ¥/kWh.
The distribution of user strategies and electricity costs under different pricing scenarios is presented in Table 4 and Table 5. As shown in the tables, as the peak-to-valley price differential gradually widens, the proportion of users selecting Strategy 4 initially rises from 1.7% to 24.2% and then declines to 1.0%, while electricity costs increase from 2869.66 ¥ to 14,109.85 ¥. Specifically, Scenario 2 sees an increase of 3325.08 ¥ compared to Scenario 1, far exceeding the cost increments associated with the other strategies. This is because Strategy 4 does not generate revenue through EV discharging. Although this strategy prioritizes minimizing electricity costs, the high ambient temperature after 8:00 consistently exceeds the set temperature, causing indoor temperatures to rise. To maintain indoor temperatures within an acceptable range, air-conditioning loads cannot be curtailed for extended periods, thereby driving a rapid escalation in electricity costs. By contrast, Strategy 1 can reduce electricity costs through EV charging and discharging across peak and valley periods, resulting in a more modest increase of only 1912.77 ¥ from Scenario 1 to Scenario 2.
In contrast, Strategy 3 achieves a negative cost growth, with its adoption rate increasing from 1.0% to 81.1%. This is attributable to the combined benefits of valley-period EV charging and discharging and the fulfillment of comfort requirements. As shown in Figure 8, Figure 9 and Figure 10, although both Strategies 1 and 3 involve EV discharging, Strategy 3 increases air-conditioning power to minimize indoor temperature fluctuations, thereby better satisfying users’ comfort expectations. As a result, its overall cost decreases rather than increases.
Unlike Strategy 3, Strategy 2 involves EV charging only and thus foregoes the revenue from discharging, which results in increased electricity costs. Nevertheless, since comfort requirements are met, the cost rise is more moderate than that observed in Strategies 1 and 4. Accordingly, the share of users opting for Strategy 2 first rises from 1.0% to 24.2% and then falls to 3.4%.
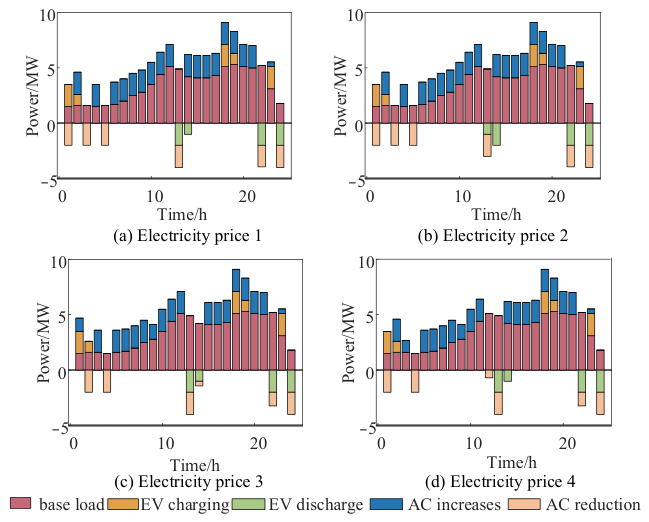
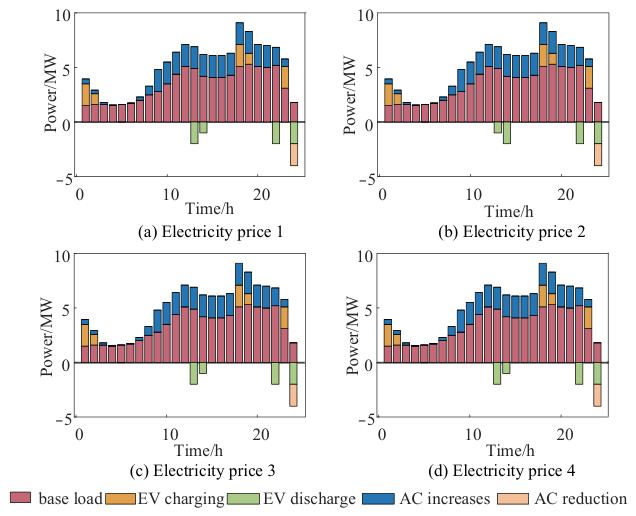
The load profiles of the four power consumption strategies under different electricity price scenarios are illustrated in Figure 9, Figure 10, Figure 11 and Figure 12. It can be observed from Figure 9 and Figure 11 that EVs under Strategy 1 and Strategy 3 are both capable of discharging. Under both strategies, EVs charge during the normal price periods and discharge during the peak price periods to raise economic benefits or offset the additional expense caused by the increase in air-conditioning power demand.
During the sharp peak periods, users adopting Strategy 3 reduce air-conditioning electricity costs by utilizing EV discharging. Meanwhile, since Strategy 1 prioritizes electricity costs for air conditioning, users choose to sacrifice comfort to cut electricity expenses during sharp peak periods and gain additional benefits through EV discharging. At this moment, the indoor temperature under Strategy 1 rises remarkably due to the high outdoor ambient temperature. By contrast, Strategy 3 emphasizes indoor comfort. Even during high electricity price periods, users still increase air-conditioning power to maintain a satisfactory comfort level. Meanwhile, EV discharging can partially offset the high electricity cost brought by the rising air-conditioning power demand in sharp peak periods, achieving complementarity between air-conditioning and EV loads.
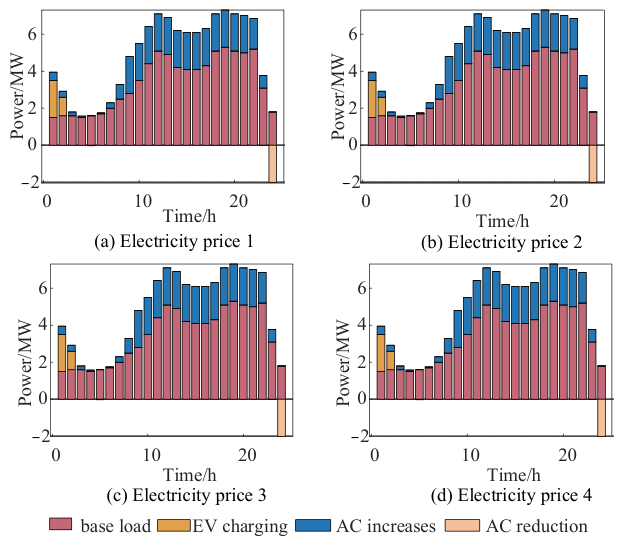
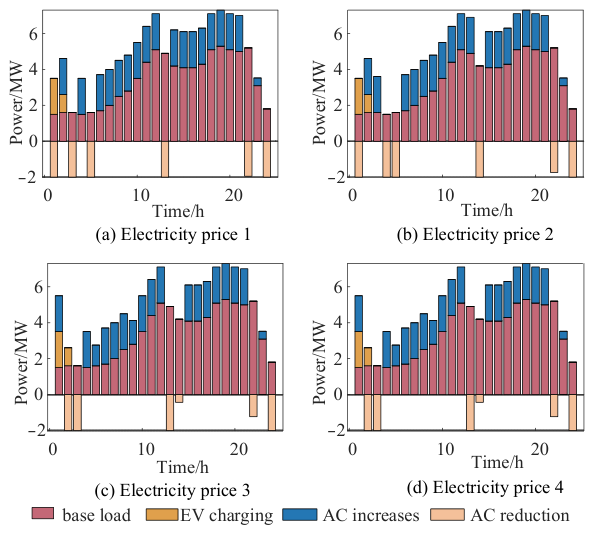
On the contrary, EVs under Strategies 2 and 4 only operate in charging mode and cannot generate extra revenue through discharging. Therefore, charging activities for both strategies are completed entirely during the valley periods. In addition, Strategy 4 focuses on electricity cost control, with users reducing air-conditioning power during valley and sharp peak periods to lower electricity expenditure. Strategy 2 prioritizes comfort instead, and users still increase air-conditioning power during sharp peak periods to maintain indoor temperature despite the higher costs.
By comparing the load characteristics of the four strategies under the same electricity price scenario, it can be observed that users of Strategies 2 and 3 prioritize comfort, so their air-conditioning usage remains largely unchanged even as electricity prices rise. Since the valley period occurs in the early morning, users can only obtain economic gains through EV charging and discharging during sharp peak, peak, and shoulder periods, leading to relatively fixed charge–discharge patterns. In contrast, Strategies 1 and 4 take electricity cost as the primary consideration. As electricity prices rise, users further curtail air-conditioning power during sharp peak periods to reduce electricity expenses. Given that the valley-period electricity price remains identical across scenarios, the proportion of valley-period electricity cost in the total daily cost gradually declines as the overall price level increases. Accordingly, users under Strategies 1 and 4 adjust their consumption behavior during valley periods.
The indoor temperature variations under different electricity prices are shown in Figure 13. It can be seen that Strategy 2 and Strategy 3 prioritize user comfort, and users are insensitive to the rise in electricity costs caused by increasing electricity prices. Their indoor temperatures deviate little from the set temperature.
In contrast, Strategy 1 and Strategy 4 show obvious temperature fluctuations relative to the set value. Especially during the sharp peak price periods, users curtail air-conditioning power to reduce electricity expenditure. Meanwhile, the outdoor temperature reaches its peak at this time and exerts a strong impact on the indoor environment, leading to a rapid rise in indoor temperature from 12:00 to 14:00.
In addition, since EVs under Strategy 1 participate in V2G and bring additional economic benefits, the overall electricity cost is lower than that under Strategy 4. As the peak–valley price gap widens, users adopting Strategy 1 tend to use air conditioning more during valley price periods, which further differentiates the indoor temperature variation curves of the two strategies.

6. Conclusions

This paper proposes a coordinated regulation strategy based on a Stackelberg–evolutionary game framework, which explicitly accounts for the dual role of the load aggregator as both a follower and a leader, and overcomes the limitation of traditional Stackelberg game models that assume users are perfectly rational. Compared with conventional approaches that only consider the Stackelberg game, the proposed strategy increases the load aggregator’s profit by 56.7%, reduces users’ electricity costs by 41.2%, and decreases the electricity retailer’s revenue by only 3.9%. These results demonstrate that incorporating users’ bounded rationality is not only more realistic but also does not compromise the interests of the primary stakeholders. In the user price-sensitivity analysis, the electricity costs for users who participate in V2G while prioritizing comfort decrease to 6287.44 yuan, and the proportion of such users reaches 81.1%, while the costs for non-V2G users increase substantially. This indicates that an appropriate increase in the peak-to-valley price differential encourages users to adopt V2G without sacrificing their comfort.
For future work, the coordinated control of electric vehicles and air-conditioning loads could be extended from the power system to an integrated electricity–heating–cooling energy system. In addition, more load aggregators could be incorporated into the framework to examine the effects of competition among them.

Author Contributions

Conceptualization, L.X. and F.Y.; methodology, L.X.; software, L.X.; formal analysis, J.L.; investigation, L.X. and Y.L.; resources, F.Y.; data curation, L.X.; writing—original draft preparation, L.X.; writing—review and editing, F.Y. and Y.L.; visualization, L.X.; supervision, J.L.; project administration, J.L.; funding acquisition, F.Y. and L.X. All authors have read and agreed to the published version of the manuscript.

Funding

This research was funded by the State Grid Chongqing Electric Power Company Science and Technology Project (SGTYHT/24-JS-004).

Data Availability Statement

The original contributions presented in the study are included in the article; further inquiries can be directed to the corresponding author.

Conflicts of Interest

All authors were employed by State Grid Chongqing Electric Power Company. The authors declare no conflicts of interest. The authors declare that this study received funding from the State Grid Chongqing Electric Power Company Science and Technology Project (SGTYHT/24-JS-004). The funder was not involved in the study design, collection, analysis, interpretation of data, the writing of this article or the decision to submit it for publication.

References

  1. Liao, X.; Ning, M.; Yang, J.; Li, Z.; Xia, F. Two-stage Robust Game Control Method for Distribution Network Considering Air Conditioning Load and Energy Storage Life Decay. Power Syst. Technol. 2026, 50, 817–837. [Google Scholar]
  2. Pourghaderi, N.; Fotuhi-Firuzabad, M.; Moeini-Aghtaie, M.; Kabirifar, M.; Lehtonen, M. Optimal energy and flexibility self-scheduling of a technical virtual power plant under uncertainty: A two-stage adaptive robust approach. IET Gener. Transm. Distrib. 2023, 17, 3828–3847. [Google Scholar]
  3. Hou, H.; Wang, Y.; Zhao, B.; Zhang, L.; Chen, Y.; Xie, C. Electric Vehicle Aggregator Dispatching Strategy Under Price and Incentive Demand Response. Power Syst. Technol. 2022, 46, 1259–1268. [Google Scholar]
  4. Yang, C.; Yang, H.; Zhou, X.; Li, J.; Zhang, W.; Wang, L. Research on optimization methods for electric vehicle demand response based on electricity-carbon customer directrix load. Power Syst. Prot. Control 2026, 54, 60–70. [Google Scholar]
  5. Dong, W.; Liu, L.; Wu, Z. Study on Electric Vehicle Two-stage Charging and Discharging Optimization Strategy Considering Demand Response. In Proceedings of the IEEE Joint International Information Technology and Artificial Intelligence Conference (ITAIC); IEEE: New York, NY, USA, 2025; Volume 12, pp. 657–663. [Google Scholar]
  6. Zhou, M.; Sun, X.; Hu, F.; Zhu, Z.; Wang, K.; Shi, C.; Zhou, M.; Zhang, Y.; Zhang, Y.; Zhang, L. Two-Tier Optimal Scheduling of Air-Conditioning Virtual Energy Storage Combined Cooling, Heating, and Power Microgrids Considering Demand Response. J. Electr. Eng. Technol. 2026, 21, 29–53. [Google Scholar]
  7. Wang, T.; Hua, H.; Shi, T.; Wang, R.; Sun, Y.; Naidoo, P. A bi-level dispatch optimization of multi-microgrid considering green electricity consumption willingness under renewable portfolio standard policy. Appl. Energy 2024, 356, 122428. [Google Scholar]
  8. Chen, Z.; Jia, R.; Wang, S.; Nan, H.; Zhao, L.; Zhang, X.; Hu, S.; Xu, Q. Two-layer optimal scheduling of distribution network-multi-microgrids based on master–slave game. Front. Energy Res. 2024, 12, 1450731. [Google Scholar] [CrossRef]
  9. Yin, H.; Ma, Y.; Liu, M.; Li, J. Research on Multi-objective Coordination Strategies for Active Distribution Networks Based on Dynamic Energy Storage Management. In Proceedings of the 5th International Conference on Clean Energy and Electric Power Engineering (ICCEPE); IEEE: New York, NY, USA, 2024; pp. 631–634. [Google Scholar]
  10. Yang, X.; Zhang, Y.; Zhang, T.; Gao, S.; Tu, R. Multi-load master-slave game optimization strategy considering peak shaving rewards and fine load regulation. Acta Energiae Sol. Sin. 2025, 46, 526–535. [Google Scholar]
  11. Qiao, Y.; Zhang, Q.; Xu, W.; Pan, X.; Liu, F.; Shi, J.; Zeng, Y.; Zhang, J. An Integrated Optimization Method for Multiuser Energy Storage Configuration and Leasing in Campus Energy Systems. Energies 2025, 18, 6244. [Google Scholar] [CrossRef]
  12. Hao, R.; Ai, Q.; Jiang, Z. Bi-level Game Strategy for Multi-agent with Incomplete Information in Regional Integrated Energy System. Autom. Electr. Power Syst. 2018, 42, 194–201. [Google Scholar]
  13. Sun, L.; Li, H.; Jia, Q.; Zhang, G.; Wang, M. Game Strategy for Cluster Development of User-side Distributed Photovoltaic Resources. Autom. Electr. Power Syst. 2023, 47, 26–37. [Google Scholar]
  14. Lao, B.; Zhang, X.; Liu, D.; Zou, Y. Reinforcement learning-based optimal scheduling strategy for charging and discharging of electric vehicle clusters. Sustain. Energy Grids Netw. 2026, 45, 102087. [Google Scholar]
  15. Shi, F.; Li, N.; Yan, H. The Influence of Thermal History and Air Conditioner Use Behavior Under Different Cooling Set Point Temperature Modes on Health. Buildings 2025, 15, 2211. [Google Scholar] [CrossRef]
  16. Belić, F.; Slišković, D.; Hocenski, Ž. Detailed thermodynamic modeling of multi-zone buildings with resistive-capacitive method. Energies 2021, 14, 7051. [Google Scholar] [CrossRef]
  17. Bao, Y.-Q.; Yao, Z.-L.; Wu, X.-H. Thermal parameters estimation of air conditioners based on reduced order equivalent thermal parameters model. Int. J. Electr. Power Energy Syst. 2023, 151, 109149. [Google Scholar] [CrossRef]
  18. Zhu, Y.; Wang, J.; Cao, X. Direct control strategy of central air-conditioning load and its schedulable potential evaluation. Electr. Power Autom. Equip. 2018, 38, 227–234. [Google Scholar]
  19. Chen, Y.; Zhang, R.; Tian, H.; Zhang, Z. Optimal operation of distribution substations for aggregating multiple user side flexible resources. Power Syst. Prot. Control 2025, 53, 130–143. [Google Scholar]
  20. Gavin, R.; Paarporn, K.; Ye, M.; Zino, L.; Cao, M. Adaptive-Gain Control for Equilibrium Selection in the Logit Dynamics. In Proceedings of the IEEE Conference on Decision and Control; IEEE: New York, NY, USA, 2025; pp. 3794–3799. [Google Scholar]
  21. Qi, J.; Yin, S.; Zhang, L.; Wang, D.; Long, Y.; Zhang, C. A master-slave evolutionary hybrid game-based scheduling method for virtual power plants and electric vehicle operators. Power Syst. Prot. Control 2026, 53, 131–141. [Google Scholar]
  22. Chen, F.; Xia, M.; Chen, Q.; Song, Y.; Xian, Y.; Xiu, S.; Su, S. Highway Service Area Multi-Timescale Optimization Scheduling Considering the Spatiotemporal Dynamic Evolution of Electric Vehicles. IEEE Trans. Smart Grid 2025, 16, 678–690. [Google Scholar]
  23. Peng, X.; Ding, Y.; Liu, J.; Li, Y.; Yuan, K. Multi-perspective collaborative planning of DN and distribution energy stations with stepped carbon trading and adaptive evolutionary game. Int. J. Electr. Power Energy Syst. 2025, 166, 110522. [Google Scholar] [CrossRef]
  24. Dong, L.; Ni, J.; Zhang, S.; Wang, X.; Qiao, J.; Han, F. Designing of Electricity Price Package Method Based on Dual Game. Power Syst. Technol. 2024, 48, 688–696. [Google Scholar]
Figure 1. Three-tier regulatory framework.
Wevj 17 00352 g001
Figure 2. Game-Theoretic Framework.
Wevj 17 00352 g002
Figure 3. Master–slave evolutionary game solution flowchart.
Wevj 17 00352 g003
Figure 4. Outdoor temperature changes.
Wevj 17 00352 g004
Figure 5. Electricity price results chart.
Wevj 17 00352 g005
Figure 6. Master–slave evolutionary game outcomes.
Wevj 17 00352 g006
Figure 7. Load profiles under different strategies.
Wevj 17 00352 g007
Figure 8. Indoor temperature curve.
Wevj 17 00352 g008
Figure 9. Load conditions for Strategy 1 under different electricity pricing scenarios.
Wevj 17 00352 g009
Figure 10. Load conditions for Strategy 3 under different electricity pricing scenarios.
Wevj 17 00352 g010
Figure 11. Load conditions for Strategy 2 under different electricity pricing scenarios.
Wevj 17 00352 g011
Figure 12. Load conditions for Strategy 4 under different electricity pricing scenarios.
Wevj 17 00352 g012
Figure 13. Indoor temperature curves at different electricity rates.
Wevj 17 00352 g013
Table 1. Initial time-of-use electricity pricing.
Time Period TypeTime PeriodElectricity Price (¥/kWh)
Sharp Peak hours12:00–14:001.5
11:00–12:00
Peak hours14:00–17:001.3
20:00–22:00
Normal period8:00–11:000.8
17:00–20:00
22:00–24:00
Valley period0:00–8:000.4
Table 2. Economic benefits of different options (¥).
PlanElectricity Sales Company RevenueAggregator RevenueUser Cost
173,891.21488.812,259.6
275,034.92596.114,500.6
372,184.24068.68519.9
Table 3. Different electricity price scenarios.
SceneSharp Peak HoursPeak HoursNormal PeriodValley Period
10.80.60.50.4
21.10.90.60.4
31.50.30.80.4
41.81.61.00.4
Table 4. User strategy distribution under different electricity price scenarios.
Scene/Percentage (%)Strategy 1Strategy 2Strategy 3Strategy 4
196.31.01.01.7
295.11.01.02.9
325.824.225.824.2
414.53.481.11.0
Table 5. Electricity costs under different scenarios (¥).
SceneStrategy 1Strategy 2Strategy 3Strategy 4
11369.669189.127689.122869.66
23282.439765.247065.246194.74
36472.3410,604.576504.5710,644.53
49040.3311,287.446287.4414,109.85
Disclaimer/Publisher’s Note: The statements, opinions and data contained in all publications are solely those of the individual author(s) and contributor(s) and not of MDPI and/or the editor(s). MDPI and/or the editor(s) disclaim responsibility for any injury to people or property resulting from any ideas, methods, instructions or products referred to in the content.