1. Introduction
A battery’s second life beyond the use of the vehicle has gained traction and has already penetrated the market from reuse and repurpose perspectives [
1]. However, the State of Health (SoH) estimation of NMC battery cells is a crucial aspect in assessing the performance and longevity of batteries, particularly those in their second applications [
2,
3,
4,
5]. The millions of electric cars sold in recent decades are going to expire in the coming decades, and the numbers will only increase over time. The vehicle batteries can be easily reused and repurposed in different applications where the market is also growing, and the service demand is less demanding than on-road usage [
6,
7,
8]. However, there are numerous challenges to acquiring, analyzing, sorting, remanufacturing, commissioning, and monitoring these batteries, just to name a few. On top of that, technical challenges such as a lack of information about first-life usage, data logs, potential mechanical impact from packaging, etc., increase the uncertainty around batteries in their second application. The battery’s performance, aging, and safety rely on crucial factors such as the depth of charge/discharge (DoD), temperature, C-rate, etc., without which the state of predictions, especially the aging path for the reuse/repurposing of batteries, remains uncertain and risky [
9,
10,
11].
When vehicle battery packs are disconnected from the primary vehicle, the challenging dismantling procedure usually allows modules to become available, but the question remains about the state of the cells inside the same module [
12]. Thus, it is important to extract the battery cells following the top-down approach so that individual performance can be checked before repurposing. Within this research work, second-life battery cells dismantled from commercial vehicle packs are studied extensively in terms of aging, developing an accurate estimation model to understand the SoH [
13]. The second-life cells of the NMC 141 Ah prismatic type and 65 Ah pouch are produced by prominent manufacturers. The cells follow a detailed pre-check before being investigated for long-term application.
In the field of SoH modeling, there are numerous estimation modeling methodologies in the literature, which can be divided into empirical [
14], electrochemical [
15], and data-driven techniques [
16]. The latter has gained attention in recent years due to the development of numerous algorithms, especially machine learning algorithms that are frequently trained with success on the battery time-series dataset. In addition, no prior knowledge of the battery’s history or complex invasive characterization process is needed, making machine learning algorithms more suitable for aging prediction work. However, most of the data-driven work that exists in the literature is developed on the first-life battery dataset following a controlled lab experimental campaign [
17,
18]. On the other hand, some works have addressed the challenging second-life aging estimation [
13,
19,
20]. However, the modeling of second-life cells when the first-life usage history is unknown is rare to find. This uncertainty of having no historical usage information on the second-life battery behavior analysis and data-driven modeling is challenging. Thus, the dataset generated from the long experimental campaign of the second-life cells is valuable; moreover, the training and testing of data-driven algorithms on a lab-based study of the second-life cells is also unique in the literature. In this research, after generating two second-life aging datasets from real-world vehicle cells and evaluating different trained algorithms’ performance on lab- and real-scale profiles, ElasticNet is reported to be the best-performing model for both cell types. The final validation of the cells is done on the cells’ data, which were not part of the training set and were cycled with a real-life stationary profile to show the model’s robustness. In the following parts of the paper, the test protocols are described in
Section 2, after which the results are analyzed in
Section 3. The model development work, including feature engineering and validation results, is reported in
Section 4. In
Section 5, the conclusion is outlined along with the future work.
2. Experimental Setup
A total of 36 battery cells (18 of each type) were collected from the single pack of each type for this study. The test campaign is designed to characterize the 2nd-life cells’ aging by generating a high-quality dataset with a range of check-up and cycle life tests. The test campaigns ran in parallel for NMC types for close to 18 months. A total of 8 operating conditions, as listed in
Table 1 and
Table 2, were assigned for the prismatic and pouch types, respectively.
Figure 1 displays the sample physical cell under test, which is a prismatic NMC/C Li-ion battery with 141 Ah nominal capacity, 3.7 V nominal voltage, 2.14 kg weight, and a volume of 795 cm
3. On the other hand, the pouch cell has 65 Ah nominal capacity, 3.65 V nominal voltage, 0.9 kg weight, and a volume of 425.88 cm
3.
The 2nd-life aging test campaign started with a physical pre-check and preconditioning of the cells before making the final setup. The physical inspection includes a visual check of any damage, cracks, broken parts, corroded tabs, swelling, vent status, and open circuit voltage (OCV), etc. After that, the cells are commissioned to the test bench, and the first precondition test is run, which consists of three continuous full charge–discharge cycles with the recommended C-rate at room temperature. The aging conditions are preselected according to the scenarios presented in
Table 1 and
Table 2. The test procedure includes the beginning or end of first life (BoL/EoFL) standard characterization and then cycling as per defined conditions with a frequency of 100 full equivalent cycles to track the SoH until the actual capacity drops below 60% of the nominal [
21]. A full equivalent cycle is defined as one full charge event equal to the nominal capacity value. The test procedure and part of the pouch cell’s electrochemical impedance spectroscopy data have already been reported in our previous work [
13].
The characterization procedure, which was usually performed at BoL, EoL, and intermediate frequency of 100 FECs, includes standard capacity test, hybrid pulse power characterization (HPPC), and open circuit voltage (OCV) tests. The flow of experiments is a standard activity that is followed for battery model development studies [
13]. The capacity test is designed with three full-discharge cycles at a C/3 rate, where C refers to the nominal capacity of the cell. The HPPC test is performed to calculate internal resistance (IR) at different SoC percentages (at 80%, 50%, 20%) with 10 s 0.33C charge–discharge pulses. The slow quasi-OCV test is done with a C/20 charge–discharge cycle at room temperature. Hence, a so-called dynamic test, referring to a real-life day-long profile optimized for the cell types, is performed with two cells of each type separately to understand the battery characteristics for non-static cycling. The dynamic cycling test was performed at room temperature, and the profile was run between 35% SoC and 90% SoC. The number on the FEC scale is calculated as equivalent to 15 FECs for each dynamic cycling round—in this case, before doing the characterization. The EIS test is also performed as part of the campaign, but is excluded from the analysis as it is not within the scope of this research.
3. Results
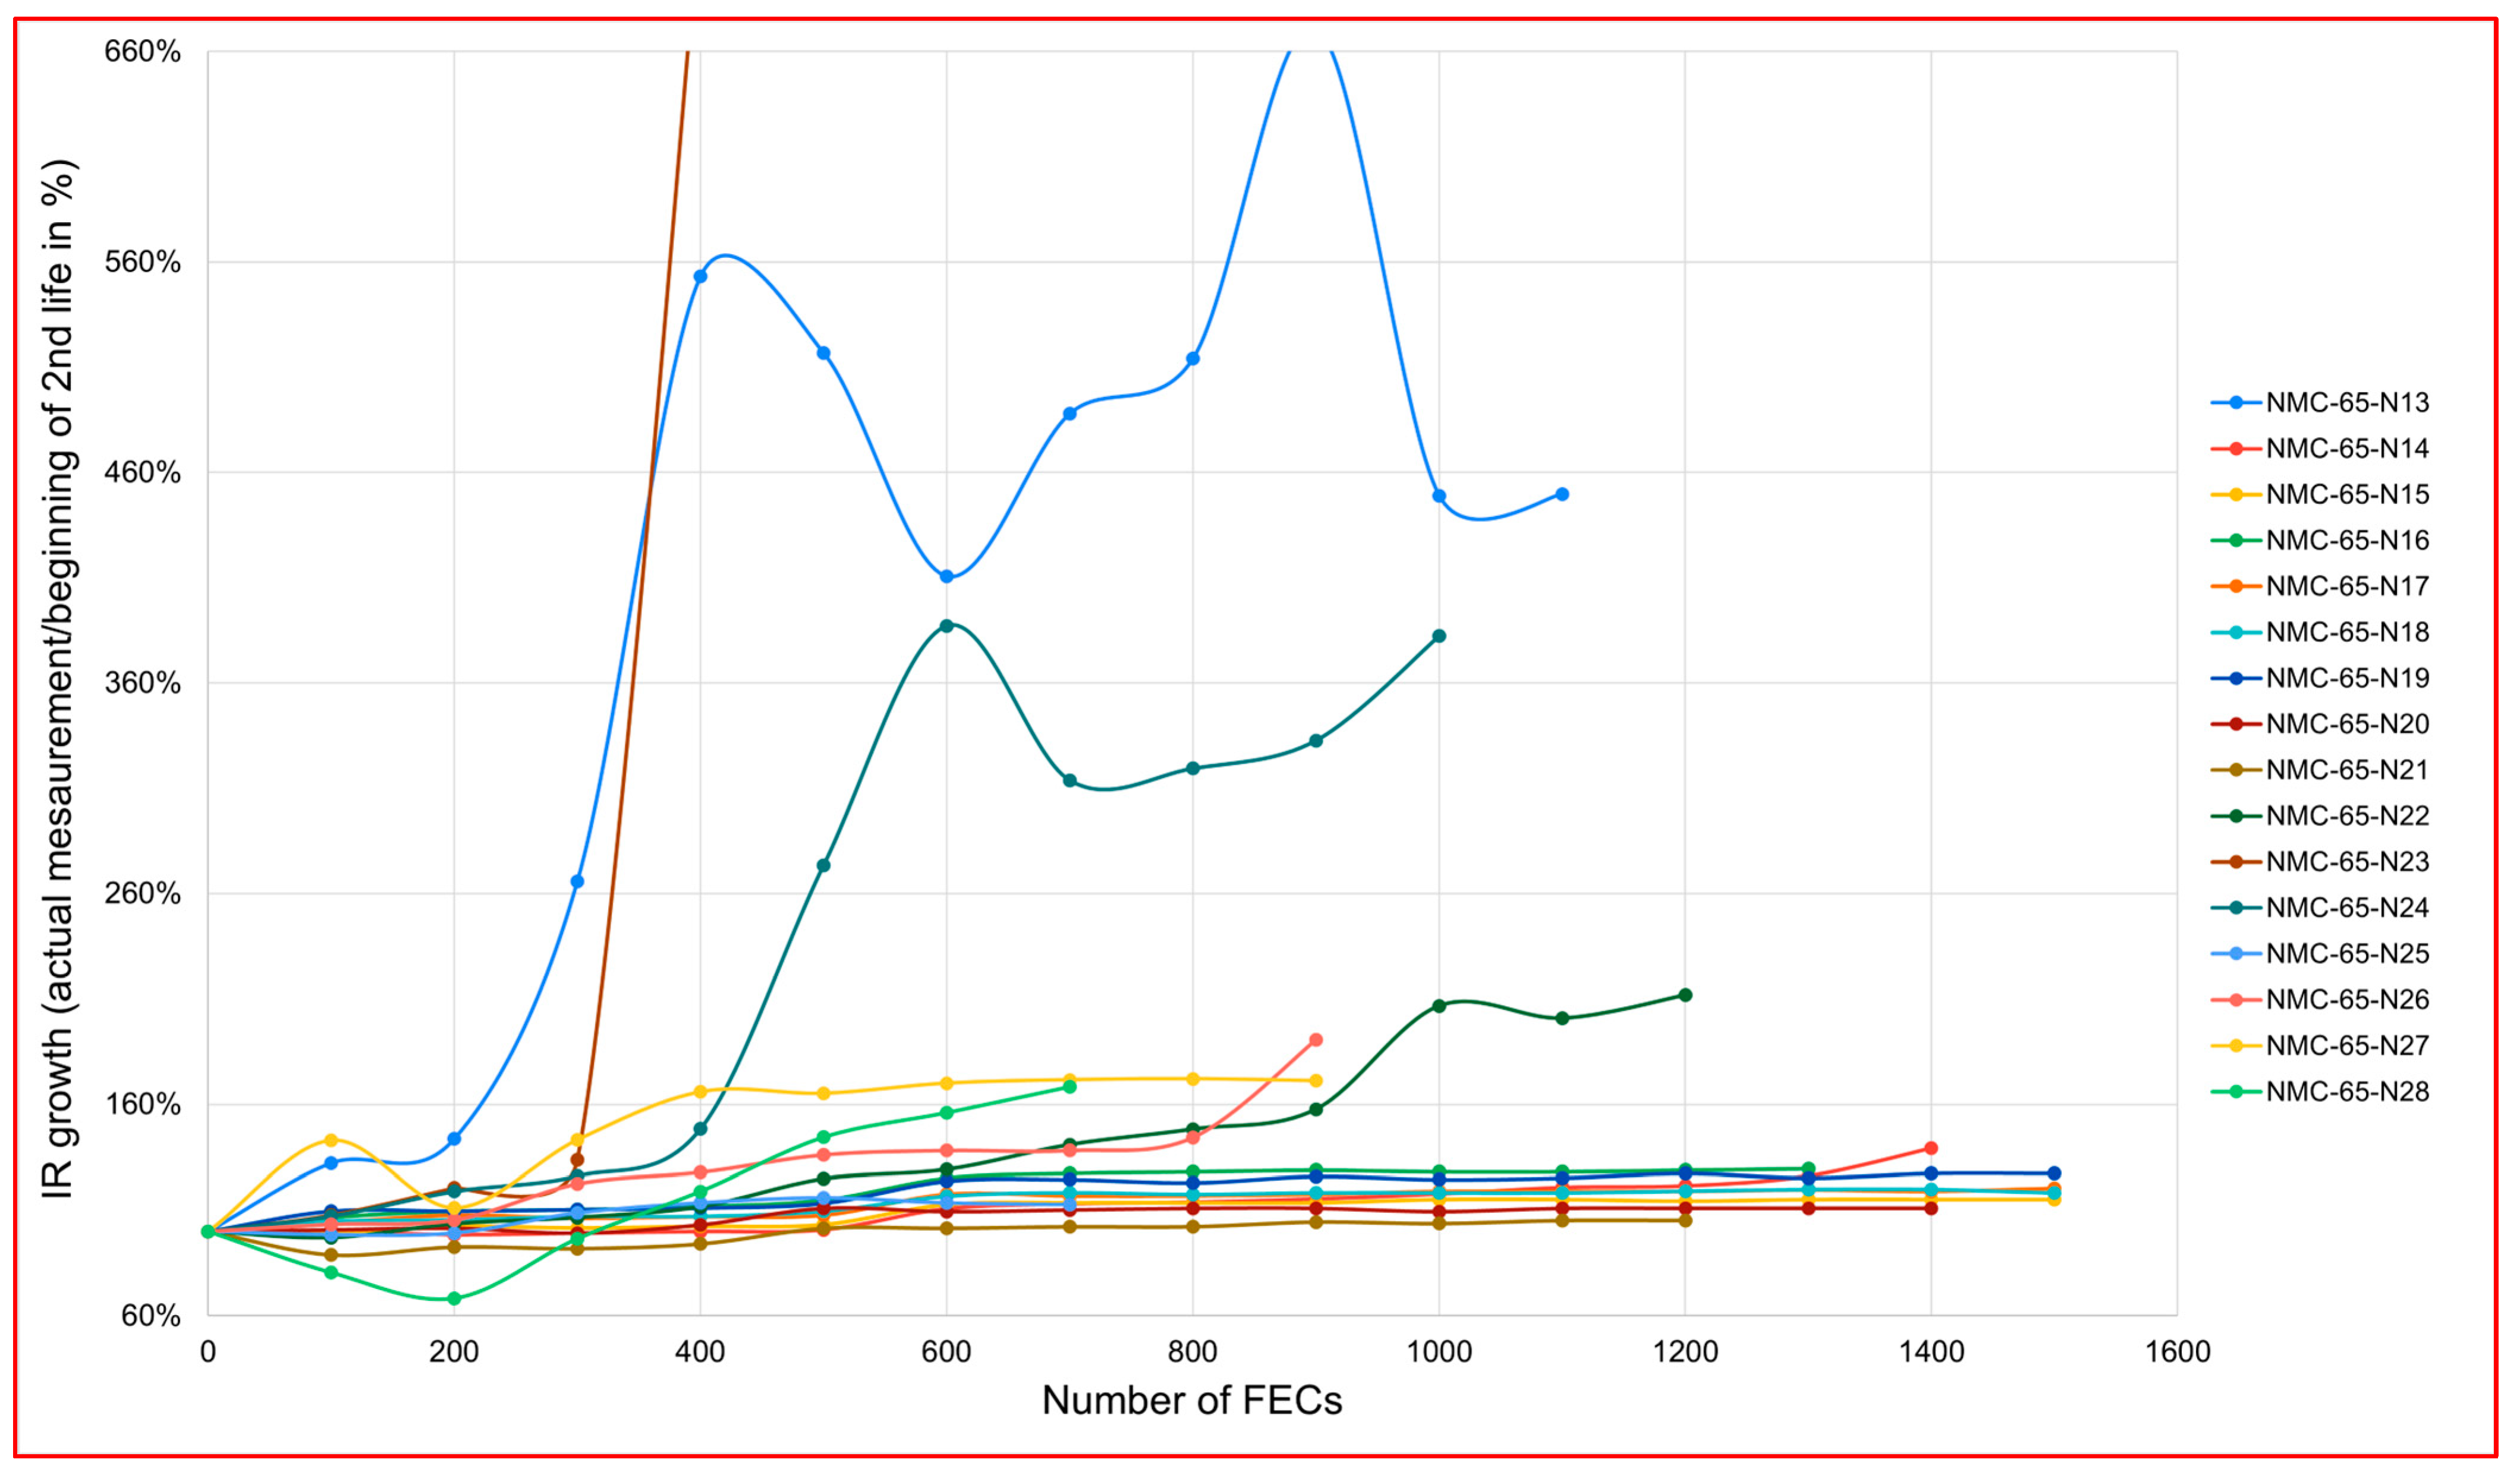
The dismantled battery cells showed an almost similar SoH compared to a fresh battery, meaning that they were well balanced and aged similarly in the pack. The SoH levels also referred to a minimum use for the NMC 141 Ah. For either of the cases, there is no information available on the first-life usage. Thus, the beginning of the second-life measurement is used as a reference, except for the nominal capacity value, which is picked from the cell data sheet. The calculation for the internal resistance growth calculation for the NMC 65 Ah (NMC 141 Ah is almost fresh) has a shortcoming, as the first-life internal resistance growth could not be determined, so, the start of the second-life IR value is considered as the reference. The battery capacity fade, internal resistance check, and OCV shift are tracked during the aging campaign via characterization tests.
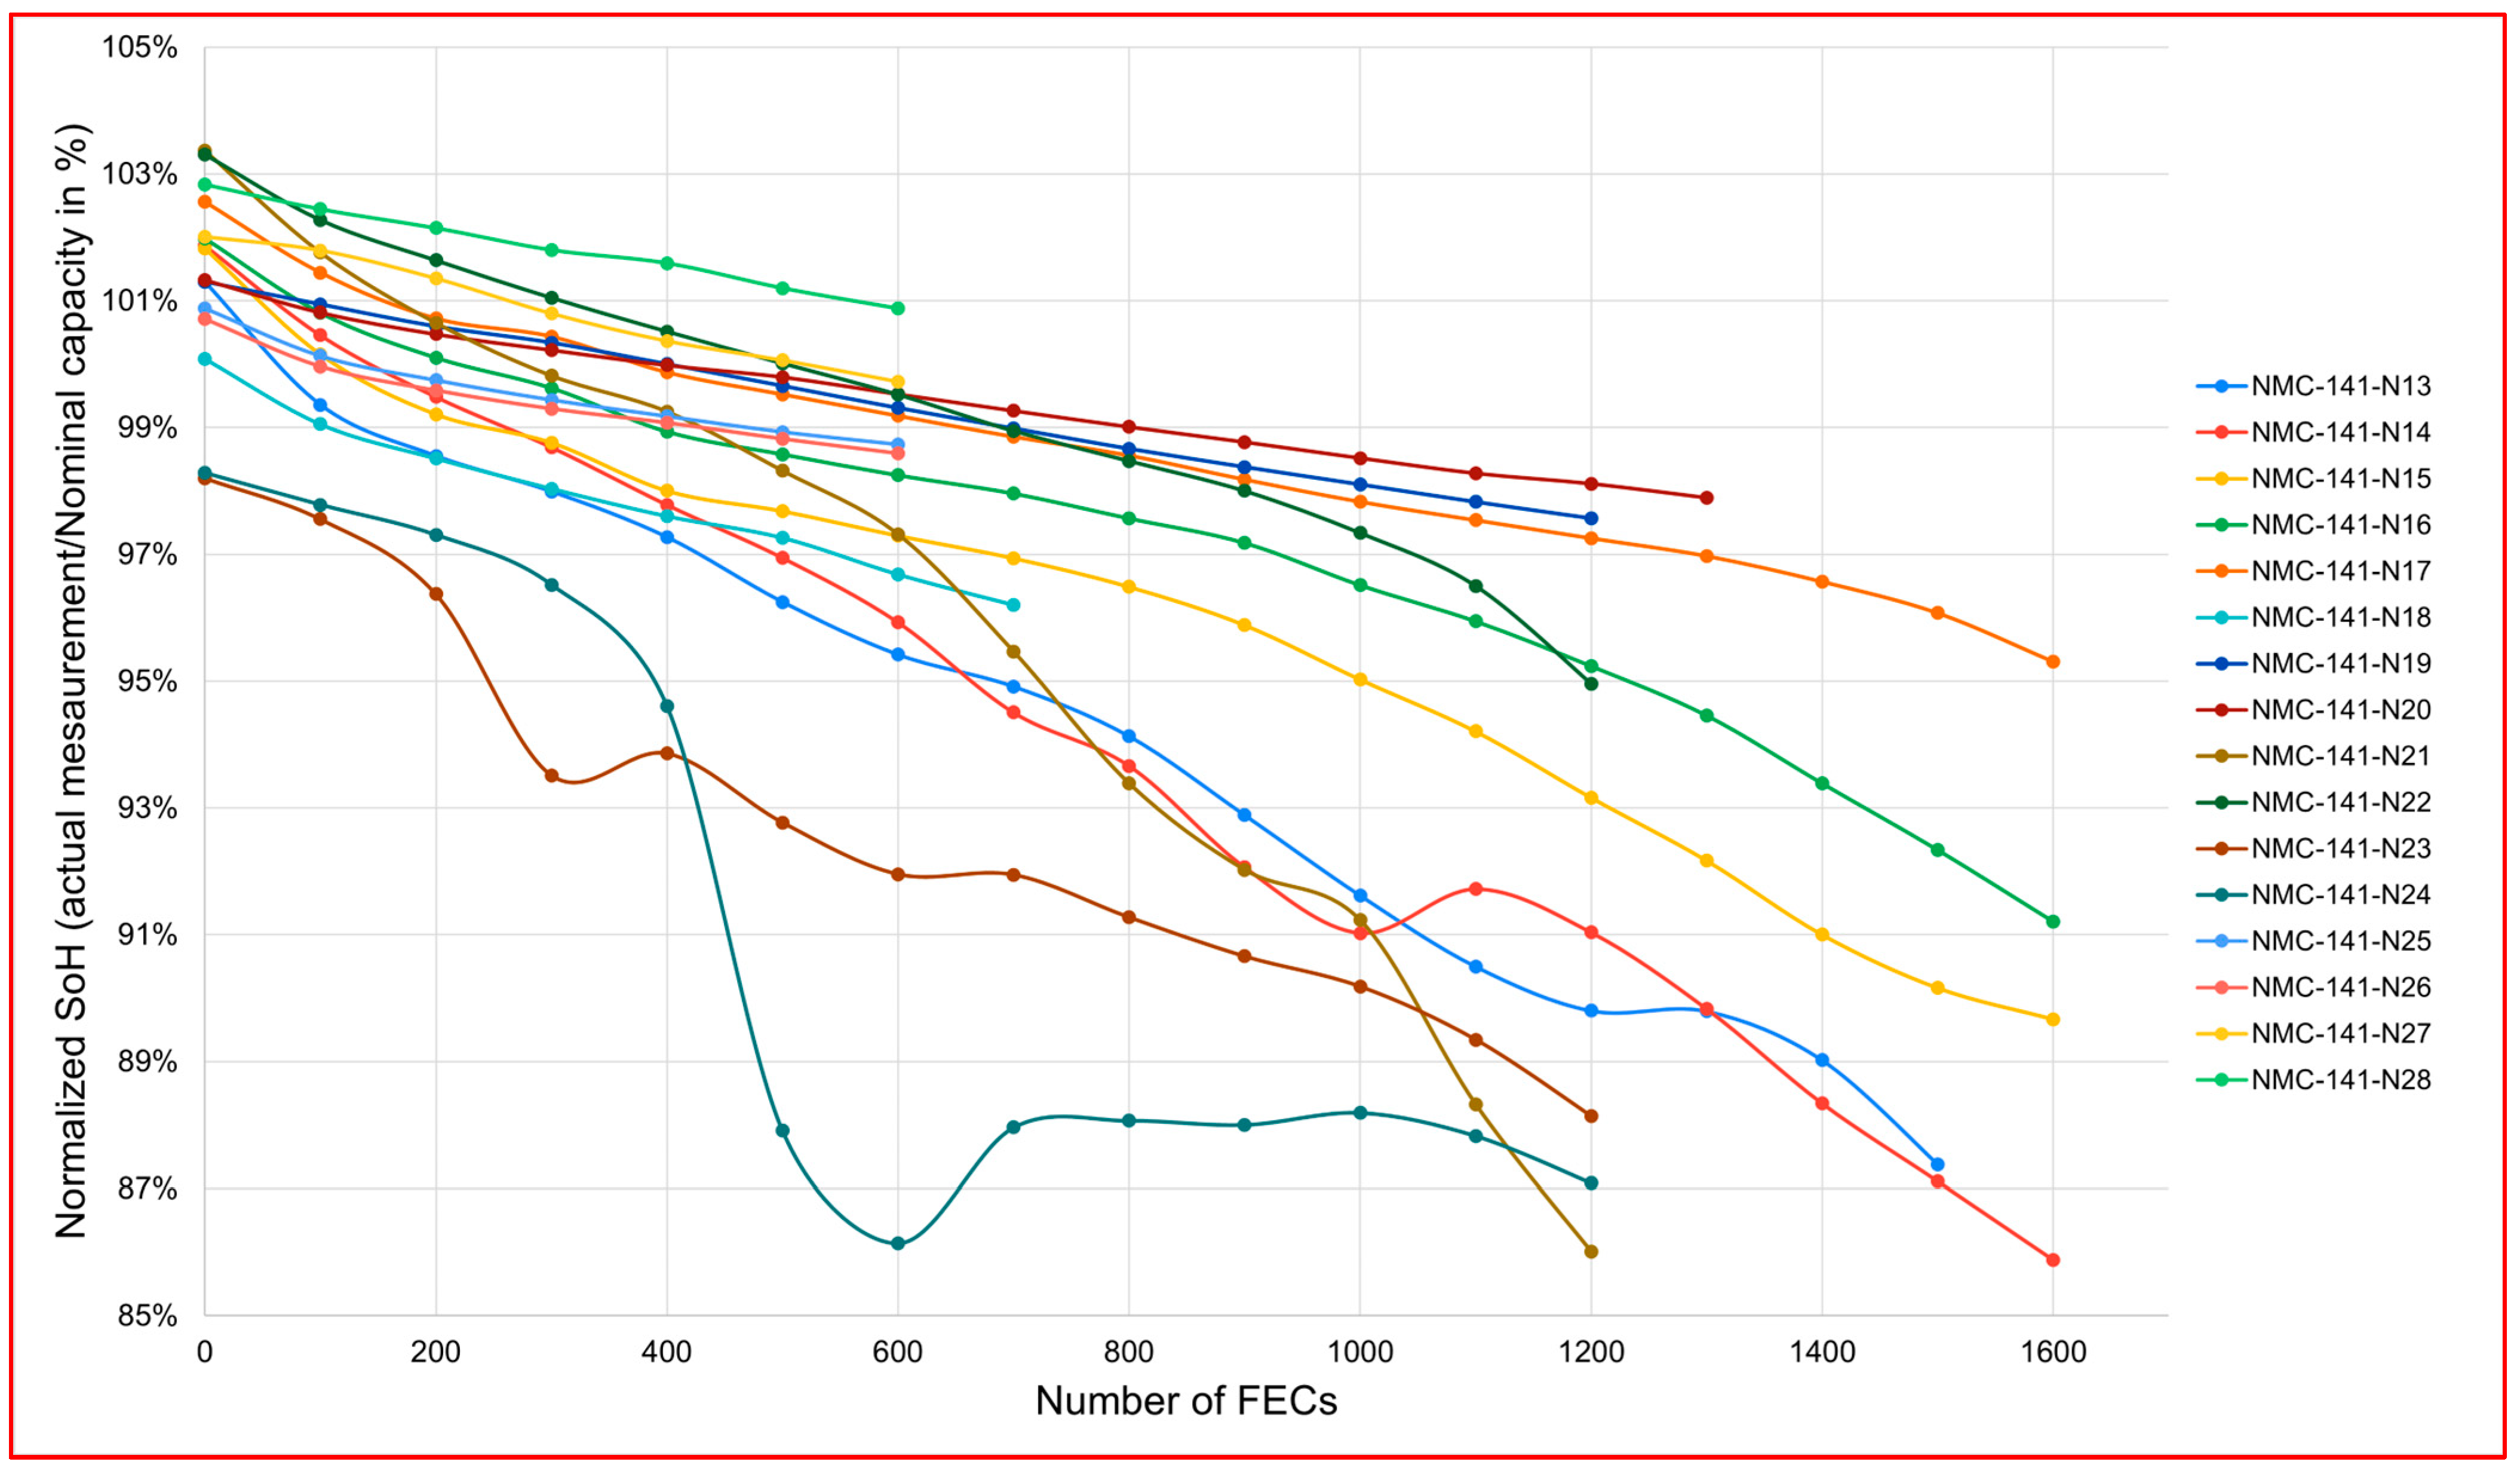
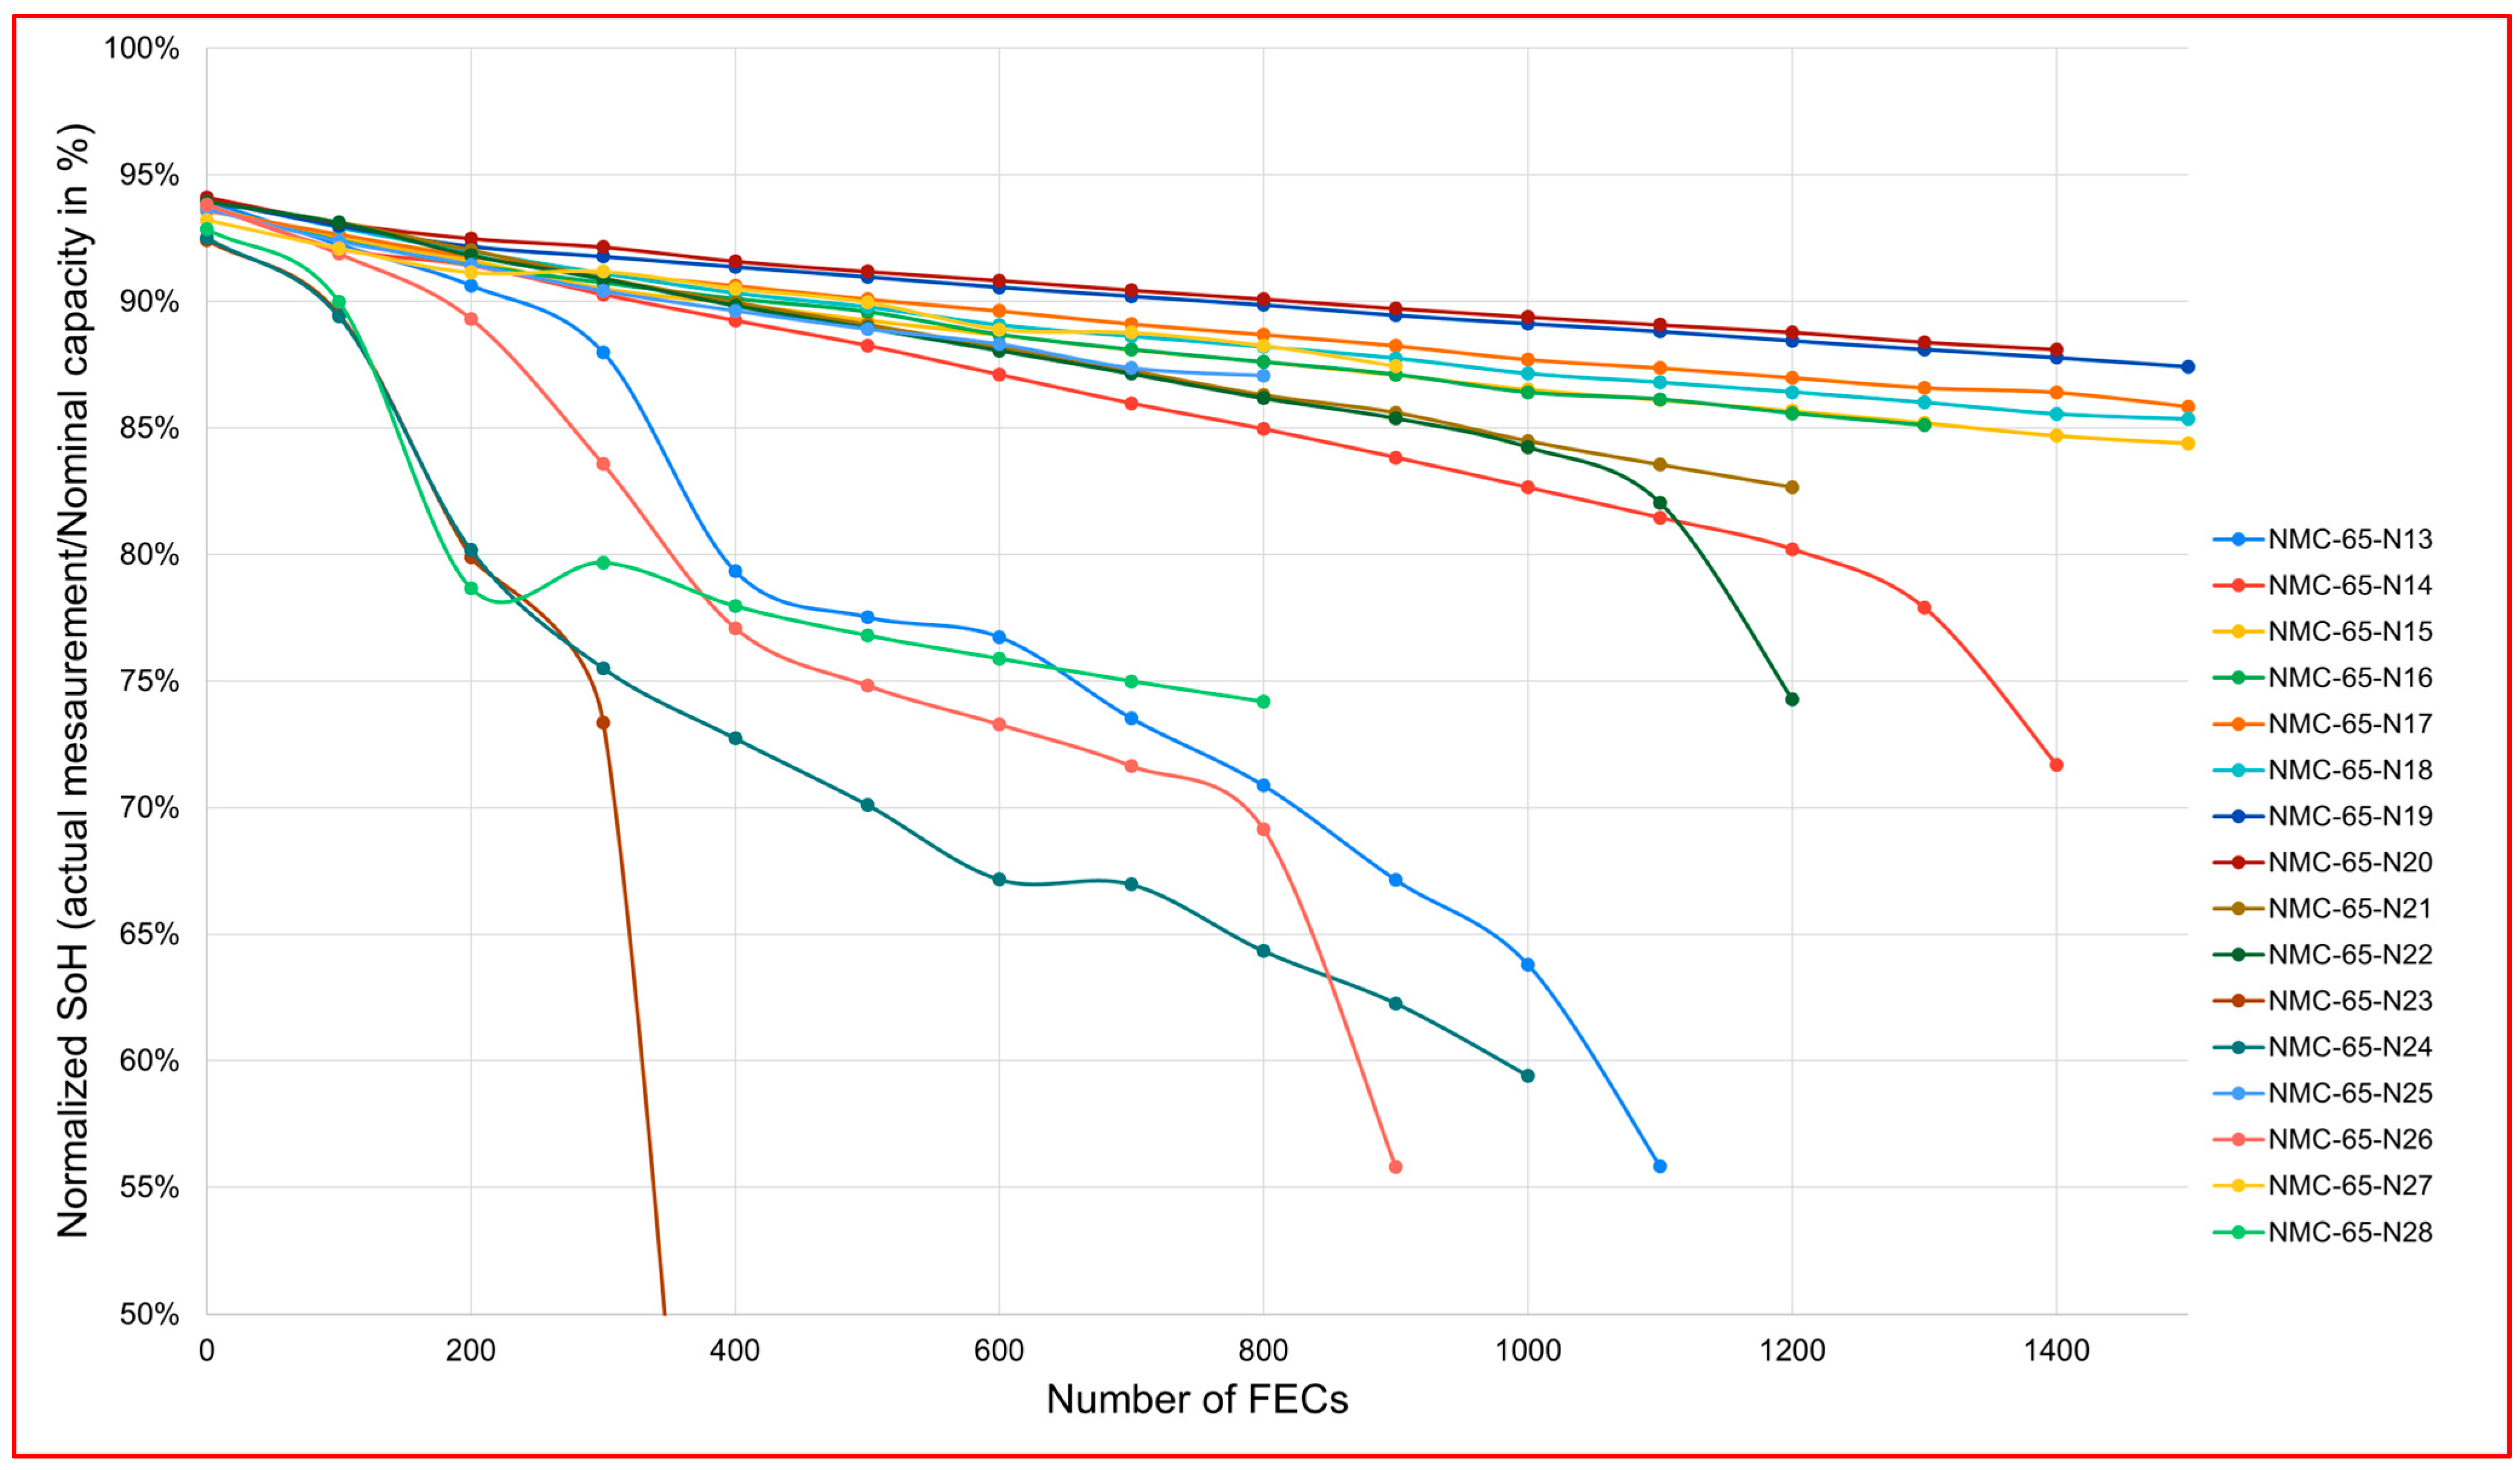
Figure 2 and
Figure 3 display the capacity fade of the studied cells, where the high DoD and temperature are found to be more prominent in general, resulting in a sharp decay in the capacity fade [
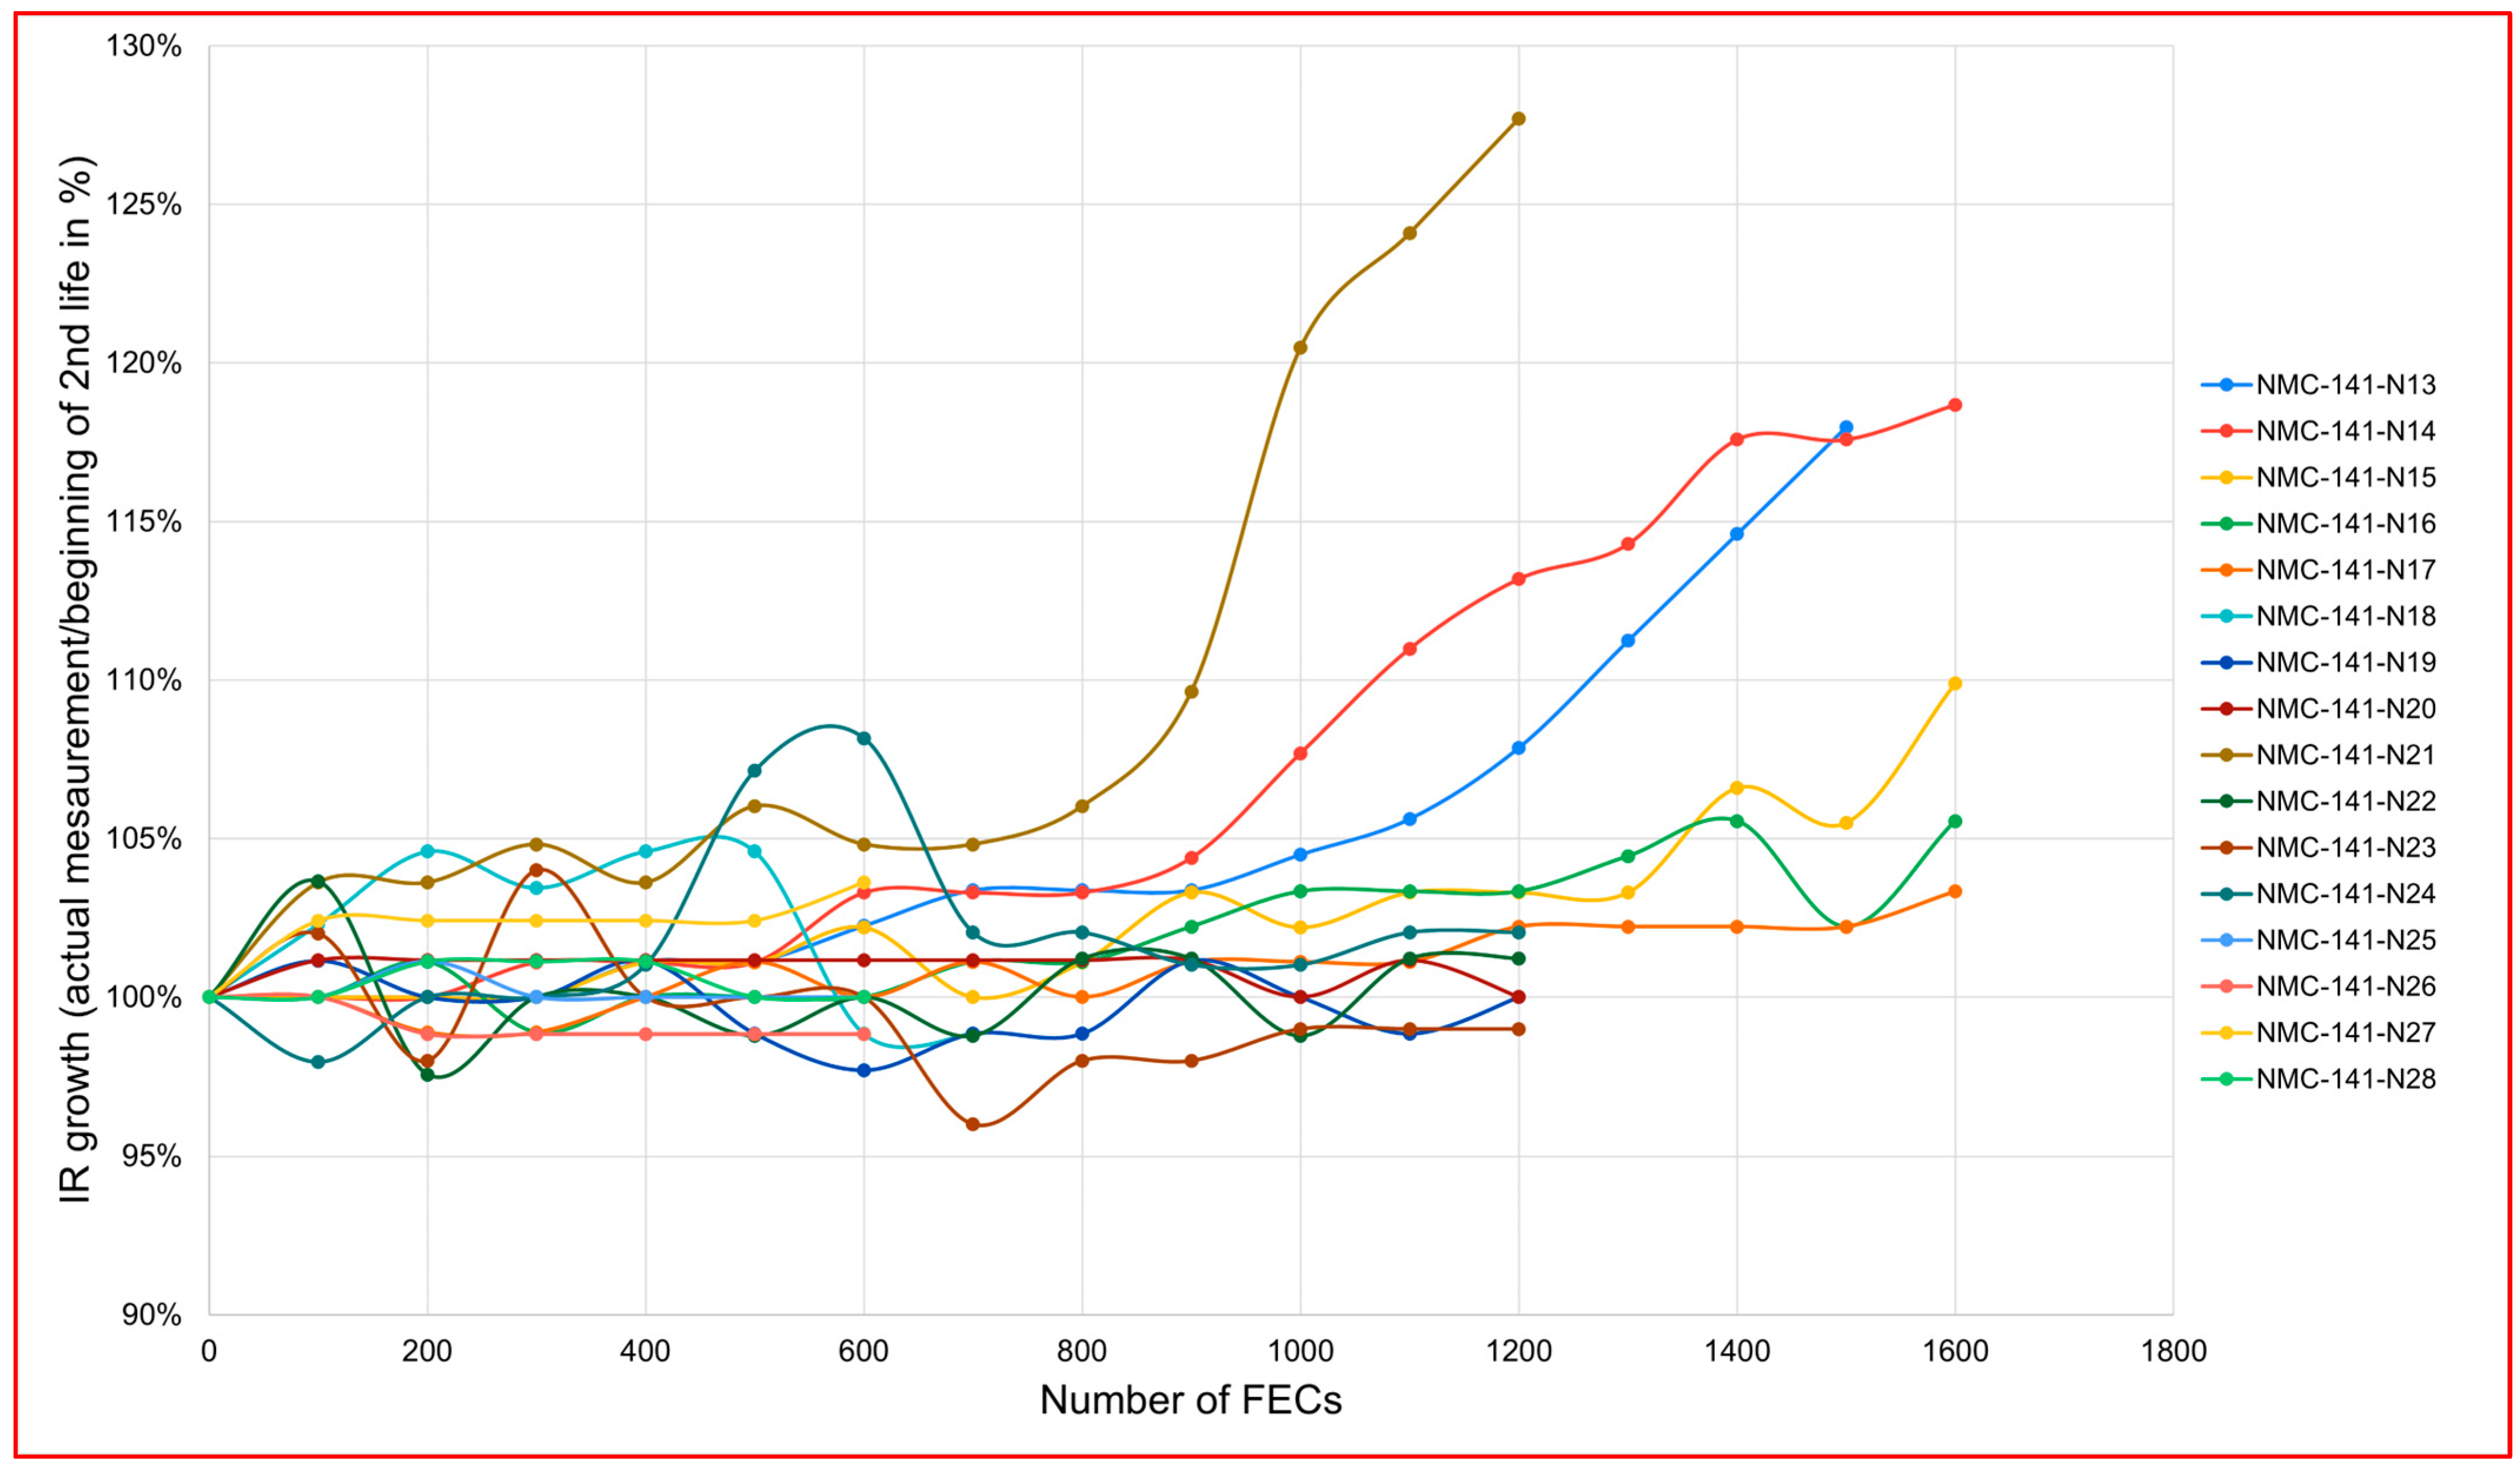
22]. Similar results are found in internal resistance growth [
23] as displayed in
Figure 4 and
Figure 5 and the OCV curves.
The capacity degradation behavior of NMC 65 Ah cells followed the typical aging path, where the lower and higher temperatures experience a higher capacity drop with higher cycle numbers [
2]. In this case, the high DoD cycling in general showed a quicker drop in the capacity, but with the addition of extreme temperature, especially at cold temperatures, the batteries degraded the most. Another couple of cells that were dead from a room-temperature cycling condition had high resistance growth. More unknown degradation mechanisms might occur, linked to the first use of the cells, which could not be verified. The resistance growth of the more aged cells also showed a high growth in internal resistance.
The NMC 141 Ah cells, which were almost new, were cycled under the same type of conditions and showed similar characteristics. The high DoD cycling has a faster degradation, and together with cold temperatures, the cells experienced the most aging. However, the cells have a low-to-moderate level of internal resistance growth. The slow C-rate cycling (0.33C) showed a low aging rate at room temperature compared to 1C cycling for this type of cell.
The cells completed a maximum of 1600 and 1500 FECs by the end of the campaign, with a maximum of a 16% and 50% SoH drop for the NMC 141 Ah and NMC 65 Ah cells, respectively. On the other hand, the maximum internal resistance growth for the NMC 141 Ah cell went to 26%, the same as the NMC 65 Ah, which crossed 500% growth point due to one cell reaching the EoL. This abnormal growth of a cell and comparatively higher growth for a couple of others may have happened due to internal damage of the cell during its first life, which accelerated in the second-life campaign.
The capacity-based EoL limit was set to 60% SoH; however, no cell reached that limit for NMC 141 Ah, while four cells were disconnected as they reached the second-life EoL. The SoH is calculated as the actual measured capacity value against the nominal capacity value from the data sheet and expressed as percentiles, while the IR calculation follows a similar approach, but only to cover the growth compared to the BoL (second-life) IR value. Note that
Figure 2,
Figure 3,
Figure 4 and
Figure 5 refer to
Table 1 and
Table 2 conditions, where two consecutive numbered cells are linked to consecutive conditions.
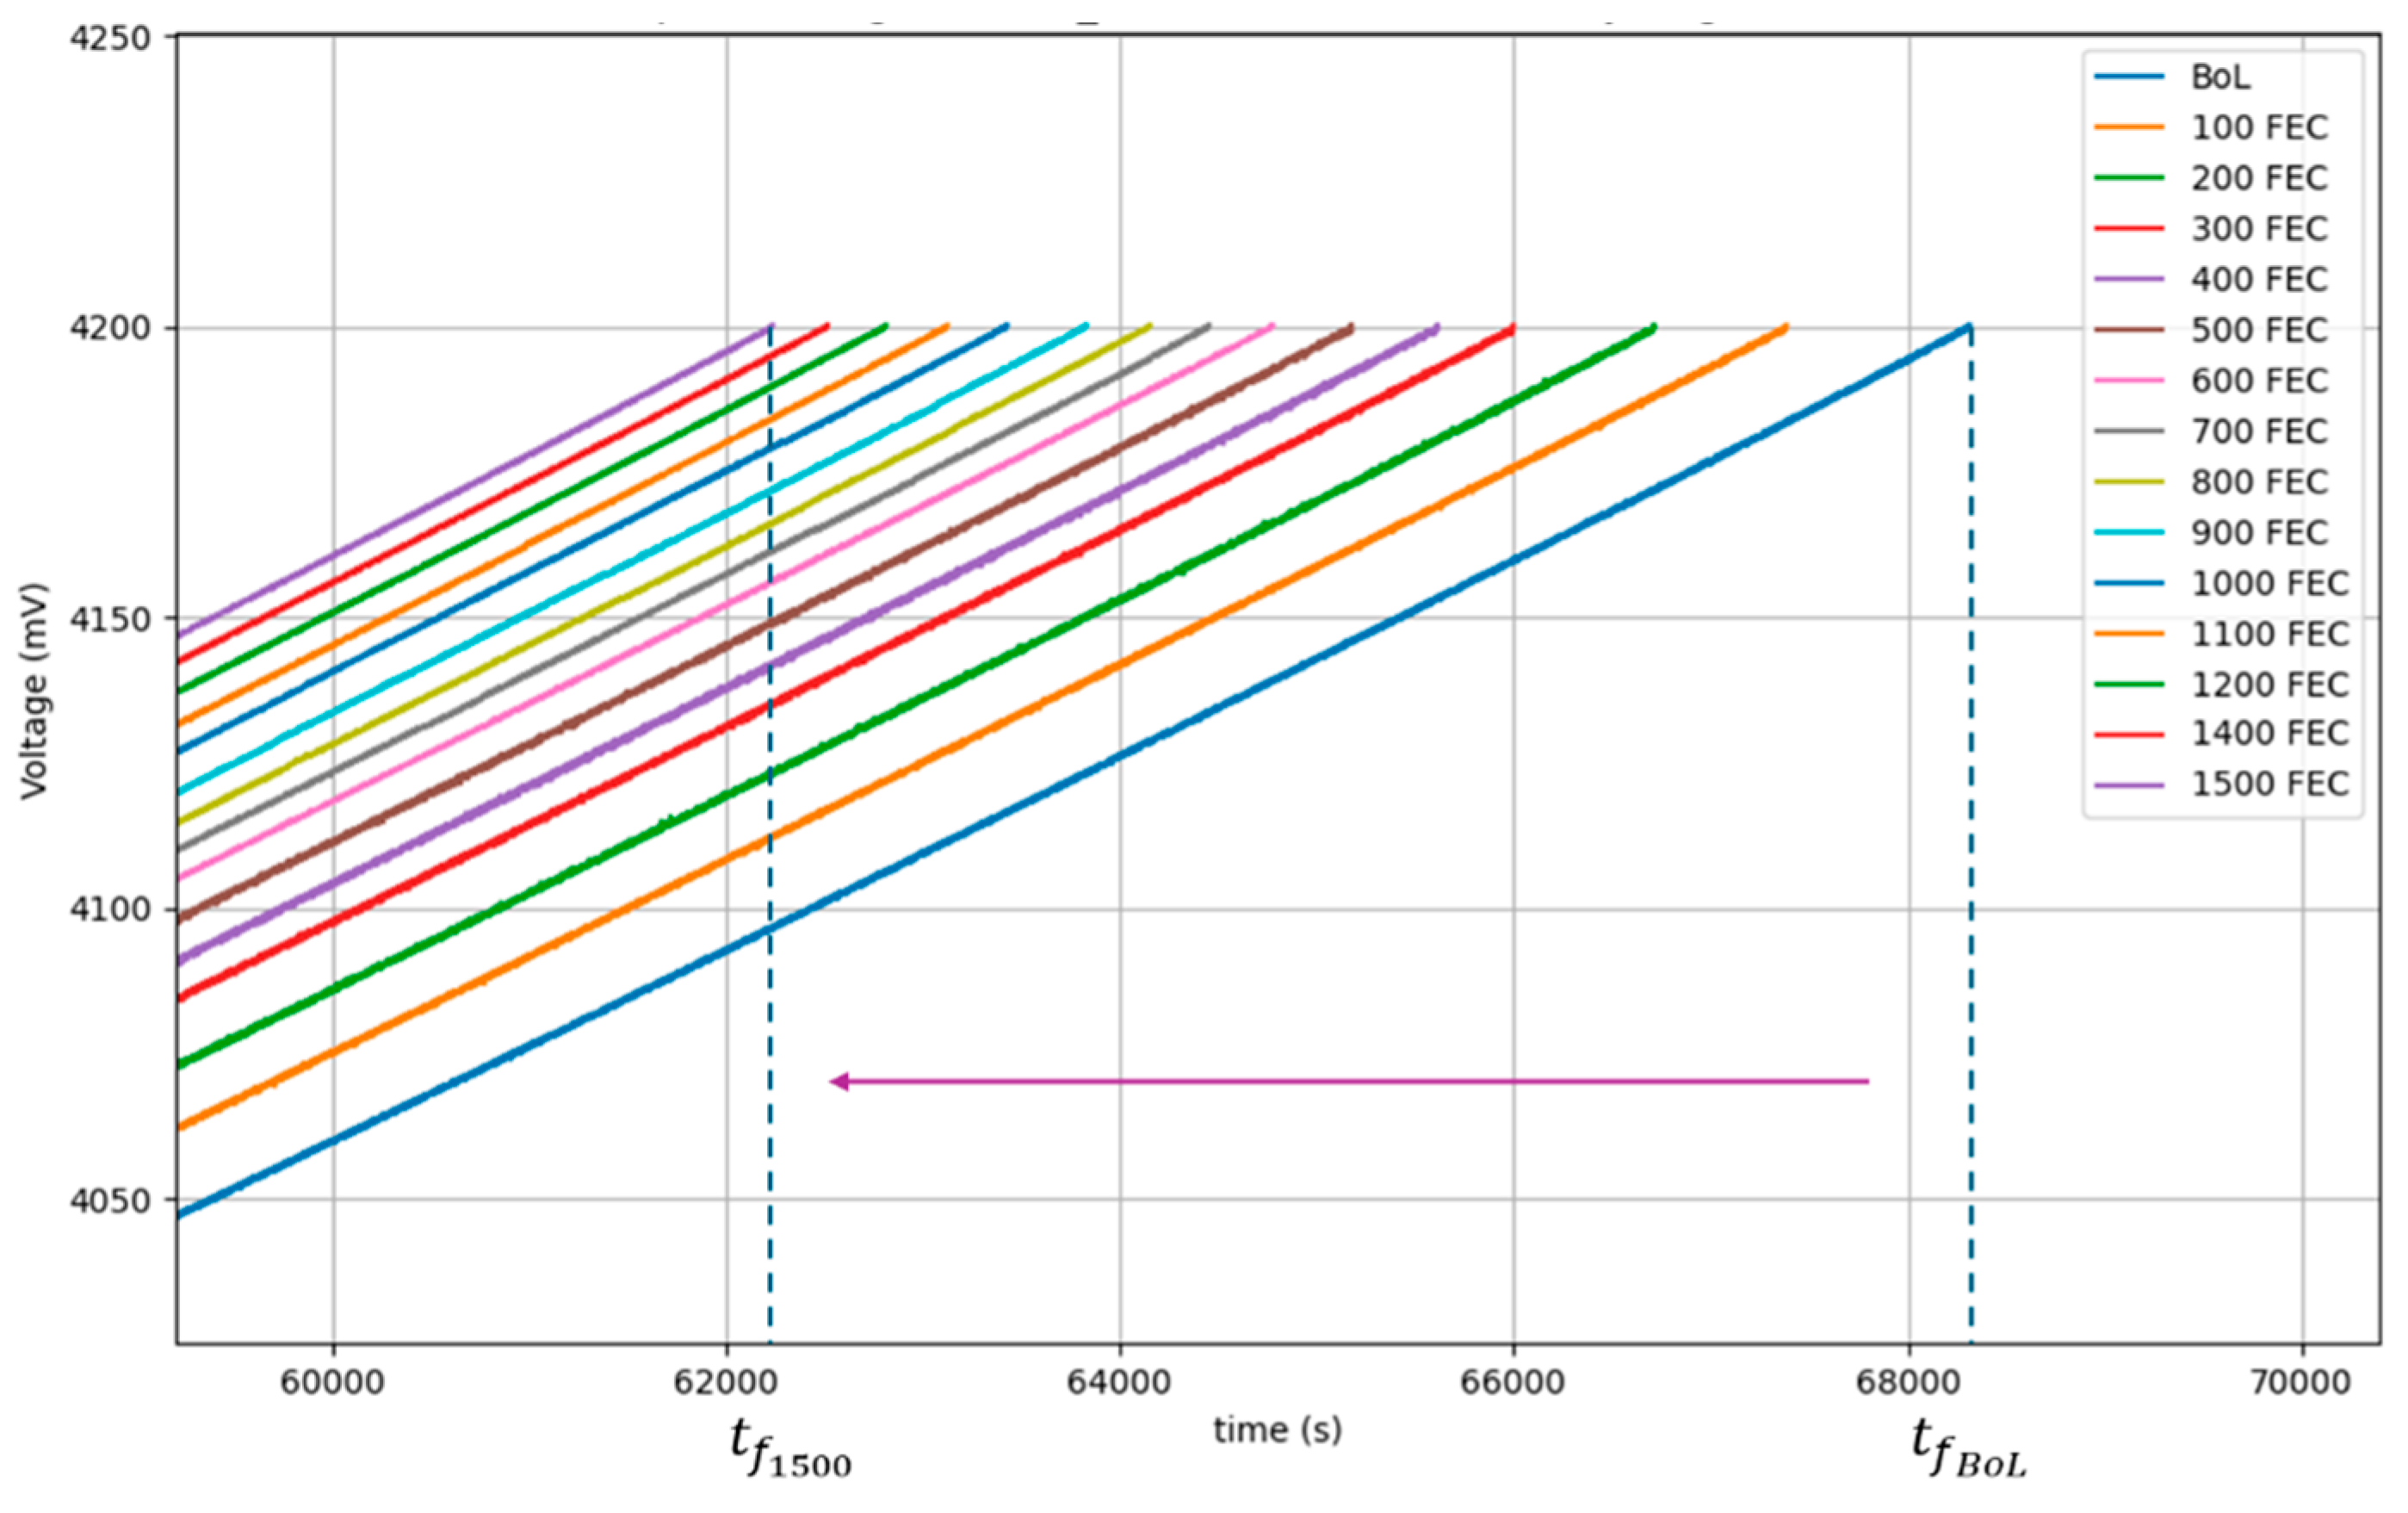
Besides the capacity and internal resistance values, more analysis was performed on the obtained OCV curves from the check-ups, like incremental capacity analysis, equal voltage drop, charge time, etc., to understand the aging behavior better and create more distinguishable features for model development.
Figure 6 displays a sample CC voltage curve for the NMC 65 Ah cell during the lifetime testing.
4. Machine Learning Modeling
4.1. Feature Engineering
One of the challenges for the SoH estimation is to find suitable features that can capture the internal changes in the battery and correlate them with capacity degradation. The battery current, voltage, and temperature data are the most commonly available signals that can be measured during battery operation and can provide useful information about the battery condition. However, these signals are affected by various factors, such as the operating conditions, the measurement noise, and the battery aging mechanisms, and thus, they are not directly related to the SoH of the battery.
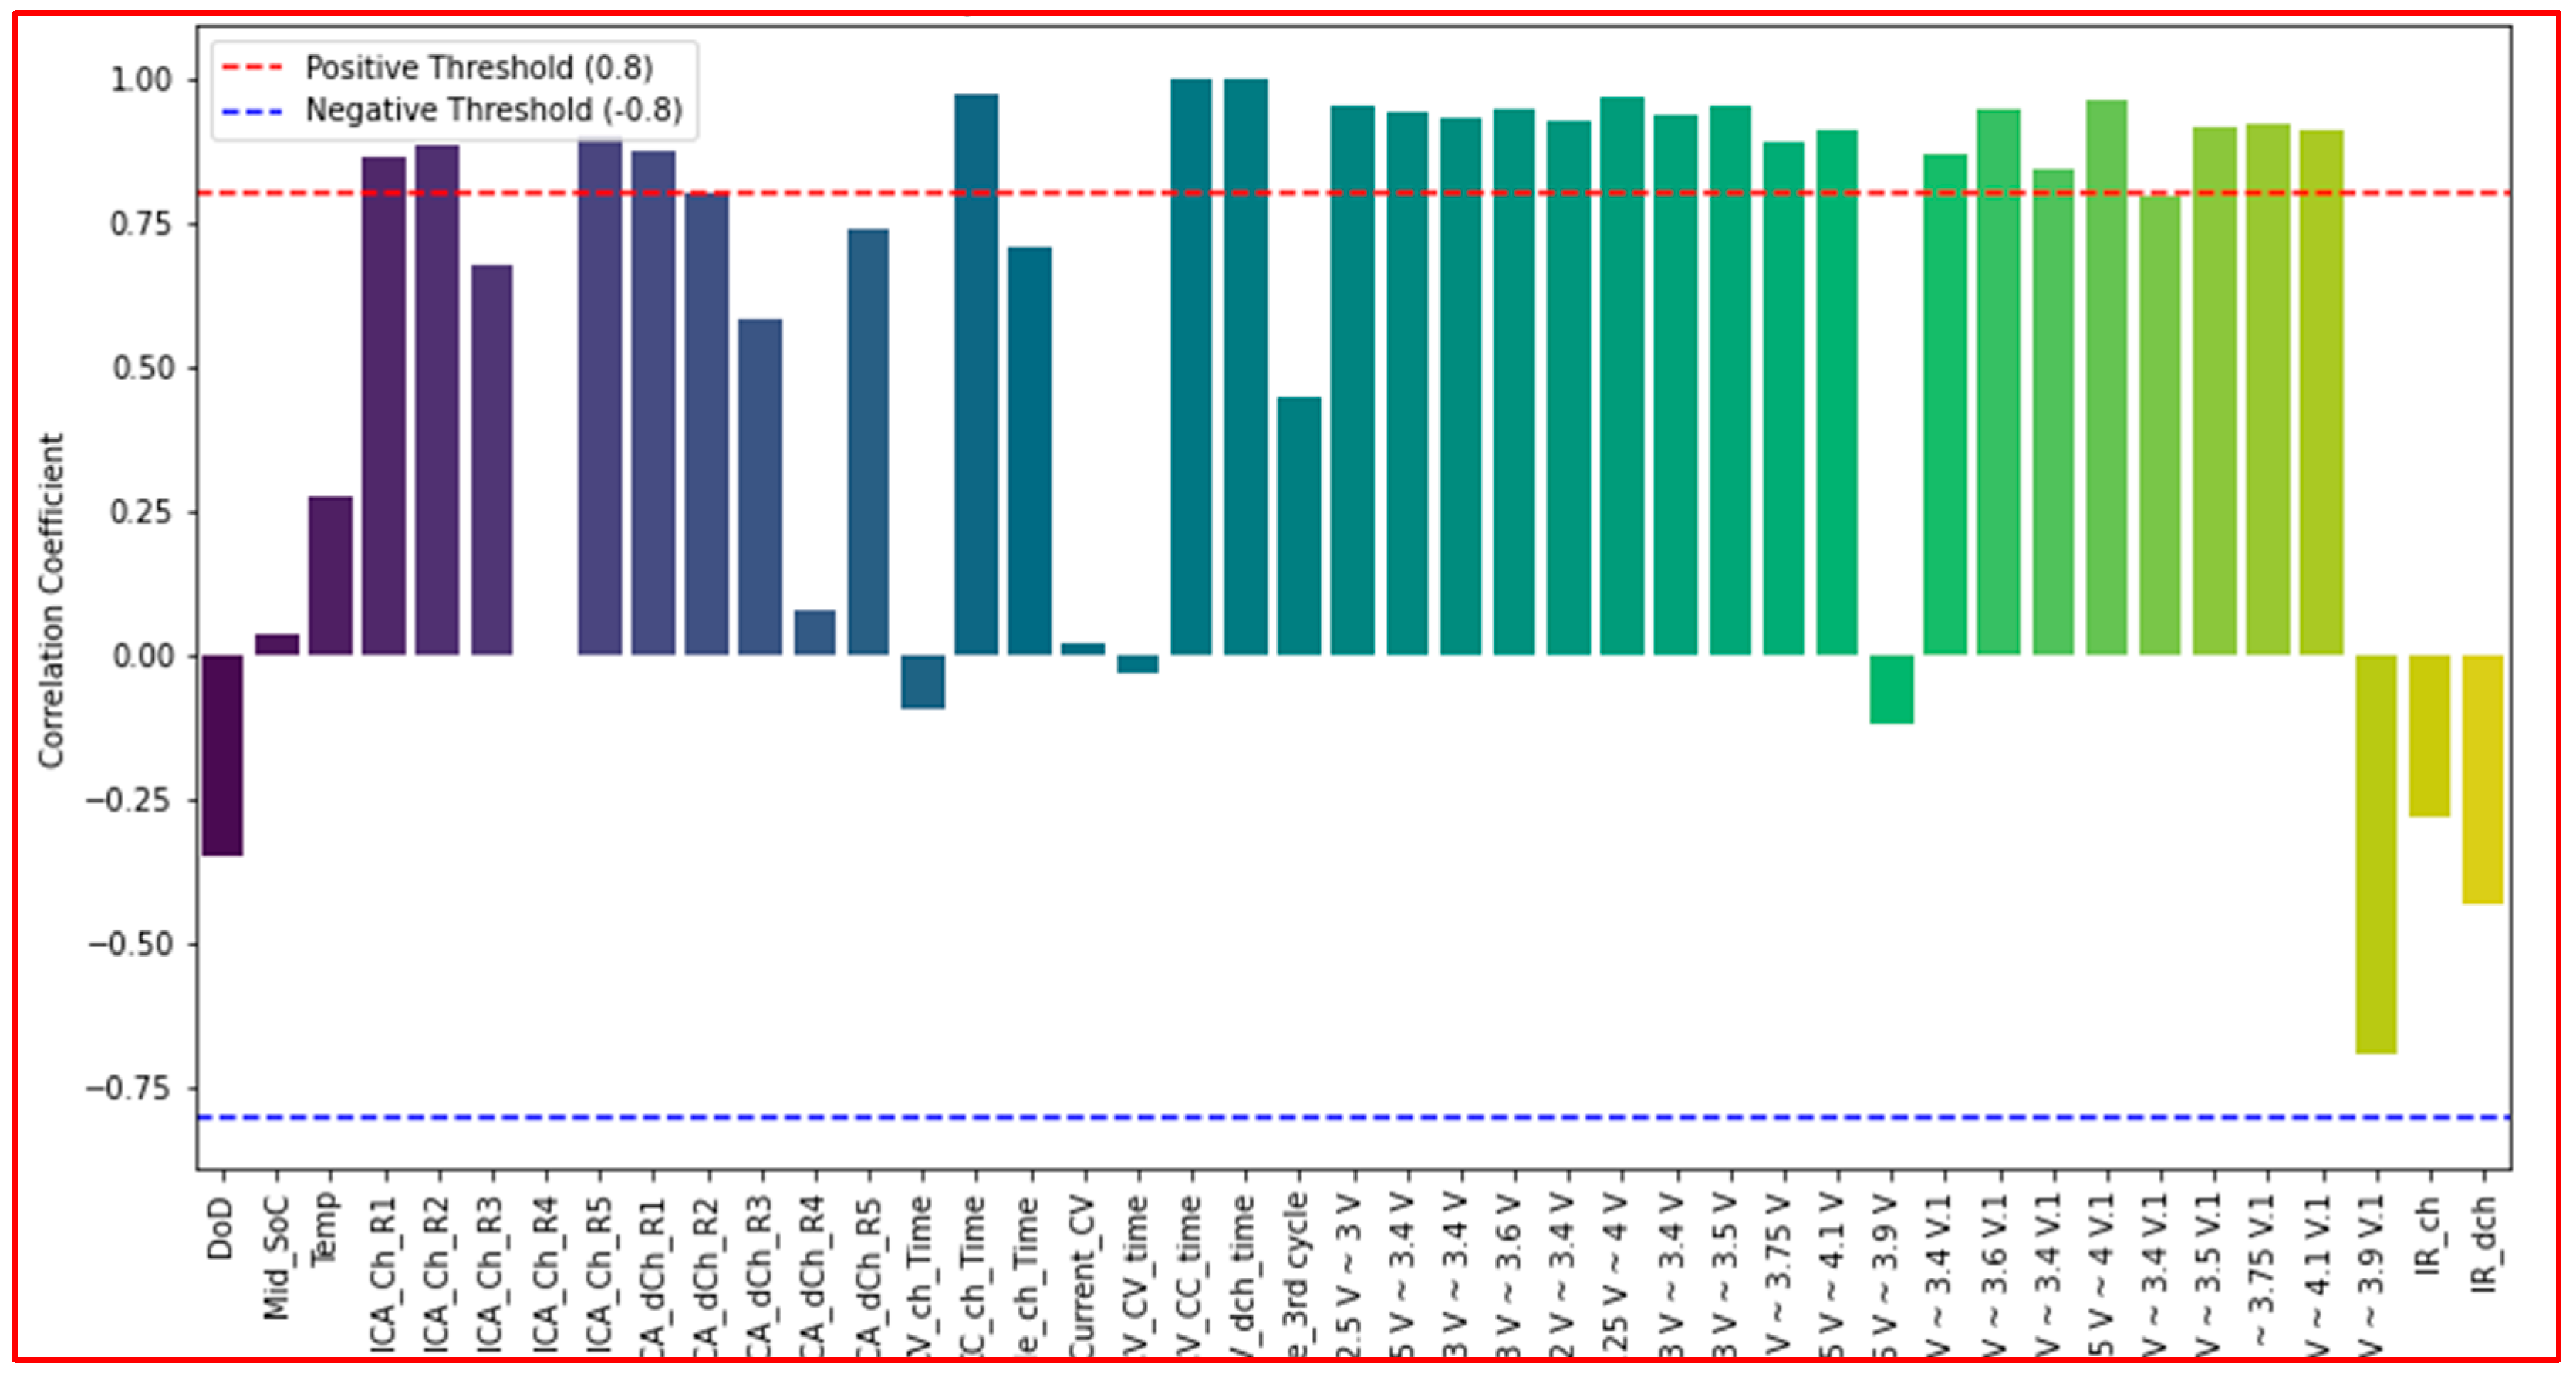
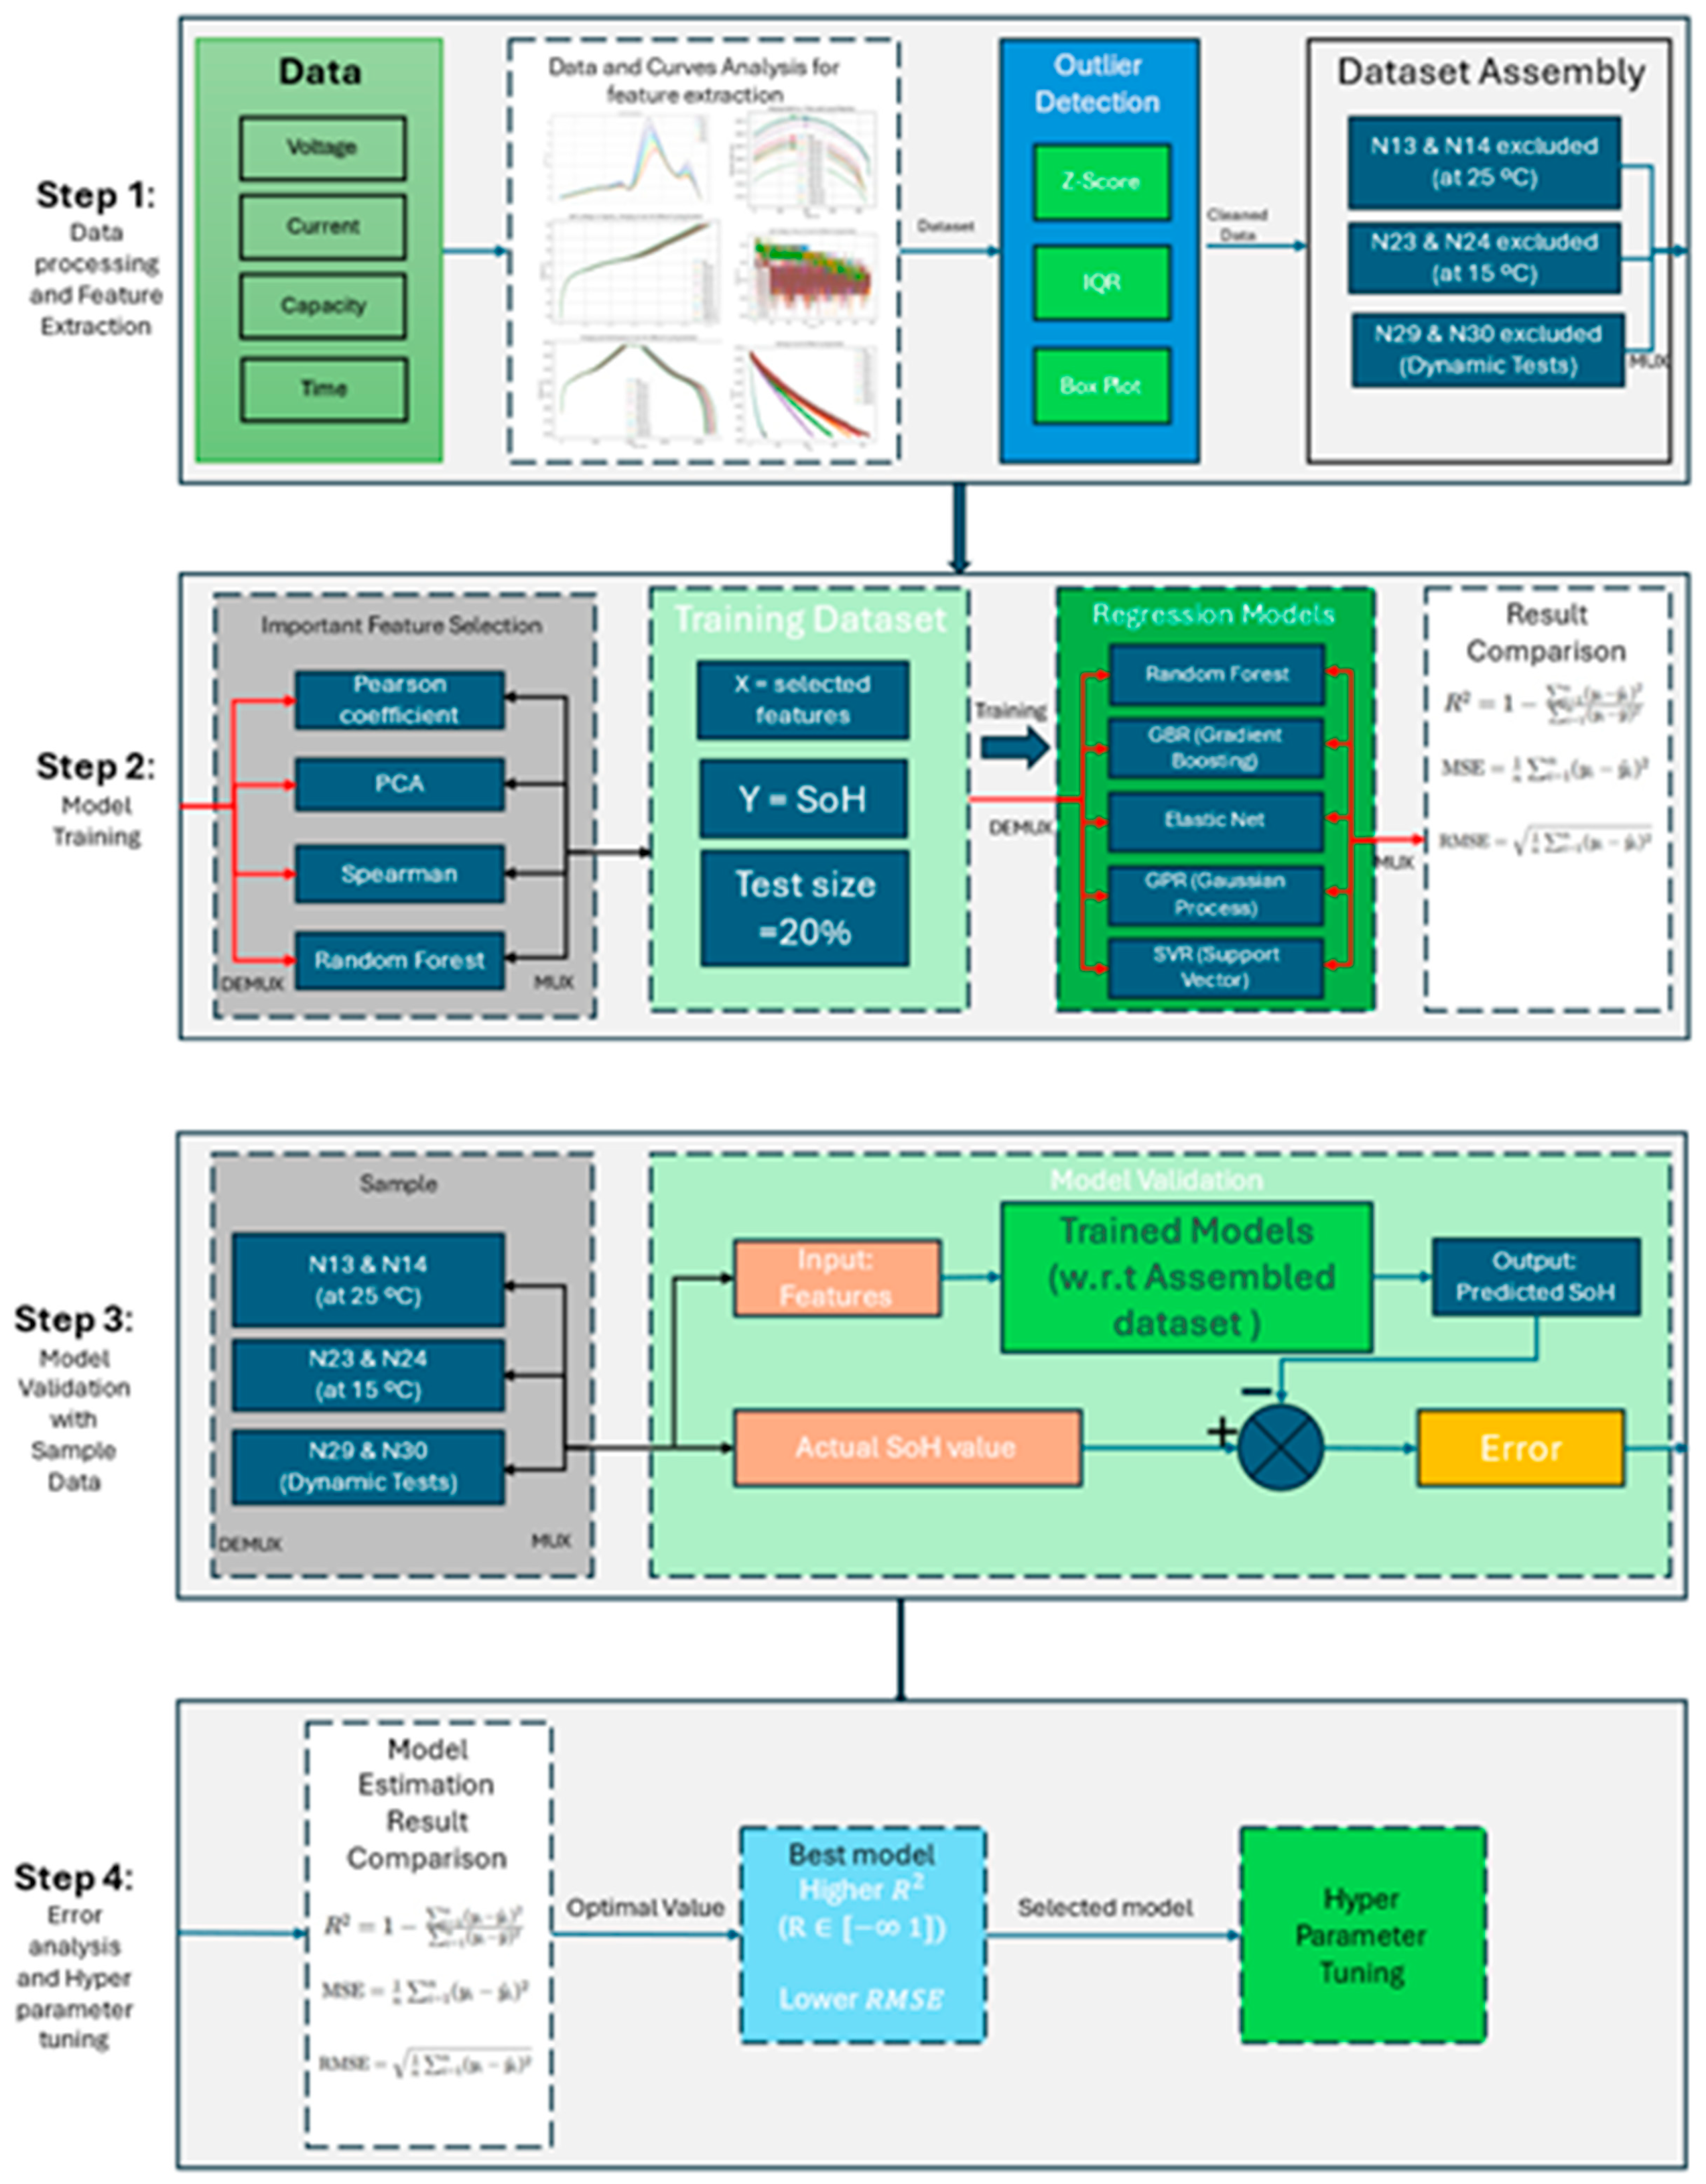
In this work, critical features are selected using different techniques such as the Pearson coefficient, Principal Component Analysis, etc. As shown in
Figure 7, the Pearson coefficient is deployed to identify the right features for the NMC types so that the model does not overfit the estimation. The PCA, with more than an 0.8 variance, resulted in only eight components which were unable to produce satisfactory training–test performance. Thus, the Pearson coefficient is deployed to identify the most crucial features. For example, 24 features were selected for NMC 141 Ah out of a total of 43 features for the training set because they have a score of more than 0.8. The threshold value of 0.8 is selected based on the careful selection of the features that are crucial and linked to battery health degradation. These features are extracted either directly from the tests performed during the campaign (i.e., capacity values) or from analysis (i.e., incremental capacity curves).
Figure 7 provides a comprehensive view of the interrelationships between variables, guiding the selection of independent and relevant features for the model. Some of the crucial features that are found to be closely related to the SoH are CC time values from the OCV test, ICA peaks, mid-SoC voltage ranges for charge and discharge, etc. However, since the correlation matrix analysis is analogous to the Pearson coefficient method (different representation), this method has not been used directly to retain important analysis. In this project, the Pearson coefficient is chosen since it revealed higher performance in comparison to other methods [
24,
25].
The training dataset was prepared by selecting relevant features (X), with the target variable being the SoH of the battery. The whole dataset is used for the feature selection process with the Pearson coefficient matrix, so that the crucial features can be identified at all the aging states. After feature selection, the dataset was split into training and test sets using an 80–20 split, with the first 80% of the time-domain data used for model training and 20% for testing. This chronological split ensures that the models can be evaluated on unseen data to measure their performance. The final validation of the model is performed on the unseen dynamically tested dataset, where the same features were extracted along with the measured SoH for validation purposes. The validation process was done separately for the two different battery cells.
4.2. Algorithm Training
Machine learning (ML) techniques have been widely applied to estimate the SoH of lithium-ion batteries. After training and testing different algorithms, such as Gaussian Process Regression [
26], ElasticNet [
27], Random Forest Regression [
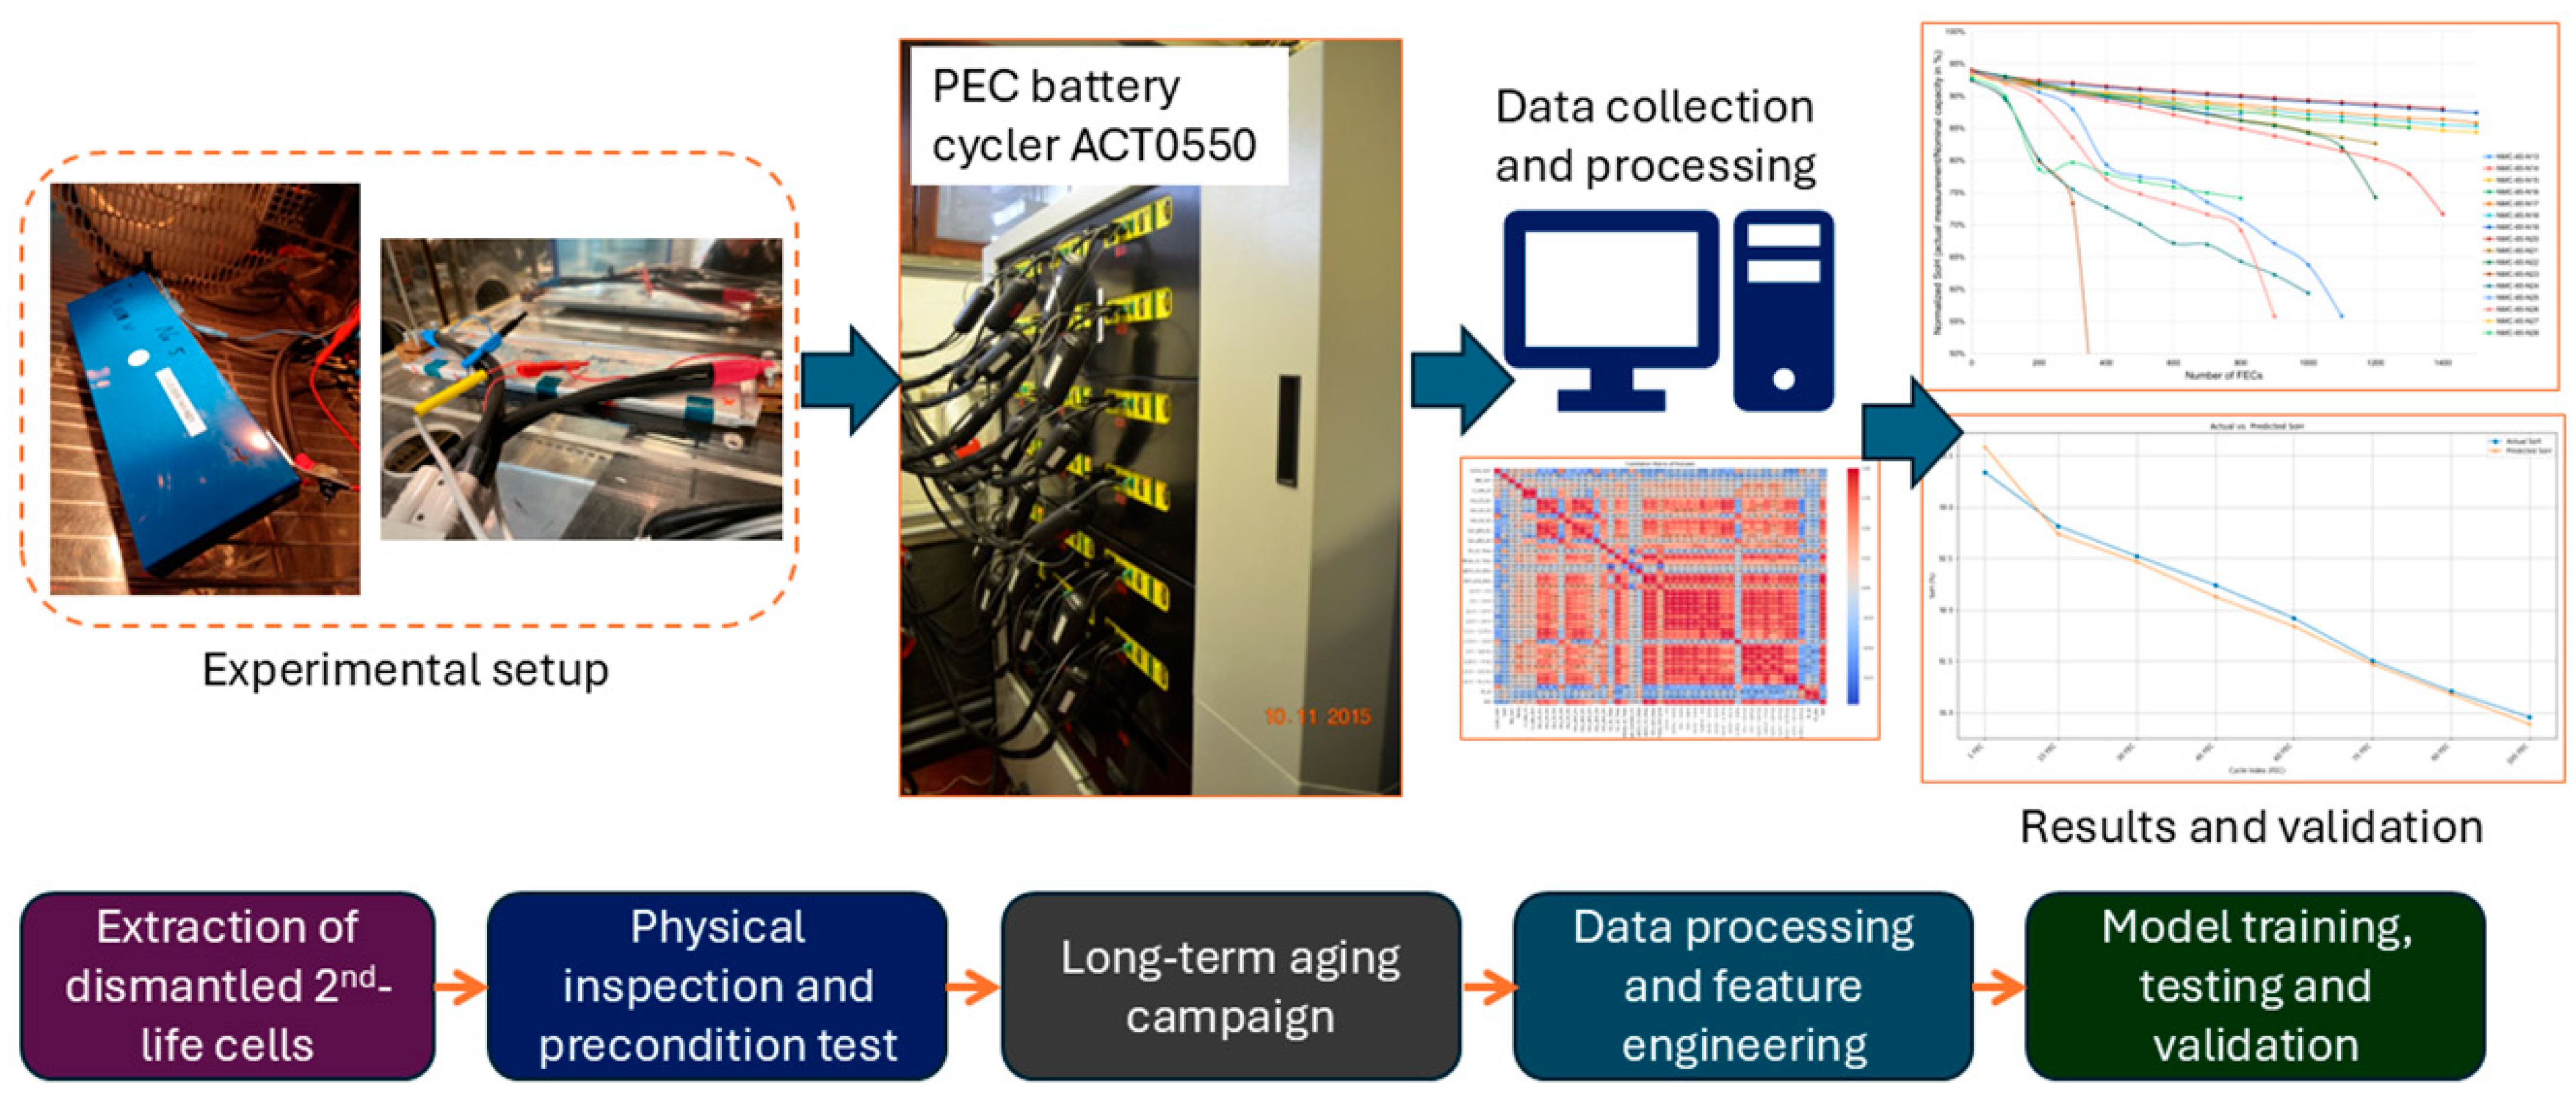
28], etc., the best-performing algorithm is found to be the ElasticNet regression, which has been deployed to validate the dynamically cycled dataset. The modeling framework is presented in
Figure 8.
ElasticNet, as expressed in Equation (1), combines the penalties of Lasso (L1) and Ridge (L2) regularization. It linearly combines the two penalties to perform variable selection and regularization, preventing overfitting [
29].
where
represents the model parameters (coefficients),
controls the L1 penalty (Lasso), and
controls the L2 penalty (Ridge).
The training process was run on a system with the following specifications:
Processor: Intel Core i7-6820HQ @ 2.70 GHz, 8 cores;
RAM: 32 GB DDR4;
GPU: NVIDIA GeForce Quadro M2200 (4 GB GDDR5);
Operating System: Windows 11 Pro;
Software Environment: Python 3.9, Scikit-learn 1.0.2, and TensorFlow 2.6.0 for model development and training.
These system specifications ensured efficient dataset handling and expedited the training process, especially for computationally intensive models like Gradient Boosting and Gaussian Process Regression.
4.3. Evaluation Metrices and Validation
The trained models are validated using the assembled dataset to predict the SoH. The predicted SoH values are compared with the actual SoH values to calculate the error. At the final step, the error is analyzed, and hyperparameter tuning is performed.
The performance of different models is compared using an evaluation metric, which is expressed in Equation (2).
RMSE (Root Mean Squared Error):
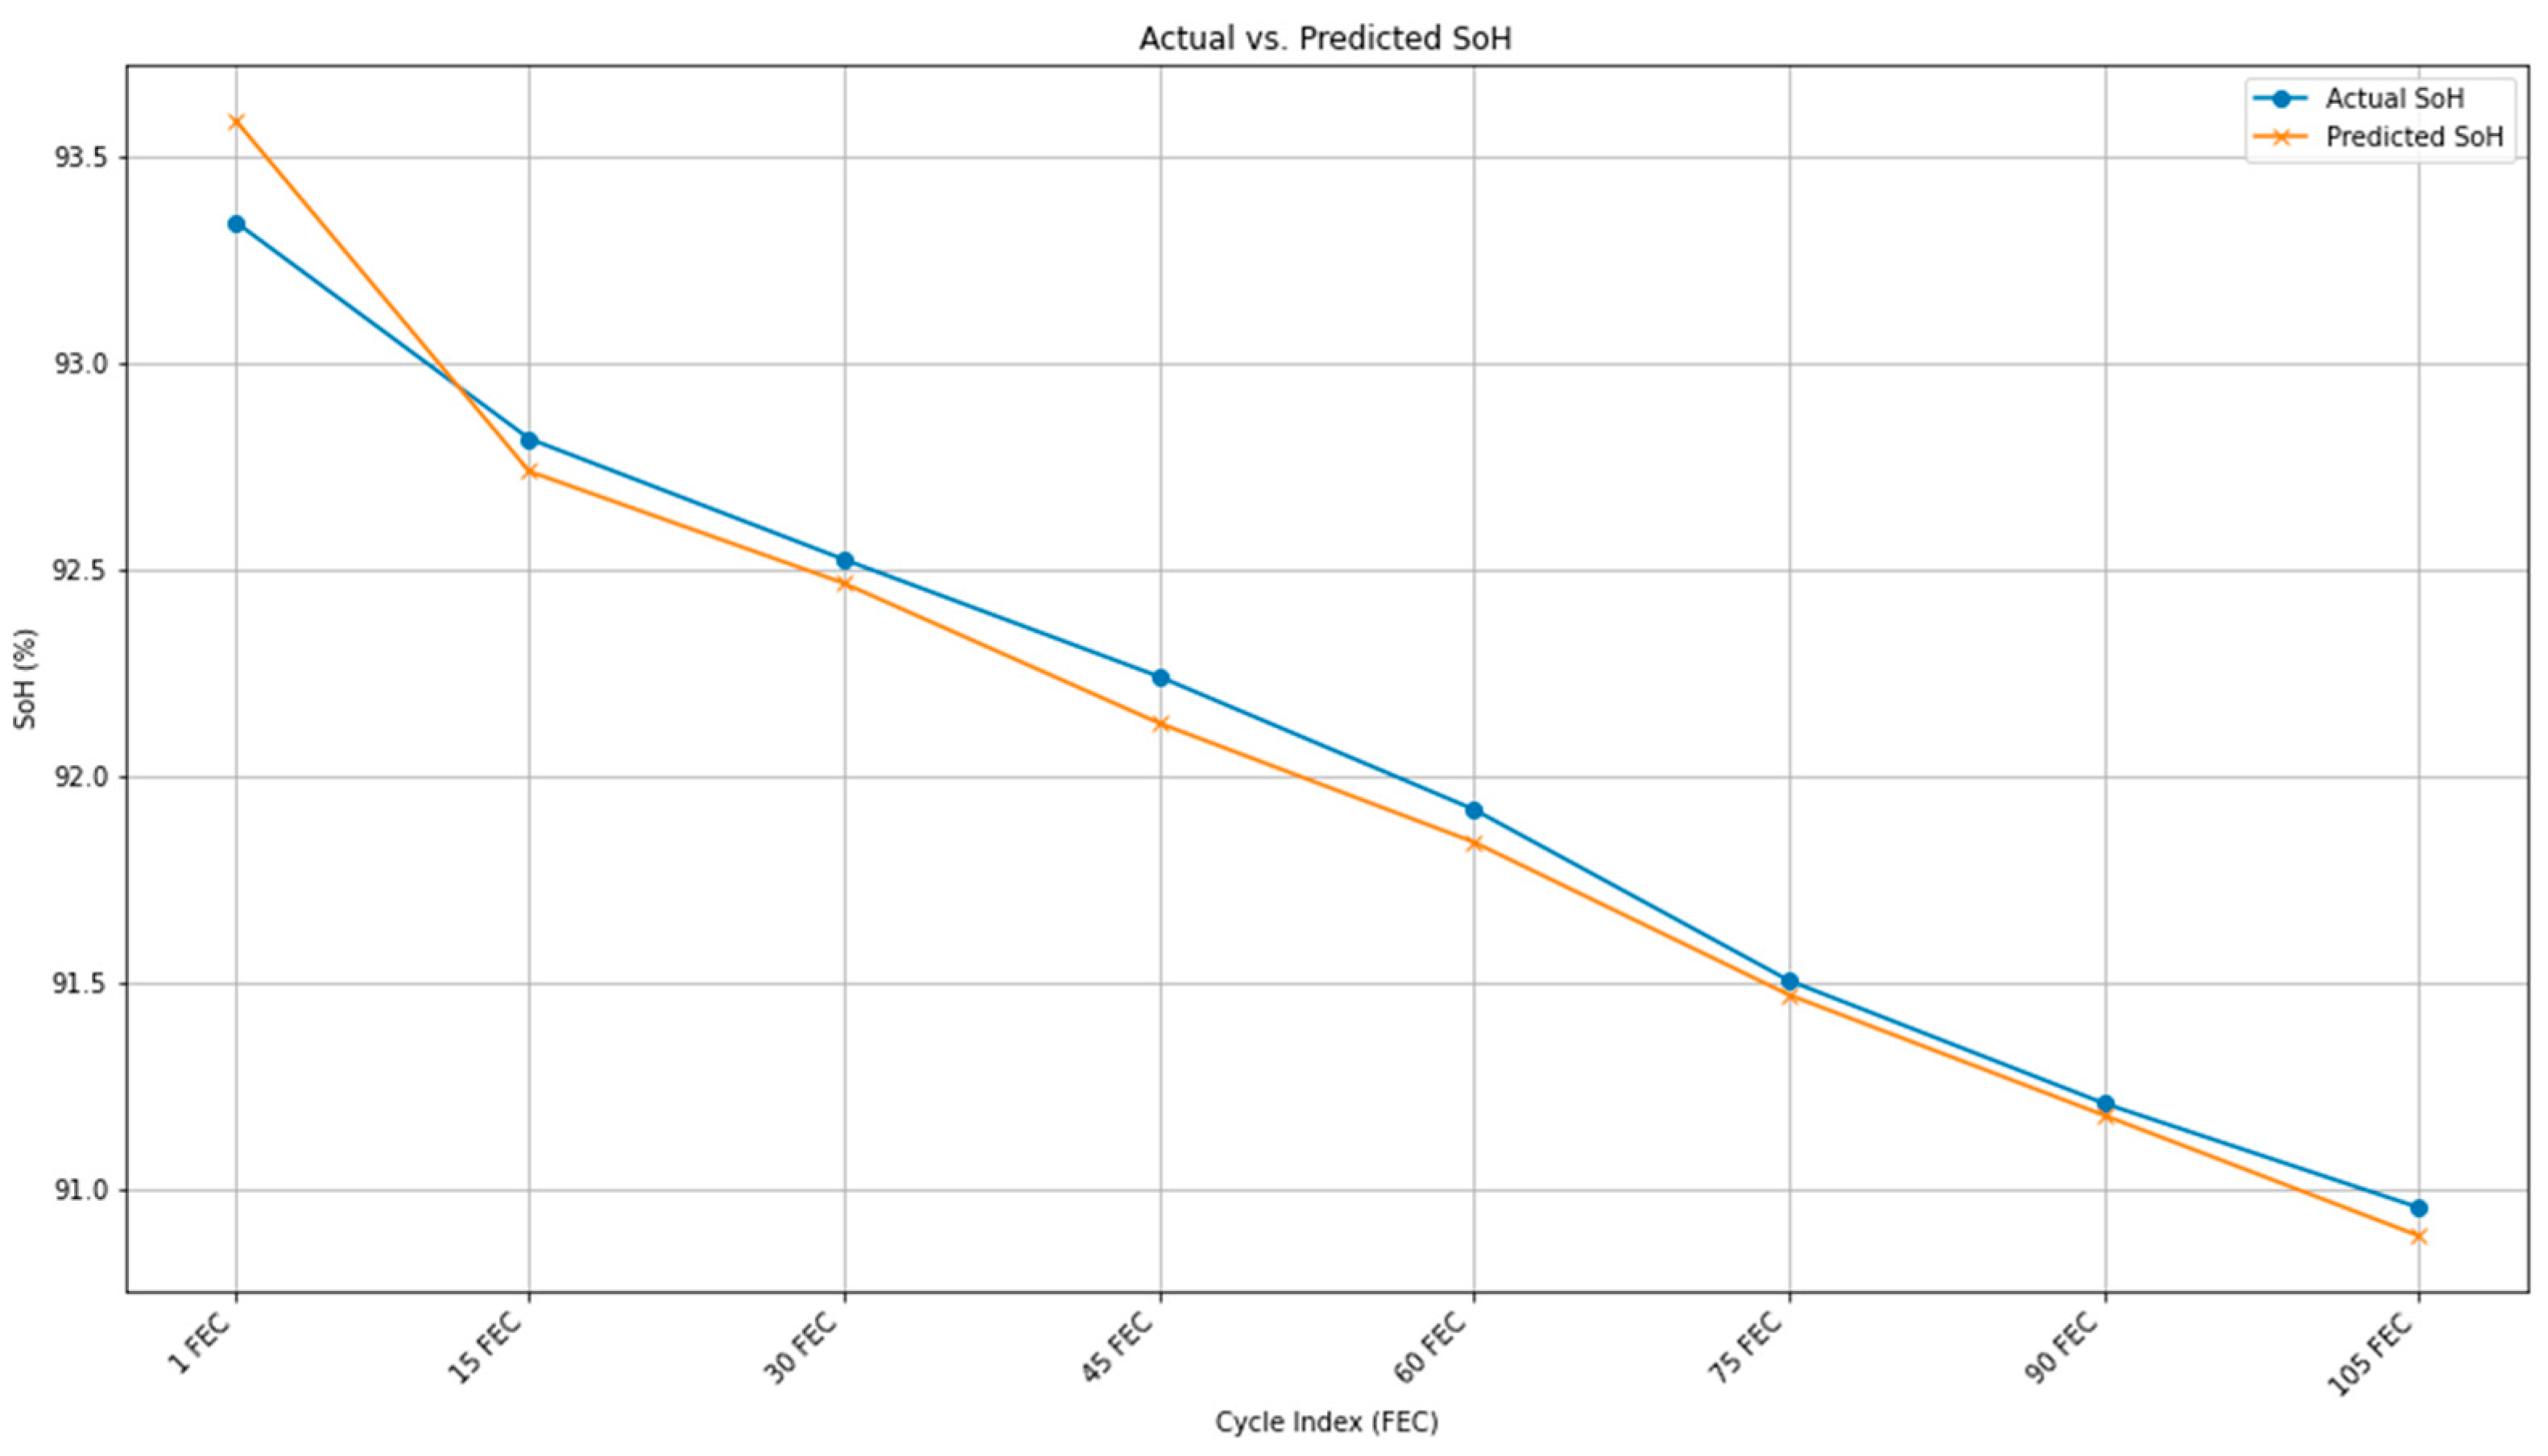
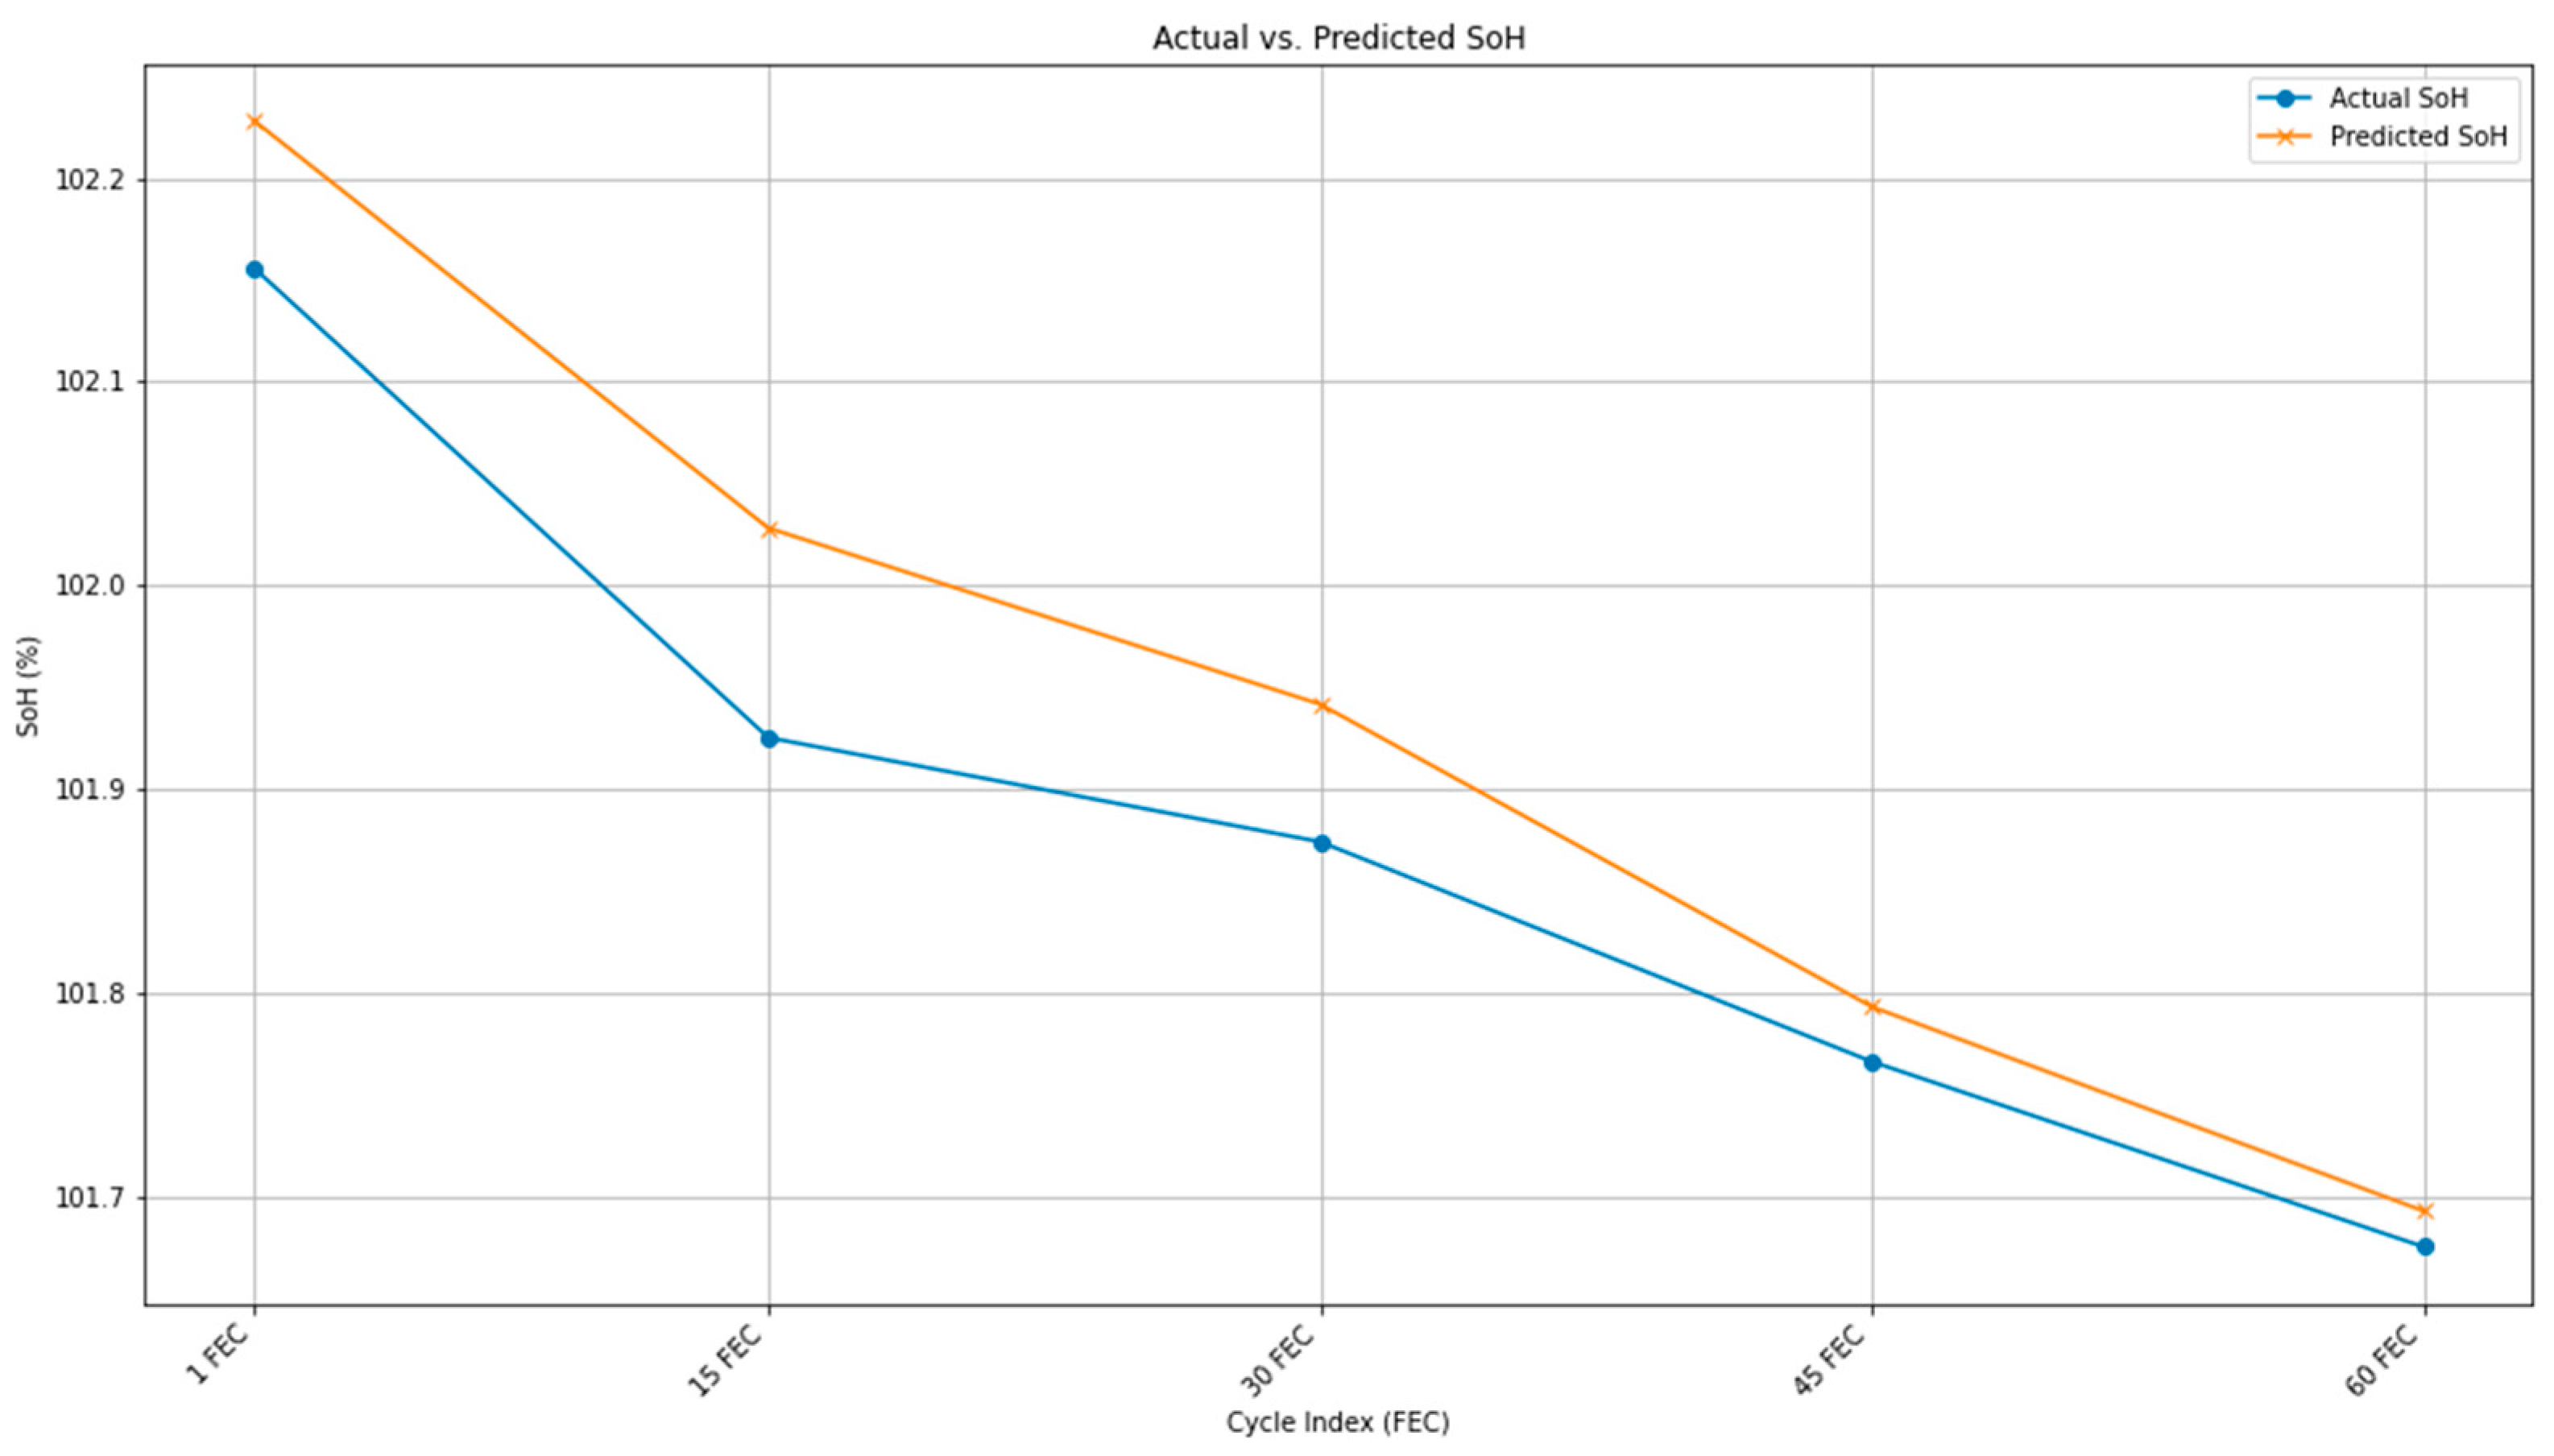
The predicted SoH values are compared with the actual SoH values to calculate the error. The SoH values at the scale of (0–1) are used as model outcomes in the dataset during the whole calculation, but expressed in percentiles in the displayed figures. The best RMSE score of the validation (in the scale of 0–1) for two separate cells of each type is found to be 0.065 and 0.109 for the dynamically cycled NMC 141 Ah and NMC 65 Ah cells, respectively, which could be considered very good. The actual and simulated curves are displayed in
Figure 9 and
Figure 10. ElasticNet shows promising performance for both cell types. Moreover, considering the fact that the NMC 141 Ah cells were almost fresh and the NMC 65 Ah cells had an average 6.5% SoH fade against the nominal value, and with no historical usage data, the model performance is significant. The complete process—including data processing, feature extraction and correlation, model training and testing, and final validation—shows a promising workflow which could be implemented online for live data collection and battery state estimation. A cloud-connected network could facilitate SoH-based fast charging optimization, cell balancing, etc., computed locally in the battery management system (BMS), improving performance and extending lifetime.
5. Conclusions
The second-life NMC 141 Ah and NMC 65 Ah cells were characterized in this study for one and a half years with a test matrix in line with the secondary application requirements. The prismatic NMC 141 Ah cells were found to be almost similar to their fresh status, meaning at around a 100% SoH, while the pouch NMC 65 Ah cells’ SoH were found to be between 92.9 and 94.1% based on rated capacity. This means that the NMC 141 Ah cells had spent an unusual time in the vehicle, while the NMC 65 Ah cells had a moderate level of degradation. In both cases, the usage history is unknown. In their second life, the cells were cycled under the same type of conditions. The high DoD cycling is found to have a faster degradation, and together with cold temperature, the cells experienced the most aging.
When different ML algorithms are trained on the generated dataset, the best-performing model is found to be ElasticNet for both cell types, with which the validation task is performed on an unknown dataset by dynamically cycling the cells. The RMSE value obtained from the validation is 0.065 and 0.109 for prismatic and pouch cells, respectively. The robustness of the model can also be increased by retraining with the availability of more data in case of a full campaign completion. The inclusion of first-life aging information could also improve prediction accuracy. Future work is planned to interpret the features to identify the associated aging mechanisms, which can be supported by the post-mortem activities. On the modeling approach, future work could assess how to reuse such a trained model for a completely new dataset for another type of Li-ion technology, like LFP, facilitating transfer learning.