Integrated Solar-Wind Hydrogen Production System for Sustainable Green Mobility


Abstract
1. Introduction
2. Infrastructure of Hydrogen Production Systems
2.1. Hydrogen Production Technologies
2.2. Hybrid Renewable Energy Systems
2.3. Integration with Mobility Infrastructure
2.4. Existing Projects and Demonstrations

| Projects | Problematic | Goals | Proposed Solutions | Results Obtained |
|---|---|---|---|---|
| HyDeal Ambition (Spain) [25] |
|
|
|
|
| H2V (France) [26] |
|
|
|
|
| INGRID Project (Italy) [27] |
|
|
|
|
| H2BER (Germany) [28] |
|
|
|
|
| Hy Trac Project (France) |
|
|
|
|
| Abdullah Al- Sharafi Saudi Arabia [29] |
|
|
|
|
| Djilali, M. Nouredin S (Algeria) [30] |
|
|
|
|
| Kopp M, (Germany) Energie Park Mainz [31,32] |
|
|
|
|
3. Materials and Methods
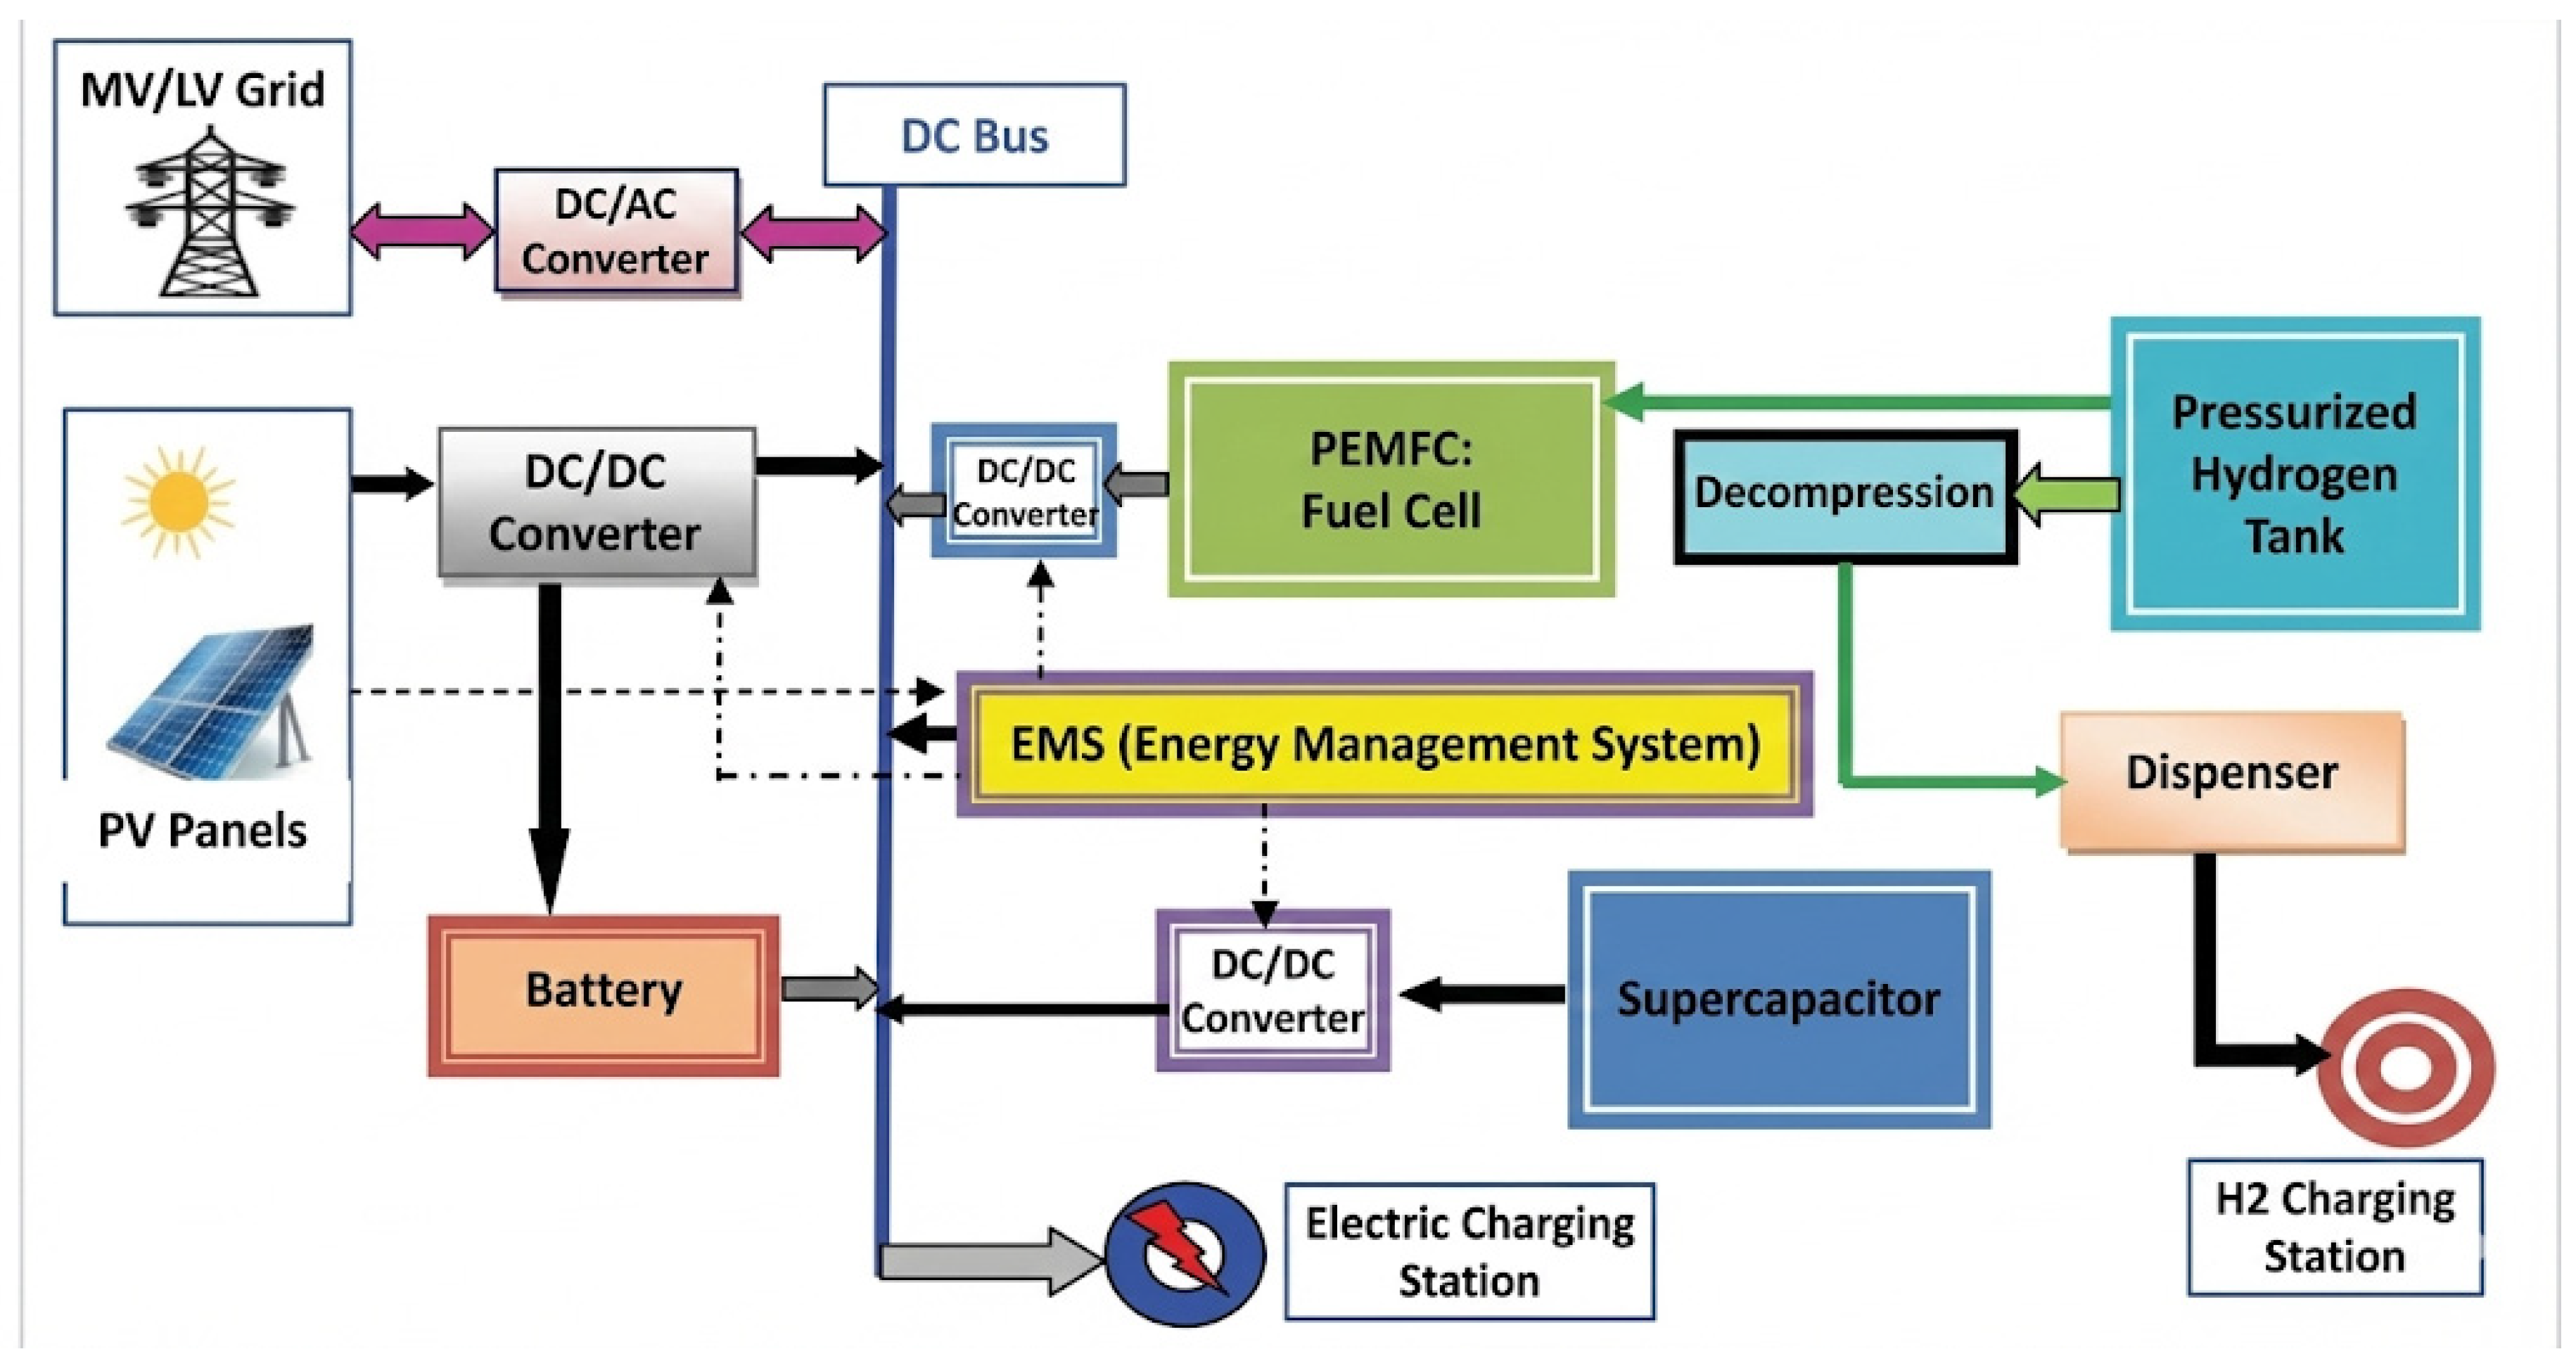
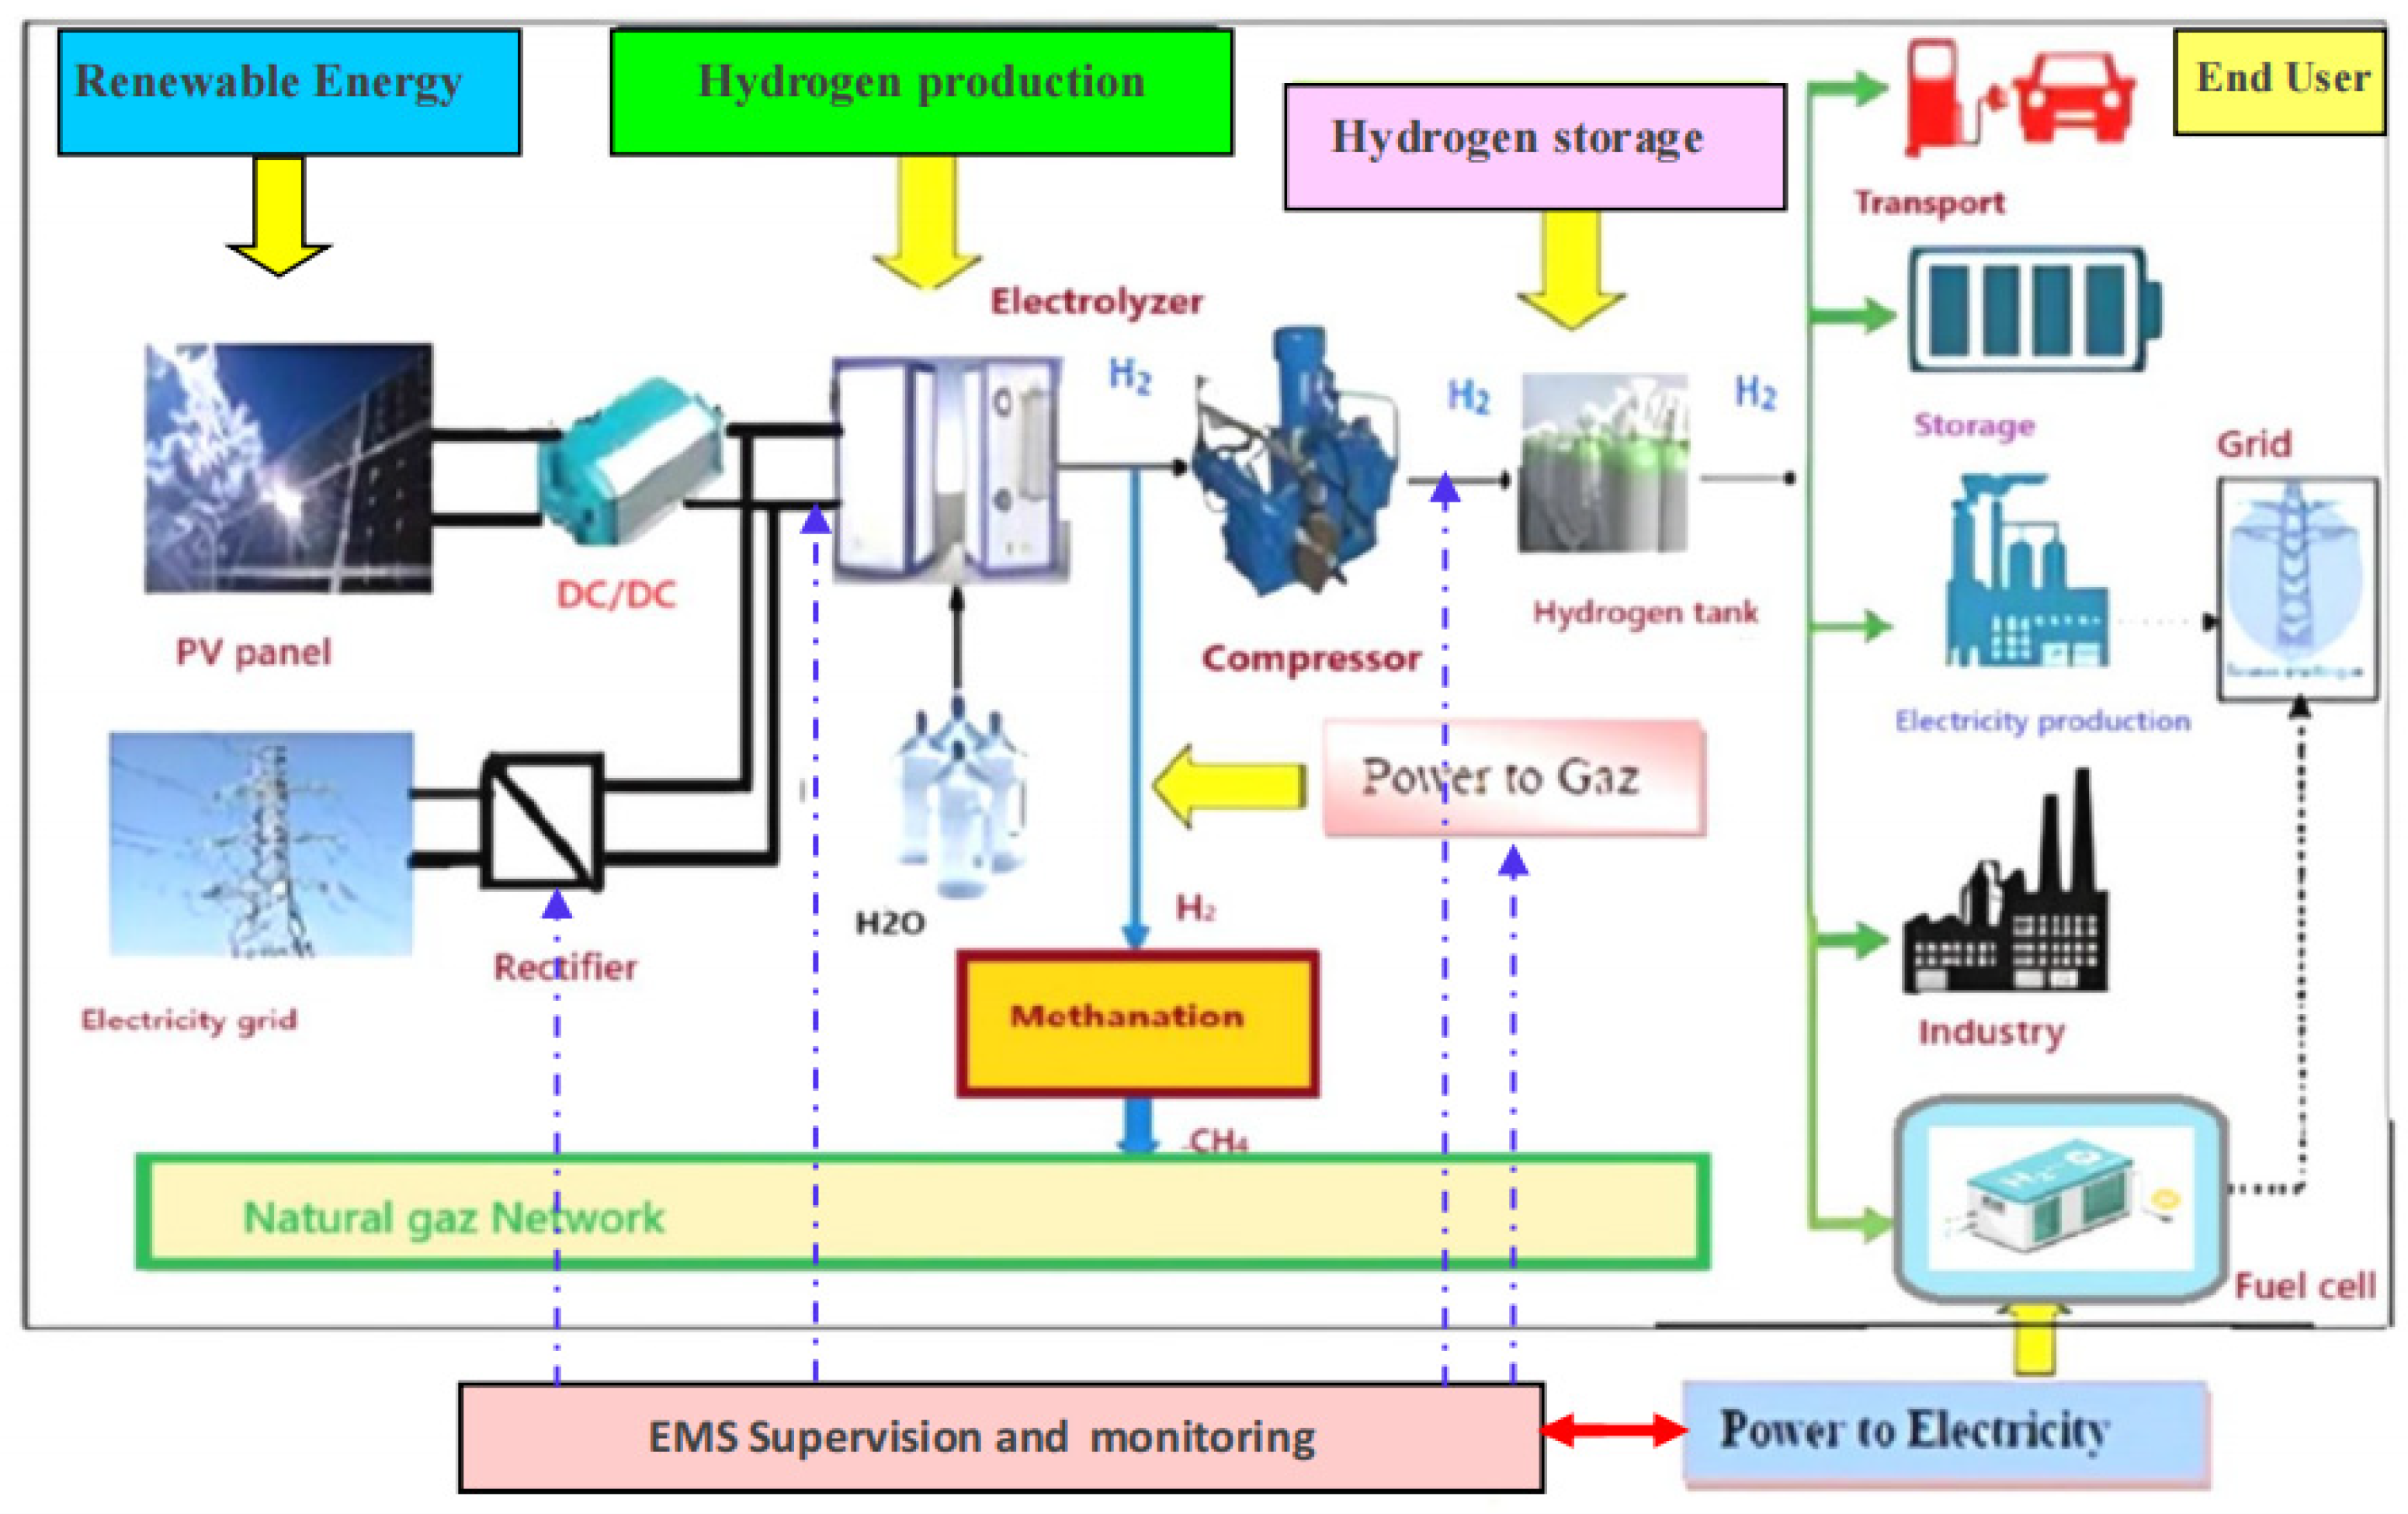
3.1. System Architecture and Components
- -
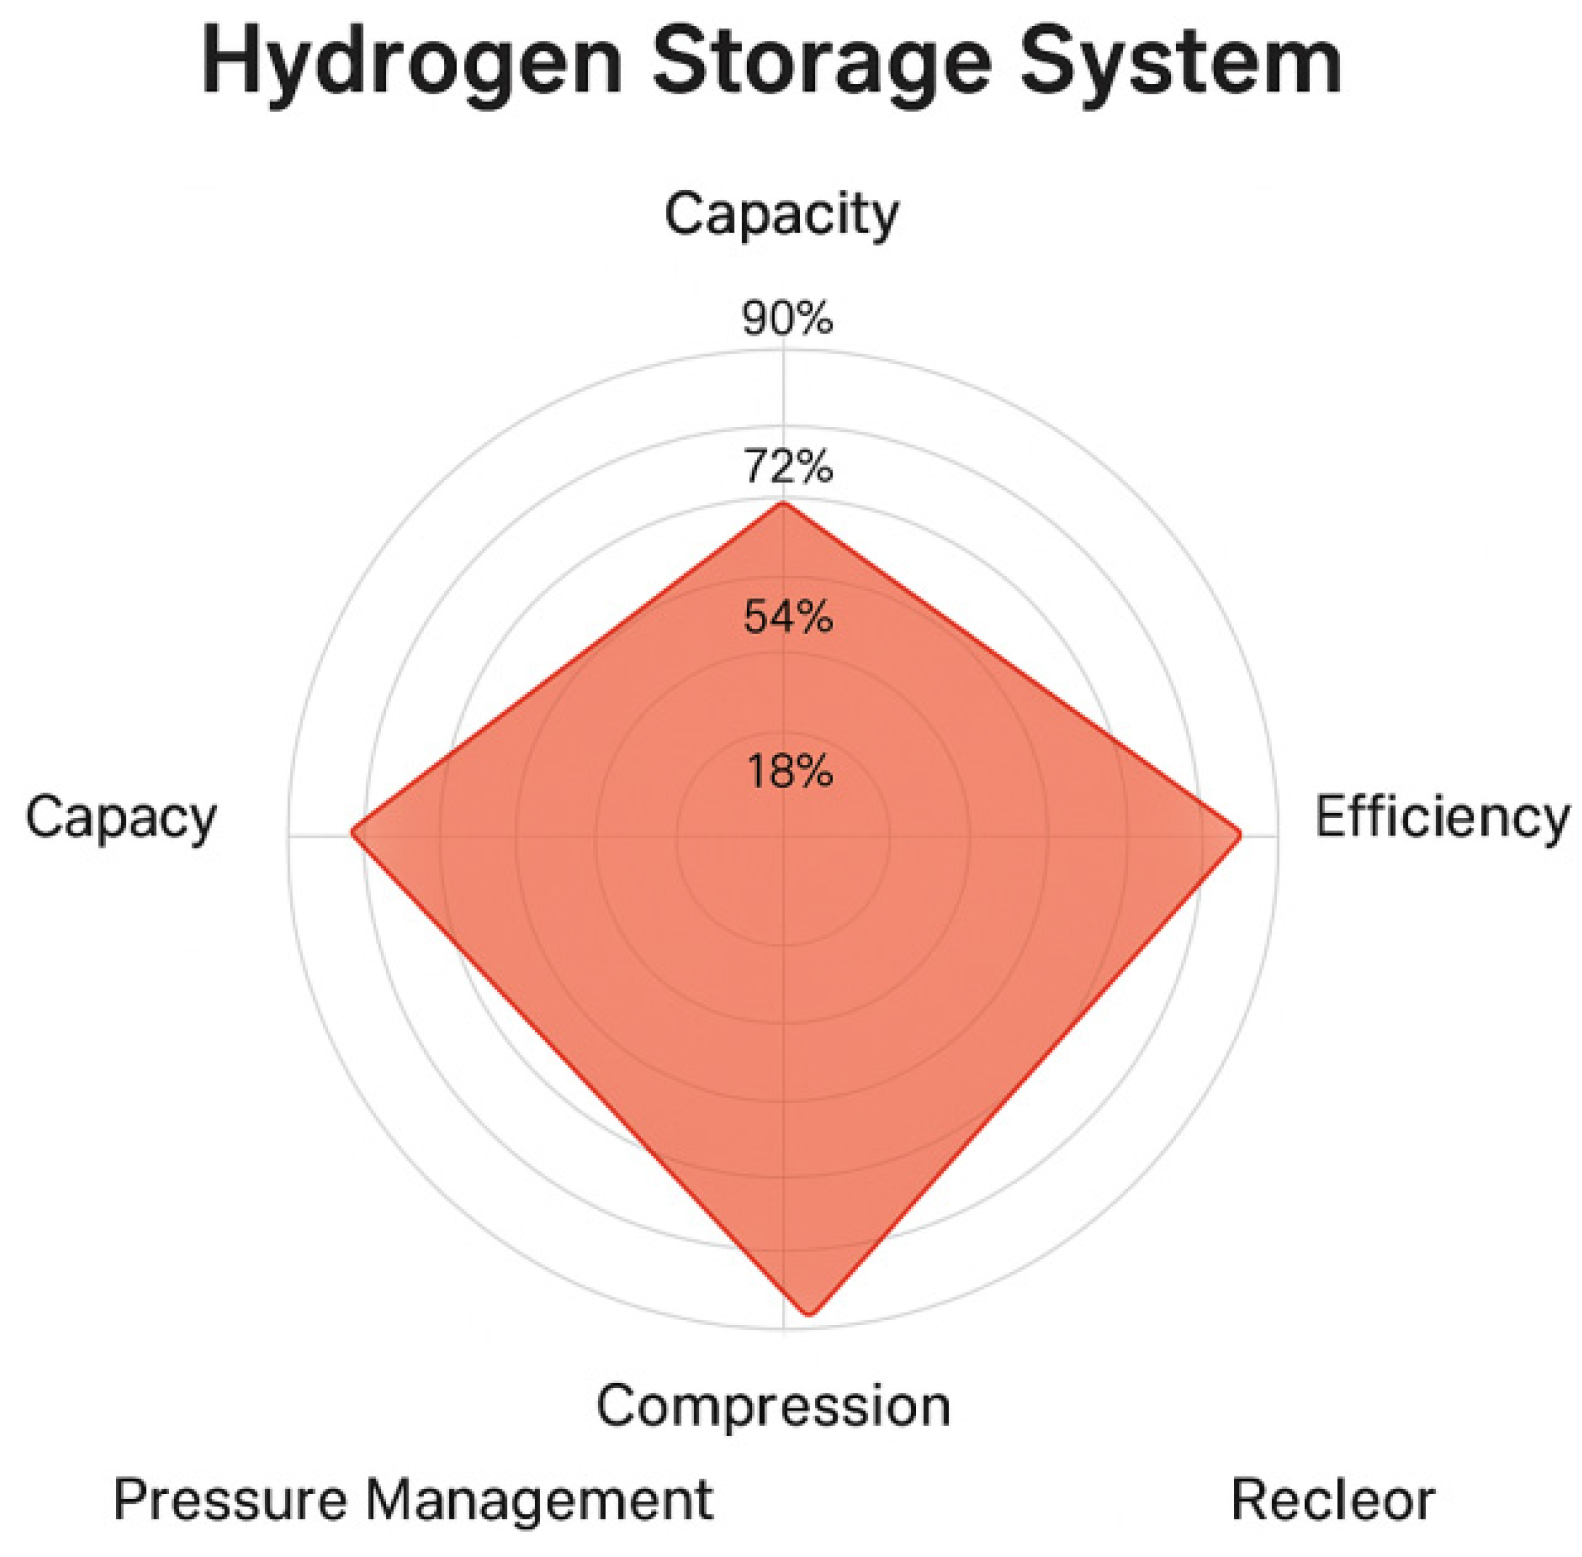
- Compression Energy Consumption: The energy consumed for compression is estimated at 0.54 MWh per day (or 198 MWh/year), highlighting its significance.
- -
- Storage Efficiency: The overall high storage efficiency (89%) and the produced hydrogen purity (99.99%) are reported.
- -
- Appropriate sensors, control, and monitoring interface;
- -
- Advanced design of the composite tank with minimal permeation and optimized pressure management strategies, which indirectly contributes to maintaining safe and efficient operation.
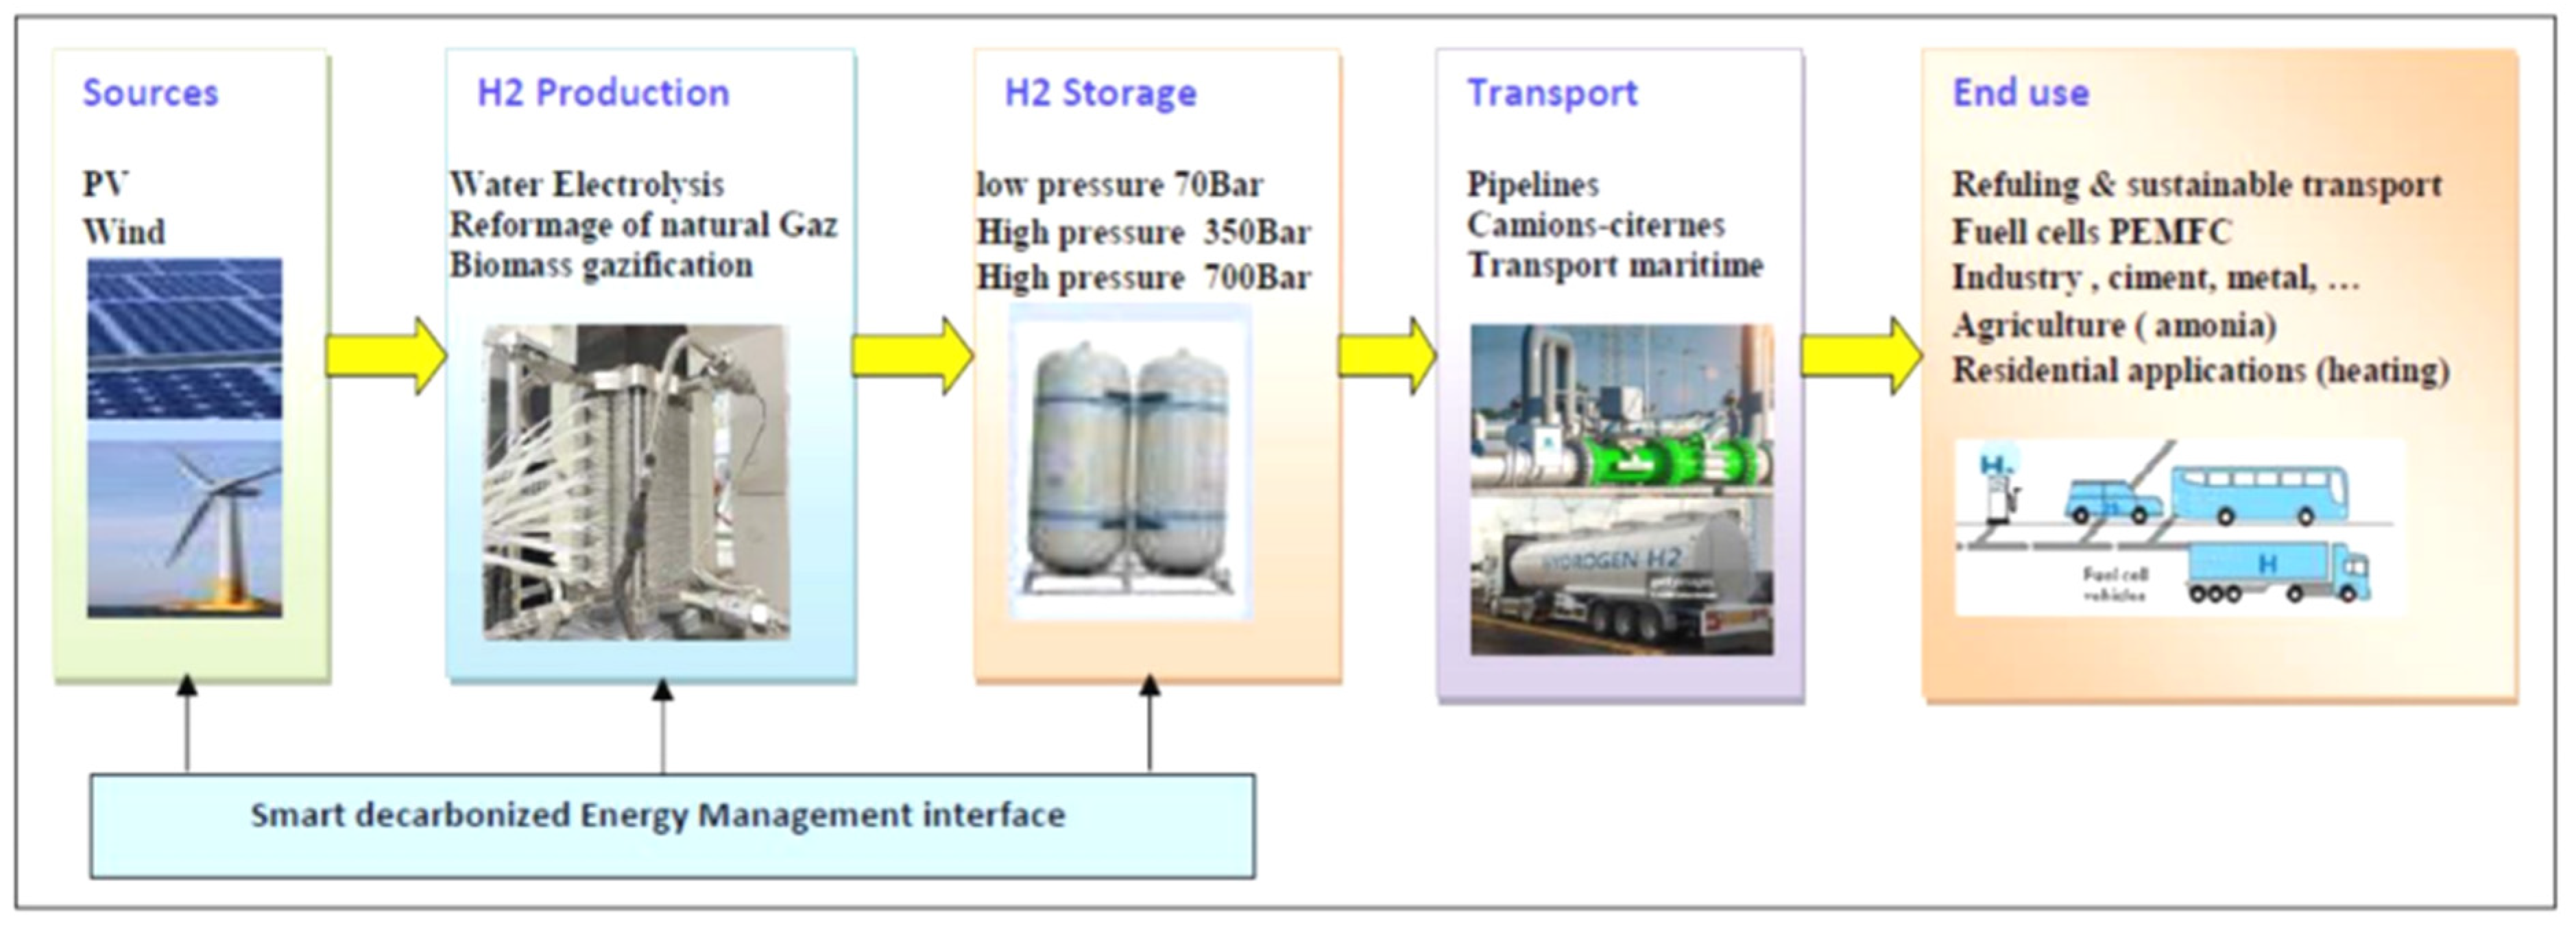
3.2. The Hydrogen Value Chain
- -
- Industrial sector, such as metallurgical, chemical, mining, oil, and pharmaceutical industries.
- -
- Transport sector: Electric, hydrogen, or hybrid cars, and buses and trains.
- -
- Electricity production and injection into the grid: Use of hydrogen fuel cells to generate electricity and then inject it into the network.
4. Modeling
4.1. Photovoltaic Array Model
4.2. Wind Turbine Model
- Aerodynamic/Mechanical Power
4.3. Electrical Power via Power Curve
4.4. Air Density Correction
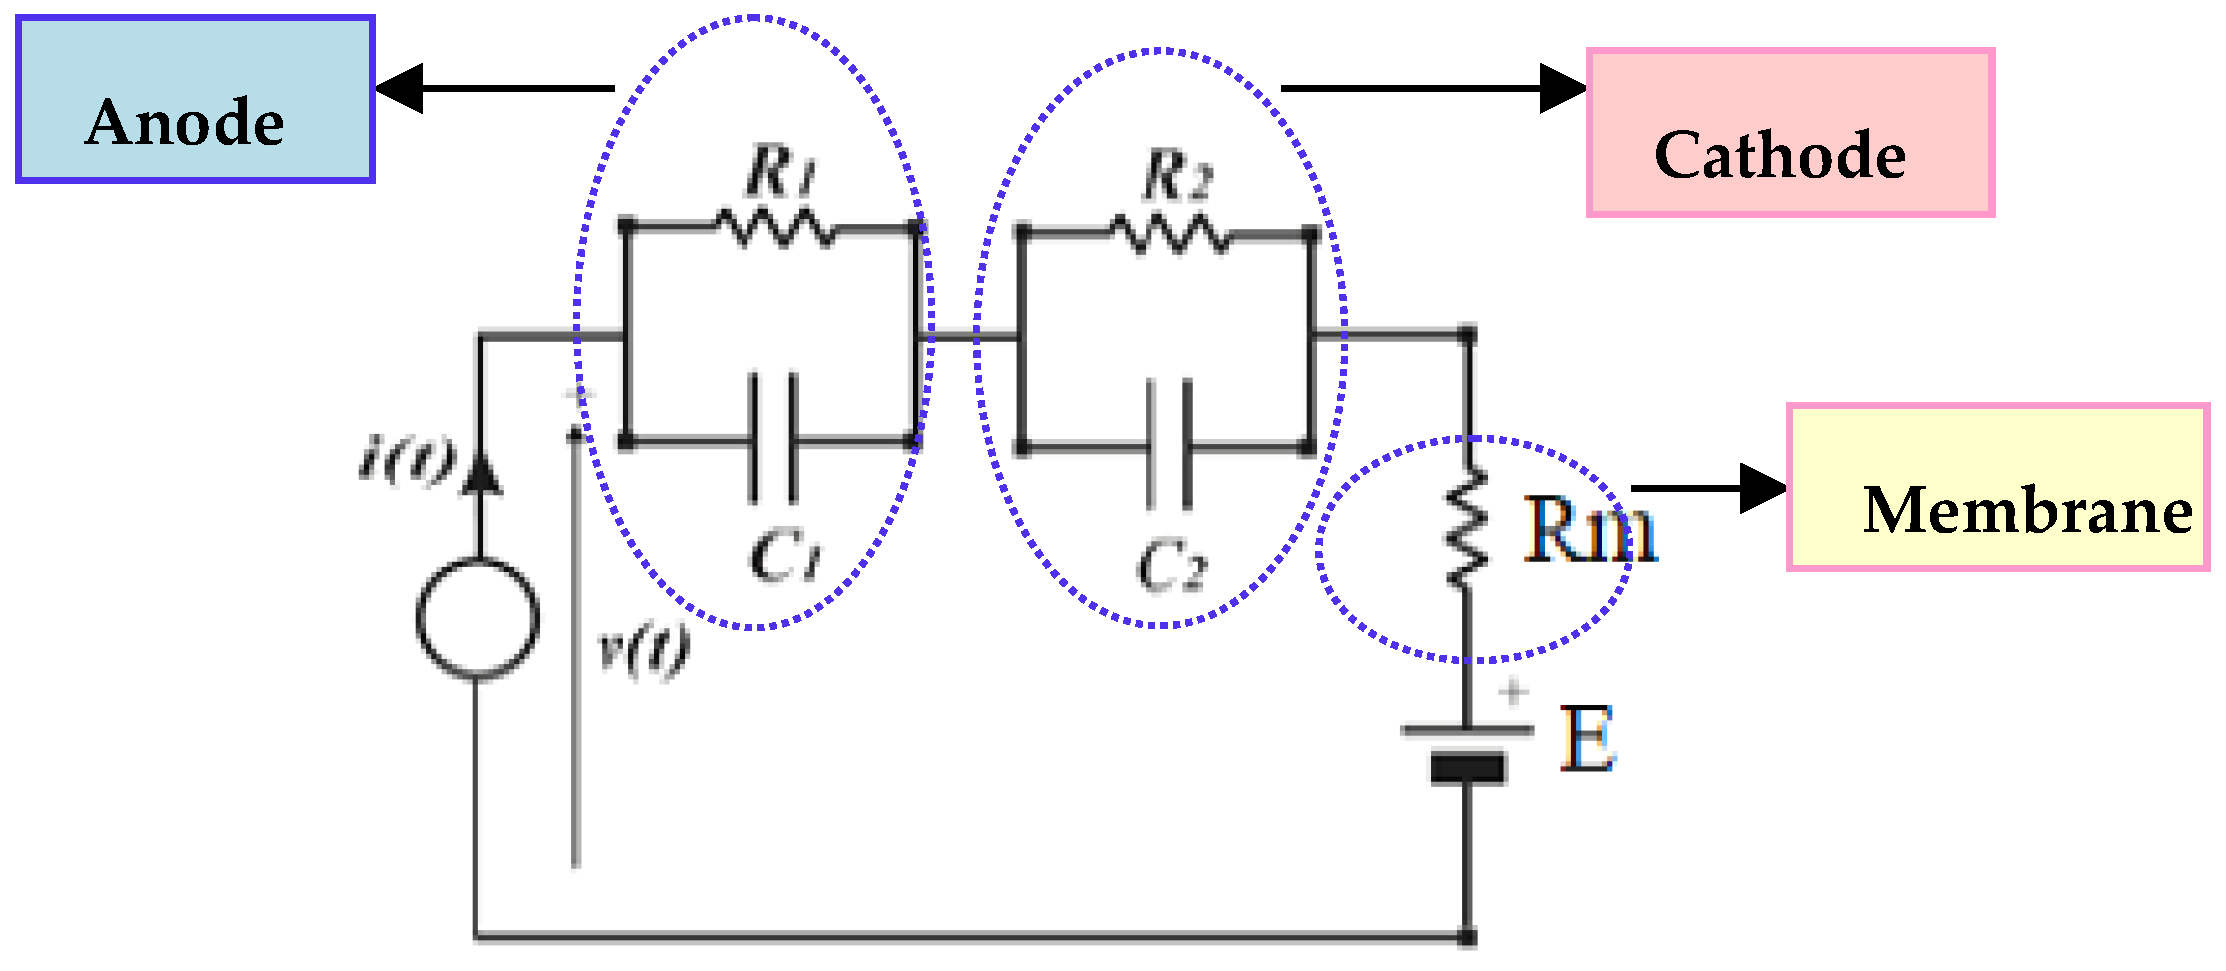
4.5. PEM Electrolyzer Model
- -
- Lower Heating Value (LHV or LH): Represents the energy released by burning a fuel, assuming the water produced remains as vapor (steam).
- -
- Higher Heating Value (HHV): Represents the energy released, assuming all products of combustion are cooled back to the original pre-combustion temperature, meaning the water vapor produced is condensed back into liquid water, thus recovering the latent heat of vaporization.

| Settings | Values |
|---|---|
| cell electrical power | 400 W |
| Rated steak voltage | 2 V |
| Stack current range | 0–80 A |
| Operating temperature | 298 °K |
| Hydrogen outlet pressure | 35 bar |
| Cells numbers | 3042 |
| Total power | 1000 kW |
4.6. Compressor Model
4.7. Hydrogen Storage Model
4.8. Fuel Cell Model
5. Simulation Results
5.1. Simulation Framework
5.2. Control Strategy and Energy Management
- (a)
- maintain minimum electrolyzer operation using grid power if economically favorable;
- (b)
- suspend electrolysis and utilize stored hydrogen for critical loads;
- (c)
- activate the stationary fuel cell to support EV charging demand.
5.3. Renewable Energy Generation Profiles
- -
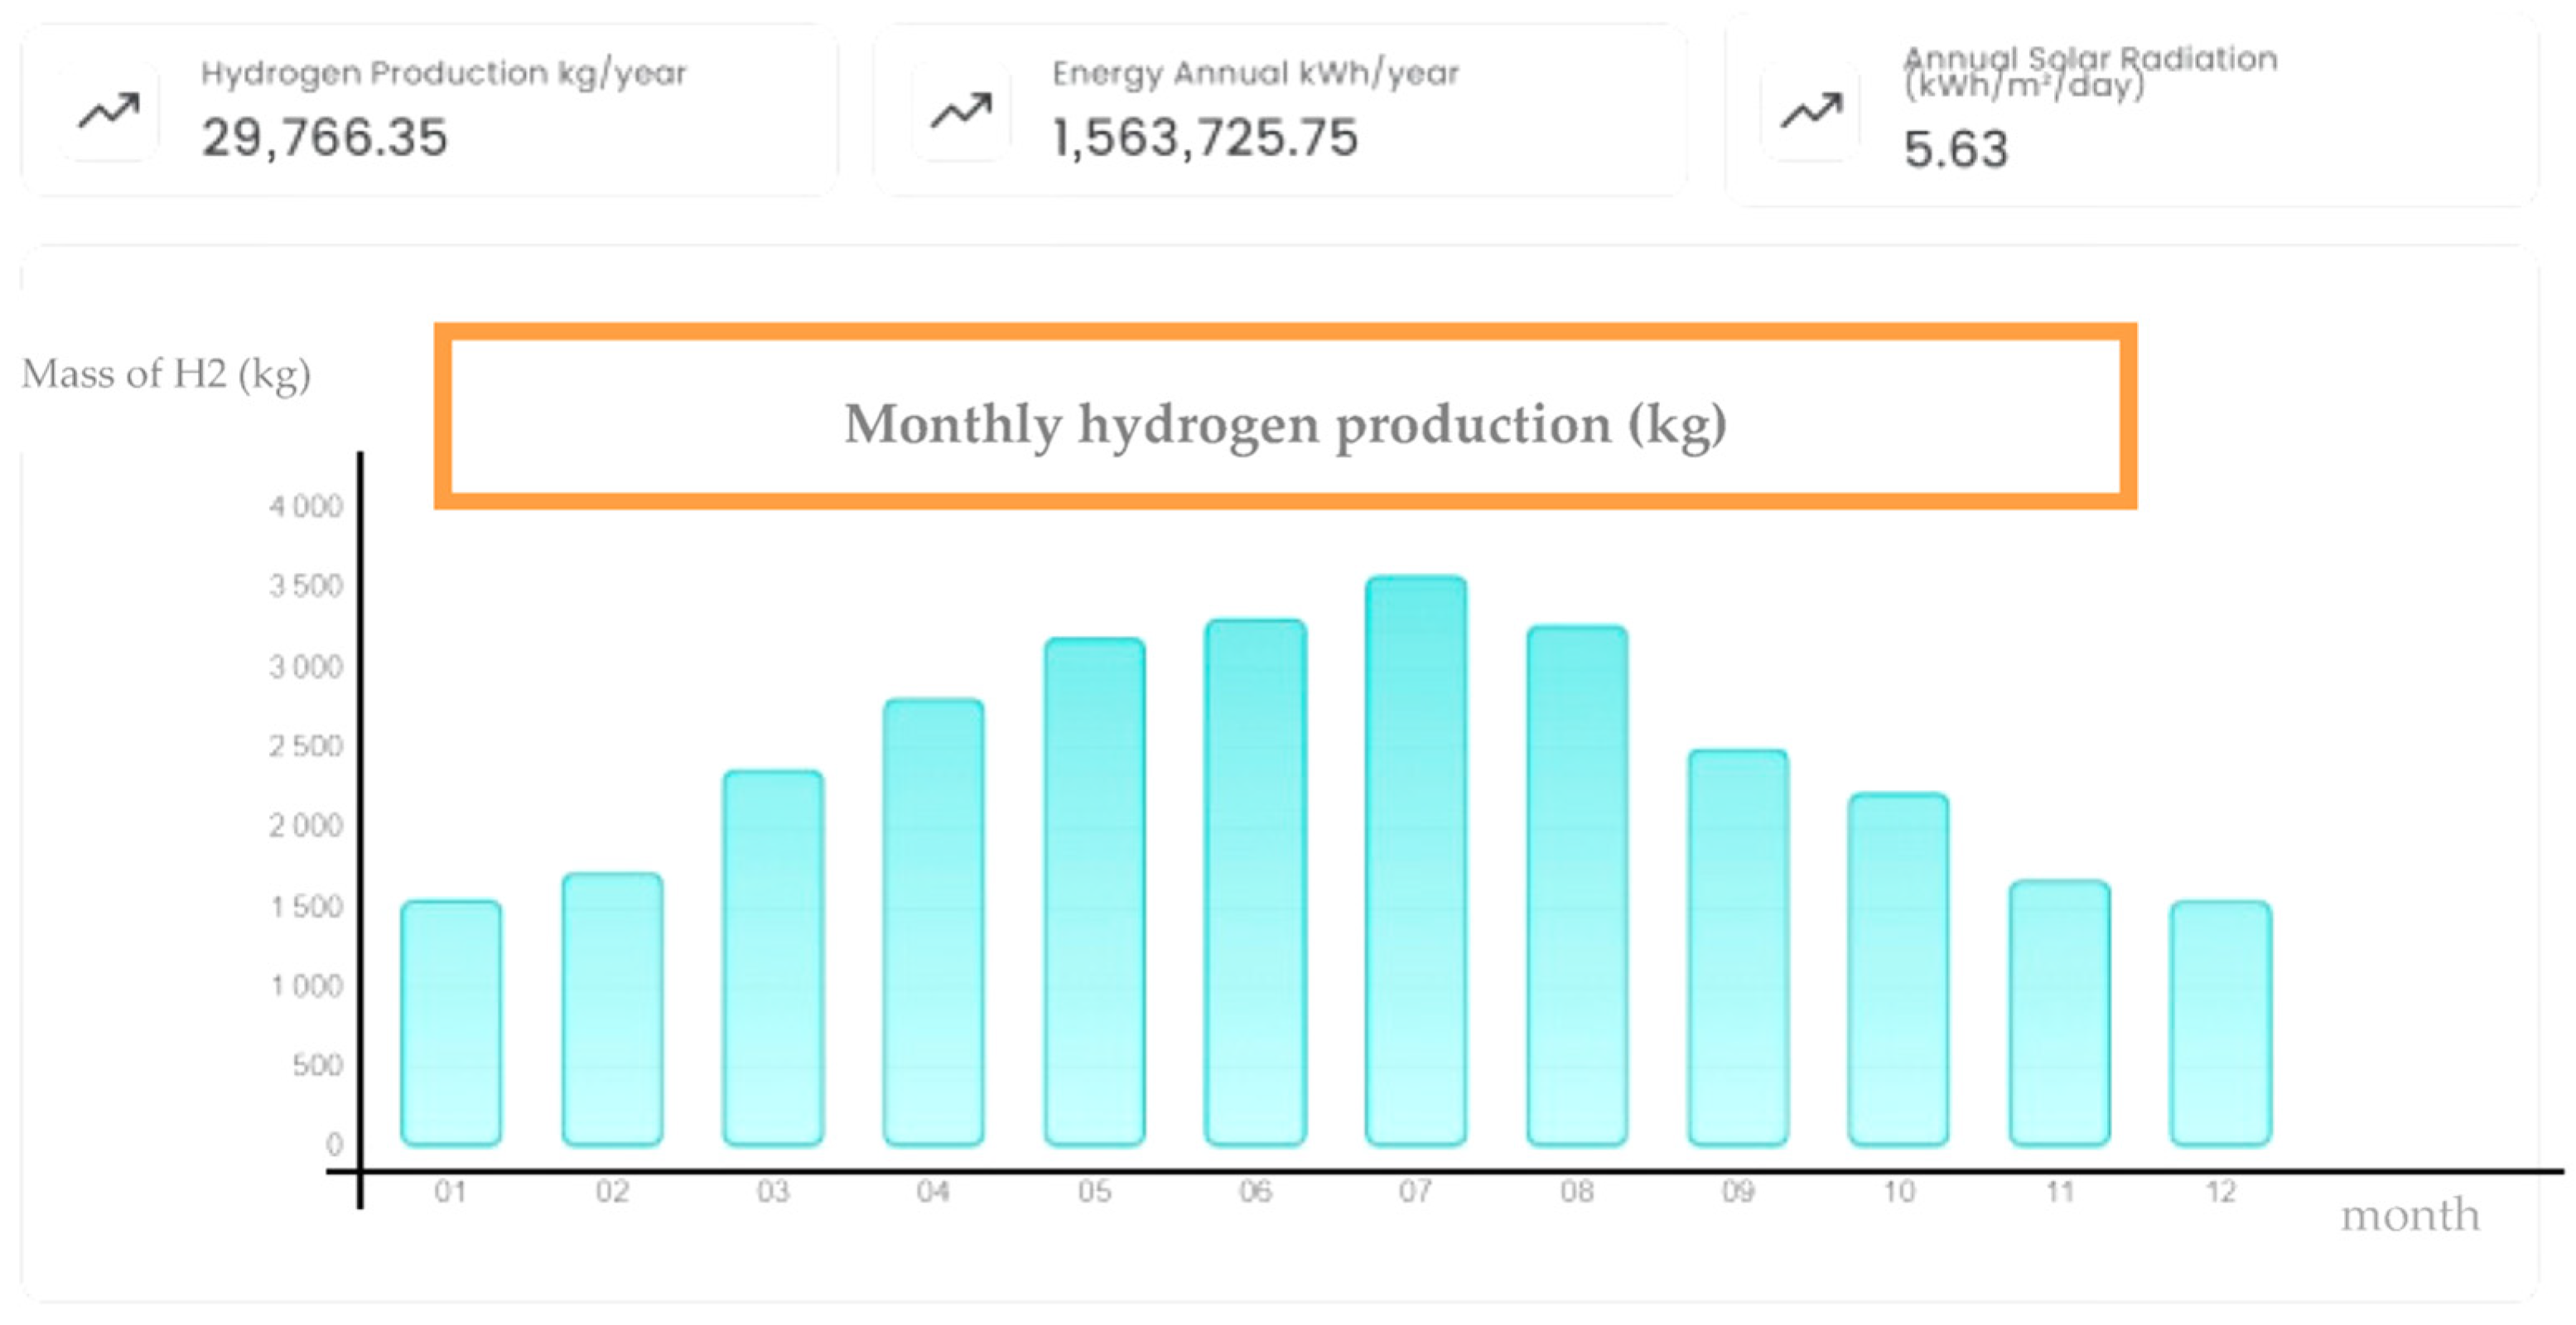
- Scenario 1: Photovoltaic station of 1.2 MW: only PV source
- -
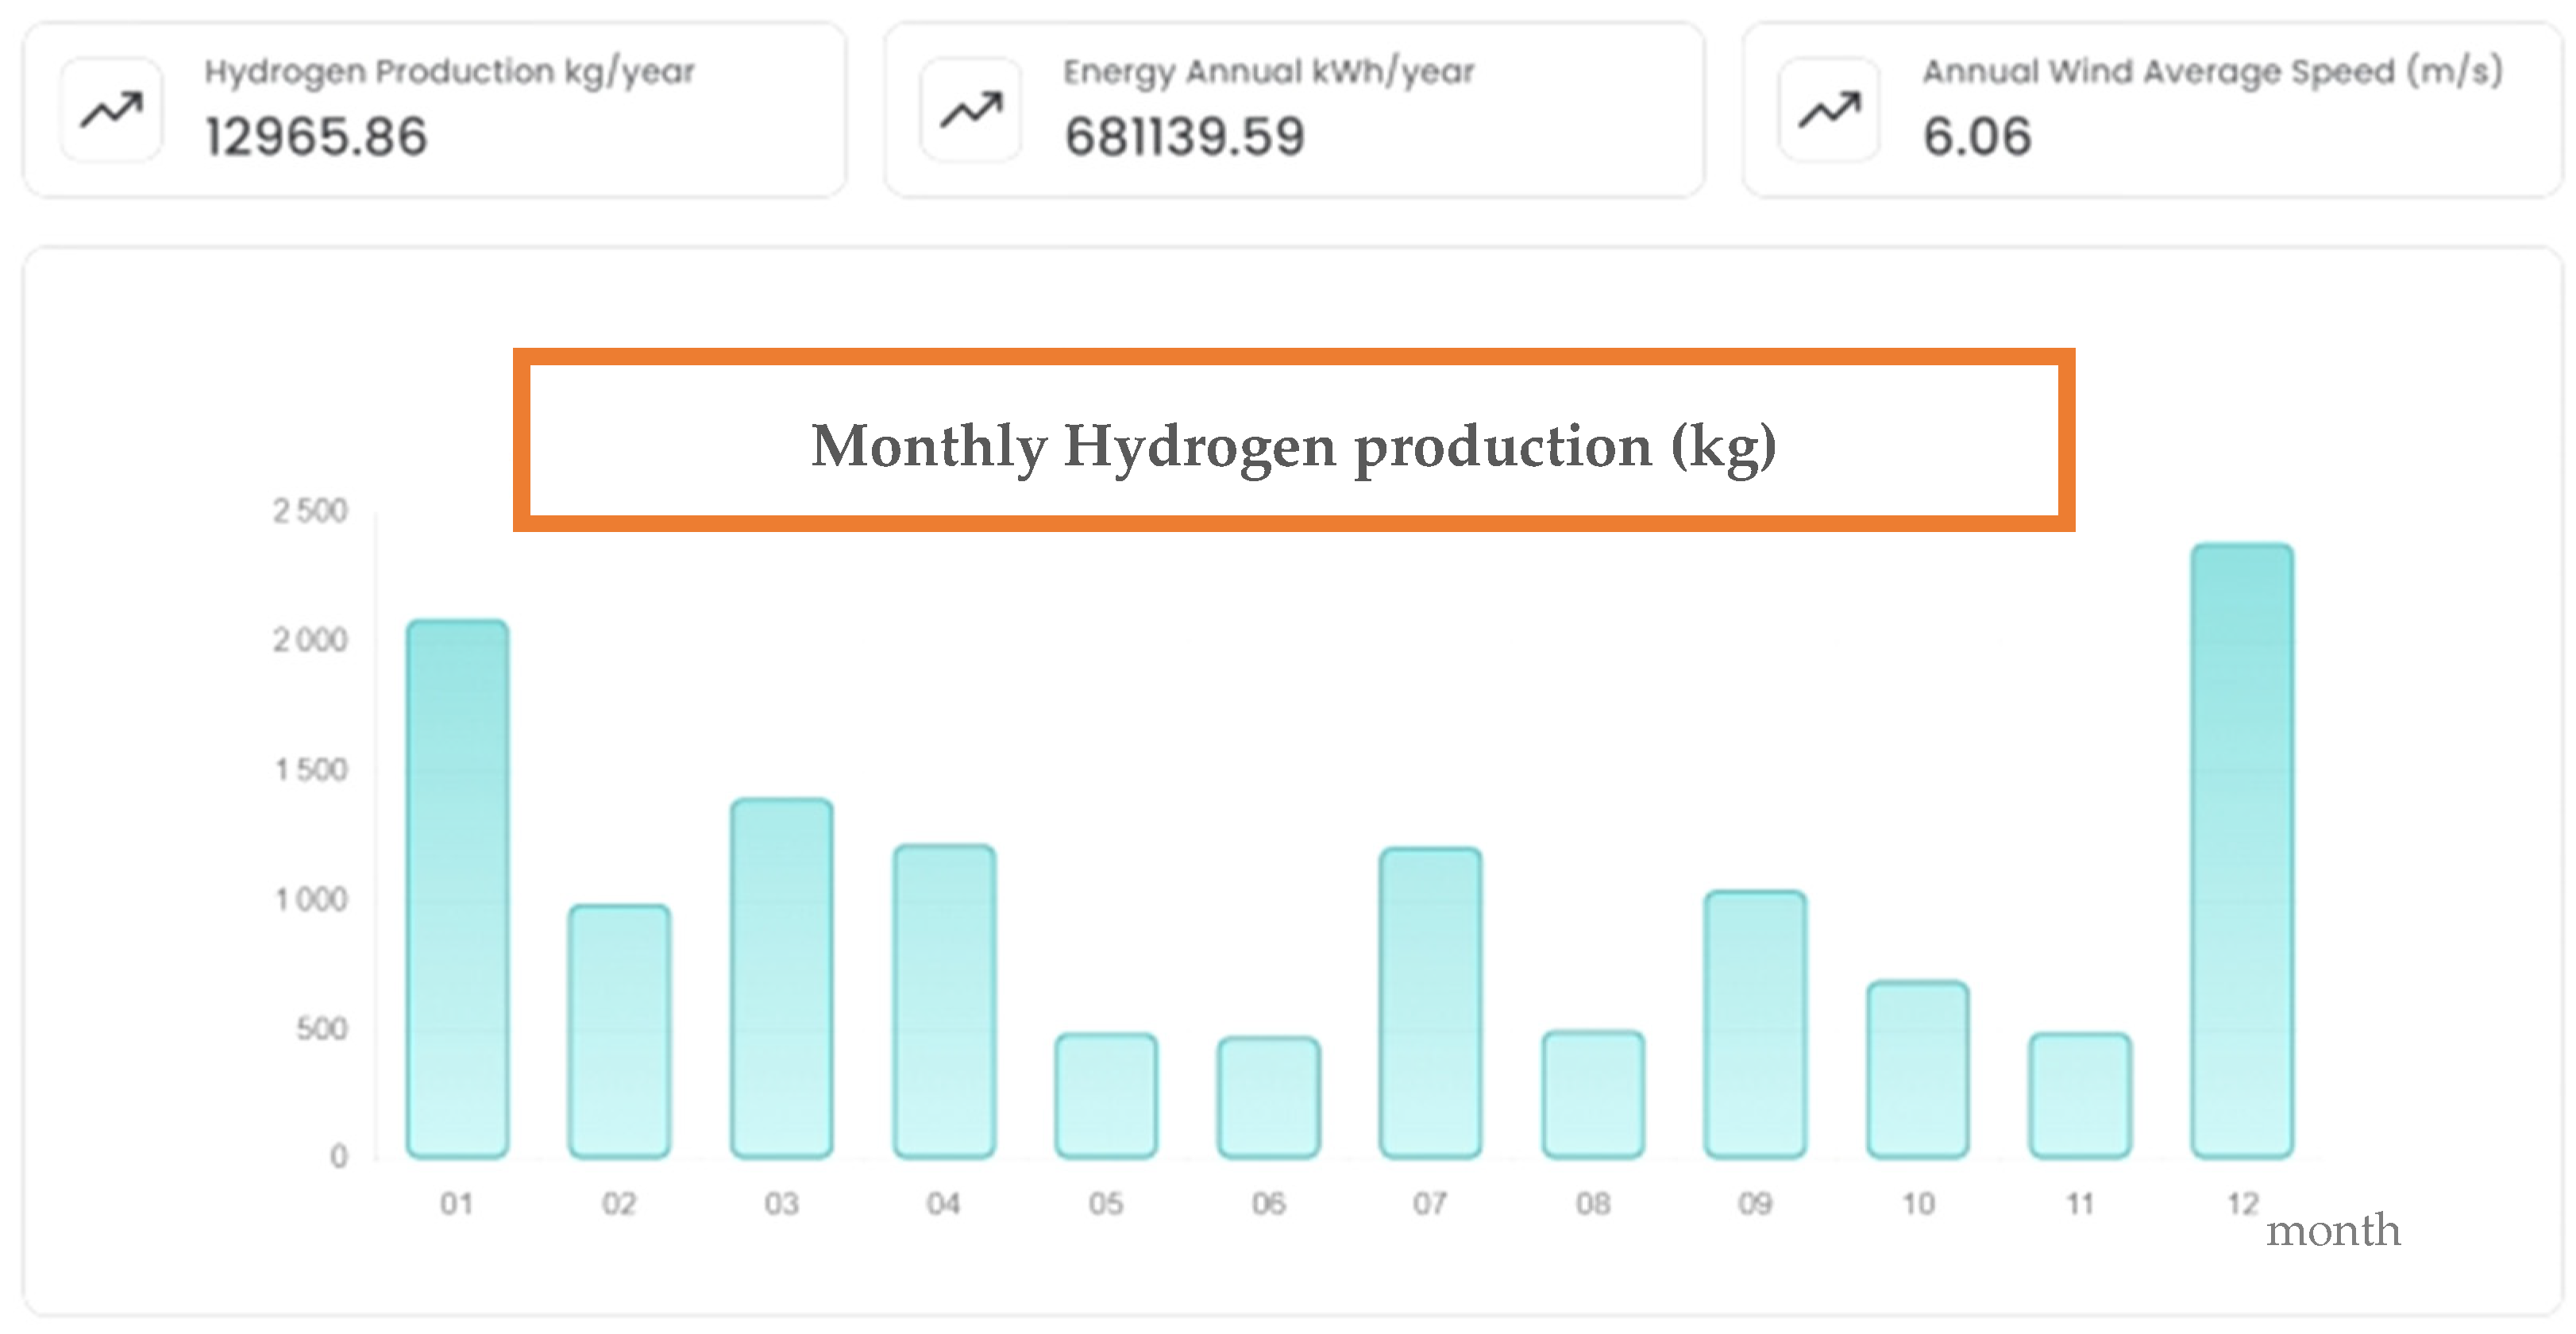
- Scenario 2: Wind station
5.4. Electrolyzer Performance and Hydrogen Production
5.5. Storage System Performance
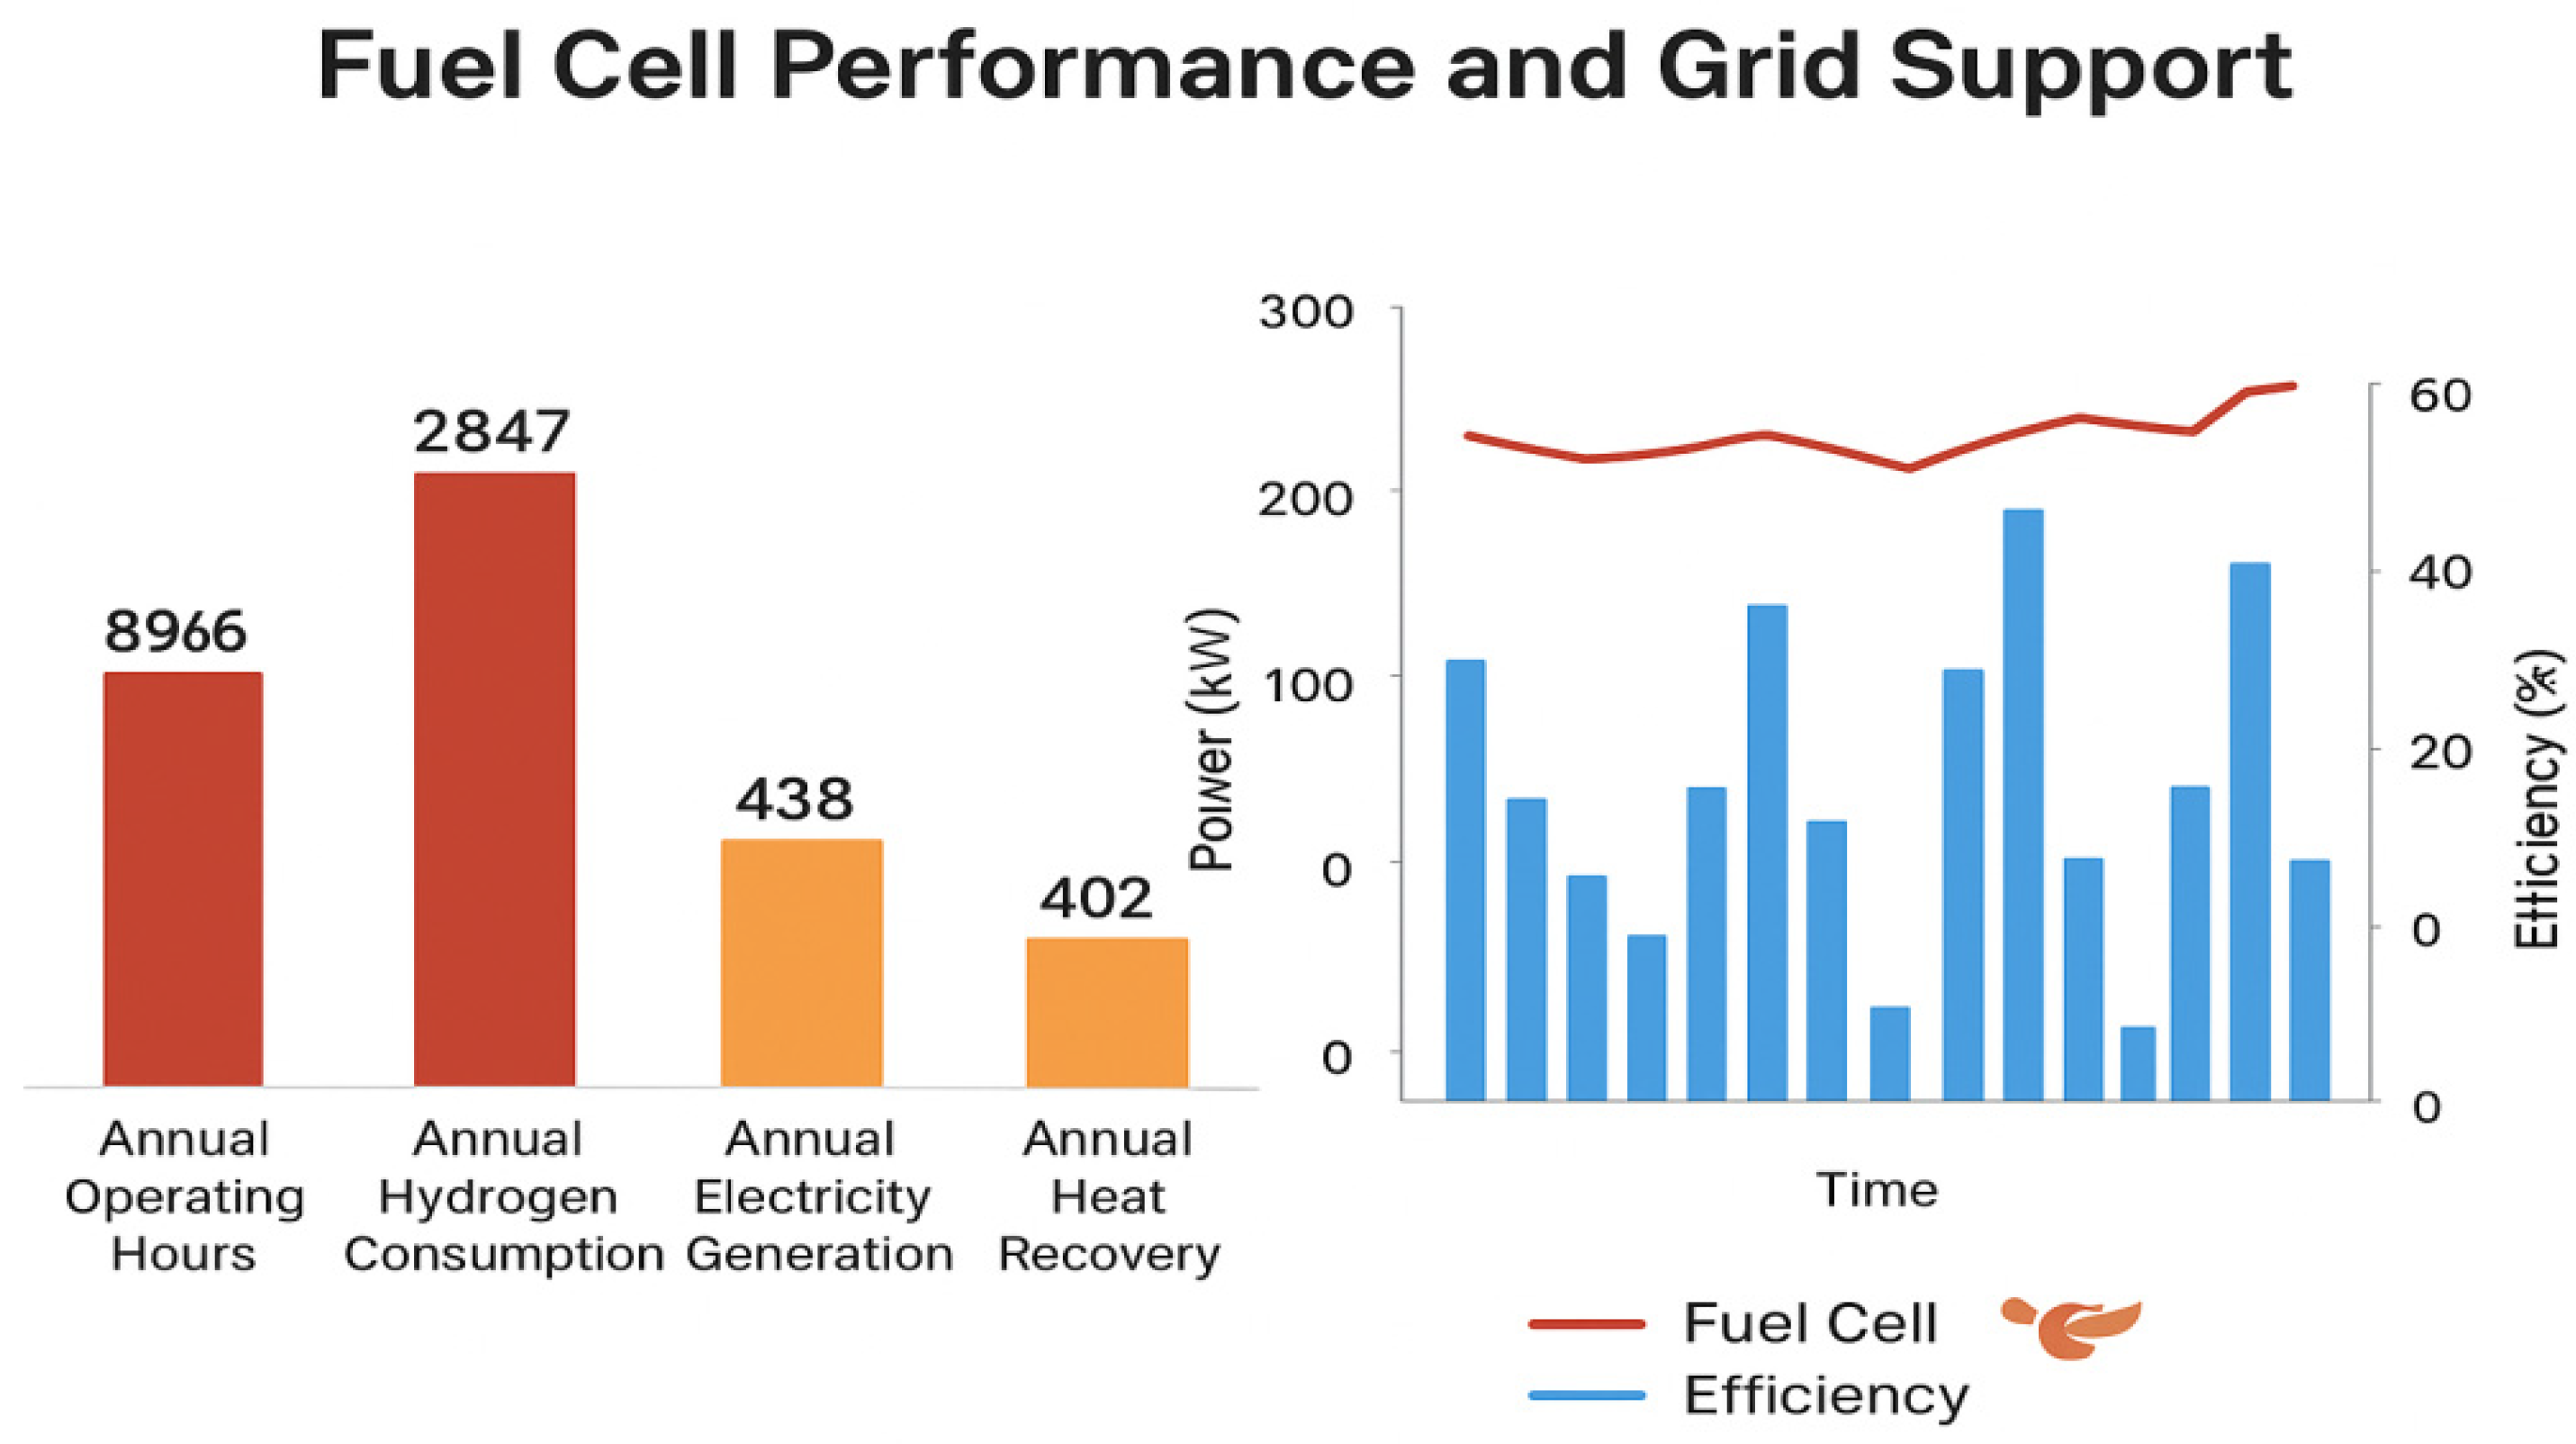
5.6. Fuel Cell Performance and Grid Support
5.7. Hydrogen End-Use Analysis
6. Economic Analysis
- -
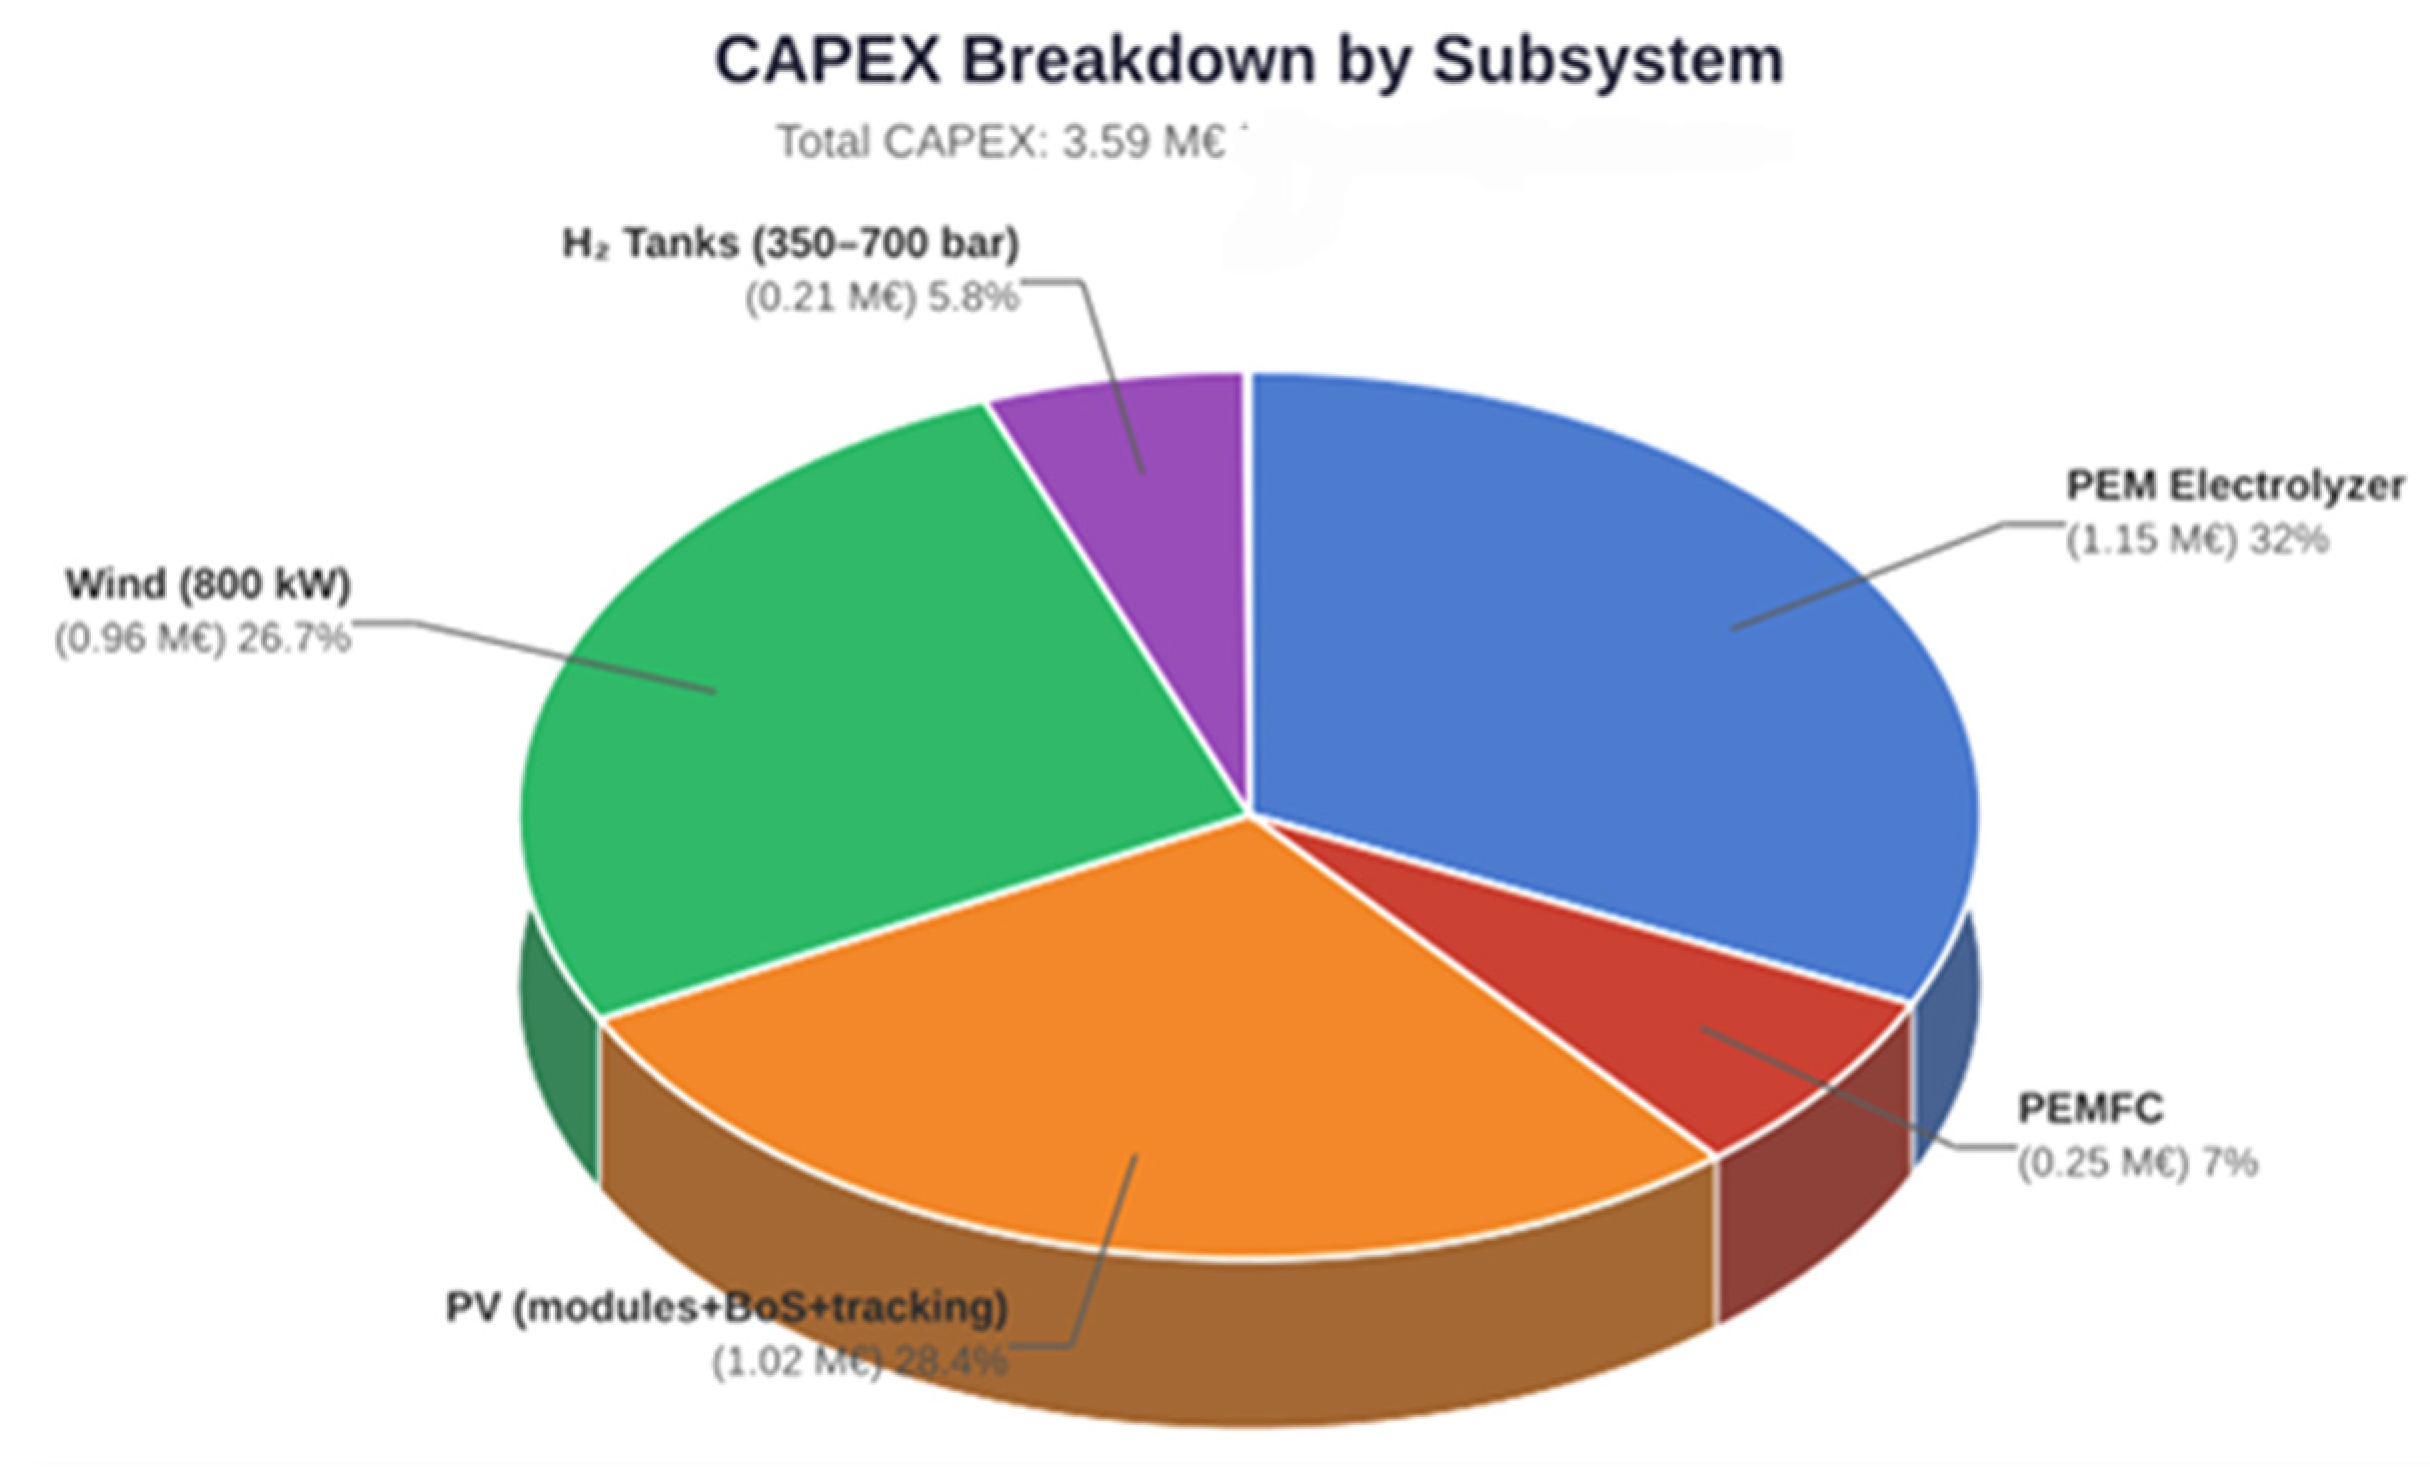
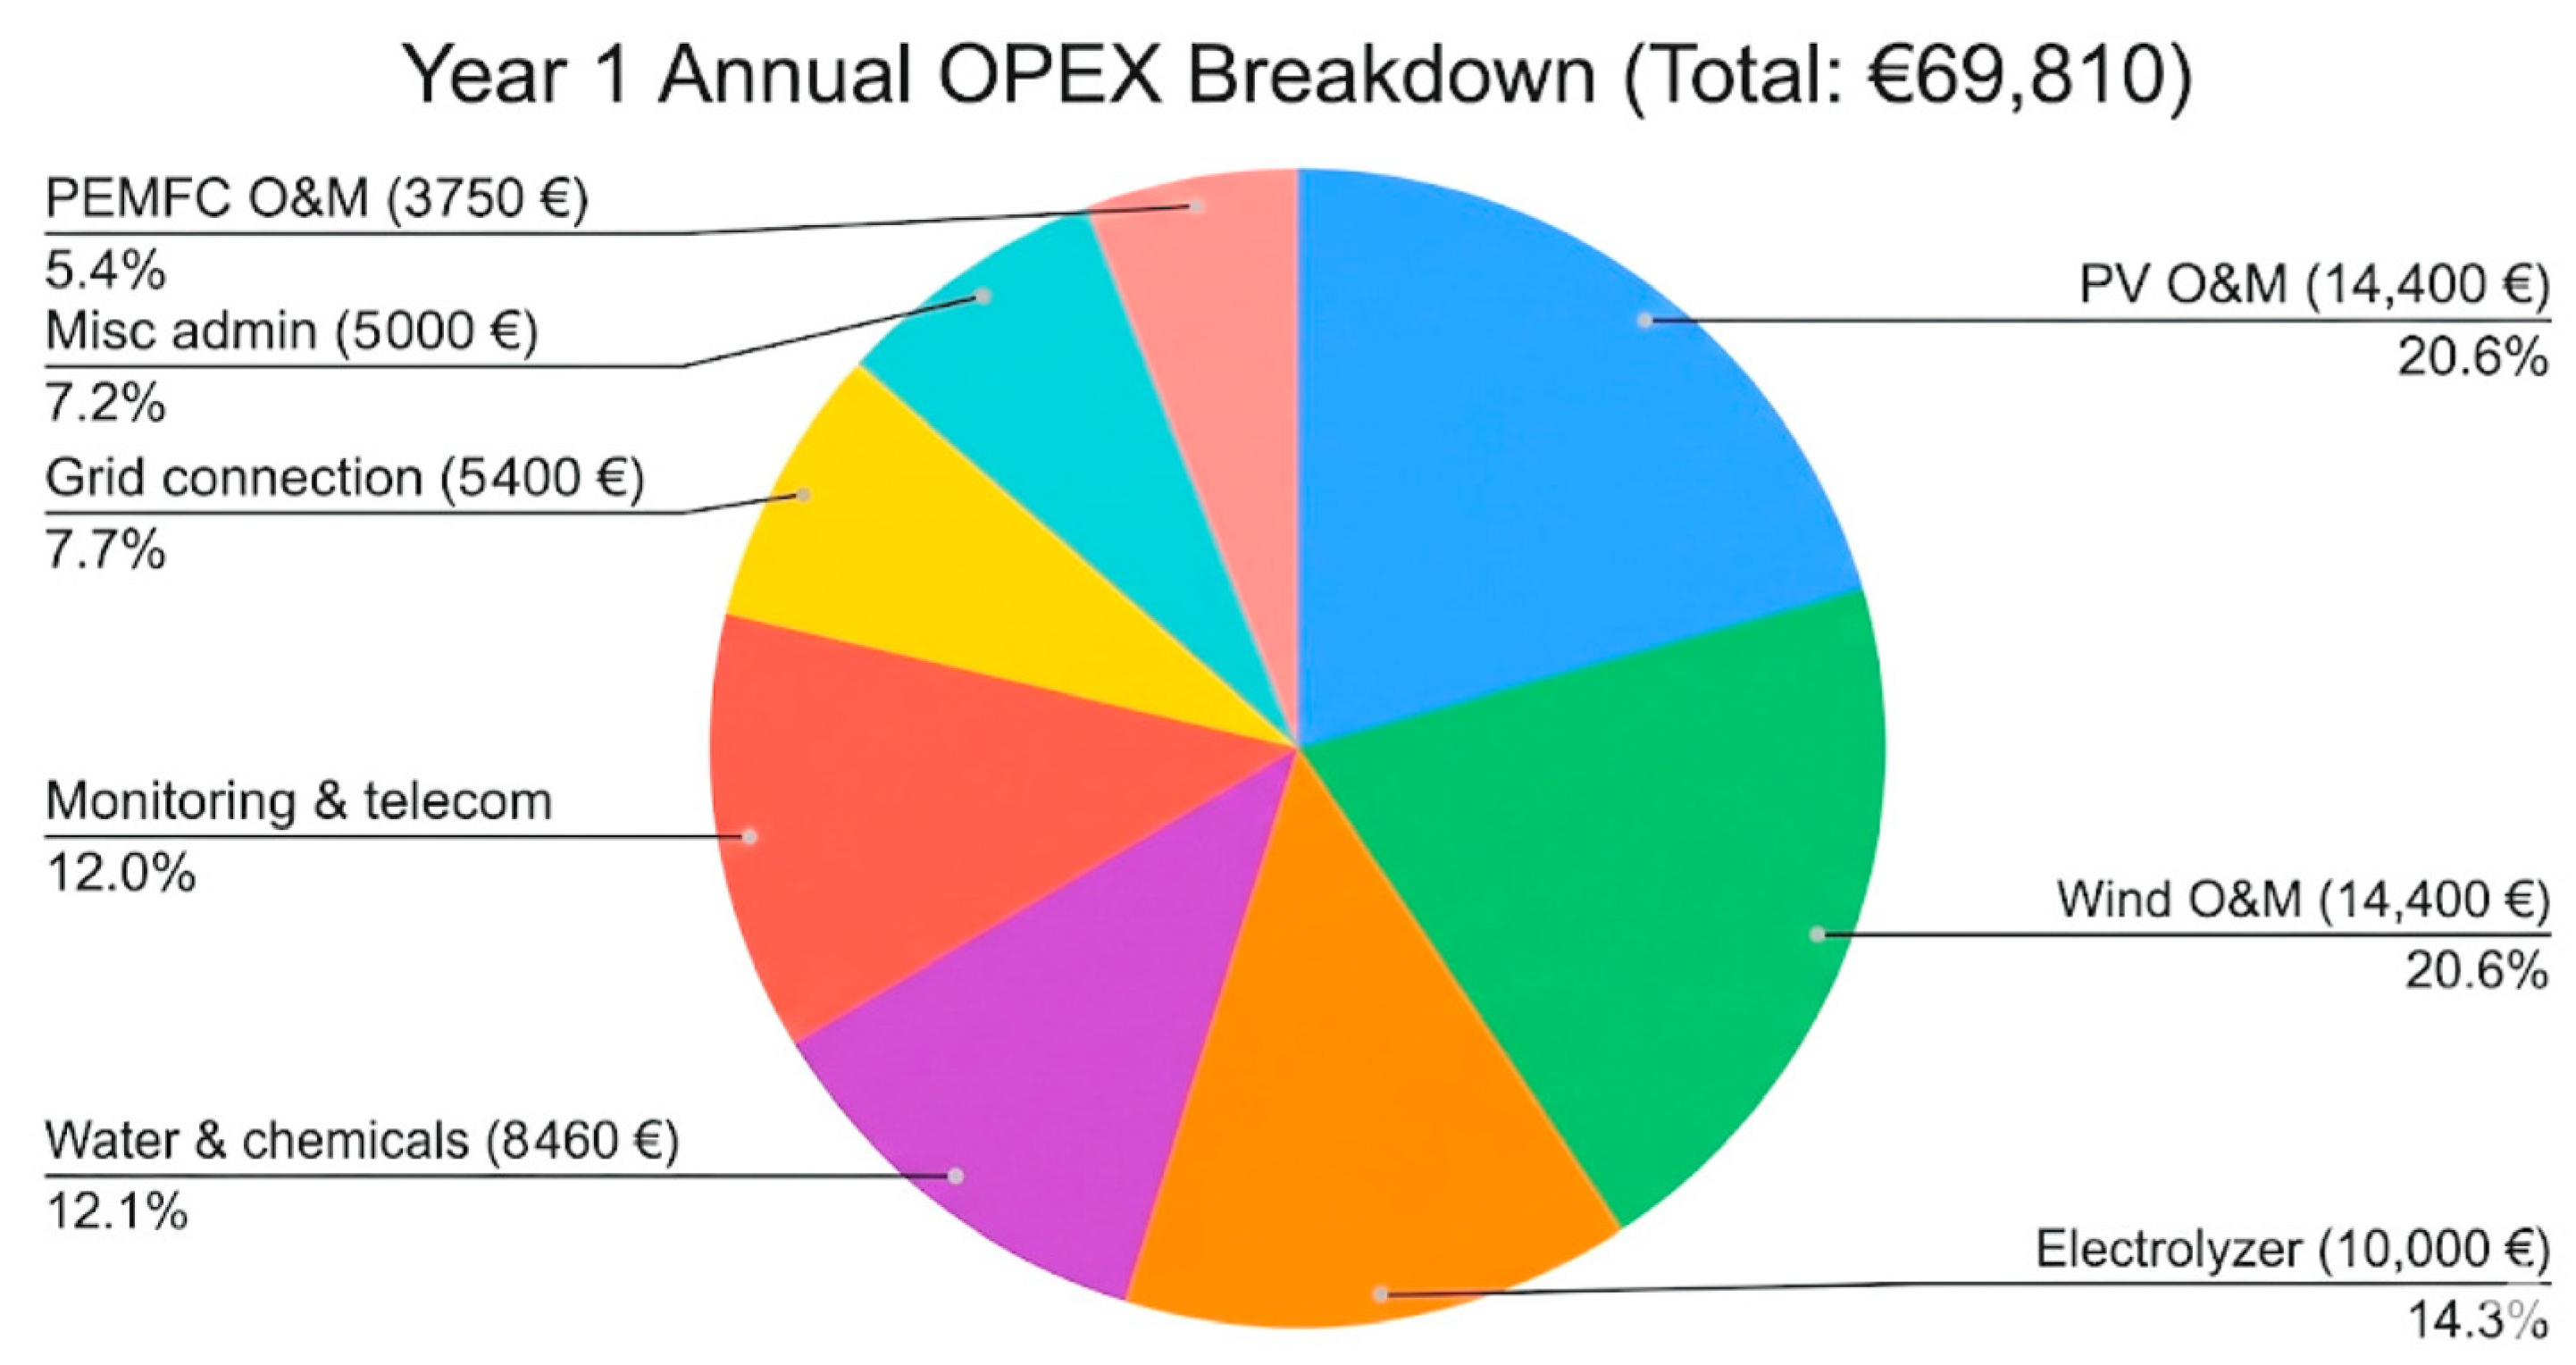
- CAPEX and OPEX breakdown;
- -
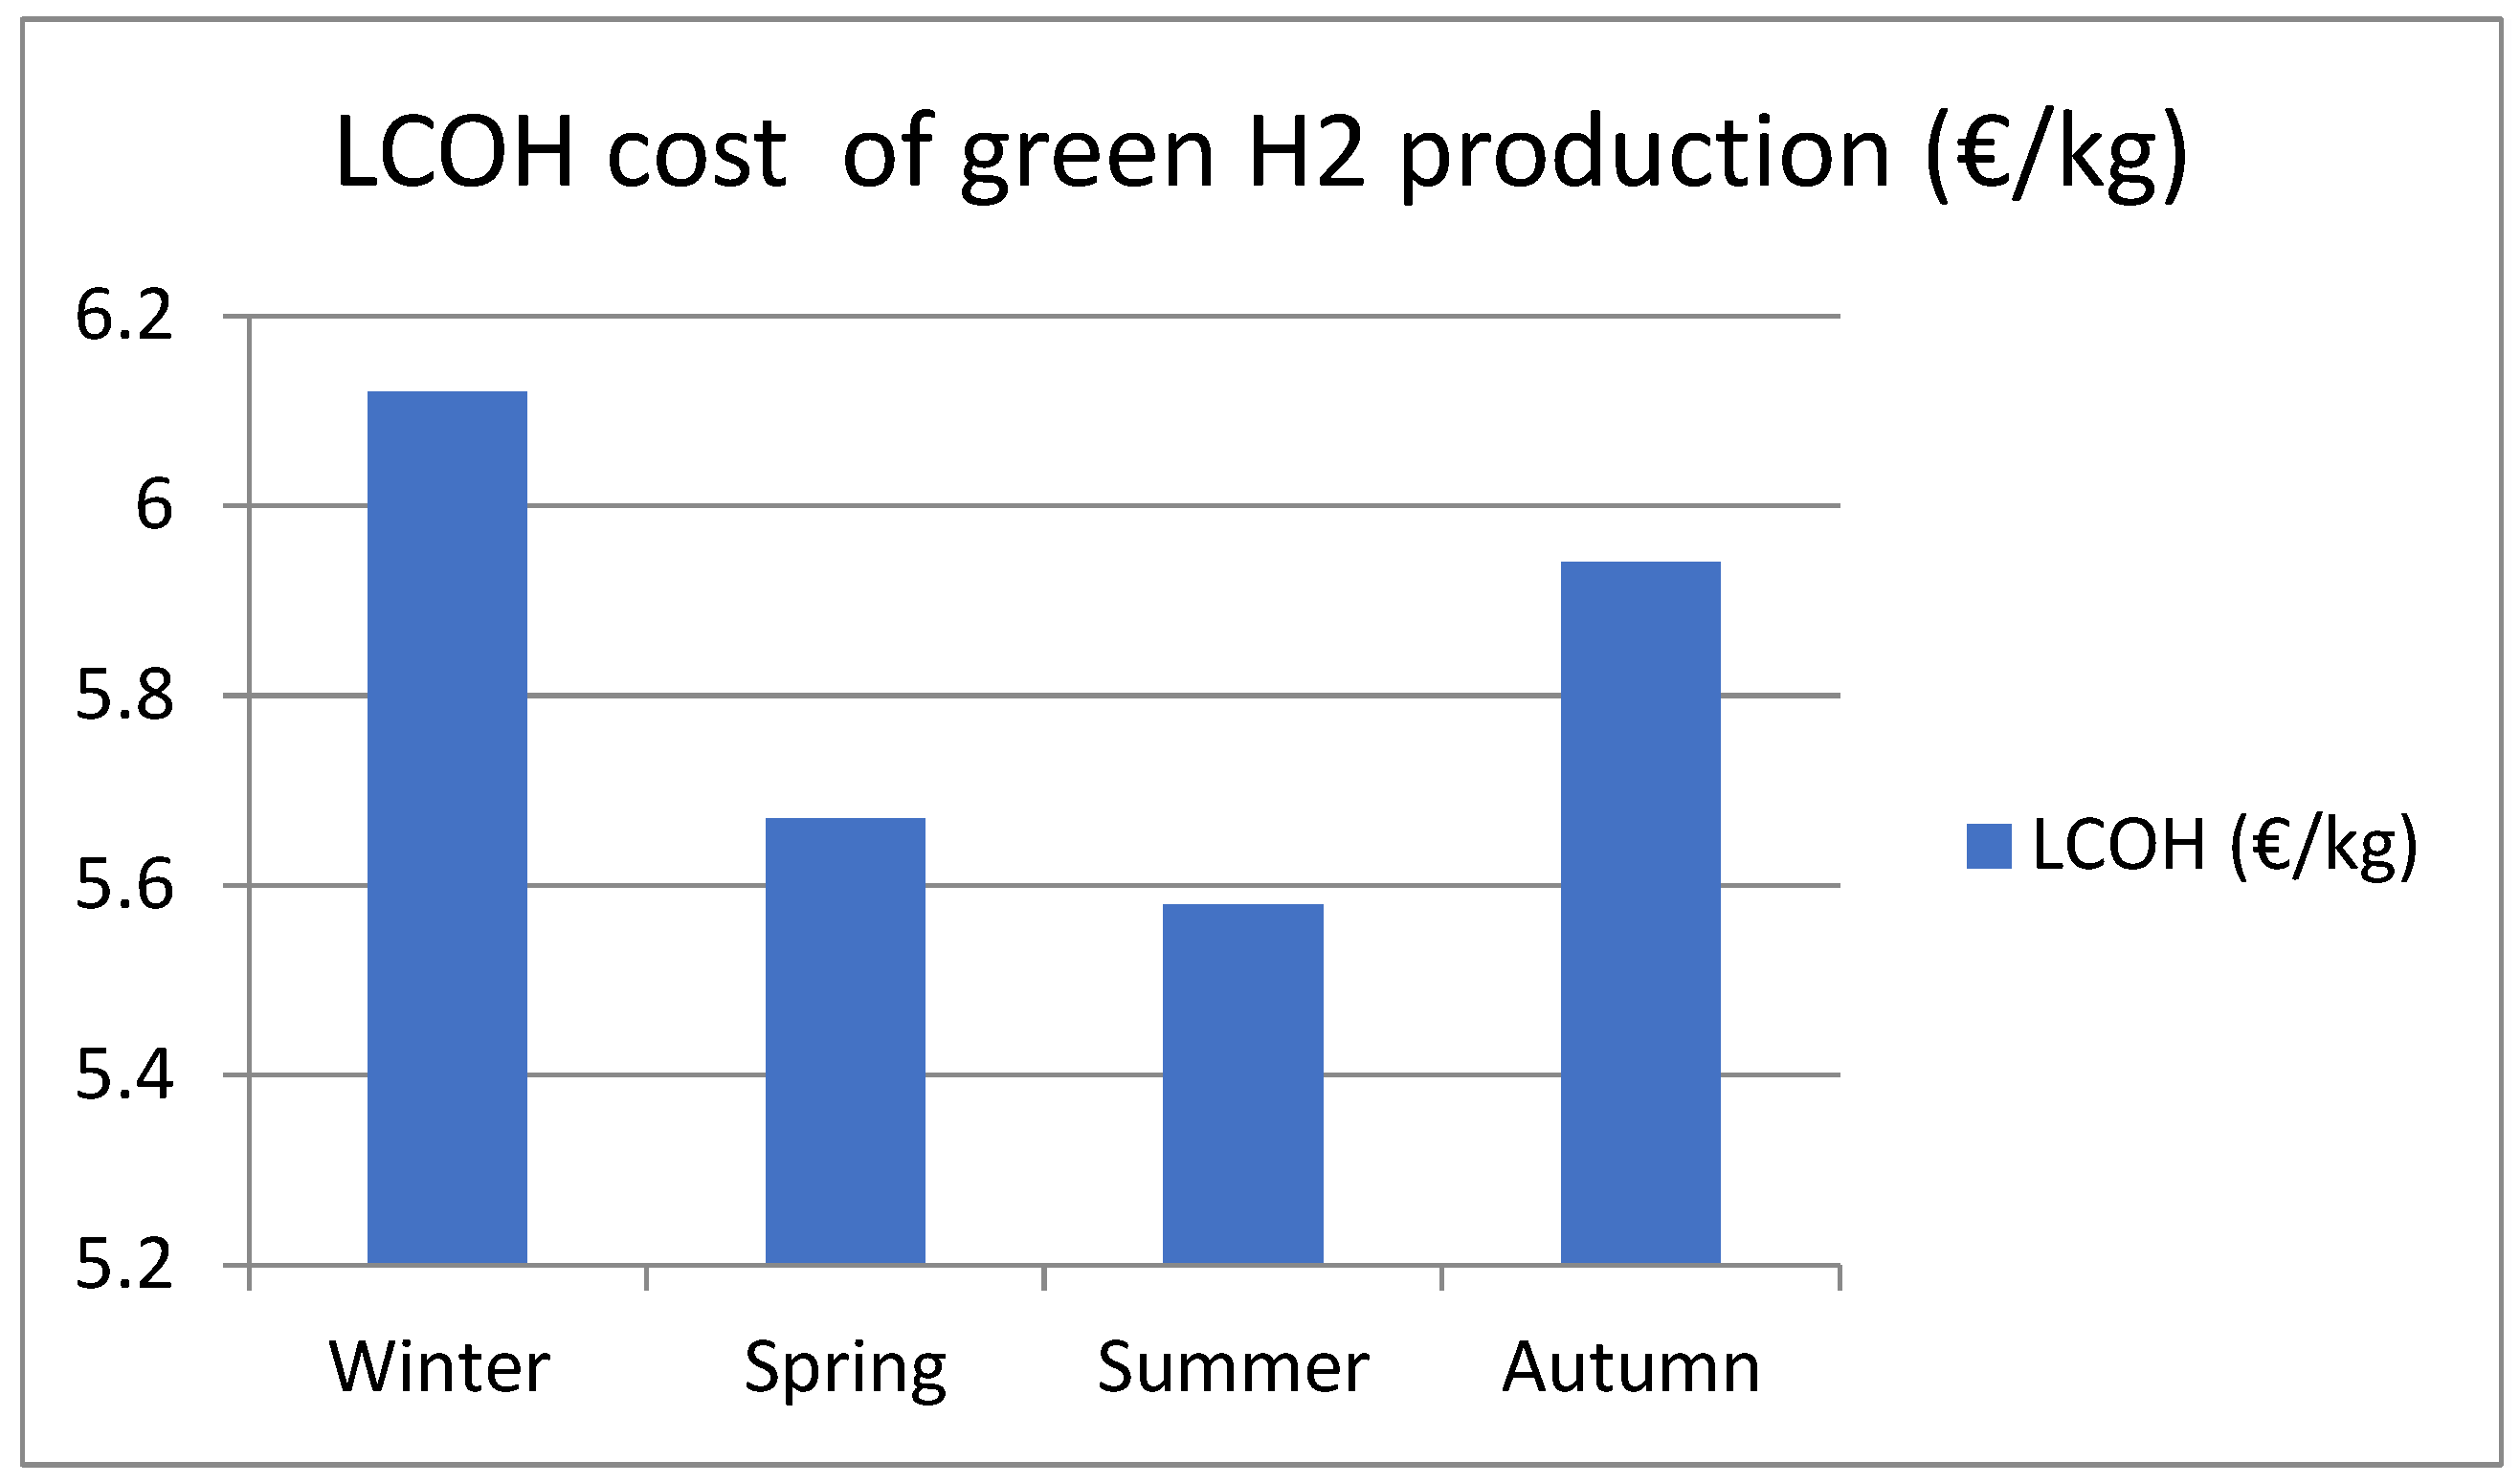
- Levelized Cost of Hydrogen (LCOH);
- -
- Levelized Cost of Electricity (LCOE) for EV charging from H2;
- -
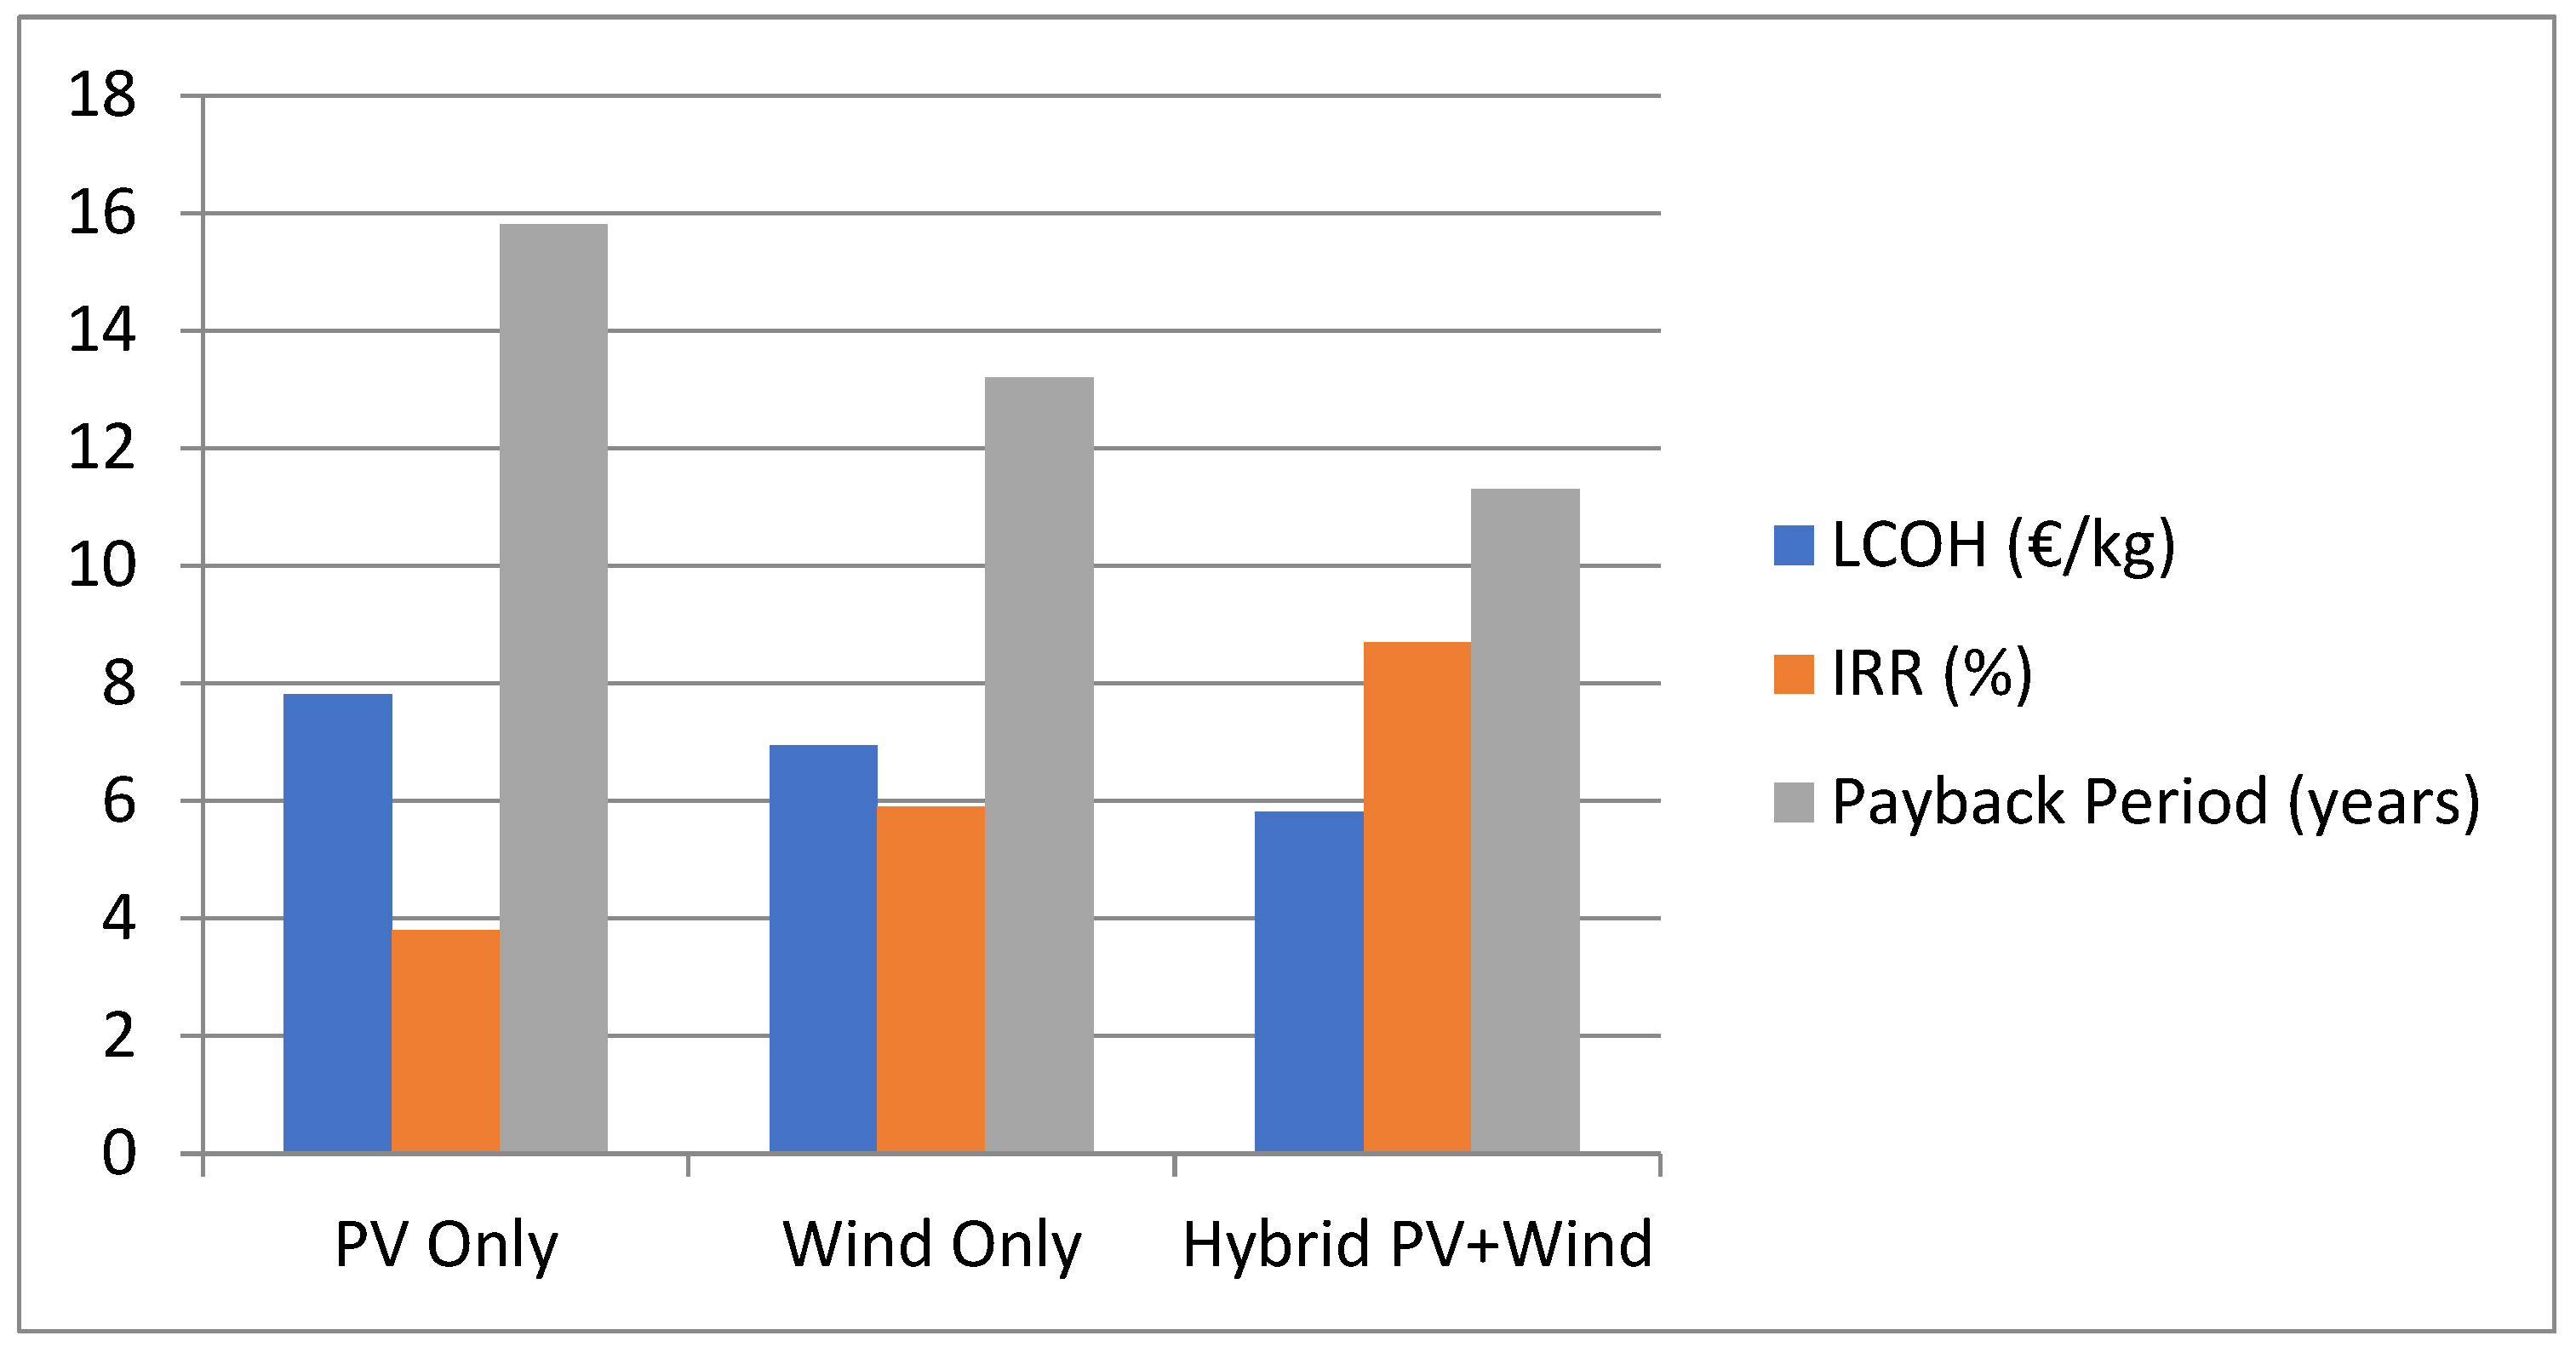
- Profitability indicators: NPV, IRR, payback;
- -
- Sensitivities to key techno-economic parameters.
- Renewable generation systems (PV panels, wind turbines).
- Electrolyzer system (stack, power electronics, balance of plant).
- Hydrogen storage (tanks, compression systems).
- Refueling station infrastructure (dispensers, safety systems).
- Grid connection and electrical infrastructure.
- Control, monitoring, and safety systems.
- Electricity cost for electrolyzer operation.
- Water consumption and treatment.
- Routine maintenance of electrolyzers, compressors, and storage systems.
- Replacement of components.
- Personnel and monitoring systems.
- Insurance, safety inspections, and regulatory compliance.
6.1. Capital Investment Breakdown Evaluation
6.2. Operating Costs and Revenue Evaluation
6.3. Levelized Cost of Hydrogen (LCOH)
6.4. Financial Metrics
7. Environmental Impact Assessment
7.1. CO2 Reduction
7.2. Key Findings on Environmental Impact and LCA
- -
- Carbon Footprint and Payback: The full life-cycle analysis, including manufacturing and end-of-life impacts (embodied emissions of PV panels, wind turbines, electrolyzers, and storage systems), shows a Carbon Payback Period of 2.3 years. This rapid recovery period confirms that the emissions generated during the manufacture of the renewable infrastructure are quickly offset by the clean hydrogen production.
- -
- Lifetime Emission Reduction: Over the 20-year project duration, the system is projected to achieve a significant net carbon reduction totaling approximately 32,120 tonnes CO2 equivalent (1656 tonnes/year × 20 years = 33,120 tonnes).
- -
- Comparison to Conventional Methods (CO2 Avoidance): Versus Grid-Powered Hydrogen: The system avoids 1656 tonnes of CO2 annually compared to producing hydrogen using grid electricity (assuming a grid intensity emissions of 450 g CO2/kWh: https://www.iea.org/reports/electricity-2025/emissions accessed on 1 January 2026).
- -
- Comparison to Conventional Methods Versus Gray Hydrogen: When displacing conventional hydrogen from Steam Methane Reforming (SMR, or “gray hydrogen”), the annual emission reduction is 518 tonnes CO2.
- -
- Pollutant Avoidance: In addition to CO2 reductions, the system eliminates local pollutant emissions typically associated with fossil fuels, including NOx, PM2.5, and SO2.
8. Discussion and Comparison
8.1. Advantages of the Proposed Integrated System
8.2. Main Limitations
- -
- Exclusion of Revenue in Primary LCOH Calculation: The initially calculated Levelized Cost of Hydrogen (LCOH) of €5.82/kg excludes potential revenue streams from grid services and EV charging. While the study estimates a potential net cost reduction to €4.95/kg if these are fully valued, the primary reported LCOH does not reflect this.
- -
- Reliance on Simulation: The study is based on detailed techno-economic simulation using HOMER Pro and MATLAB/Simulink. While comprehensive, simulation results may differ from real-world performance due to unforeseen component degradation, control system complexities, or site-specific weather variations not fully captured by the average meteorological data.
- -
- Future Cost Projections: The viability assessment relies on projected cost reductions (LCOH below €3.50/kg by 2030) to achieve parity with gray hydrogen, which assumes continued technological advancements in renewables and electrolyzers. If these cost reductions do not materialize as rapidly as projected, the long-term economic competitiveness may be affected.
- -
- Grid Interconnection Constraints: While the system can provide grid services, the paper notes that “grid capacity constraints in many regions limit export potential, necessitating careful siting and potentially costly grid upgrades,” which could pose a significant practical limitation for replication.
- -
- Fixed Discount Rate: The LCOH calculation is based on a fixed 6% discount rate over the 20-year project lifetime. Changes in actual financing costs or market interest rates could significantly alter the financial viability metrics (IRR and LCOH).
- -
- Focus on Specific Location Data: The meteorological data (solar irradiance and wind speed) used for simulation are specific to Tunis (36°49′08″ N and 10°09′56″ E). The scalability and replication potential in other geographic regions would require site-specific optimization, as resource profiles greatly influence the hybrid system’s performance.
8.3. Scalability and Replication Potential
8.4. Results Synthesis
- -
- Electrolyzer Degradation: A shorter stack lifetime (e.g., 5 years) or increased catalyst price volatility would necessitate more frequent replacement CAPEX, potentially driving the Levelized Cost of Hydrogen (LCOH) above €6.50/kg.
- -
- Hydrogen Price Volatility: A 10% reduction in the H2 selling price would extend the Payback Period from 11 years to 14–16 years, severely impacting the IRR.
- -
- CAPEX Risk: A 10% overrun in initial capital expenditure would push the LCOH towards €6.20/kg, reducing competitiveness against alternative production methods.
8.5. Energy Management System (EMS)
8.6. Comparison with Other Projects
| Project/Study Context | System Configuration | H2 Production Capacity | Electrolyzer Capacity Factor | LCOH (€/kg) |
|---|---|---|---|---|
| Proposed Project | Hybrid Solar PV (1.2 MW) + Wind (0.8 MW) | 153 kg/day (55.8 t/yr) | 71% | €5.82 |
| Turkey Case Study (Gökçeada Island) [41] | Hybrid Wind + PV + Battery | 125 kg/day | 65% | €7.92 |
| South Africa Study (7 Cities) [42] | Wind-Powered only | 145 kg/day | 45% | €5.6–€7.98 |
| Korea Case Study (Small-scale) [43] | On-site Production (General) | 70 kg/day | 40% | €8.06 |
| Bad Lauchstädt Central Germany [44] | Dedicated Wind Farm (50 MW) | 1350 kg/day | 66% | €5.50 |
| European Average (On-site RES) | Electrolysis connected to RES | Varies | Varies by source | €6.70 |
9. Conclusions
Author Contributions
Funding
Data Availability Statement
Conflicts of Interest
References
- IEA: International Energy Agency. CO2 Emissions from Fuel Combustion. Global Energy Review 2023; IEA: Paris, France, 2023. [Google Scholar]
- IRENA (International Renewable Energy Agency). Global Hydrogen Trade to Meet the 1.5 °C Climate Goal; International Renewable Energy Agency: Abu Dhabi, United Arab Emirates, 2022. [Google Scholar]
- Horri, B.A.; Ozcan, H. Green hydrogen production by water electrolysis: Current status and challenges. Curr. Opin. Green Sustain. Chem. 2024, 47, 100932. [Google Scholar] [CrossRef]
- Lazard. Levelized Cost of Energy Analysis—Version 16.0; Lazard: New York, NY, USA, 2023; Available online: https://www.lazard.com/research-insights/levelized-cost-of-energyplus/ (accessed on 1 January 2026).
- Kumar, S.S.; Himabindu, V. Hydrogen production by PEM water electrolysis A review. Mater. Sci. Energy Technol. 2019, 2, 442–454. [Google Scholar] [CrossRef]
- De Wolf, D.; Smeers, Y. Comparison of Battery Electric Vehicles and Fuel Cell Vehicles. World Electr. Veh. J. 2023, 14, 262. [Google Scholar] [CrossRef]
- Ghosh, A. Solar-Powered Green Hydrogen from Electrolyzer (PV-H2): A Review. Solar RRL 2025, 9, 14. [Google Scholar] [CrossRef]
- Schmidt, O.; Gambhir, A.; Staffell, I.; Hawkes, A.; Nelson, J.; Few, S. Future cost and performance of water electrolysis: An expert elicitation study. Int. J. Hydrogen Energy 2017, 42, 30470–30492. [Google Scholar] [CrossRef]
- European Commission. A Hydrogen Strategy for a Climate-Neutral Europe; COM2020-301 Final; European Commission: Brussels, Belgium, 2020. [Google Scholar]
- Bloomberg NEF. 2H 2023 Hydrogen Market Outlook: The Demand Question, October 19, 2023. Available online: https://about.bnef.com/insights/clean-energy/2h-2023-hydrogen-market-outlook-the-demand-question/ (accessed on 1 January 2026).
- Buttler, A.; Spliethoff, H. Current status of water electrolysis for energy storage, grid balancing and sector coupling via power-to-gas and power-to-liquids. Renew. Sustain. Energy Rev. 2018, 82, 2440–2454. [Google Scholar] [CrossRef]
- Miller, H.A.; Bouzek, K.; Hnat, J.; Loos, S.; Bernäcker, C.I.; Weissgaerber, T.; Röntzsch, L.; Meier-Haack, J. Green hydrogen from anion exchange membrane water electrolysis: A review of recent developments in critical materials and operating conditions. Sustain. Energy Fuels 2020, 4, 2114–2133. [Google Scholar] [CrossRef]
- Carmo, M.; Fritz, D.L.; Mergel, J.; Stolten, D. A comprehensive review on PEM water electrolysis. Int. J. Hydrogen Energy 2013, 38, 4901–4934. [Google Scholar] [CrossRef]
- Hauch, A.; Küngas, R.; Blennow, P.; Hansen, A.B.; Hansen, J.B.; Mathiesen, B.V.; Mogensen, M.B. Recent advances in solid oxide cell technology for electrolysis. Science 2020, 370, 186. [Google Scholar] [CrossRef]
- Ahmed, N.A.; Miyatake, M. A stand-alone hybrid generation system combining solar photovoltaic and wind turbine with simple maximum power point tracking control. In Proceedings of the CES/IEEE 5th International Power Electronics and Motion Control Conference (IPEMC 2006), Shanghai, China, 14–16 August 2006. [Google Scholar] [CrossRef]
- Ahmed, R.; Sreeram, V.; Mishra, Y.; Arif, M.D. A review and evaluation of the state-of-the-art in PV solar power forecasting: Techniques and optimization. Renew. Sustain. Energy Rev. 2020, 124, 109792. [Google Scholar] [CrossRef]
- Arsad, A.Z.; Hannan, M.A.; Al-Shetwi, A.Q.; Mansur, M.; Muttaqi, K.M.; Dong, Z.Y.; Blaabjerg, F. Hydrogen energy storage integrated hybrid renewable energy systems: A review analysis for future research directions. Int. J. Hydrogen Energy 2022, 47, 17285–17312. [Google Scholar] [CrossRef]
- Anthony Jnr, B. Integrating Electric Vehicles to Achieve Sustainable Energy as a Service Business Model in Smart Cities. Front. Sustain. Cities 2021, 3, 685716. [Google Scholar] [CrossRef]
- Apostolou, D.; Xydis, G. A literature review on hydrogen refuelling stations and infrastructure. Current status and future prospects. Renew. Sustain. Energy Rev. 2019, 113, 109292. [Google Scholar] [CrossRef]
- Nagashima, M. Japan’s Hydrogen Strategy and Its Economic and Geopolitical Implications; Études de l’Ifri; IFRI: Paris, France, 2018. [Google Scholar]
- Glenk, G.; Reichelstein, S. Economics of converting renewable power to hydrogen. Nat. Energy 2019, 4, 216–222. [Google Scholar] [CrossRef]
- ACIL Allen Consulting. Australia’s Hydrogen Opportunities; Report prepared for Australian Renewable Energy Agency (ARENA); ACIL Allen Consulting: Melbourne, Australia, 2018. [Google Scholar]
- World Bank. Scaling Hydrogen Financing for Development in Support; World Bank Report; Global Infrastructure Facility and Hydrogen Council: Washington, DC, USA, 2023. [Google Scholar]
- Rizk, M.R.; Hassan, I.A.; Snasel, V.; Hassanien, A.E. An optimal standalone wind-photovoltaic power plant system for green hydrogen generation: Case study for hydrogen refueling station. Results Eng. 2024, 22, 102234. [Google Scholar] [CrossRef]
- Urbasos, I.; Escribano, G. Spain’s Hydrogen Ambition: Between Reindustrialisation and Export Led Energy Integration with the EU. In The Geopolitics of Hydrogen; Springer: Cham, Switzerland, 2024. [Google Scholar] [CrossRef]
- Barbian, F. Hydrogène. Le projet à 800 Millions de H2V aboutira-t-il. Magazine La Semaine, 16 November 2024.
- INGRID39 MWh grid-connected renewable energy storage project. Fuel Cells Bull. 2012, 2012, 9. [CrossRef]
- H2BER Project says intelligent operation reduces mobility costs. Fuel Cells Bull. 2017, 2017, 9. [CrossRef]
- Al-Buraiki, A.S.; Al-Sharafi, A. Hydrogen production via using excess electric energy of an off-grid hybrid solar/wind system based on a novel performance indicator. Energy Convers. Manag 2022, 254, 115270. [Google Scholar] [CrossRef]
- Messaoudi, D.; Settou, N.; Allouhi, A. Geographical, technical, economic, and environmental potential for wind to hydrogen production in Algeria: GIS-based approach. Int. J. Hydrogen Energy 2024, 50, 142–160. [Google Scholar] [CrossRef]
- Kopp, M.; Coleman, D.; Stiller, C.; Scheffer, K.; Aichingesr, J.; Scheppat, B. Energiepark Mainz: Technical and economic analysis of the worldwide largest Power-to-Gas plant with PEM electrolysis. Int. J. Hydrogen Energy 2017, 42, 13311–13320. [Google Scholar] [CrossRef]
- Coleman, D.; Kopp, M.; Wagner, T.; Scheppat, B. The value chain of green hydrogen for fuel cell buses: A case study for the Rhine-Main area in Germany. Int. J. Hydrogen Energy 2020, 45, 5122–5133. [Google Scholar] [CrossRef]
- Li, C.-H.; Zhu, X.-J.; Cao, G.-Y.; Sui, S.; Hu, M.-R. Dynamic modeling and sizing optimization of stand-alone photovoltaic power systems using hybrid energy storage technology. Renew. Energy 2009, 34, 815–826. [Google Scholar] [CrossRef]
- Hidouri, D. Développement de Nouvelles Stratégies de Stockage D’énergie Dans les Systèmes PV Connecté au Réseau MT/BT. PhD Thesis, University of Tunis Manar, Tunis, Tunisia, 2024. [Google Scholar]
- Ackermann, T. Wind Power in Power Systems; E-Book; John Wiley and Sons, Ltd.: Hoboken, NJ, USA, 2005; pp. 58–110. [Google Scholar]
- Hosseini, M.; Shamekhi, A.H.; Yazdani, A. Modeling and Simulation of a PEM Fuel Cell (PEMFC) Used in Vehicles. In Proceedings of the SAE 2012 World Congress & Exhibition, Detroit, MI, USA, 24–26 April 2012. [Google Scholar] [CrossRef]
- Saleh, Z.H. Simplified mathematical model of proton exchange membrane fuel cell based on horizon fuel cell stack. J. Mod. Power Syst. Clean Energy 2016, 4, 2016. [Google Scholar] [CrossRef]
- Djilali, M. Contribution à la Conception de la ChaîneLogistique de L’hydrogène. Ph.D. Thesis, Université KasdiMerbah Ouargla, Ouargla, Algeria, 2021. [Google Scholar]
- Hoummadi, M.A.; Bossoufi, B.; Karim, M.; Hatatah, M.; Alghamdi, T.A.H.; Alenezi, M. AI-Enhanced Energy Management Systems for Efficient Flow Control in Microgrids. IET Renew. Power Gener. 2025, 19, e70039. [Google Scholar] [CrossRef]
- Dhifli, M.; Lashab, A.; Guerrero, J.M.; Abusorrah, A.; Al-Turki, Y.A.; Cherif, A. Enhanced intelligent energy management system for a renewable energy-based AC microgrid. Energies 2020, 13, 3268. [Google Scholar] [CrossRef]
- Kirim, Y. Sustainable Hydrogen Production with Hybrid Energy Systems: The Case of Çanakkale, Balıkesir, and İzmir. J. Turk. Chem. Soc. Sect. B 2025, 8, 251–262. [Google Scholar] [CrossRef]
- Hussein, M.; Jen, T.-C.; Imoisili, P.E. South Africa clean energy transition: The future of green hydrogen energy technology. Energy Rep. 2025, 13, 5501–5511. [Google Scholar] [CrossRef]
- Gim, B.; Yoon, W.L. Analysis of the economy of scale and estimation of the future hydrogen production costs at on-site hydrogen refueling stations in Korea. Int. J. Hydrogen Energy 2012, 37, 19138–19145. [Google Scholar] [CrossRef]
- Ströhler, S. Carbon Footprint Assessment of the Value Chain of Green Hydrogen with a Focus on the Shipping of Liquid Organic Hydrogen Carriers (LOHC). Master’s Thesis, Forschungsstelle für Energiewirtschaft, (FfE), Munich, Germany, 2024. [Google Scholar]








| Feature | Our Study | Kopp M. (Energy Park Mainz) | Rizk | Djilali. Nouredin | Wang | Bad Lauchstädt (Germany) |
|---|---|---|---|---|---|---|
| System Configuration | Integrated Hybrid Solar PV (1.2 MWp) and Wind (800 kW) feeding a 1 MW PEM electrolyzer. Includes both H2 storage and a 250 kW stationary PEM fuel cell for EV charging. | 6 MW PEM electrolysis project. | Optimal standalone Wind-PV Power Plant system sizing for H2 generation. | Green H2 supply chain based on Hybrid Solar PV/Wind for transport and village supply. | Integration of PV-generated H2 production, compression, and storage, and a dynamic model of a H2 fueling station. | Large-scale dedicated Wind Farm (50 MW). |
| Primary Focus/Output | Techno-economic simulation (HOME Pro/MATLAB) demonstrating viability for Sustainable Green Mobility (FCEVs and EV support). | Analysis of operating experience of large-scale PEM electrolysis and grid services. | Optimal sizing and economic impacts for a Hydrogen Refueling Station and wastewater treatment. | Assessment of geographical, technical, economic, and environmental potential for wind-to-hydrogen in Algeria. | Advancements in green hydrogen storage stations and dynamic modeling for heavy-duty vehicles. | Comparison and benchmarking of large-scale wind-to-hydrogen projects |
| Unique Contribution /Difference | Demonstrates the synergistic use of H2 for both FCEV refueling (77% usage) and Fuel Cell to Grid (FC2G) reconversion to support EV infrastructure, providing a holistic green mobility solution. | Practical validation of large-scale (MW-level) PEM electrolysis operation, providing ancillary services to the local grid. | Focuses heavily on optimal sizing and environmental sustainability integrated with ancillary services (wastewater treatment). | Macro-level analysis focused on vast resource potential and supply chain needs across a specific geography (Algeria). | Focuses on detailed control strategies, dynamic performance, and stationary storage optimization. | lower LCOH due to economies of scale from a 50 MW dedicated wind farm, contrasting with the proposed decentralized hybrid approach. |
| Component | Parameter | Value | Unit |
|---|---|---|---|
| Solar PV Array | |||
| Installed Capacity | 1200 | kWp | |
| Module Type | Monocrystalline Si | - | |
| Module Efficiency | 20 | % | |
| Number of Modules | 3042 | units | |
| Annual Generation | 1924 | MWh | |
| Wind Turbines | |||
| Installed Capacity | 800 | kW | |
| Number of Turbines | 2 | units | |
| Hub Height | 80 | m | |
| Rated Speed | 10 | m/s | |
| Annual Generation | 1752 | MWh | |
| PEM Electrolyzer | |||
| Capacity | 1000 | kW | |
| Operating Pressure | 30 | bar | |
| Operating Temperature | 60–80 | °C | |
| Efficiency (HHV) | 62 | % | |
| Water Consumption | 9 | L/kg H2 | |
| Fuell cell | |||
| Capacity | 250 | kW | |
| Operating Pressure | 30 | bar | |
| Efficiency (HHV) | 60 | % |
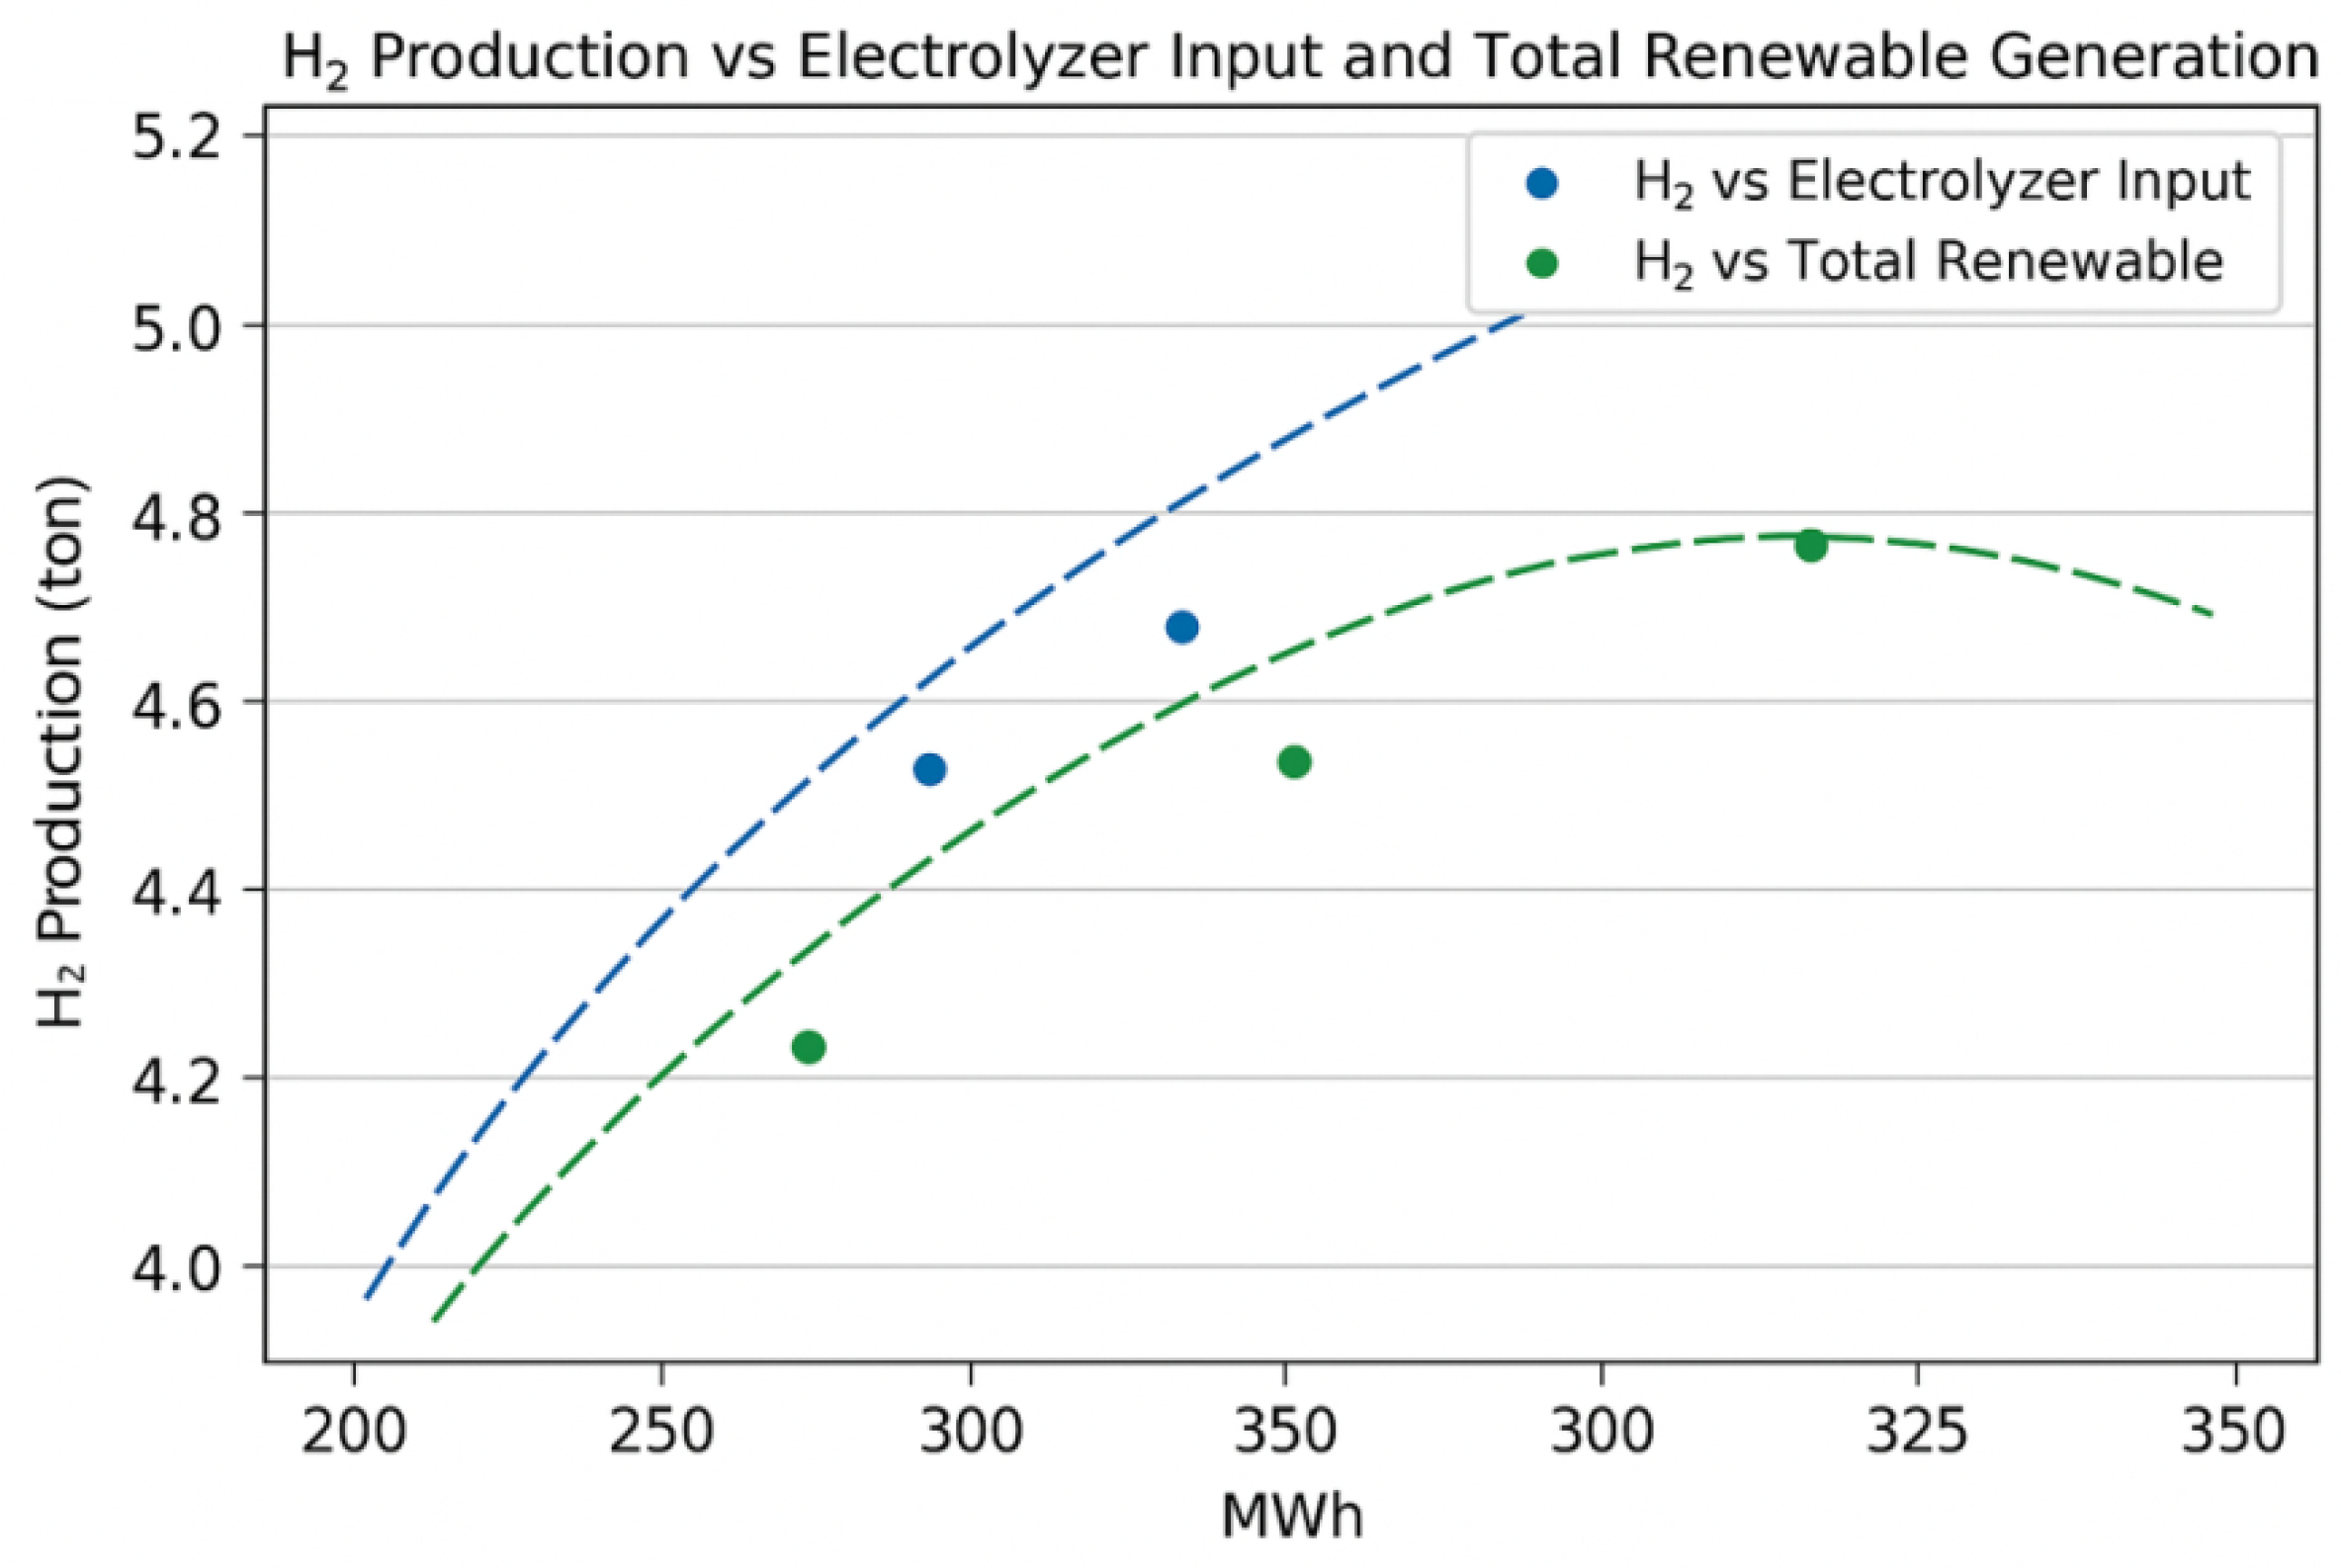
| Month | Solar Generation (MWh) | Wind Generation (MWh) | Total Renewable (MWh) | Electrolyzer Input (MWh) | H2 Production (ton) | Grid Export (MWh) |
|---|---|---|---|---|---|---|
| Jan | 98.4 | 187.3 | 285.7 | 248.2 | 4.2 | 15.8 |
| Feb | 112.7 | 172.4 | 285.1 | 251.3 | 4.3 | 12.4 |
| Mar | 156.8 | 165.2 | 322.0 | 278.9 | 4.8 | 21.3 |
| Apr | 189.2 | 143.6 | 332.8 | 290.4 | 5.0 | 24.7 |
| May | 213.4 | 128.9 | 342.3 | 298.7 | 5.1 | 28.9 |
| Jun | 227.6 | 112.3 | 339.9 | 295.8 | 5.0 | 31.2 |
| Jul | 241.2 | 104.7 | 345.9 | 301.2 | 5.1 | 33.6 |
| Aug | 224.8 | 108.9 | 333.7 | 289.6 | 4.9 | 30.8 |
| Sep | 178.9 | 124.5 | 303.4 | 263.2 | 4.5 | 25.7 |
| Oct | 143.2 | 156.8 | 300.0 | 259.8 | 4.4 | 22.9 |
| Nov | 104.6 | 178.9 | 283.5 | 245.7 | 4.2 | 18.6 |
| Dec | 98.2 | 192.5 | 290.7 | 252.3 | 4.3 | 16.4 |
| Total | 1989.0 | 1776.0 | 3765.0 | 3275.1 | 55.8 | 282.3 |
| Parameter | Daily Average | Annual Total | Unit |
|---|---|---|---|
| H2 Production | 153.1 | 55,873 | kg |
| Electrolyzer Operating Hours | 17.1 | 6241 | h |
| Electrolyzer Capacity Factor | 65 | 65 | % |
| Storage Pressure Range | 350 | - | bar |
| Compression Energy | 0.54 | 198 | MWh |
| H2 to FCEV Refueling | 117.6 | 42,924 | kg |
| H2 to fuel cell | 24.4 | 8966 | kg |
| Storage Efficiency | 89 | 89 | % |
| H2 Purity | 99.99 | 99.99 | % |
| Water Consumption | 1.28 | 468 | m3 |
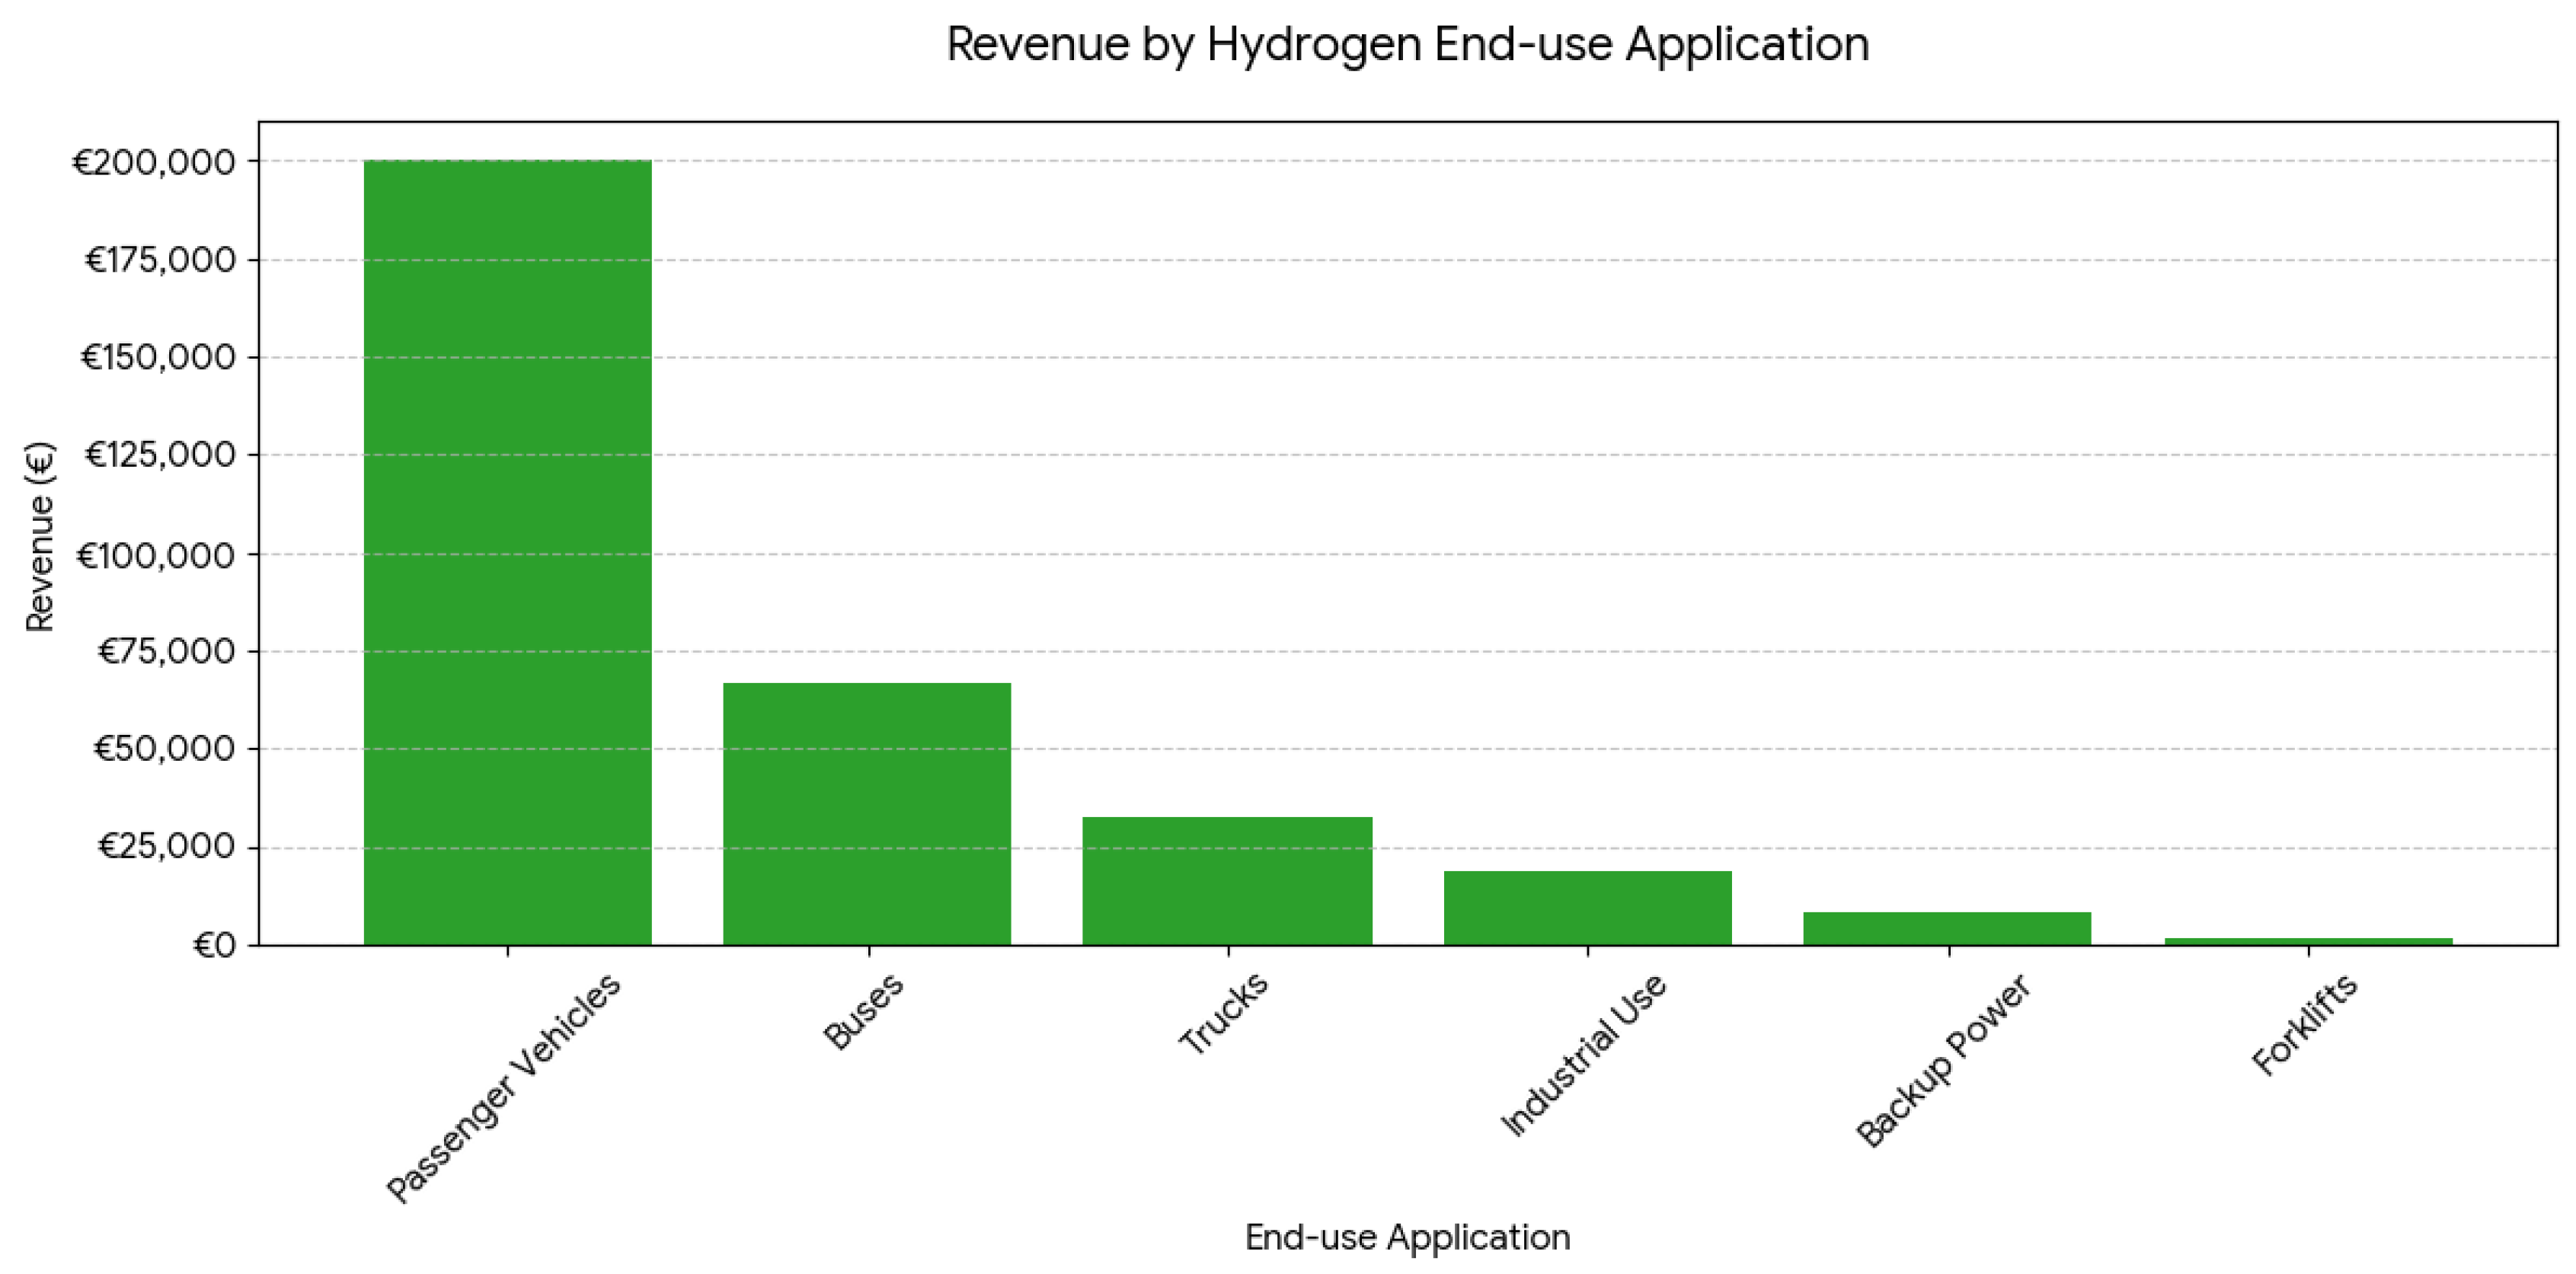
| Application | Daily Average (kg of H2) | Monthly Range (kg of H2) | Annual Total (kg of H2) | Energy Equivalent (MWh) | Revenue (€) |
|---|---|---|---|---|---|
| FCEV Refueling | |||||
| Passenger Vehicles | 78.4 | 2156–2487 | 28,616 | 952.3 | 200,312 |
| Buses | 26.1 | 719–829 | 9527 | 317.0 | 66,689 |
| Trucks | 12.8 | 352–406 | 4673 | 155.5 | 32,711 |
| Forklifts | 0.5 | 14–16 | 183 | 6.1 | 1281 |
| Stationary Applications | |||||
| Fuel Cell to Grid | 24.4 | 672–963 | 892 | 296.8 | |
| Backup Power | 3.2 | 88–112 | 1168 | 38.9 | 8176 |
| Indus Use | 7.4 | 204–259 | 2701 | 89.9 | 18,907 |
| Total | 152.8 | 4205–4672 | 55,788 | 1856.5 | 328,000 |
| Subsystem | Size Specific | Cost | CAPEX (M€) |
|---|---|---|---|
| PV(modules + BoS + tracking) | 1.2 MWp | 850 €/kWp | 1.02 |
| Wind (800 kW) | 0.8 MW | 1200 €/kW | 0.96 |
| PEM Electrolyzer | 1 MW | 1150 €/kW | 1.15 |
| H2 Tanks (350–700 bar) | 200 kg | 1050 €/kg H2 | 0.21 |
| PEMFC | 0.25 MW | 1000 €/kW | 0.25 |
| Season | Solar CF (%) | Wind CF (%) | Combined CF (%) | H2 Production (kg) | Electrolyzer CF (%) | LCOH (€/kg) |
|---|---|---|---|---|---|---|
| Winter | 12.8 | 31.2 | 20.8 | 12,824 | 68.4 | 6.12 |
| Spring | 19.4 | 24.8 | 21.8 | 14,807 | 72.8 | 5.67 |
| Summer | 22.3 | 18.9 | 20.8 | 15,127 | 74.3 | 5.58 |
| Autumn | 16.9 | 26.3 | 21.2 | 13,115 | 69.1 | 5.94 |
| Metrics | Value | Unit | Baseline | Reduction (%) |
|---|---|---|---|---|
| Annual CO2 Avoided (vs. Grid) | 1656 | t CO2/year | 0.45 kg/kWh | 100 |
| Annual CO2 Avoided (vs. Grey H2) | 518 | t CO2/year | 9.3 kg CO2/kg H2 | 100 |
| Lifetime CO2 Reduction | 2834 | t CO2 | 20-year operation | - |
| Carbon Payback Period | 2.3 | years | Manufacturing emission | - |
| Water Consumption | 468 | m3/year | - | - |
| Land Use | 4.2 | hectares | - | - |
| NOx Emissions Avoided | 2.84 | t/year | Diesel generators | 100 |
| PM2.5 Emissions Avoided | 0.156 | t/year | Diesel generators | 100 |
| SO2 Emissions Avoided | 1.23 | t/year | Coal power | 100 |
| Advantage | Hybrid PV + Wind System | Standalone Systems (PV-Only/Wind-Only) |
|---|---|---|
| Energy Generation | Highest annual generation (3765 MWh). | Lower generation (1989 MWh and 1776 MWh, respectively). |
| Resource Stability | Significantly reduces generation variability (28.4) due to resource complementarity. | Higher generation variability. |
| Hydrogen Production | Produces 55,873 kg of H2 annually (nearly double PV-only). | Lower production. |
| Electrolyzer Utilization | High capacity factor (71.2%). This leads to fewer start/stop cycles and improved equipment lifetime. | Lower utilization and more frequent cycling negatively affecting durability. |
| Economic Viability | Lowest LCOH (€5.82/kg) and highest Internal Rate of Return (IRR) (8.7%). | Lower financial viability; the hybrid LCOH is 25.6% better than the PV-only configuration. |
| Resilience | Ensures over 60 h of grid-independent operation. | Likely less resilient due to dependence on a single intermittent source. |
| Performance Metric | Category | PV-Only System | Wind-Only System | Hybrid PV + Wind |
|---|---|---|---|---|
| Annual Power Generation | Energy Generation | 1989 MWh | 1776 MWh | 3765 MWh |
| System Capacity Factor | Energy Generation | 18.3% | 25.0% | 21.5% |
| Generation Variability | Operational Stability | 45.8 | 38.2 | 28.4 |
| Annual H2 Production | Hydrogen Prod | 27,340 kg | 30,180 kg | 55,873 kg |
| Electrolyzer Operating Hours | Electrolyzer Use | 3124 h/yr | 3854 h/yr | 5980 h/yr |
| Electrolyzer Capacity Factor | Electrolyzer Use | 35.7% | 44.0% | 71.2% |
| Start/Stop Cycles | Equipment Lifespan | 487 cycles | 312 cycles | 186 cycles |
| Average System Efficiency | Conversion Efficiency | 65.8% | 66.9% | 68.2% |
| LCOH (€/kg) | Economic Metric | €7.82 | €6.94 | €5.82 |
| IRR (%) | Financial Metric | 3.8% | 5.9% | 8.7% |
Disclaimer/Publisher’s Note: The statements, opinions and data contained in all publications are solely those of the individual author(s) and contributor(s) and not of MDPI and/or the editor(s). MDPI and/or the editor(s) disclaim responsibility for any injury to people or property resulting from any ideas, methods, instructions or products referred to in the content. |
© 2026 by the authors. Published by MDPI on behalf of the World Electric Vehicle Association. Licensee MDPI, Basel, Switzerland. This article is an open access article distributed under the terms and conditions of the Creative Commons Attribution (CC BY) license.
Share and Cite
Adnen, C.; Khalil, K.; Bouachaoui, S.; Saleh, S. Integrated Solar-Wind Hydrogen Production System for Sustainable Green Mobility. World Electr. Veh. J. 2026, 17, 169. https://doi.org/10.3390/wevj17040169
Adnen C, Khalil K, Bouachaoui S, Saleh S. Integrated Solar-Wind Hydrogen Production System for Sustainable Green Mobility. World Electric Vehicle Journal. 2026; 17(4):169. https://doi.org/10.3390/wevj17040169
Chicago/Turabian StyleAdnen, Cherif, Kassmi Khalil, Sofiane Bouachaoui, and Sadeg Saleh. 2026. "Integrated Solar-Wind Hydrogen Production System for Sustainable Green Mobility" World Electric Vehicle Journal 17, no. 4: 169. https://doi.org/10.3390/wevj17040169
APA StyleAdnen, C., Khalil, K., Bouachaoui, S., & Saleh, S. (2026). Integrated Solar-Wind Hydrogen Production System for Sustainable Green Mobility. World Electric Vehicle Journal, 17(4), 169. https://doi.org/10.3390/wevj17040169