1. Introduction
The transport sector is one of the main sources of greenhouse gas emissions in the European Union, accounting for approximately 25% of total emissions [
1]. In light of growing climate issues and the urgent need for deep decarbonization, the European Union has implemented several strategic frameworks to shift towards sustainable, intelligent, and low-carbon mobility. The European Green Deal (2019) and the Fit for 55 packages aim to cut greenhouse gas emissions by at least 55% by 2030 and by 90% by 2050 compared to 1990 levels, moving towards achieving climate-neutral transport.
Table 1 summarizes the dynamics of greenhouse gas emission reduction targets in the EU transport sector.
Achieving these objectives requires a fundamental transformation of energy sources used in transport and the development of new infrastructure for alternative fuels. Among various technological solutions is hydrogen, and in particular “green hydrogen”—produced by electrolysis of water [
2] using renewable energy—is emerging as a key energy carrier in the decarbonization process [
3,
4]. Its advantages include zero emissions during use, high energy density, and storage and transport capabilities, making it suitable for both passenger and commercial vehicles, including in hard-to-decarbonize sectors such as heavy-duty and waterborne transport.
Hydrogen mobility is also recognized in EU strategy documents, including [
5], which emphasizes developing an integrated European hydrogen infrastructure and establishing regional “hydrogen valleys”. These initiatives support research, demonstration projects, and cross-sector cooperation among energy, transport, and industry. The strategy aims for 10 million tons of renewable hydrogen by 2030. It states that this requires “a supporting framework mechanism, functioning markets, clear legislation, as well as a dedicated infrastructure and logistics network”.
In Bulgaria, interest in hydrogen technologies is gradually growing, with the first pilot projects being introduced in public transport, industry, and energy. However, deployment remains constrained due to a lack of infrastructure, high initial costs, and regulatory difficulties [
6,
7].
In this context, the city of Ruse plays a strategic role in the national transport network due to its geographical position along the Danube River and its function as a key logistics hub between Bulgaria and Romania. The combination of urban passenger transport and river navigation offers favorable conditions for demonstrating integrated solutions for hydrogen mobility, including the production, storage, and use of hydrogen in real operational settings. This makes the city of Ruse an appropriate example of a pilot model for a regional hydrogen ecosystem that involves public, industrial, and academic partners.
To address the gaps in current research, this study adopts a three-dimensional framework of policy–technology–geography. This framework identifies key theoretical and empirical gaps: the lack of models for hydrogen energy integration in Eastern European countries, Bulgaria’s reliance on EU-level policy incentives, and localization challenges, such as infrastructure constraints and regional resource availability. By explicitly considering these factors, this study contributes to the understanding and design of multimodal hydrogen systems in transitional economies, offering both empirical evidence and strategic insights for policy and technology deployment.
The manuscript is organized as follows:
Section 2 presents a review of strategic documents and the literature;
Section 3 outlines the research methodology;
Section 4 describes the case study and presents results; and finally,
Section 5 provides conclusions and recommendations.
2. Review of Strategy Documents and Literature
Hydrogen occupies a central place in a number of strategic documents of the European Union:
- -
Ref. [
5] outlines a roadmap for the production and use of green hydrogen by 2030. The document presents a three-stage plan by 2050, with a target of 40 GW of electrolyzers by 2030;
- -
Ref. [
8] envisages the integration of alternative fuels into urban transport by 2030;
- -
Ref. [
9] introduces requirements for H
2 stations along the main corridors of the Trans-European Transport Network (TEN-T);
- -
Ref. [
10] 2023/2413 (RED III) establishes requirements for the share of renewable hydrogen in transport—5.5% by 2030.
Some authors [
11,
12] describe the role of hydrogen in the decarbonization of heavy-duty, rail, and maritime transport, whereas electrification is more appropriate for light vehicles.
In Bulgaria, the development of hydrogen energy is set in the following:
- -
National Recovery and Resilience Plan (2021)—includes the construction of pilot hydrogen stations and laboratories;
- -
Integrated Energy and Climate Plan of the Republic of Bulgaria 2021–2030 (NECP, 2023) [
13]—sets an indicative target for the integration of hydrogen in transport by 2030;
- -
The National Roadmap for Hydrogen Technologies (2023–2026) outlines Bulgaria’s strategic vision to promote the development and adoption of hydrogen technologies. It aims to achieve climate targets, reduce greenhouse gas emissions, facilitate the transition to sustainable and efficient renewable energy sources, and support a circular economy.
Recent studies [
14] highlight Bulgaria’s potential to produce green hydrogen through electrolysis, leveraging existing photovoltaic and wind capacities. However, systematic policy measures and financial support for its deployment in the transport sector remain limited.
Hydrogen is considered a crucial energy carrier for decarbonizing transport, especially in applications where battery electrification is constrained by vehicle volume, weight, or operational range.
Table 2 summarizes the applications, advantages, and challenges of hydrogen across different transport sectors, illustrating both its potential benefits and the barriers to large-scale adoption.
Table 2 provides an overview of the applications, advantages, and challenges of hydrogen across various transport sectors. To further contextualize these findings, a comparative discussion of key references is presented. Specifically, in Hydrogen Strategy for a Climate-Neutral Europe [
5] outlines the roadmap for hydrogen deployment, highlighting national strategies and milestones, whereas in Sustainable & Smart Mobility [
8] emphasizes the integration of alternative fuels in urban transport systems. Additionally, in Regulation Alternative Fuels Infrastructure Regulation (EU 2023/1804) [
9] specifies technical requirements for H
2 refueling stations along TEN-T corridors, while in Renewable Energy Directive (RED III) [
10] sets targets for renewable hydrogen adoption in the transport sector. This comparison illustrates the interplay between policy frameworks, infrastructure planning, and practical implementation considerations for hydrogen mobility.
The fuel cell-based electric vehicles come with an additional burden of safety hazards; therefore, the manufacturers have to undergo increased scrutiny from government permitting agencies regarding electrical safety and hazards from stored hydrogen. Although the mileages and zero tailpipe emissions are strong selling points, hydrogen-based fuel cell EVs have failed to gain market in the automobile industry [
15].
Research has demonstrated that using hydrogen as a fuel for buses can cut CO
2 emissions by more than 80% when integrated into urban transport, depending on the hydrogen source [
16]. Ref. [
17] examines the economic viability of H
2 infrastructure in Central Europe and emphasizes the importance of public–private partnerships. In [
18], it is noted that combining hydrogen and electric mobility enhances the flexibility of energy systems.
Table 3 presents the total cost of ownership (TCO) comparison between diesel, battery-electric, and hydrogen fuel cell buses. The high initial cost of fuel cell systems remains the main bottleneck for economic viability, despite lower operational costs and zero tailpipe emissions. To improve the accuracy of long-term cost projections, we incorporate the effects of electrochemical degradation in PEM fuel cells, specifically reversible voltage loss, following the life prediction model proposed by [
19]. This model quantifies the impact of voltage recovery on system longevity, thereby strengthening the durability assumption used in the TCO analysis. By including these effects, the projections that hydrogen bus costs may converge with diesel vehicles after 2030 are supported with a more robust, microscopic electrochemical basis.
While traditional durability assumptions rely on static electrochemical degradation models, recent advancements in deep learning have introduced more robust predictive capabilities. Specifically, the use of Transformer models (as discussed in [
20]) allows for capturing long-term temporal dependencies in fuel cell operational data. This leads to a more accurate prediction of the State of Health (SoH) and enables optimized maintenance scheduling, which directly impacts the long-term TCO by extending the stack replacement interval.
By 31 December 2030, EU Member States must ensure that publicly accessible hydrogen recharging stations with a total capacity of at least 1 ton per day are located at least every 200 km along the core trans-European transport network. At least one charging station must be situated in each urban hub [
9].
Much of the research on hydrogen concentrates on the role of public transport. According to [
21], hydrogen can easily power passenger vehicles in urban areas. The study includes an assessment of the environmental, economic, and social benefits of deploying hydrogen technologies in city transport. One of the essential conditions for hydrogen transformation processes is energy from renewable and affordable sources. Combining these elements enhances the feasibility of using hydrogen as an alternative fuel. Additionally, restructuring mobility economies requires a shared decision-making process among consumers, politicians, and companies promoting such technologies [
22]. Although it is still in its early stages concerning electric mobility, discussion about the use of hydrogen vehicles is also beginning. Among the positive aspects noted by consumers, alongside reduced pollutant emissions, are the lower weight compared to electric cars [
23], as well as safety, stability, and rapid recharge times, estimated at 10 to 20 min, similar to conventional vehicles.
3. Research Methodology
3.1. Methodological Framework for Assessing Hydrogen Mobility in the Transport Sector of Bulgaria
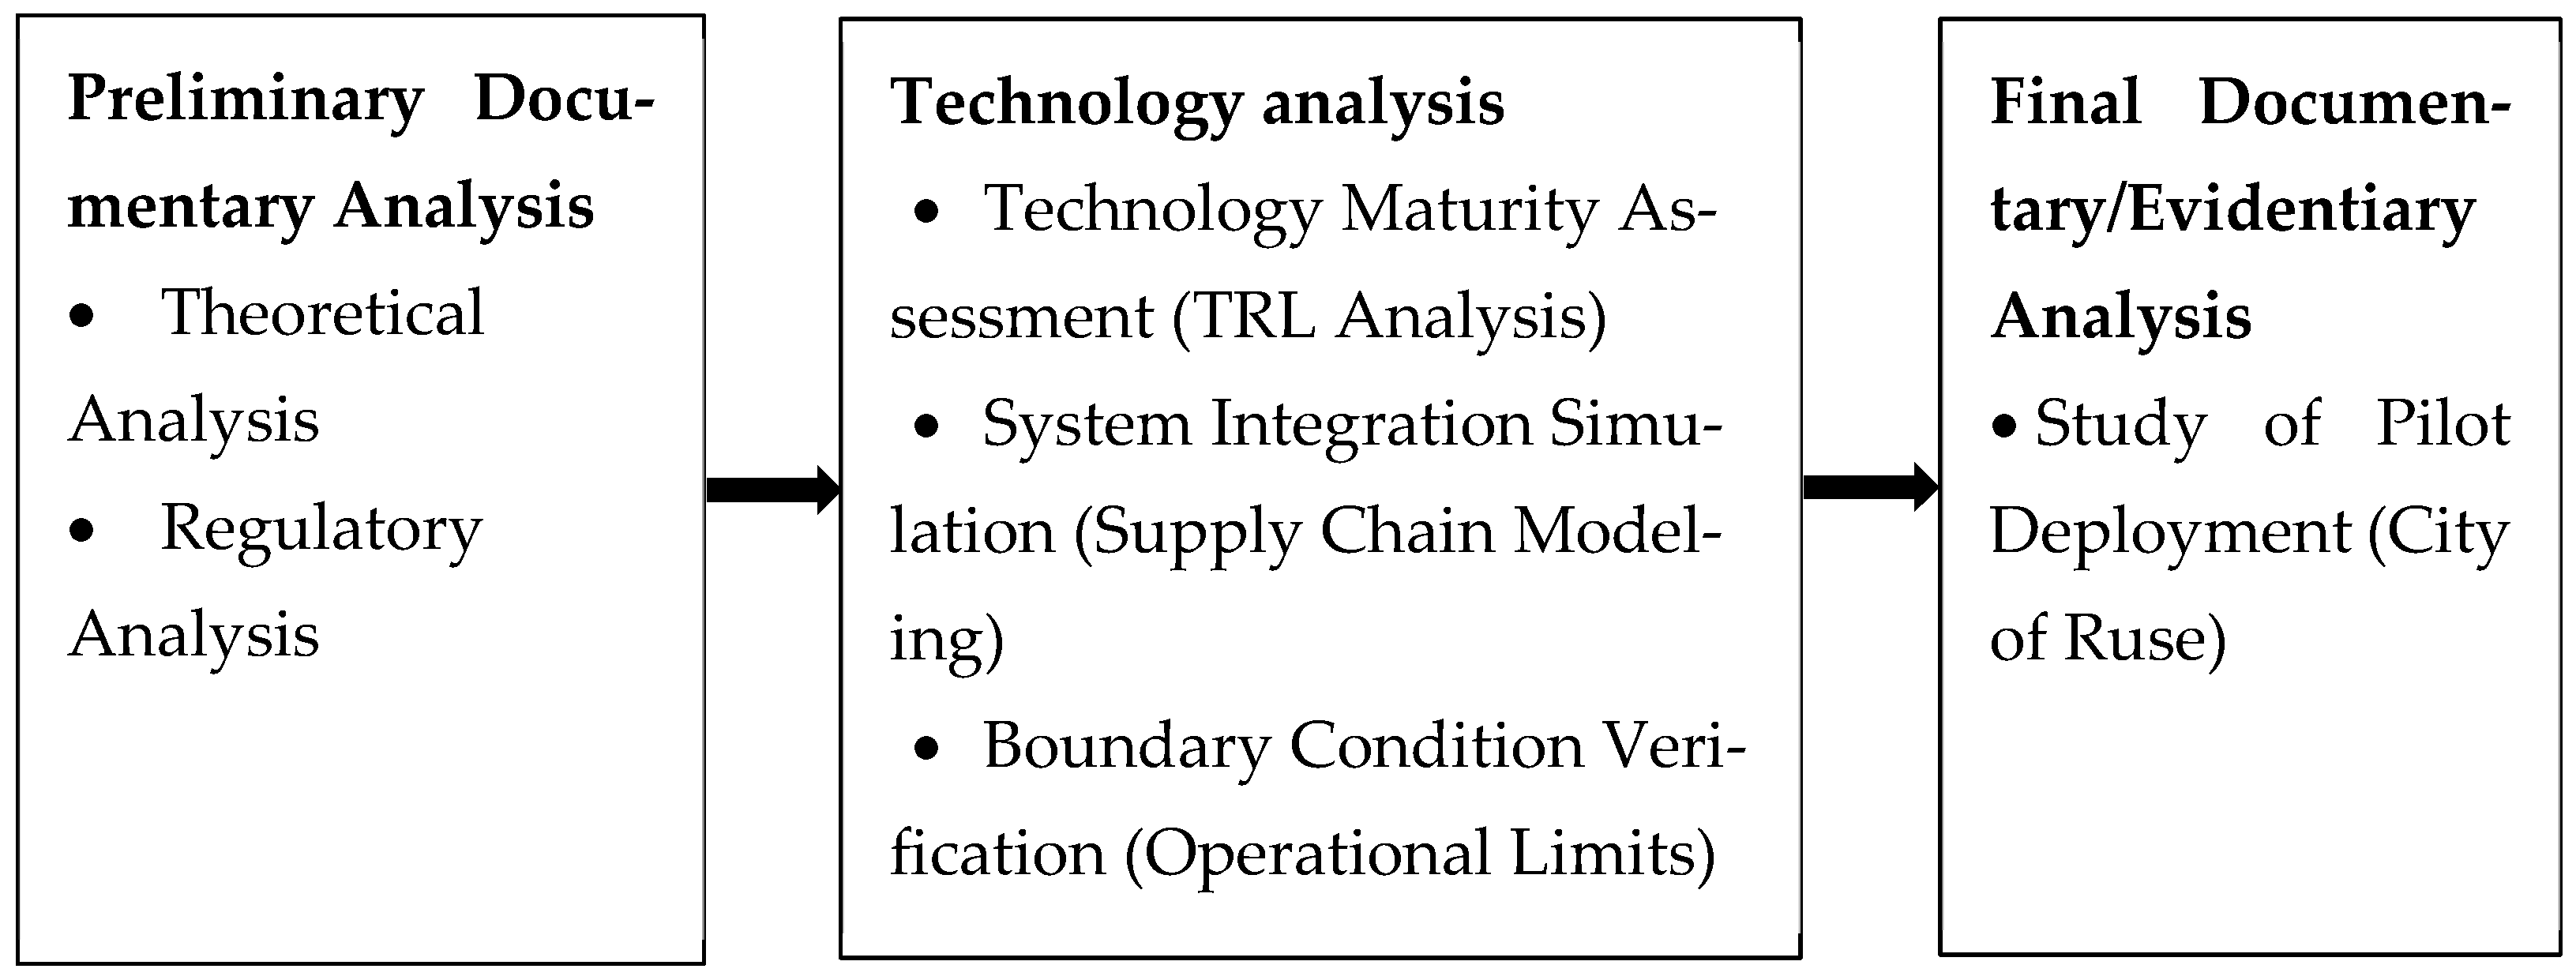
The study employs an integrated three-stage analytical approach. This method aims to provide a comprehensive assessment of the challenges, prospects, and opportunities for deploying hydrogen technologies in the transport sector. With objectives outlined in
Figure 1, the study is based on three analytical techniques: documentary review, technological analysis, and case studies. The methodology is designed to cover the entire life cycle of hydrogen infrastructure—from production and storage to actual operation in urban and river transport.
The documentary analysis stage involves a systematic review and critical examination of existing strategic documents and regulatory frameworks of the European Union and Bulgaria, along with the relevant scientific literature on energy, transport, and sustainable development. This analysis provides the theoretical and regulatory foundation for assessing hydrogen technologies and highlights the legal and strategic frameworks that affect their deployment.
The case study phase features the city of Ruse as a potential pilot center for hydrogen mobility. The city was selected because of its strategic geographical location and available transport infrastructure, the experience of the sole urban operator “Municipal Transport Ruse” EAD with innovations in public transport, the prospects for river transport, and the strong cooperation among the local administration, businesses, and scientific institutions. At this stage, the analysis involves a quantitative and qualitative assessment of the potential for deploying hydrogen technologies, identifying barriers and incentives for development, and scenario modeling of environmental impacts, costs, and transport efficiency.
The technological analysis explores the potential role of hydrogen in decarbonization and its applicability across various transport modes in Bulgaria. By examining current technological capabilities, infrastructure requirements, and energy system integration, the study identifies the most efficient and sustainable solutions for incorporating hydrogen into the national transport system. Furthermore, by synthesizing the three analytical approaches outlined in the methodology, practical recommendations are derived for effectively implementing hydrogen mobility in Bulgaria. These recommendations are grounded in real-world data, existing regulatory frameworks, and the technological feasibility of hydrogen-based transport solutions, ensuring both environmental benefits and economic viability [
23,
24].
The study combines technical analysis, policy review, and case study methods to evaluate hydrogen integration in urban transport. To ensure methodological rigor, key data sources, collection cycles, and verification methods are documented in
Appendix A—Data Collection Protocol. Electrolyzer efficiency measurements follow IEC 62282-3-100 [
25] ship conversion costs are itemized, and a triangulation approach combining policy documents, technical reports, and operator interviews is applied. The evaluation of micro-fuel cell power systems and portable modules follows the guidelines of IEC 62282-6-100 [
26] to ensure standardized performance metrics. These measures enhance the transparency, credibility, and reproducibility of the study.
The introduced three-dimensional model (policy–technology–geography) not only complements existing methods, such as LCA (Life Cycle Assessment) or TEA (Techno-Economic Analysis), but integrates them into the context of economies in transition. Traditional TEA models often ignore the logistical and geographical specifics of Eastern Europe, accepting the presence of a developed infrastructure. In this case, it is not so. In order to eliminate the need for long pipelines or expensive transport of hydrogen in the initial phase, hydrogen production (electrolyzer), its storage, and charging station are in close proximity to consumers, as they are located in the bus depot.
Table 4 compares the proposed 3D framework (policy–technology–geography) with traditional methods.
The 3D framework (policy–technology–geography) provides more complete information about the characteristics under consideration, taking into account the specifics of the region.
3.2. Methodological Major Barriers and Challenges Hindering the Deployment of Hydrogen-Powered Buses
In the Ruse case study, battery-electric buses face several operational constraints, including limited range on high-mileage lines (>300 km/day), long charging downtime incompatible with continuous service, increased vehicle mass reducing passenger capacity, and sensitivity to winter operating conditions. These factors motivated the consideration of hydrogen buses for specific operational niches rather than as a universal replacement.
Barriers are classified into four main categories: economic barriers (
Table 5), technological and infrastructural barriers (
Table 6), regulatory and institutional barriers (
Table 7), social and organizational barriers (
Table 8), and political and financial barriers (
Table 9).
The economic barrier is a function of capital expenditure
, operating costs
and public funding
where
are all physical and technological facilities necessary for the use of hydrogen vehicles;
is the connectivity and optimization of the various components of the system;
—Measures and standards for the safe operation of hydrogen vehicles and infrastructure.
where
is clarity of policies;
—norms, standards;
—governance/institutional framework.
where
Experience is the practical experience of operators and staff with new technologies (hydrogen buses, ships);
—the extent to which employees, the community and consumers are informed about hydrogen mobility, the benefits and risks;
Training—training of workers.
The scaling-up of hydrogen mobility in Bulgaria is constrained by several regulatory gaps, including the absence of a dedicated legal framework for hydrogen transport applications, unclear certification procedures for hydrogen refueling infrastructure and vessels, and the lack of operational support schemes linked to decarbonization performance. These gaps create uncertainty for municipalities and investors and limit the transition from pilot projects to commercial deployment.
where
is the coordination between the institutions (0–1, 0 = Full coordination, 1 = lack of coordination);
—Long-term financial predictability (0–1, 0 = Stable funding, 1 = Lack of predictability);
—Clarity of the sustainability of the criteria (0–1, 1 = Lack of methodology);
—Political stability/support (0–1, 1 = Strong instability).
3.3. Model of Total Cost of Owning a Hydrogen Bus
The TCO model includes
where
is the initial price for the purchase of the bus, €;
are the costs of infrastructure and preparation, €;
—operative expenses, €;
—training, safety and operating costs, €;
—administrative costs (insurance, taxes, licenses, fees), €;
—end-of-life costs (decommissioning, recycling), €.
Initial purchase price
where
is the number of hydrogen-powered buses purchased;
—single price, €.
Infrastructure and preparation
where
is the construction of a hydrogen charging station, €;
are the costs of tanks and compressors, €;
—Licenses, Projects, Safety, €;
—construction and logistics activities, €.
Operating expenses
where
is the annual energy consumption, €;
—Annual mileage (km);
—Price per kg H2 (€/kg). This price includes a combined value formed by energy from a solar plant and energy from the national grid. The trend is determined on an annual basis, averaged over the entire period;
—Consumption H2 (kg/km);
—Maintenance and technical inspections, €;
—Repairs, €;
—Asset depreciation, €;
—Number of years of operation.
Training and safety
where
is the number of employees (drivers, mechanics, operators);
—Tuition fee, €;
—Certification and safety measures, €.
Administrative costs
where
is asset insurance, €;
—Road and environmental taxes, €;
—Licenses, €;
—Other administrative fees, €.
End of life cycle
where
is dismantling, transporting, waste treatment, €;
—residual value from the sale/recycling of components (e.g., batteries, tanks, catalysts), €.
The model facilitates a quantitative comparison of hydrogen, diesel, and electric buses and functions as a tool to evaluate the project’s economic viability.
4. Case Study and Results
This section presents the results of the pilot project for the implementation of hydrogen mobility in the City of Ruse, structured in accordance with the methodological framework outlined in
Figure 1. Each analytical sub-stage corresponds directly to a specific methodological step and integrates regulatory, technical, economic, and operational evidence. This structured approach ensures internal consistency between the applied methods and the resulting case-specific findings.
Preliminary Documentary Analysis
Theoretical Analysis. Based on the existing literature and international best practices, hydrogen mobility offers significant environmental benefits by reducing CO2 emissions. Modeling the bus routes in Ruse indicates that hydrogen vehicles can cover the required daily distances without intermediate refueling.
Regulatory Analysis. The regulatory review confirms that Bulgarian legislation aligns with EU directives on hydrogen station safety and licensing. Key requirements include pressures of 350 and 700 bar, safety measures, and personnel certification. The project design strictly adheres to ISO 19880-1 [
27] for hydrogen refueling stations and ISO 15399 [
28] for gaseous hydrogen fuel station components. The available locations in Ruse allow safe deployment of stations within the urban infrastructure.
Technology Analysis
Table 10 presents technical parameters for hydrogen necessary for the implementation of the project.
Technology Maturity Assessment (TRL Analysis). This is the first and fundamental level that determines whether a technology is sufficiently developed for the purposes of the project. It uses the Technology Readiness Level (TRL) scale. For the purposes of hydrogen mobility in Ruse, the focus is on technologies with TRL 7–9, which includes a demonstration in a real environment and full operational deployment. The task is related to the transition from initial laboratory tests with a minimum TRL4 to the implementation of proven engineering applicability with TRL9. In this way, it is ensured that the selected components (electrolyzer, fuel cells and charging station) are not only theoretical prototypes, but commercially available solutions capable of withstanding the load of public transport.
System Integration Simulation (Supply Chain Modeling). Once the maturity of the technologies is confirmed, they move on to modeling how they interact within a closed ecosystem. This includes modeling the value chain ‘production-storage-distribution’. They simulate energy balances: how much solar energy from the photovoltaic park is needed to produce a unit of hydrogen, and how this amount corresponds to the daily mileage of the 20 buses in the city of Ruse. The simulation identifies critical points, such as the required buffer volume of hydrogen storage, to ensure the continuity of the transport process. As a result, an integrated energy transport system is obtained, which includes the individual technological units.
Boundary Condition Verification (Operational Limits). The last level checks the stability of the system in real, often extreme operating conditions, and strict technical indicators and operational limits are defined here. Quantitative thresholds for electrolyzer efficiency ≥70%, storage pressures of 350–700 bar are applied, and compliance with standards such as IEC 62282-6-100 and ISO 19880-1 is verified. In this way, the limits of safety and efficiency are established, which are related to the influence of temperature amplitudes in the region of Ruse on the loading speed and pressure in the hydrogen tanks. This is the final step in the implementation, which turns the simulation model into a concrete technical project for implementation.
When implementing the project, the following must be taken into account:
The main challenges that hydrogen vehicles need to solve are related to [
34]:
Integration challenges in hybrid systems. A major factor is the complexity of energy management in hybrid configurations involving a fuel cell and a battery in ships and buses. The most critical is optimizing the efficiency and extending the life cycle of components related to the distribution of power between the fuel cell and the battery package, due to the low performance and high cost of the fuel cell, which points to the search for more sustainable and low-cost solutions through new research.
Cold Start Problems. The challenges of starting hydrogen fuel cell systems (PEMFC) at low temperatures are particularly relevant to the climatic conditions in Bulgaria and the Ruse region. This requires policies in the country to support research in the field of adaptive management strategies to mitigate these effects.
Technical barriers to ship retrofit. In the retrofit of the Voyager ship, the challenges are related to the volumetric energy density of hydrogen compared to marine fuel. The need for vessels with larger volumes for storing hydrogen and the necessary safety zones on board the ship are major engineering limitations that require specific regulatory standards made of non-porous composite material and raise public awareness.
Policy framework for technological development. National policies are needed that focus not only on financial subsidies but also on the creation of specialized certification procedures for hybrid systems and support for innovation in vehicle energy management, as well as policies for recycling end-of-life systems.
Final Documentary/Evidentiary Analysis
Study of Pilot Deployment (City of Ruse). The pilot scenario includes the following:
- -
Deployment of two hydrogen stations covering the main routes;
- -
Training of personnel for safe operation;
- -
Monitoring of vehicle and infrastructure performance.
The results show that the project is technically and economically feasible and complies with regulatory requirements. The expected CO2 emission reduction is approximately 25% within the first year of pilot operation.
4.1. Case Study: City of Ruse
The city of Ruse is a key transport center with significant potential for a pilot project on hydrogen mobility. Its main advantages include access to renewable energy sources, such as photovoltaic parks, which can provide green hydrogen through water electrolysis. The city also possesses an existing transport system suitable for a pilot project involving 20 hydrogen buses and a mobile electrolysis plant (Ruse Municipality, 2024). Furthermore, there are opportunities to combine hydrogen transport with river transport by upgrading a cargo ship with a hybrid battery system (Port of Ruse, 2024). According to [
35], under the Union guidelines for the development of the TEN-T network, Ruse has been included in the list of urban nodes as of July 2024.
The project provides hydrogen production from electrolysis with a capacity of 700 kg H
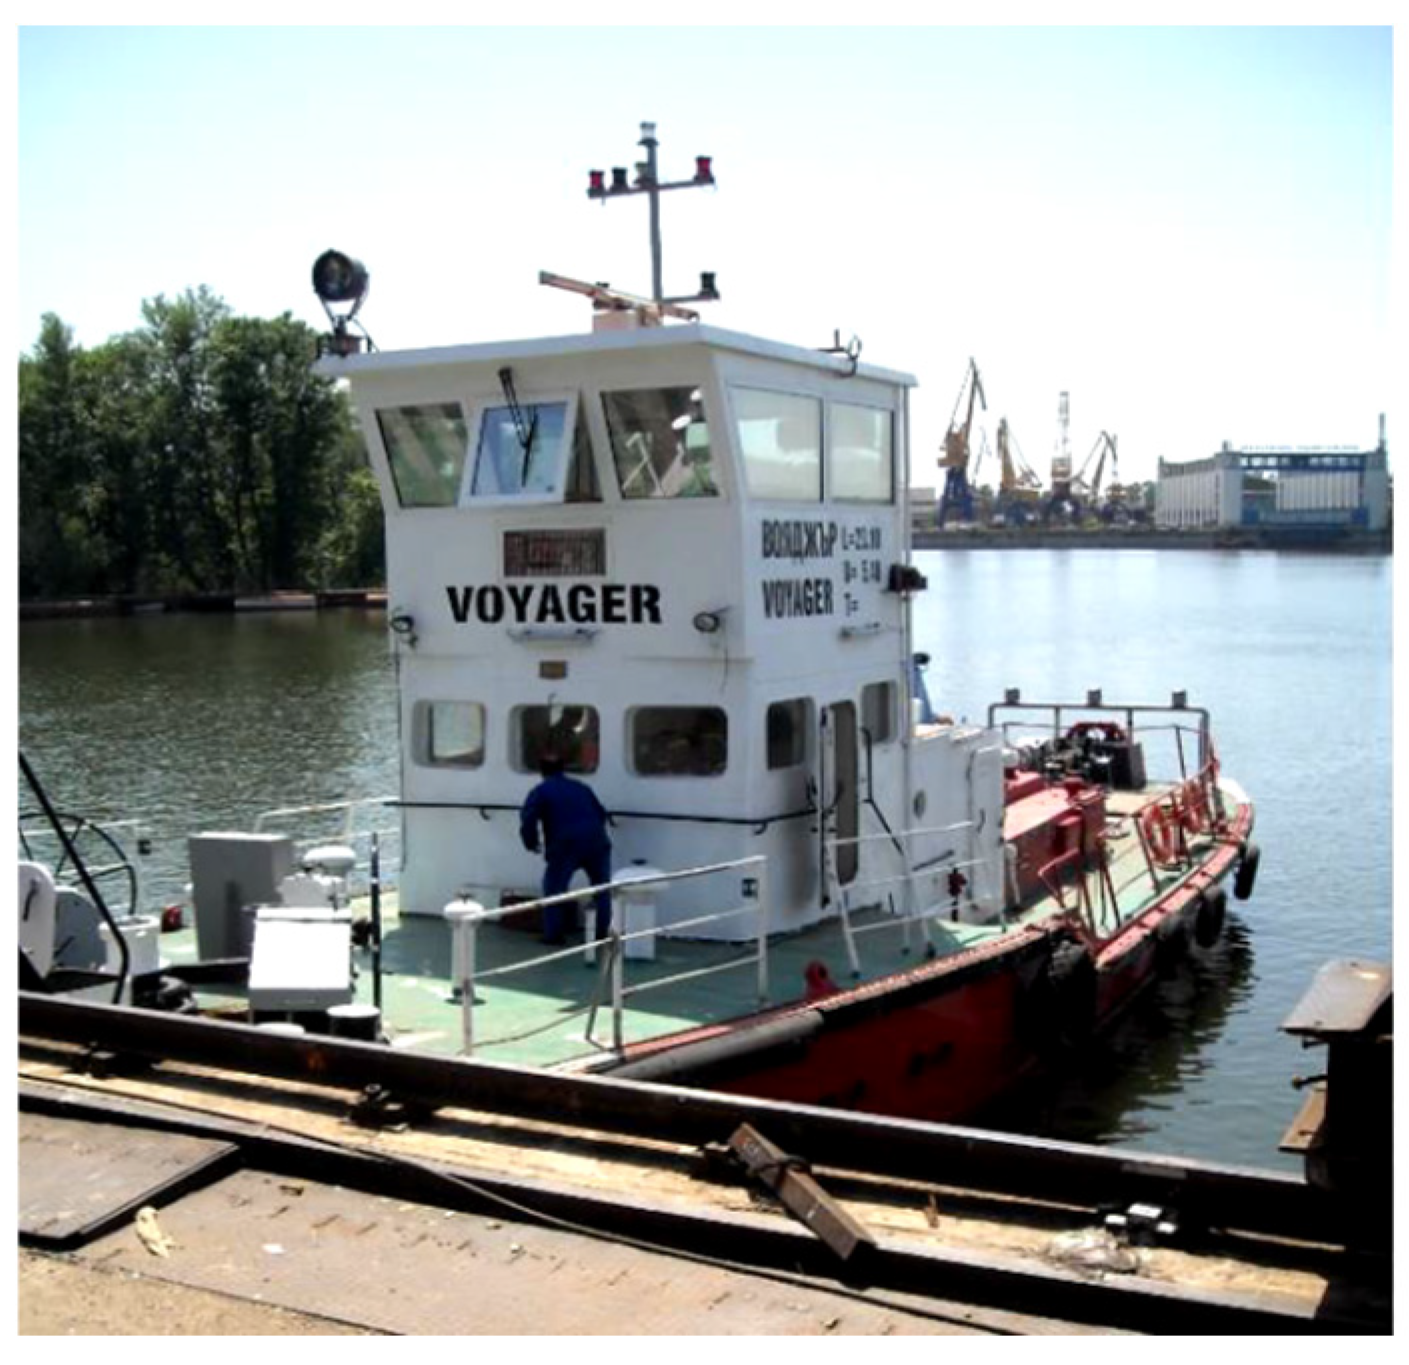
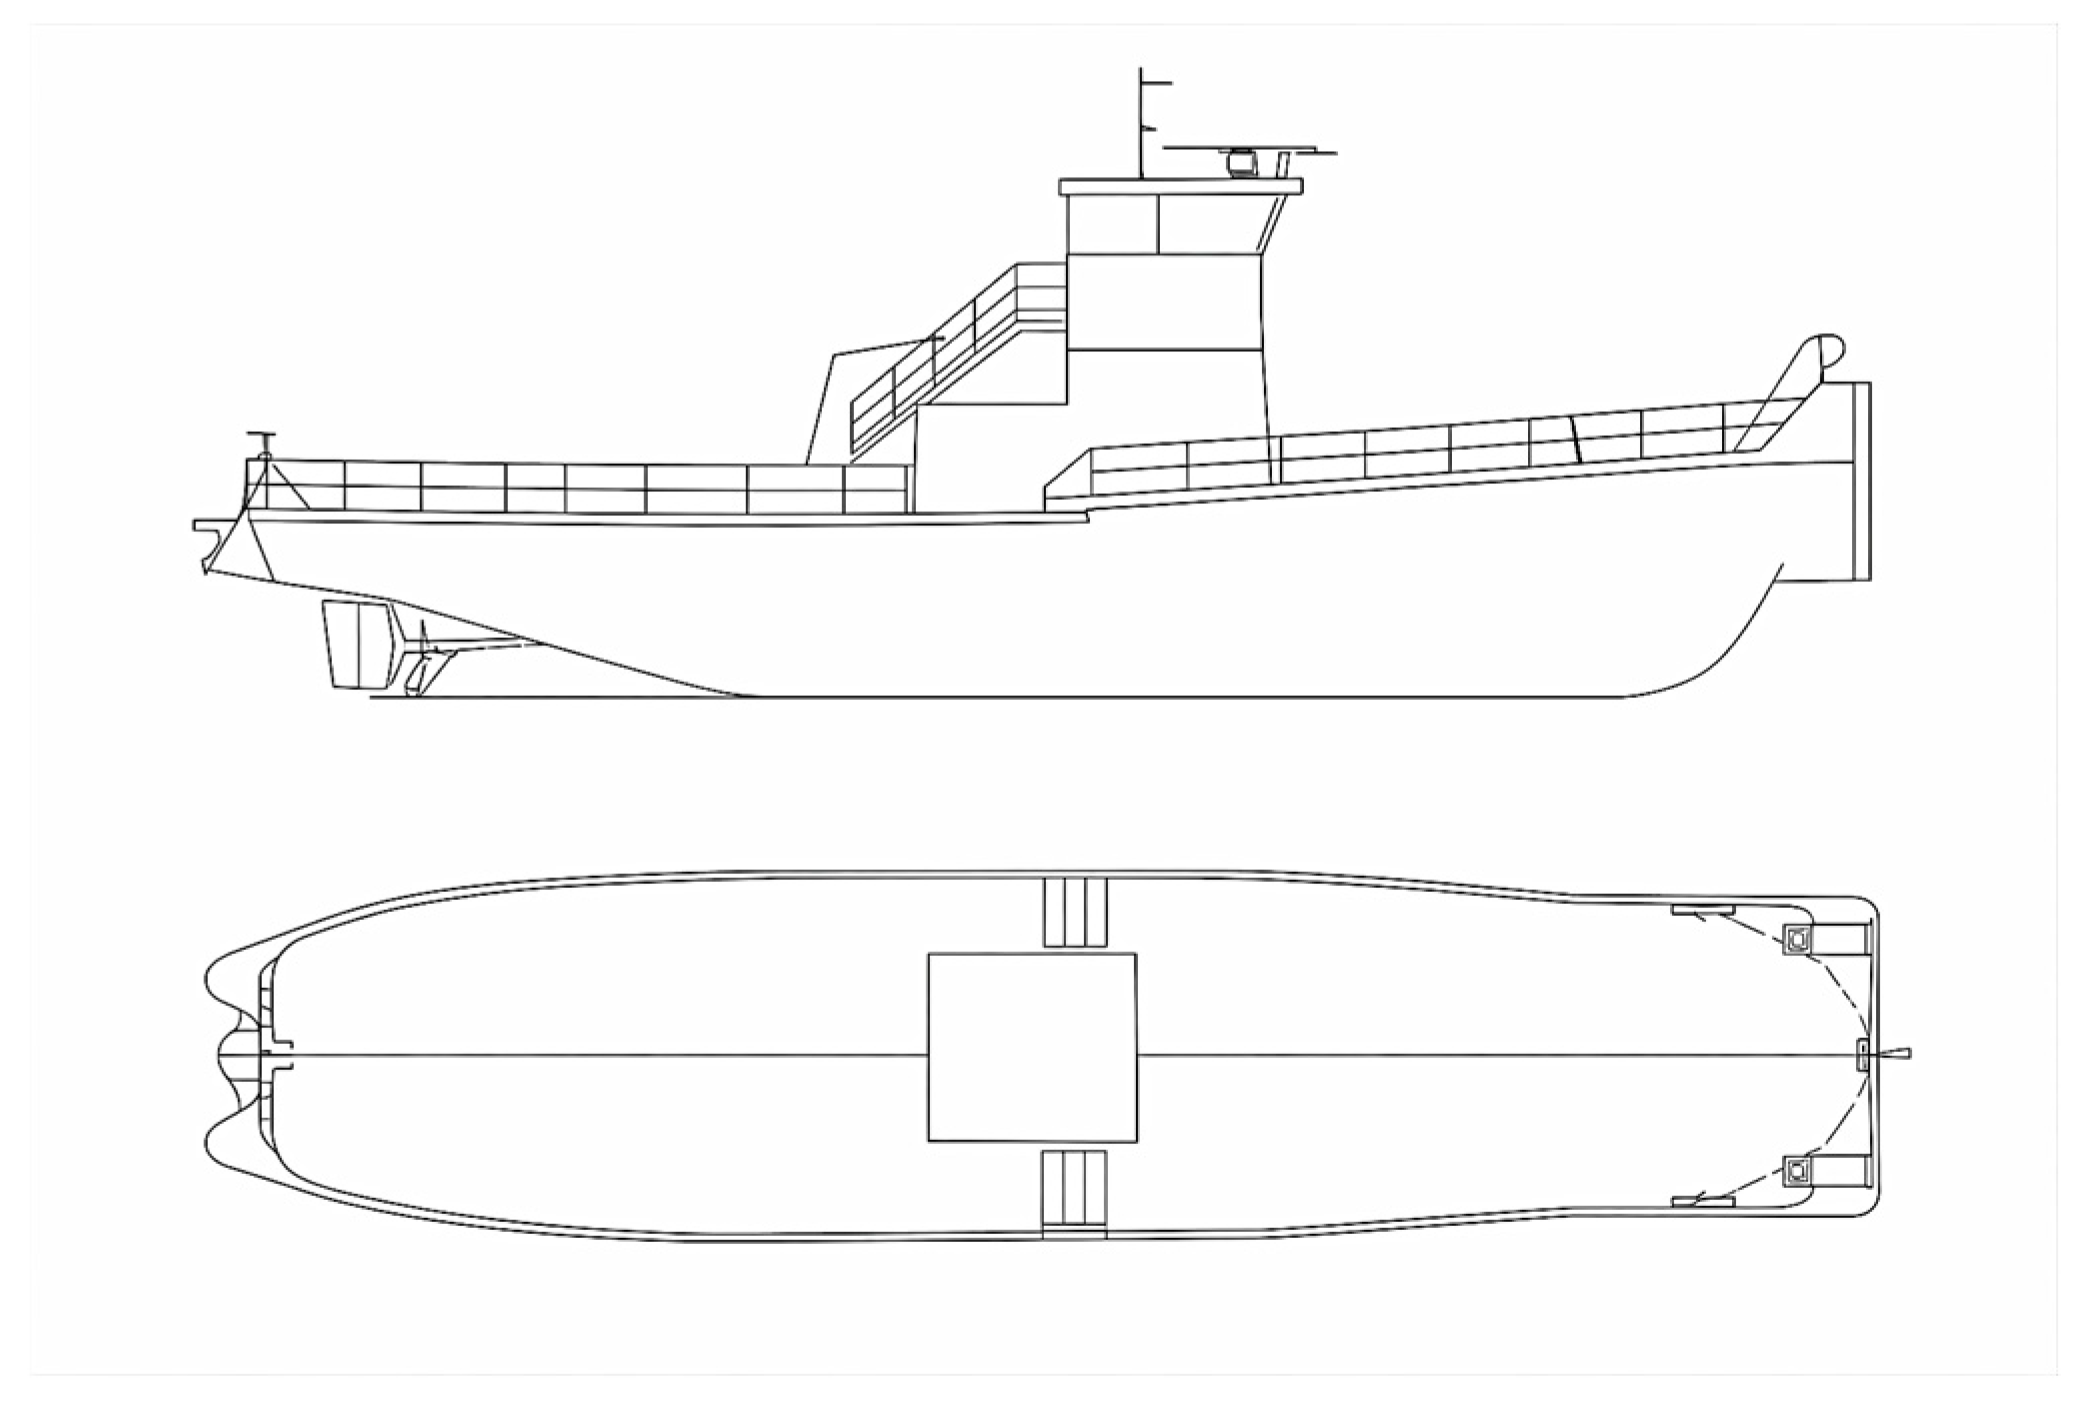
2/day, supplied by a 2 MW photovoltaic park. Hydrogen is stored in compressed tanks and dispensed through a charging station at 350 bars. The pilot includes 20 hydrogen buses intended to replace the currently used diesel buses. In addition, the project involves retrofitting the Voyager pusher ship with electric motors and hydrogen fuel cells, marking the initial step towards decarbonizing marine applications in the Danube region. The vessel, owned by Bulgarian River Navigation AD, is designed to push two barges of 1000 tons each or one barge of 2000 tons (
Figure 2 and
Figure 3).
Buses are charged directly at the hydrogen station, while the ship is refueled using mobile hydrogen containers transported by truck and semi-trailer. This integrated approach demonstrates a scalable model for hydrogen mobility in both urban and river transport systems.
Table 11 and
Table 12 present data on the selected ship, and the planned major changes in the modernization of the power transmission and propulsion system.
The main changes on the ship are indicated in
Table 5.
Beyond system integration and refueling logistics, vessel retrofitting introduces additional engineering constraints that are fundamentally different from those encountered in road transport. From an engineering perspective, the conversion of a river vessel to hydrogen fuel cell propulsion poses significant volumetric energy density challenges. Compressed hydrogen at 350 bar has a volumetric energy density approximately 4–6 times lower than marine diesel, requiring substantially larger storage volumes. This affects onboard layout, safety zoning, and payload capacity. Consequently, the Ruse vessel retrofit should be interpreted as a pilot-scale demonstration rather than a fully scalable solution for long-distance inland navigation. Nevertheless, inland navigation vessels with lower average speeds and predictable routes, such as Danube pushers, represent suitable candidates for early hydrogen demonstrations.
The total investment costs of the project amount to EUR 23,400,000 excluding VAT, distributed by individual components:
- -
Electrolyzer with photovoltaic park—8,000,000 €;
- -
Buses—11,070,000 €;
- -
Re-equipment of a ship—3,900,000 €;
- -
Other expenses—384,000 €.
To operationalize the concept of a regional hydrogen ecosystem, the electrolysis facility is conceived as a shared infrastructure element supplying both urban buses and river transport. The daily production capacity of 700 kg H2 has been dimensioned to meet aggregated demand, assuming priority refueling of urban buses due to fixed public service schedules. Hydrogen supply for the river vessel is organized via mobile containers and scheduled during off-peak hours, allowing flexible operation without compromising public transport reliability.
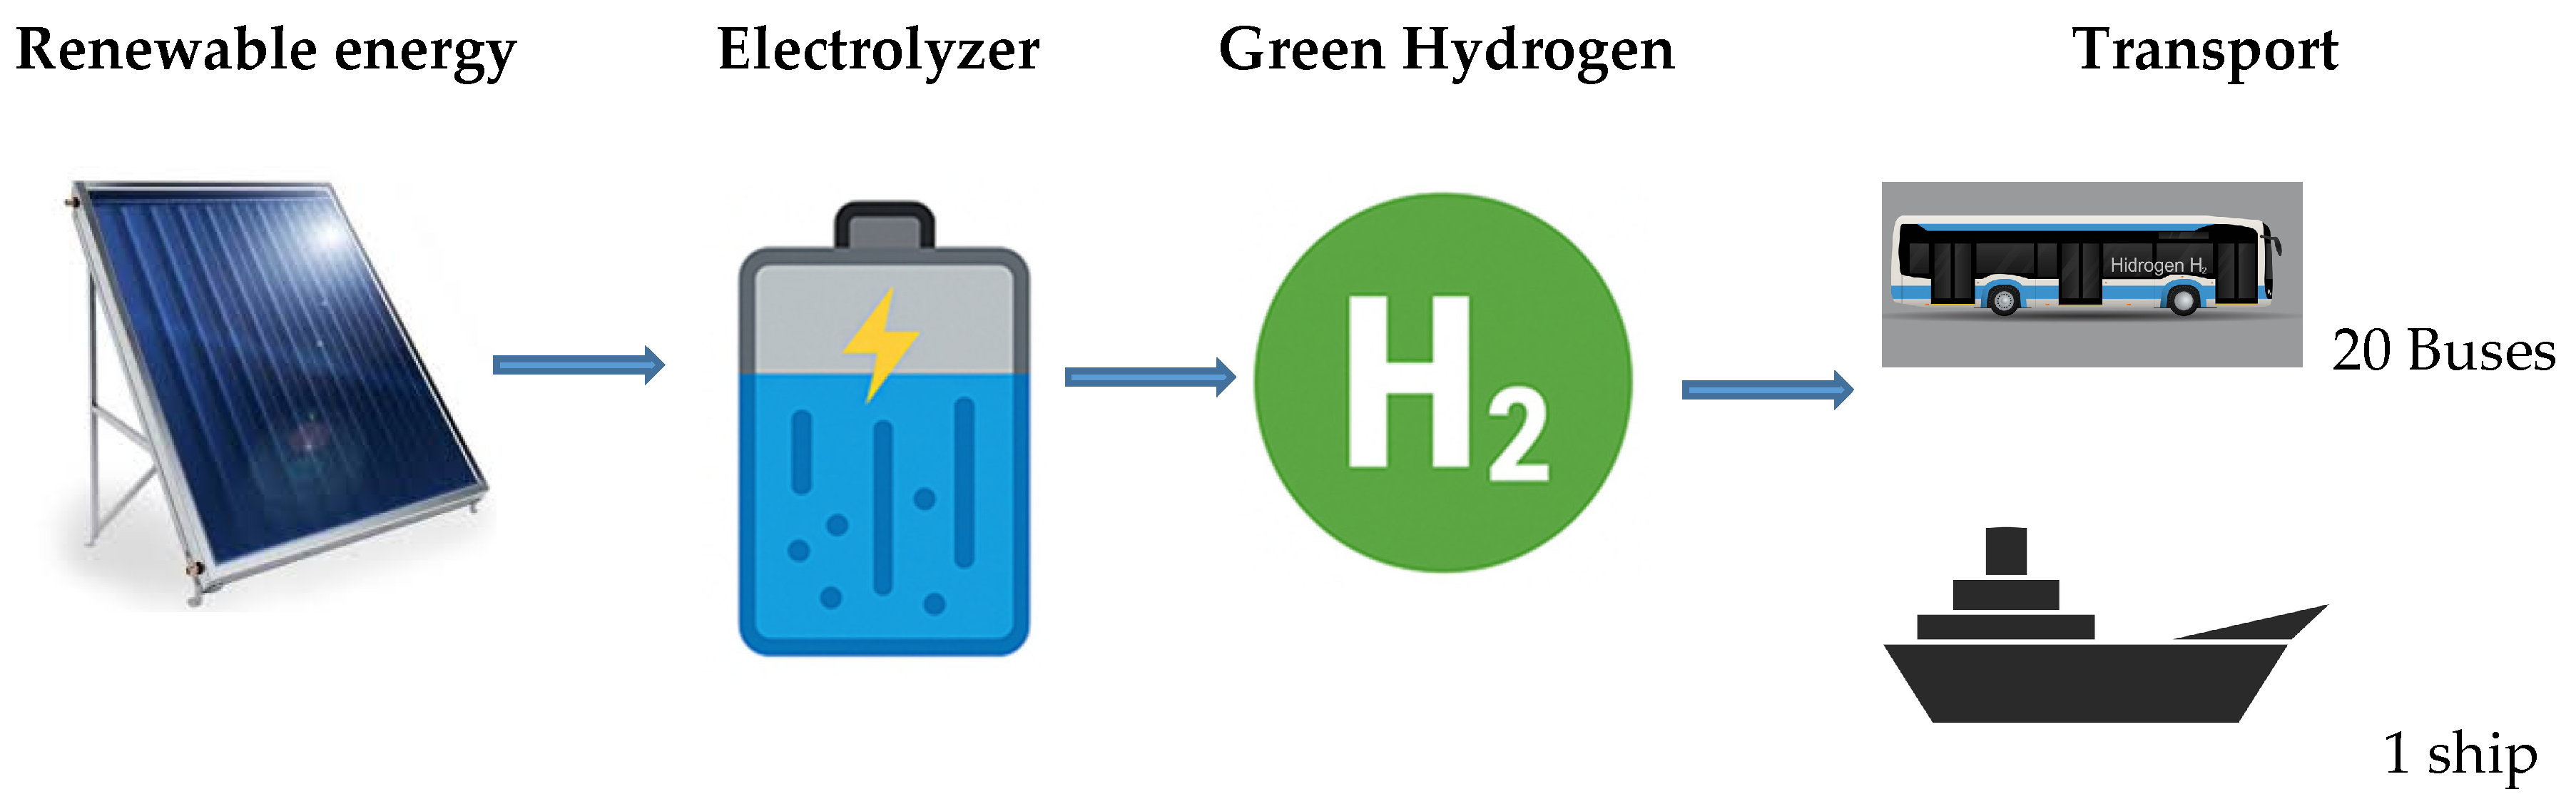
The life cycle of green hydrogen, from its production to its utilization in transport systems, is illustrated in
Figure 4.
The process of implementing hydrogen mobility in Ruse comprises four main stages, each crucial for ensuring a sustainable and efficient system.
The first stage, Renewable Energy, involves the generation of carbon-free electricity through sources such as solar panels. In the Ruse pilot project, photovoltaic parks supply electricity directly to the electrolyzer, ensuring that the hydrogen produced is derived entirely from renewable energy. This approach minimizes the carbon footprint of hydrogen production and supports the city’s objectives for sustainable urban transport.
The second stage, Electrolyzer, entails the splitting of water (H2O) into hydrogen (H2) and oxygen (O2) through the process of electrolysis. The hydrogen generated serves as a usable fuel for vehicles, while oxygen is released as a harmless by-product. The electrolyzer is the core technological component, determining the efficiency and volume of hydrogen production. In Ruse, the pilot uses an electrolyzer capable of producing 700 kg of hydrogen per day, matching the projected demand for the fleet of hydrogen buses.
The third stage, Green Hydrogen, focuses on the storage and management of the hydrogen produced. Hydrogen can be stored under high pressure in tanks or in liquefied form, depending on the operational requirements. Because the electricity used in the electrolyzer comes entirely from renewable sources, the hydrogen generated is classified as “green,” ensuring zero carbon emissions. When utilized in fuel cells, the only by-product released is water vapor, demonstrating the environmental benefits of this energy carrier.
The fourth stage, Transport, applies the hydrogen in buses and ships using fuel cells, which convert hydrogen back into electricity for propulsion. This stage allows for rapid refueling—typically between 10 and 20 min—while providing high mileage and zero local emissions. In Ruse, 20 hydrogen buses are integrated into the urban fleet, and the Voyager pusher ship is retrofitted with a hybrid hydrogen-electric propulsion system. This dual application showcases the versatility of hydrogen mobility for both land and river transport and provides practical insights for scaling similar solutions in other regions.
The Ruse pilot project highlights a set of interrelated challenges that are representative of the broader Bulgarian context. These challenges extend beyond technical feasibility and reflect systemic constraints affecting hydrogen mobility deployment at the national level. They can be grouped as follows:
- -
Economic barriers linked to high initial investments and operational costs for hydrogen buses and ships; the need for funding from the public sector and European programmes.
- -
Technological and infrastructural challenges for the optimal placement of charging stations, the integration of hydrogen production and storage, and logistics for ships.
- -
Regulatory and institutional issues related to the absence of a national strategy and regulatory incentives for the development of hydrogen mobility; limited experience among operators.
- -
Social and organizational—the need for staff training and preparing society for the adoption of new technologies and vehicles.
Based on the analysis, the following recommendations can be formulated:
Development of a National Strategy for Hydrogen Mobility with clear quantitative targets for stations and vehicles;
Support for pilot cities (Ruse, Varna, Plovdiv, Burgas) with the construction of hydrogen infrastructure and the deployment of fuel cell vehicles;
Creation of public–private partnerships for the production of green hydrogen, construction of stations;
Integrating hydrogen mobility into the National Transport Strategy 2030 and regional plans;
Promoting research, innovation and training programmes, including training for drivers and operators of hydrogen vehicles.
The project for the town of Ruse shows that successfully introducing hydrogen mobility requires a systematic approach to integrating transport infrastructure, hydrogen production, and logistics, as well as cooperation between academic institutions, municipal authorities, and industry. The pilot project demonstrates that, with proper planning and funding, hydrogen can cut emissions, create new jobs, and serve as a model for other cities in Bulgaria.
The project draws on the experience and expertise gained by the team at the University of Ruse under the National Scientific Programme “Low-Carbon Mobility for Transport and Household” (2018–2023), funded by the Ministry of Education and Science. The established scientific competence and strong partnerships with the Municipality of Ruse and the Association of Danube Municipalities “Danube” served as a foundation for developing a project idea for infrastructure for hydrogen refueling, the purchase of electric vehicles powered by fuel cells, and the re-equipment of a river vessel with a hybrid drive.
Impact of Seasonal Temperature Variations on PEM Fuel Cell Performance
In addition to infrastructural and operational constraints, regional climatic conditions introduce a further layer of technical uncertainty affecting fuel cell durability and performance. Temperature fluctuations affect electrochemical reaction rates, membrane hydration, and degradation mechanisms, leading to variations in fuel cell state-of-health (SoH). Recent studies have demonstrated that PEMFC degradation exhibits strong temperature sensitivity and that adaptive control strategies can effectively mitigate performance losses under variable thermal conditions [
36].
In the context of the Ruse case, these findings are directly applicable to both ship propulsion systems operating on the Danube and urban bus fleets exposed to seasonal extremes. The integration of thermal management systems and adaptive operating strategies is therefore a key prerequisite for ensuring reliable long-term operation of hydrogen-powered vehicles under regional climatic conditions.
4.2. Environmental Life Cycle Assessment (LCA)
While the pilot results demonstrate technical and economic feasibility under specific conditions, a comprehensive evaluation of hydrogen mobility requires assessment of its environmental performance across the full life cycle. The assessment adopts a screening LCA approach and considers multiple environmental indicators, including CO2 emissions, water consumption, and local air pollutants.
Hydrogen production via water electrolysis requires approximately 9 L of water per kilogram of hydrogen, which is explicitly accounted for in the analysis. While this represents an additional resource demand compared to conventional fuels, the localized nature of water use allows for context-specific mitigation measures, particularly in regions with sufficient water availability.
In addition, hydrogen fuel cell systems eliminate tailpipe emissions of nitrogen oxides (NOx) and particulate matter, offering significant benefits for urban air quality compared to diesel-powered buses. These reductions are particularly relevant in densely populated areas, such as the case study region.
The multi-pollutant LCA highlights that the environmental advantages of hydrogen extend beyond CO2 mitigation, while also revealing important trade-offs related to resource use, thereby providing a more comprehensive basis for sustainability-oriented transport planning.
4.3. Comparison of the Cost of Ownership of Different Bus Technologies in Ruse
Numerically justified TCO calculations and tables for comparison between diesel, battery-electric and hydrogen (FCEV) city bus, consistent with the typical operational parameters of the transport company “Municipal Transport Ruse” EAD (MTR), are obtained taking into account the initial parameters (
Table 13).
For easier summaries for TCO, initial investment, fuel/energy, and maintenance are reported (
Table 14).
The TCO calculations show a clear difference between the three technological options. Over 12 years and a distance of 720,000 km, the total cost of ownership for a diesel bus is €748,600, whereas for an electric bus it amounts to €808,400. The hydrogen bus remains the most capital-consuming choice with a TCO of €1,367,200 (assuming a green hydrogen price of €6/kg).
Operating costs for diesel and electric buses are the lowest and highest for hydrogen buses. The main cost factors are the price of hydrogen and the expenses involved in building a compression and charging station. When hydrogen is produced locally via an electrolyzer, hydrogen buses are nearing electric buses in total cost of ownership, but still fall behind.
The results confirm that hydrogen mobility can become cost-competitive after 2030, subject to substantial investments, subsidies, and a reduction in green hydrogen prices below €5/kg.
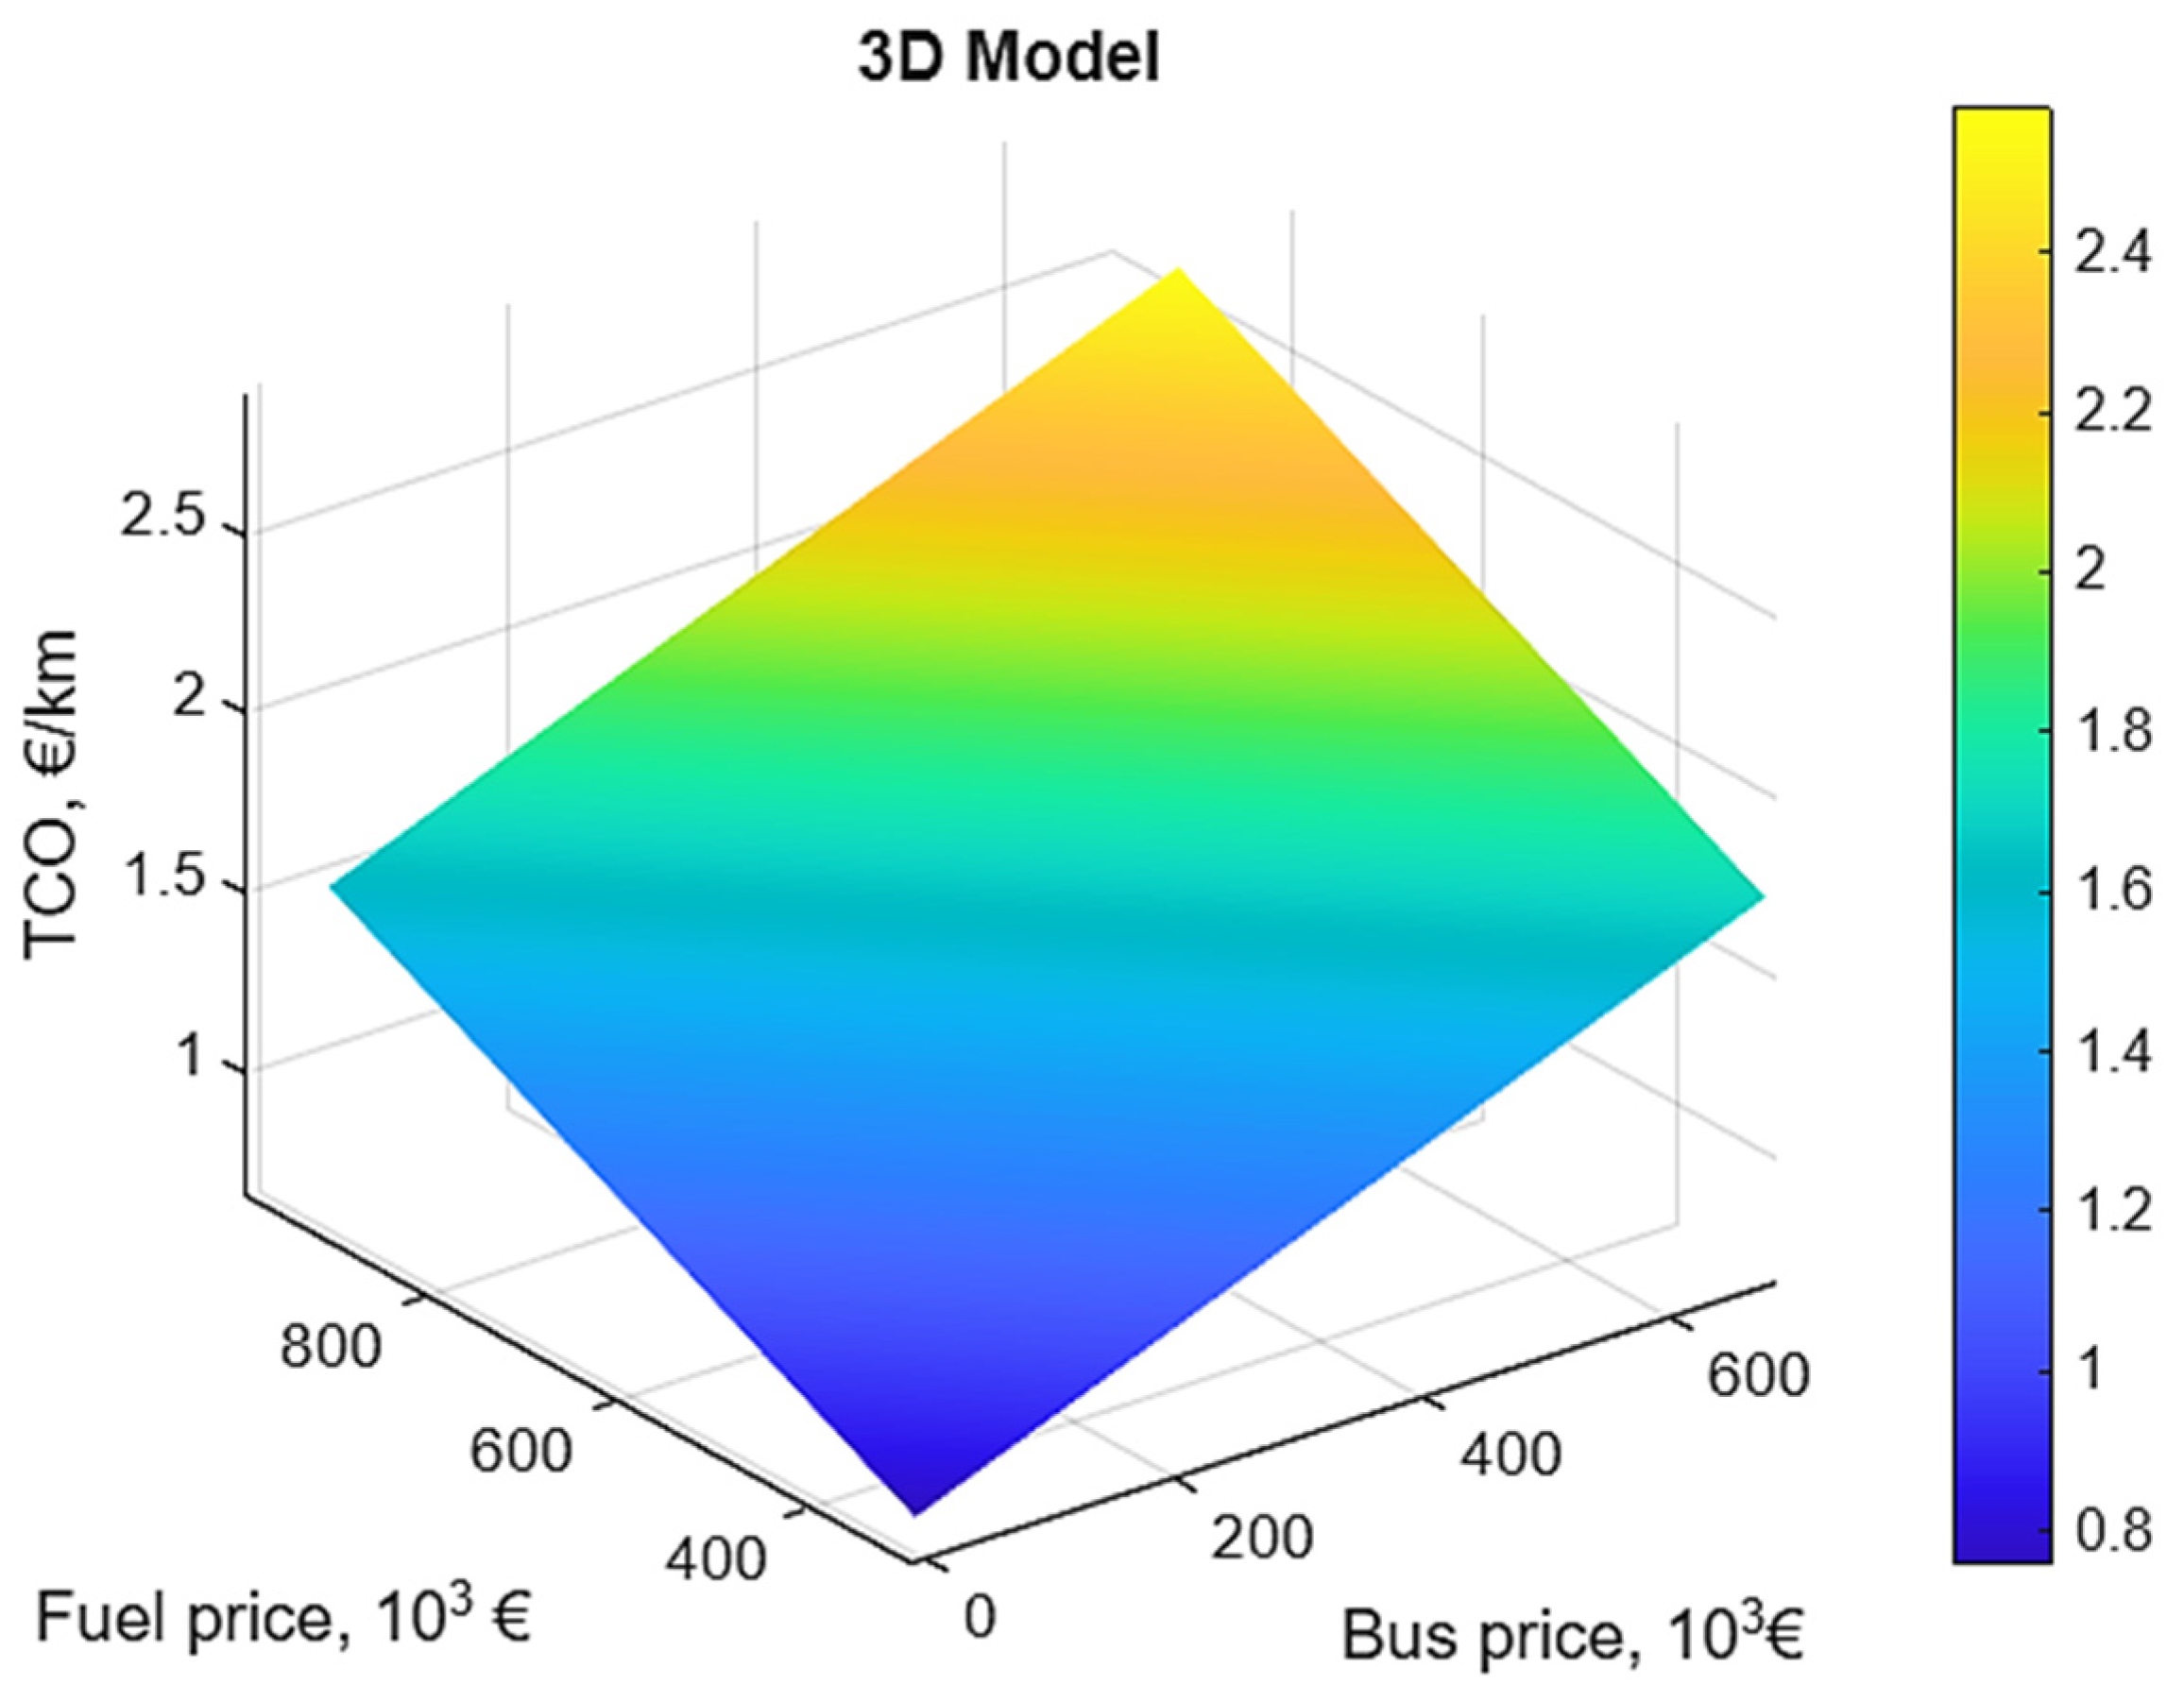
Figure 5 presents the change in TCO in euro/km with hydrogen costs changing from 5 to 15 euro/kg and a vehicle subsidy from zero to 100%. This allows a decision to be made on what costs to anticipate and what form of financing to implement the project proposal.
The forecasts highlight several factors expected to drive reductions in the overall cost of FCEVs. With increasing production volumes, the initial investment required for these vehicles is anticipated to decline. Simultaneously, the cost of green hydrogen is projected to decrease as mass production and infrastructure development advance. Maintenance expenses are also expected to be lower due to the enhanced reliability of components, the simplification of mechanical systems, and the adoption of standardized procedures. Furthermore, European and national green bus programmes, through mechanisms such as investment grants or tax incentives, provide direct support that positively influences the total cost of ownership. Lastly, improvements in energy efficiency, optimization of fuel cells and batteries, and integration with fleet energy management systems are expected to further reduce operating costs per kilometer.
4.3.1. Sensitivity Analysis and Scale Effects
To further enhance the economic assessment, Monte Carlo simulations were performed to evaluate the sensitivity of the TCO to variations in carbon pricing, ranging from €50 to €100 per ton of CO2. Each simulation sampled 10,000 scenarios, incorporating uncertainties in fuel costs, operational expenses, and carbon charges, providing a probabilistic distribution of TCO outcomes.
In addition, a learning curve analysis was applied to estimate the effect of fleet scale on hydrogen costs, capturing potential reductions in unit prices as the number of hydrogen buses increases. These analyses demonstrate how policy interventions and scale effects may influence the total cost of ownership, highlighting the conditions under which hydrogen buses could achieve greater cost-competitiveness.
These sensitivity results also form the basis for assessing the regional transferability of the Ruse case study.
4.3.2. Transferability and Regional Applicability of the Ruse Case Study
The Ruse pilot project is based on favorable geographical and infrastructural conditions, including proximity to the Danube River, access to photovoltaic generation, and the possibility of local hydrogen production. To assess the broader applicability of the proposed hydrogen mobility model, its transferability to inland and mountainous regions of Bulgaria was evaluated.
In mountainous regions (example: the city of Smolyan), where local hydrogen production and river transport are not available, hydrogen supply would rely on road transport using compressed hydrogen trailers. Incorporating additional logistics costs into the TCO framework indicates an increase in hydrogen fuel costs of approximately 15–30%, depending on transport distance and delivery frequency.
Topographical constraints, lower renewable energy potential, and limited infrastructure density further affect economic feasibility in mountainous areas. As a result, large-scale deployment of hydrogen buses in such regions is more sensitive to fleet size, hydrogen price volatility, and policy support mechanisms.
Therefore, the Ruse pilot model is considered transferable primarily to regions with access to hydrogen production facilities or economically viable hydrogen logistics chains, while deployment in remote inland regions should be limited to niche or fleet-specific applications unless additional infrastructure investments are undertaken.
4.3.3. Logistics Cost
Logistics cost analysis shows the following three advantages:
Location optimization. Through the geographical analysis of the city of Ruse and the choice of a production location close to end users, the construction of a distribution network is avoided;
Investment savings. The use of mobile hydrogen containers for refueling ships (instead of fixed shore infrastructure) can reduce the initial costs of specific port infrastructure compared to standard stationary solutions for river terminals. The distance from the production base to the port is 13.6 km and runs through the entire city. The use of a trailer with a capacity of 560–900 kg of hydrogen gas reduces the risk and saves time for the construction and commissioning of a hydrogen pipeline to the port;
Regional applicability. A new transferability analysis is included, showing that in mountainous and hilly regions (excluding local production), the cost of fuel rises by 10%, sometimes even more, due to logistical distances, proving the key role of the geographical module in reducing TCO.
4.4. Evaluation of European and National Strategic Documents
This sub-section evaluates the alignment of the Ruse hydrogen mobility pilot project with relevant European and Bulgarian strategic documents. The analysis considers both policy objectives and implementation targets for sustainable urban transport.
European Level: The project aligns with the EU Hydrogen Strategy (2020), which promotes the deployment of hydrogen for transport and the creation of hydrogen infrastructure networks across member states [
5]. The EU Green Deal also emphasizes zero-emission public transport, supporting the transition to hydrogen buses in urban areas.
National Level: According to Bulgaria’s National Energy and Climate Plan (NECP) 2021–2030 [
26,
38] and the Sustainable Urban Mobility (2020), hydrogen technologies are explicitly mentioned as key solutions for decarbonizing public transport fleets [
39]. The Ruse pilot project contributes to these targets by introducing hydrogen buses and a pilot refueling station, serving as a model for broader national deployment.
Analysis: By integrating hydrogen buses into the Ruse fleet and establishing a refueling station, the project supports the achievement of both European and national sustainability goals. The feasibility study confirms that the pilot implementation is compliant with regulatory and strategic requirements, providing practical insights for future scale-up.
4.5. Future Research Directions: Predictive Monitoring of Fuel Cell Performance
The limitations identified in the pilot-scale implementation, particularly regarding durability and long-term system behavior, naturally point towards the need for advanced predictive monitoring approaches. Transformer-based predictive models can be applied to operational data from hydrogen buses and retrofitted river vessels to forecast degradation trends. Such predictive monitoring would inform maintenance scheduling, life-cycle optimization, and validation of the pilot results under real operational conditions, providing a robust framework for scaling hydrogen mobility in transitional economies.
4.6. Technology Roadmap and TRL Evolution
At this stage, hydrogen buses still have a high price, and this is proven both by the obtained TCO values and by the hydrogen buses implemented in operation in Germany, Great Britain, Japan and other countries. All these projects are financed by projects and supported by state policies. For Bulgaria, financing is provided for in the National Recovery and Resilience Plan. At this stage, there are still no programs in the country under which to apply for financing. At the same time, the company “Municipal Transport Ruse” relies entirely on financing under this plan and from the state. Regarding the ship “Voyager” of the private Bulgarian company, the re-equipment is expected to be fully financed with project funds. For the company, this is an expensive innovation, and it agrees to participate in the project by providing the ship for re-equipment and then bearing the operating costs.
The IPCEI Hy2Tech model for public–private partnership shows that it is possible to use state aid for innovative projects that exceed the usual market levels of risk and attract private investment in charging infrastructure [
33]. This is an issue that is currently being considered and has not yet been resolved. Steps were taken to partner with the company “Bulgaria Glass”, Targovishte, but they purchased electrolyzers and produce the necessary hydrogen for the glass production process themselves. Therefore, this issue remains open for a further period.
In Bulgaria, it is still difficult to outline the stages for the transition from a pilot project to national implementation. However, taking into account the provisions of the National Recovery and Resilience Plan, the following can be outlined, which will provide a clearer vision of the practical steps in the implementation of the hydrogen strategy in Bulgaria:
Short-term plan (until 2027): Construction of infrastructure under the NRW and adoption of safety and certification standards;
Medium-term plan (until 2030): Construction of charging stations along the TEN-T corridors (every 200 km) in accordance with Regulation (EU) 2023/1804 [
40];
Long-term plan (after 2030): Achieving economic viability (TCO parity) and scaling up hydrogen mobility in river and heavy goods transport.
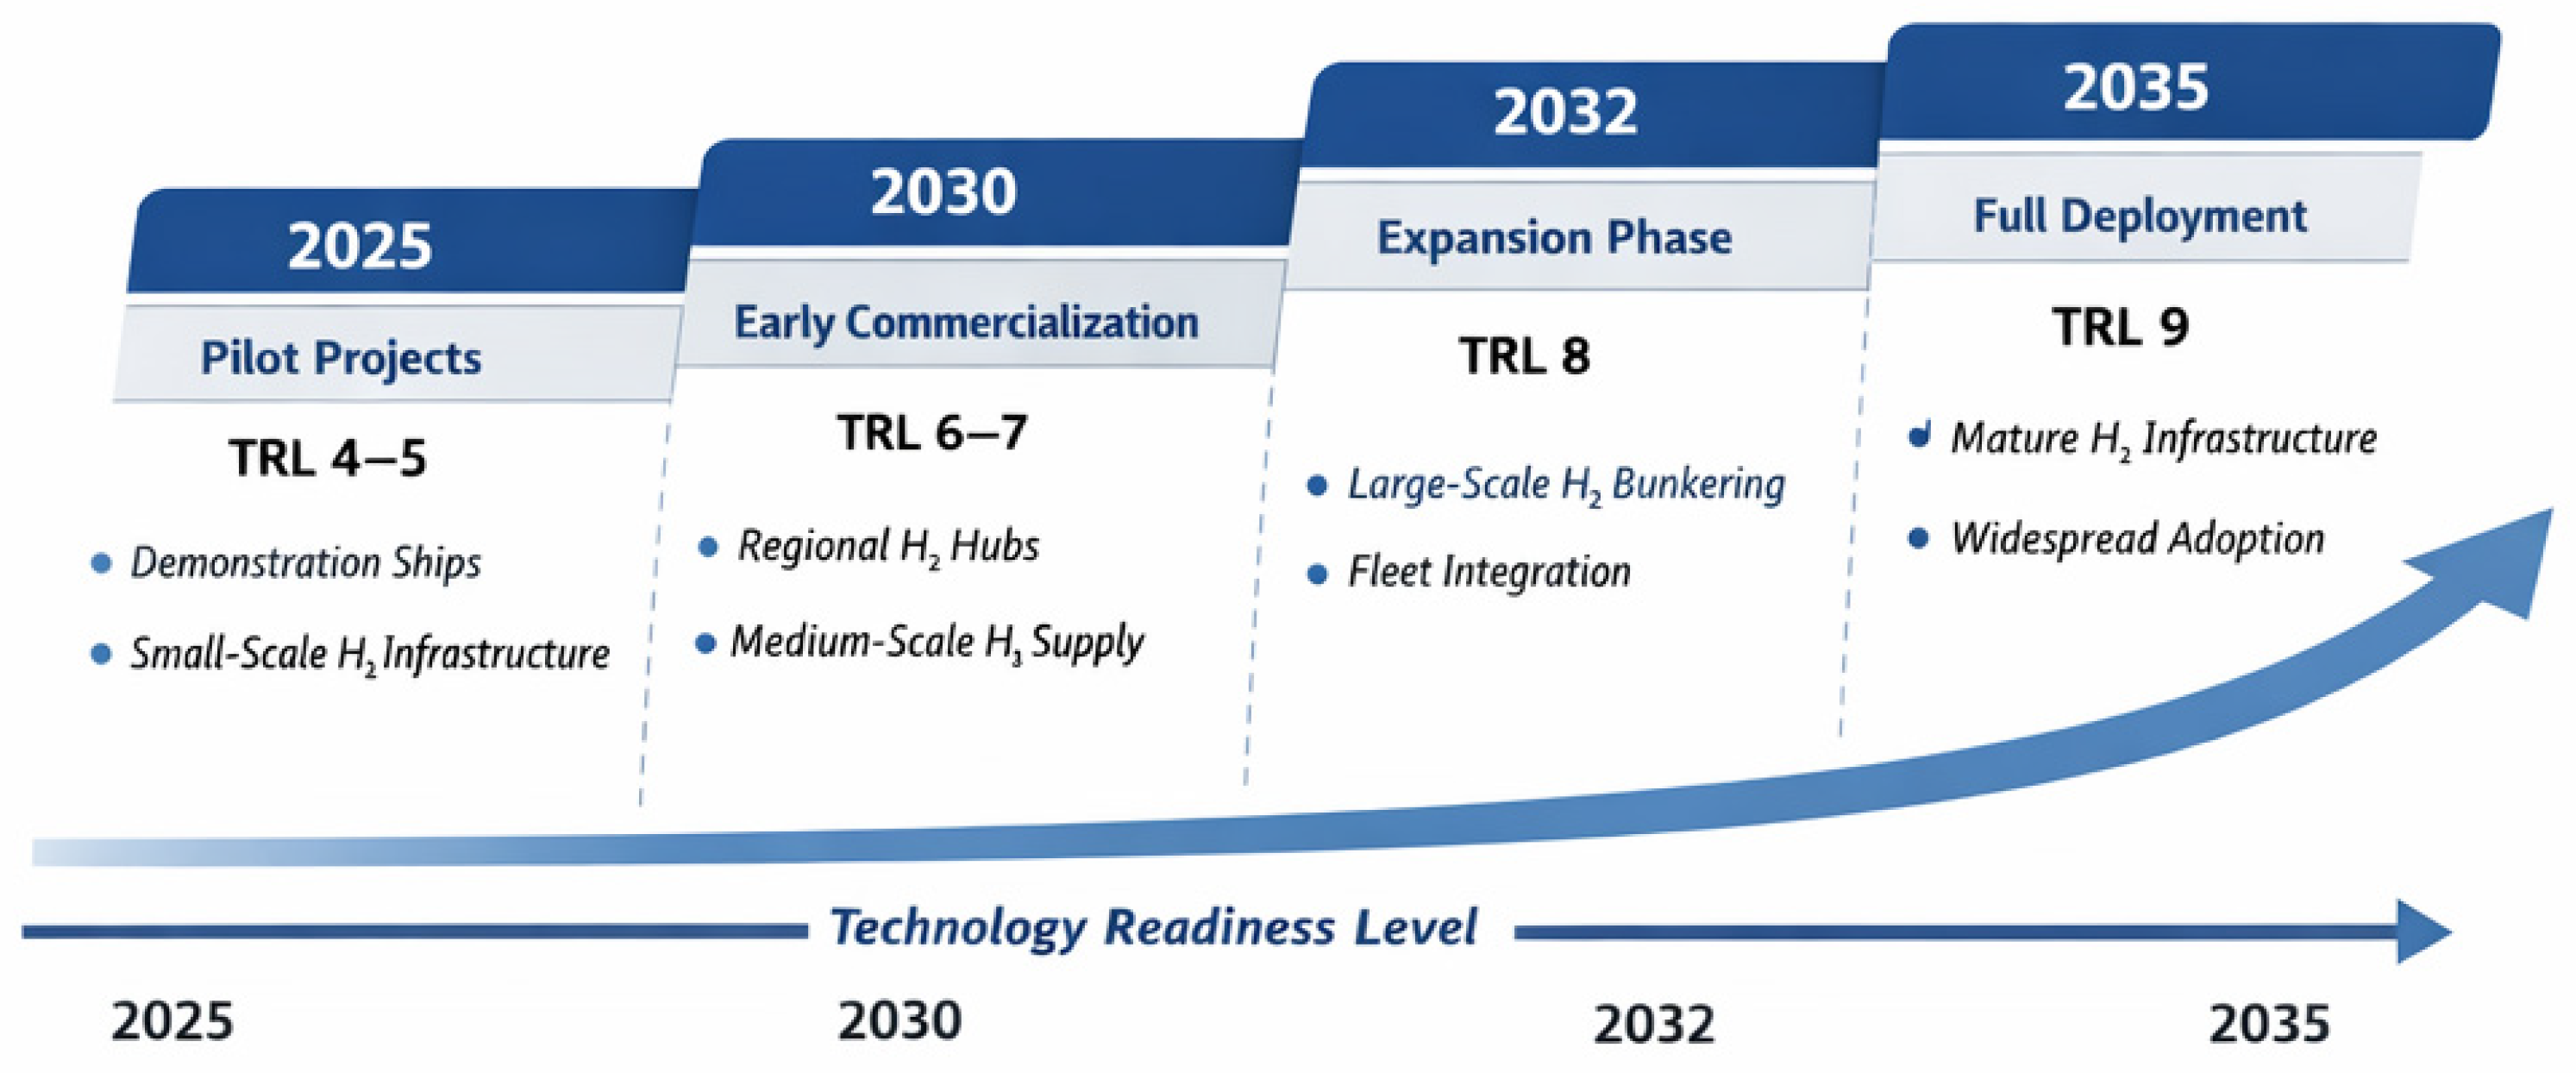
To address the phased deployment of the proposed regional hydrogen ecosystem, a structured technology roadmap aligned with Technology Readiness Level (TRL) evolution is introduced for the period 2025–2035. The roadmap defines sequential development stages for hydrogen production, infrastructure, and transport applications, ensuring technical feasibility under regional constraints.
In the short-term phase (2025–2026), the system operates at TRL 4–5, focusing on pilot-scale deployment of hydrogen buses and river vessels, limited refueling infrastructure, and small-scale electrolyzers primarily coupled with photovoltaic generation. This phase emphasizes operational validation, safety assessment, and data acquisition (
Figure 6).
The mid-term phase (2027–2030) targets TRL 6-7 and involves infrastructure expansion, increased electrolyzer capacity, and partial fleet scaling. During this stage, hydrogen production is progressively coupled with both photovoltaic and wind energy sources. Grid interaction effects, including renewable intermittency and power fluctuations, are explicitly considered as constraints influencing electrolyzer utilization and hydrogen output stability.
In the long-term phase (2030–2032), the ecosystem advances towards TRL 8 and (2032–2035) TRL 9, enabling near-commercial operation. This phase includes full integration of hydrogen refueling stations into regional transport networks and optimization of hydrogen production scheduling in response to grid variability.
The coupling between renewable energy resources and hydrogen production facilities is analyzed using the REMAP framework, allowing assessment of system resilience under fluctuating power supply conditions. This approach supports adaptive infrastructure planning and enhances the robustness of the proposed regional hydrogen ecosystem.
By combining phased TRL evolution with system-level modeling of renewable coupling and grid interaction, the proposed roadmap provides a structured pathway from experimental deployment towards scalable hydrogen mobility solutions.