1. Introduction
With the accelerating global transition toward low-carbon development, countries worldwide have placed increasing emphasis on sustainable growth, and the rapid expansion of the EV industry has become a key manifestation of this trend. According to estimates from the China Automotive Technology and Research Center, by 2050, the market penetration rate of EVs in China will reach 70%, with a total charging load of approximately 330 million kW [
1,
2]. However, behind this massive demand lies a series of pressing challenges that must be addressed.
From the user perspective, most EV owners exhibit relatively fixed charging habits, typically choosing to charge during working hours or immediately after work. This limited flexibility restricts temporal load balancing. At the same time, under the prevailing time-of-use (TOU) electricity pricing mechanism, substantial price differences exist between peak and off-peak periods. Users who charge during peak-price intervals not only face significantly higher personal charging costs but also experience reduced economic benefits and diminished satisfaction toward EVs [
3,
4].
From the power grid perspective, large-scale uncoordinated charging imposes considerable stress on the distribution network. During load peaks, massive simultaneous charging can lead to rapid load escalation, resulting in voltage fluctuations, frequency deviations, and deterioration of power quality, ultimately jeopardizing grid stability and the reliability of electricity supply for both residential and industrial users. Moreover, uncoordinated charging exacerbates energy inefficiency [
5]; during off-peak hours, part of the electricity supply remains underutilized, leading to unnecessary energy waste. Consequently, guiding EV users to schedule charging sessions rationally—achieving orderly charging—has become a crucial issue for balancing user costs, ensuring grid reliability, and promoting sustainable low-carbon development [
6].
Existing studies indicate that user-side orderly-charging strategies mainly focus on cost optimization and load balancing through TOU-based incentives and user satisfaction modeling. References [
7,
8,
9] develop user response models with cost-minimization objectives, enabling participation through dynamic pricing guidance. References [
10,
11,
12] further construct user satisfaction functions and bi-level optimization frameworks to jointly optimize load fluctuations and user experience. References [
13,
14] employ the Particle Swarm Optimization (PSO) algorithm to optimize TOU price allocation, encouraging users to develop more rational charging habits while reducing costs and flattening load curves. References [
15,
16] introduce multi-objective optimization and station-selection strategies to improve both user satisfaction and grid stability. However, these studies often overlook scenario heterogeneity and user diversity—with different user groups exhibiting distinct charging behaviors and time preferences—resulting in limited generalizability and responsiveness of the proposed models. Previous methods primarily focused on user cost optimization and proposed effective orderly-charging strategies. However, in real-world scenarios, charging zones are multifunctional, encompassing residential, industrial, and office areas. Users span private cars, taxis, official vehicles, and logistics vehicles, making single-type analyses insufficient to reflect the complexity of actual environments. This leads to suboptimal user response and limited applicability of the optimization.
Moreover, the diversity in user charging behavior and the complexity of multi-zone charging environments undoubtedly increases the uncertainty of high-dimensional states and dynamic factors for EVs. This results in computational bottlenecks for traditional optimization algorithms in large-scale multi-zone charging scenarios. The adoption of advanced methodologies like deep reinforcement learning (DRL) has shown promise in overcoming these challenges, offering more robust solutions for handling diverse charging demands and optimizing the overall system performance [
17,
18]. In contrast, DRL enables autonomous learning of optimal policies through continuous interaction with the environment, offering strong generalization ability, long-term reward optimization, and robust handling of nonlinear and multi-objective coupling problems [
19,
20]. As a result, DRL has become a promising approach for EV orderly-charging optimization [
21]. Recent studies have applied DRL to various aspects of EV charging management. Reference [
22] integrates charging scheduling and pricing strategies using reinforcement learning frameworks to enhance facility profitability. References [
23,
24] applies DRL to guide grid-connected charging and discharging, effectively accommodating renewable energy generation. References [
25,
26,
27] propose a multi-agent autonomous–cooperative DRL algorithm to balance individual and collective objectives across time-varying environments, forming an adaptive global decision policy.
Existing studies exhibit several critical limitations. First, most charging models overlook regional functional attributes, vehicle classifications, and user heterogeneity, resulting in poor adaptability to complex real-world charging scenarios. Second, conventional optimization algorithms often face computational bottlenecks in large-scale multi-district charging environments, which hinder real-time dynamic decision-making. Moreover, current research has not yet developed accurate forecasting or effective scheduling algorithms capable of managing charging loads for a single substation under multiple operating conditions.
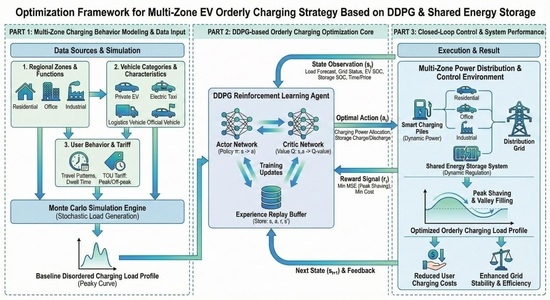
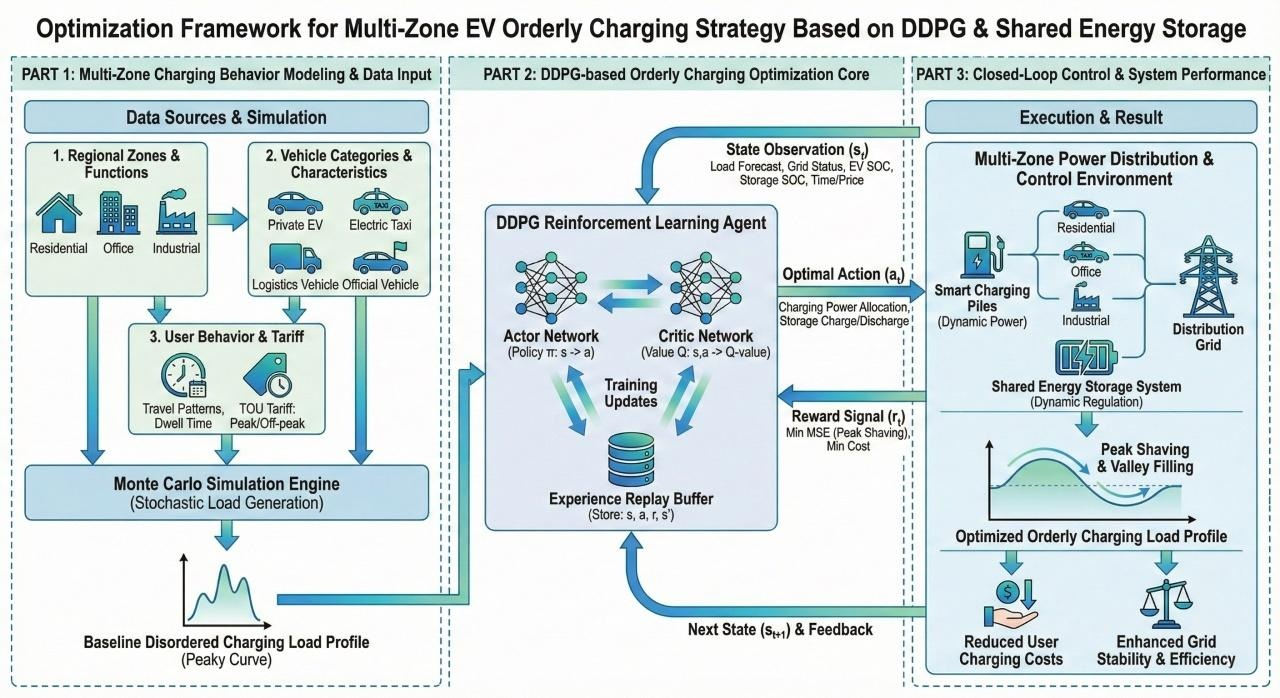
To address these challenges, this study proposes an orderly multi-district charging strategy based on the DDPG algorithm.
A differentiated charging model is constructed by integrating multi-dimensional features of regions, vehicles, and users, ensuring that the optimization process accurately reflects diverse charging demands.
With the DQN algorithm serving as the decision-making core, the DDPG algorithm is innovatively introduced to overcome computational limitations of traditional scheduling. Leveraging the critic network for value evaluation, the delayed policy-update mechanism for stability, and the target-policy smoothing mechanism for guided exploration, the method efficiently adapts to continuous action spaces while satisfying multi-constraint optimization requirements achieving both decision-making optimality and execution efficiency.
A closed-loop cooperative control framework of “load forecasting–energy storage fine-tuning–power allocation” is established. Accurate load forecasting is first achieved through the differentiated model; shared energy storage then mitigates power fluctuations via off-peak charging and peak discharging; finally, dynamic charging-power allocation is executed through DDPG, forming a complete control loop.
This framework simultaneously enhances distribution network operational efficiency and user charging experience, achieving a dual improvement in system performance and user satisfaction.
2. EV Charging Model
2.1. Vehicle Travel Analysis
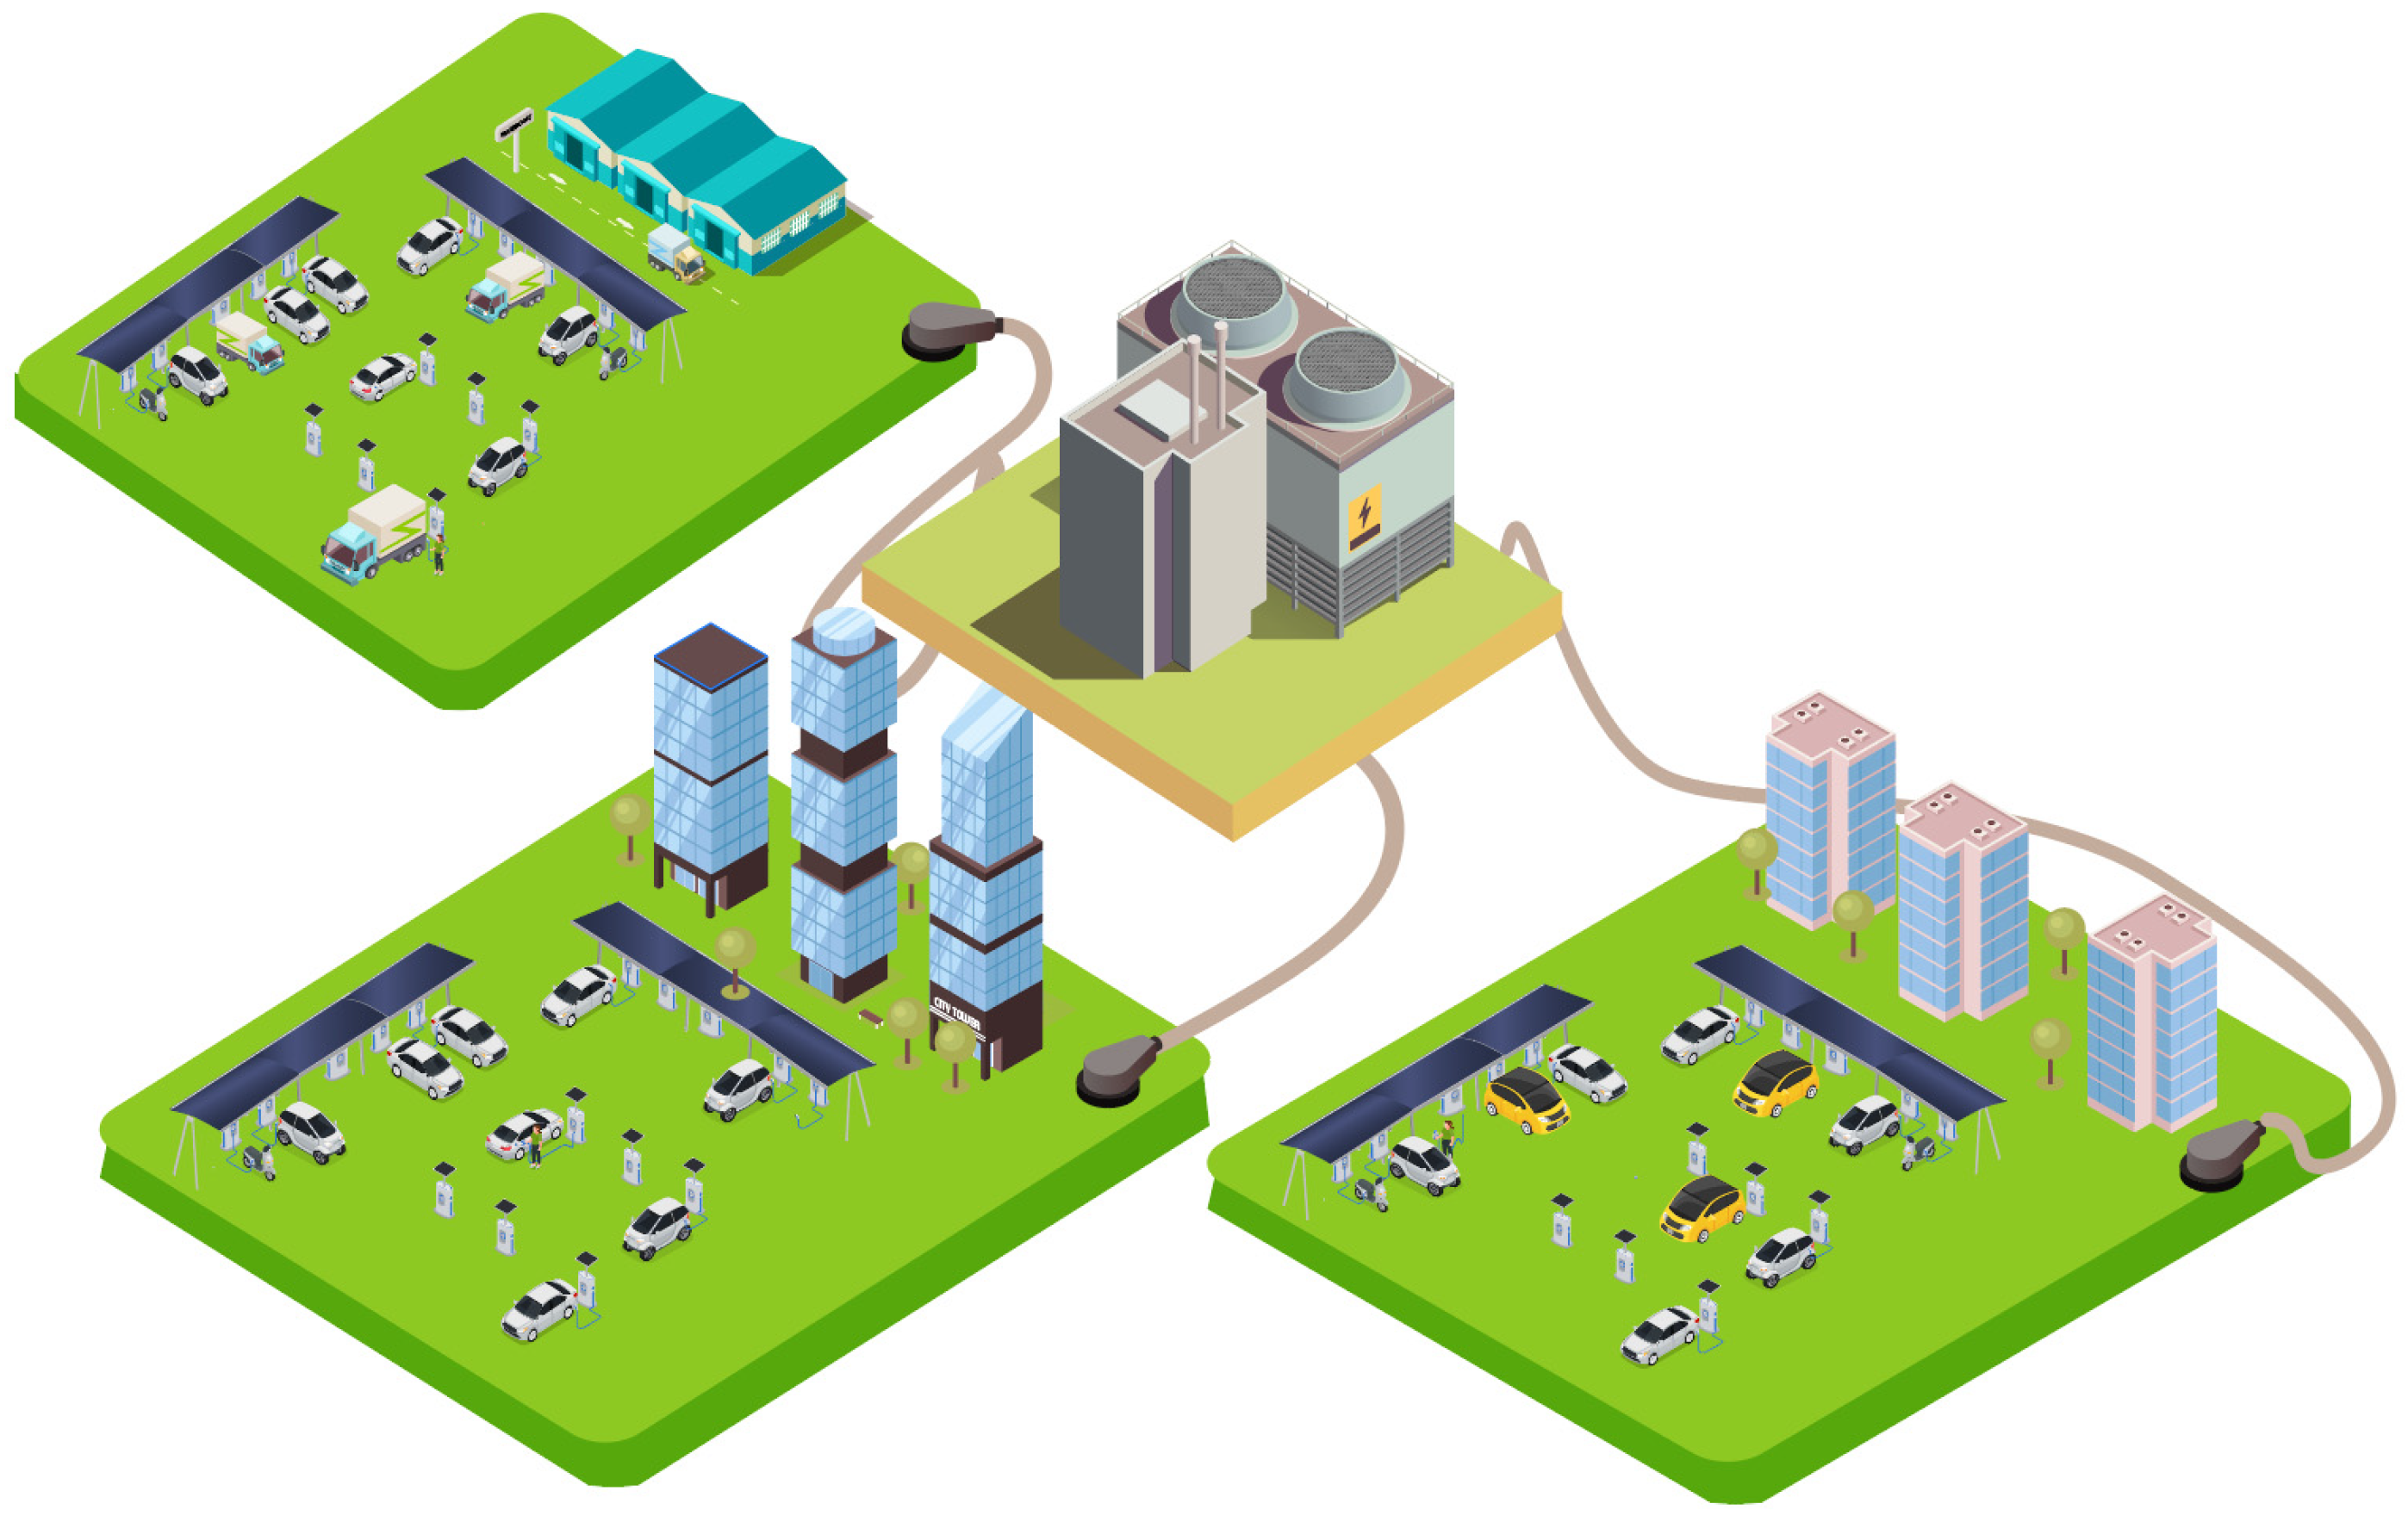
Charging behavior modeling is the foundation of orderly-charging strategies, and its core lies in describing the “time–space–State of Charge (SOC)” characteristics (temporal distribution, spatial distribution, and SOC of vehicle charging under different scenarios). In this chapter, through a hierarchical and classified research method, the following steps are conducted: first, analyze the vehicle types (private cars, taxis, etc.) and their travel patterns in three typical areas, namely residential areas, office areas, and industrial areas, and establish a probability model for the initial charging time; second, derive the SOC distribution before charging by combining the statistical data of driving mileage; finally, introduce the shared energy storage system and construct a composite load model of “vehicle charging–energy storage coordination”. As illustrated in
Figure 1, the multi-zone charging model connects residential, office, and industrial areas to the power grid. A shared energy storage system is centrally deployed to coordinate power flow and mitigate load fluctuations across these functionally distinct zones. As a key technology for scenario generation, Monte Carlo simulation can effectively capture the uncertainty of charging load through random sampling, providing reliable input data for subsequent optimization algorithms.
2.2. Probability of Initial Charging Time
For users, they will choose an appropriate time to charge, and their charging time is random. The last driving return time of EVs every day is regarded as the initial charging time. According to research findings, the daily last driving return time of EVs follows a normal distribution [
28].
where the expected value
μs = 17.6, the standard deviation
σ = 3.4, and
x denotes time [
28].
2.3. Daily Driving Mileage and SOC
The charging time and charging frequency of EVs both depend on the daily driving distance. Currently, due to the lack of driving mileage data for EVs, travel data of traditional fuel vehicles is used as a substitute, assuming that their travel patterns remain unchanged. Private car travel mainly consists of commuting trips on workdays and travel or parking on non-workdays. According to the data from National Household Travel Survey (NHTS) [
29], the fitted probability density distribution function is shown in Equation (2) [
30].
where
L denotes the daily driving distance, with an expected value of
μd = 3.2 and a standard deviation of
σd = 0.88 [
28].
Given the high uncertainty in users’ behavior of connecting to charging piles for charging, to estimate the SOC of the battery when a vehicle starts charging, we can select the specific daily driving mileage based on the probability density function of daily driving mileage and then calculate it using Equation (3). The SOC is shown in Equation (3).
where
Si.s denotes the SOC at the start of charging,
Si.e denotes the SOC at the end of charging,
Bi represents the rated battery capacity,
di represents the driving distance of the i-th vehicle, and
E100 refers to the energy consumption per 100 km (kWh).
The SOC at the initial charging time can be derived from the power battery parameters and the driving mileage of the EV. Determining the SOC at the initial charging time is crucial for formulating charging strategies. An accurate SOC estimation not only helps optimize charging time and reduce waiting time but also extends battery life by protecting the battery from overcharging or deep discharging. In addition, precise control of SOC also helps improve the efficiency of the charging process. Especially when applying fast charging technology, correct SOC estimation can ensure that the battery is charged at maximum efficiency within a safe range, thereby shortening charging time and enhancing user satisfaction.
2.4. Charging Duration
Charging duration directly affects the usability of EVs. Shorter charging times can improve user satisfaction and make EVs more appealing to users, as this reduces the time users spend waiting for charging to complete and brings the experience of using EVs closer to that of refueling traditional fuel-powered vehicles. Charging duration also impacts battery health and service life. While fast charging offers convenience, excessively fast charging speeds may increase battery temperature, accelerating battery aging and thereby shortening battery life. A reasonable charging duration and charging strategy can balance usability and battery health, extending the effective service life of the battery. Additionally, considerations regarding charging duration are crucial for the planning and construction of charging infrastructure. Fast-charging stations require greater power supply capacity and more complex grid management strategies, which may increase the construction and operation costs of the infrastructure.
where
socend denotes the SOC at the end of charging,
socstart represents the SOC at the start of charging,
E denotes the battery capacity of the EV,
P is the rated charging power (kW), and
η denotes the charging efficiency.
2.5. User Behavior Habits
If no control is applied to EVs, users usually charge their vehicles after the last trip of the day, which is referred to as unordered charging.
Private cars are mainly used for commuting on workdays, and for traveling or being parked on non-workdays. According to data from NHTS [
4], private EVs can be considered to start charging when they return home for the last time each day, with an average driving distance of 20–40 km per trip. Since many vehicle owners choose to install charging piles at home and use slow-charging mode in residential communities at night, slow-charging mode is adopted in this study.
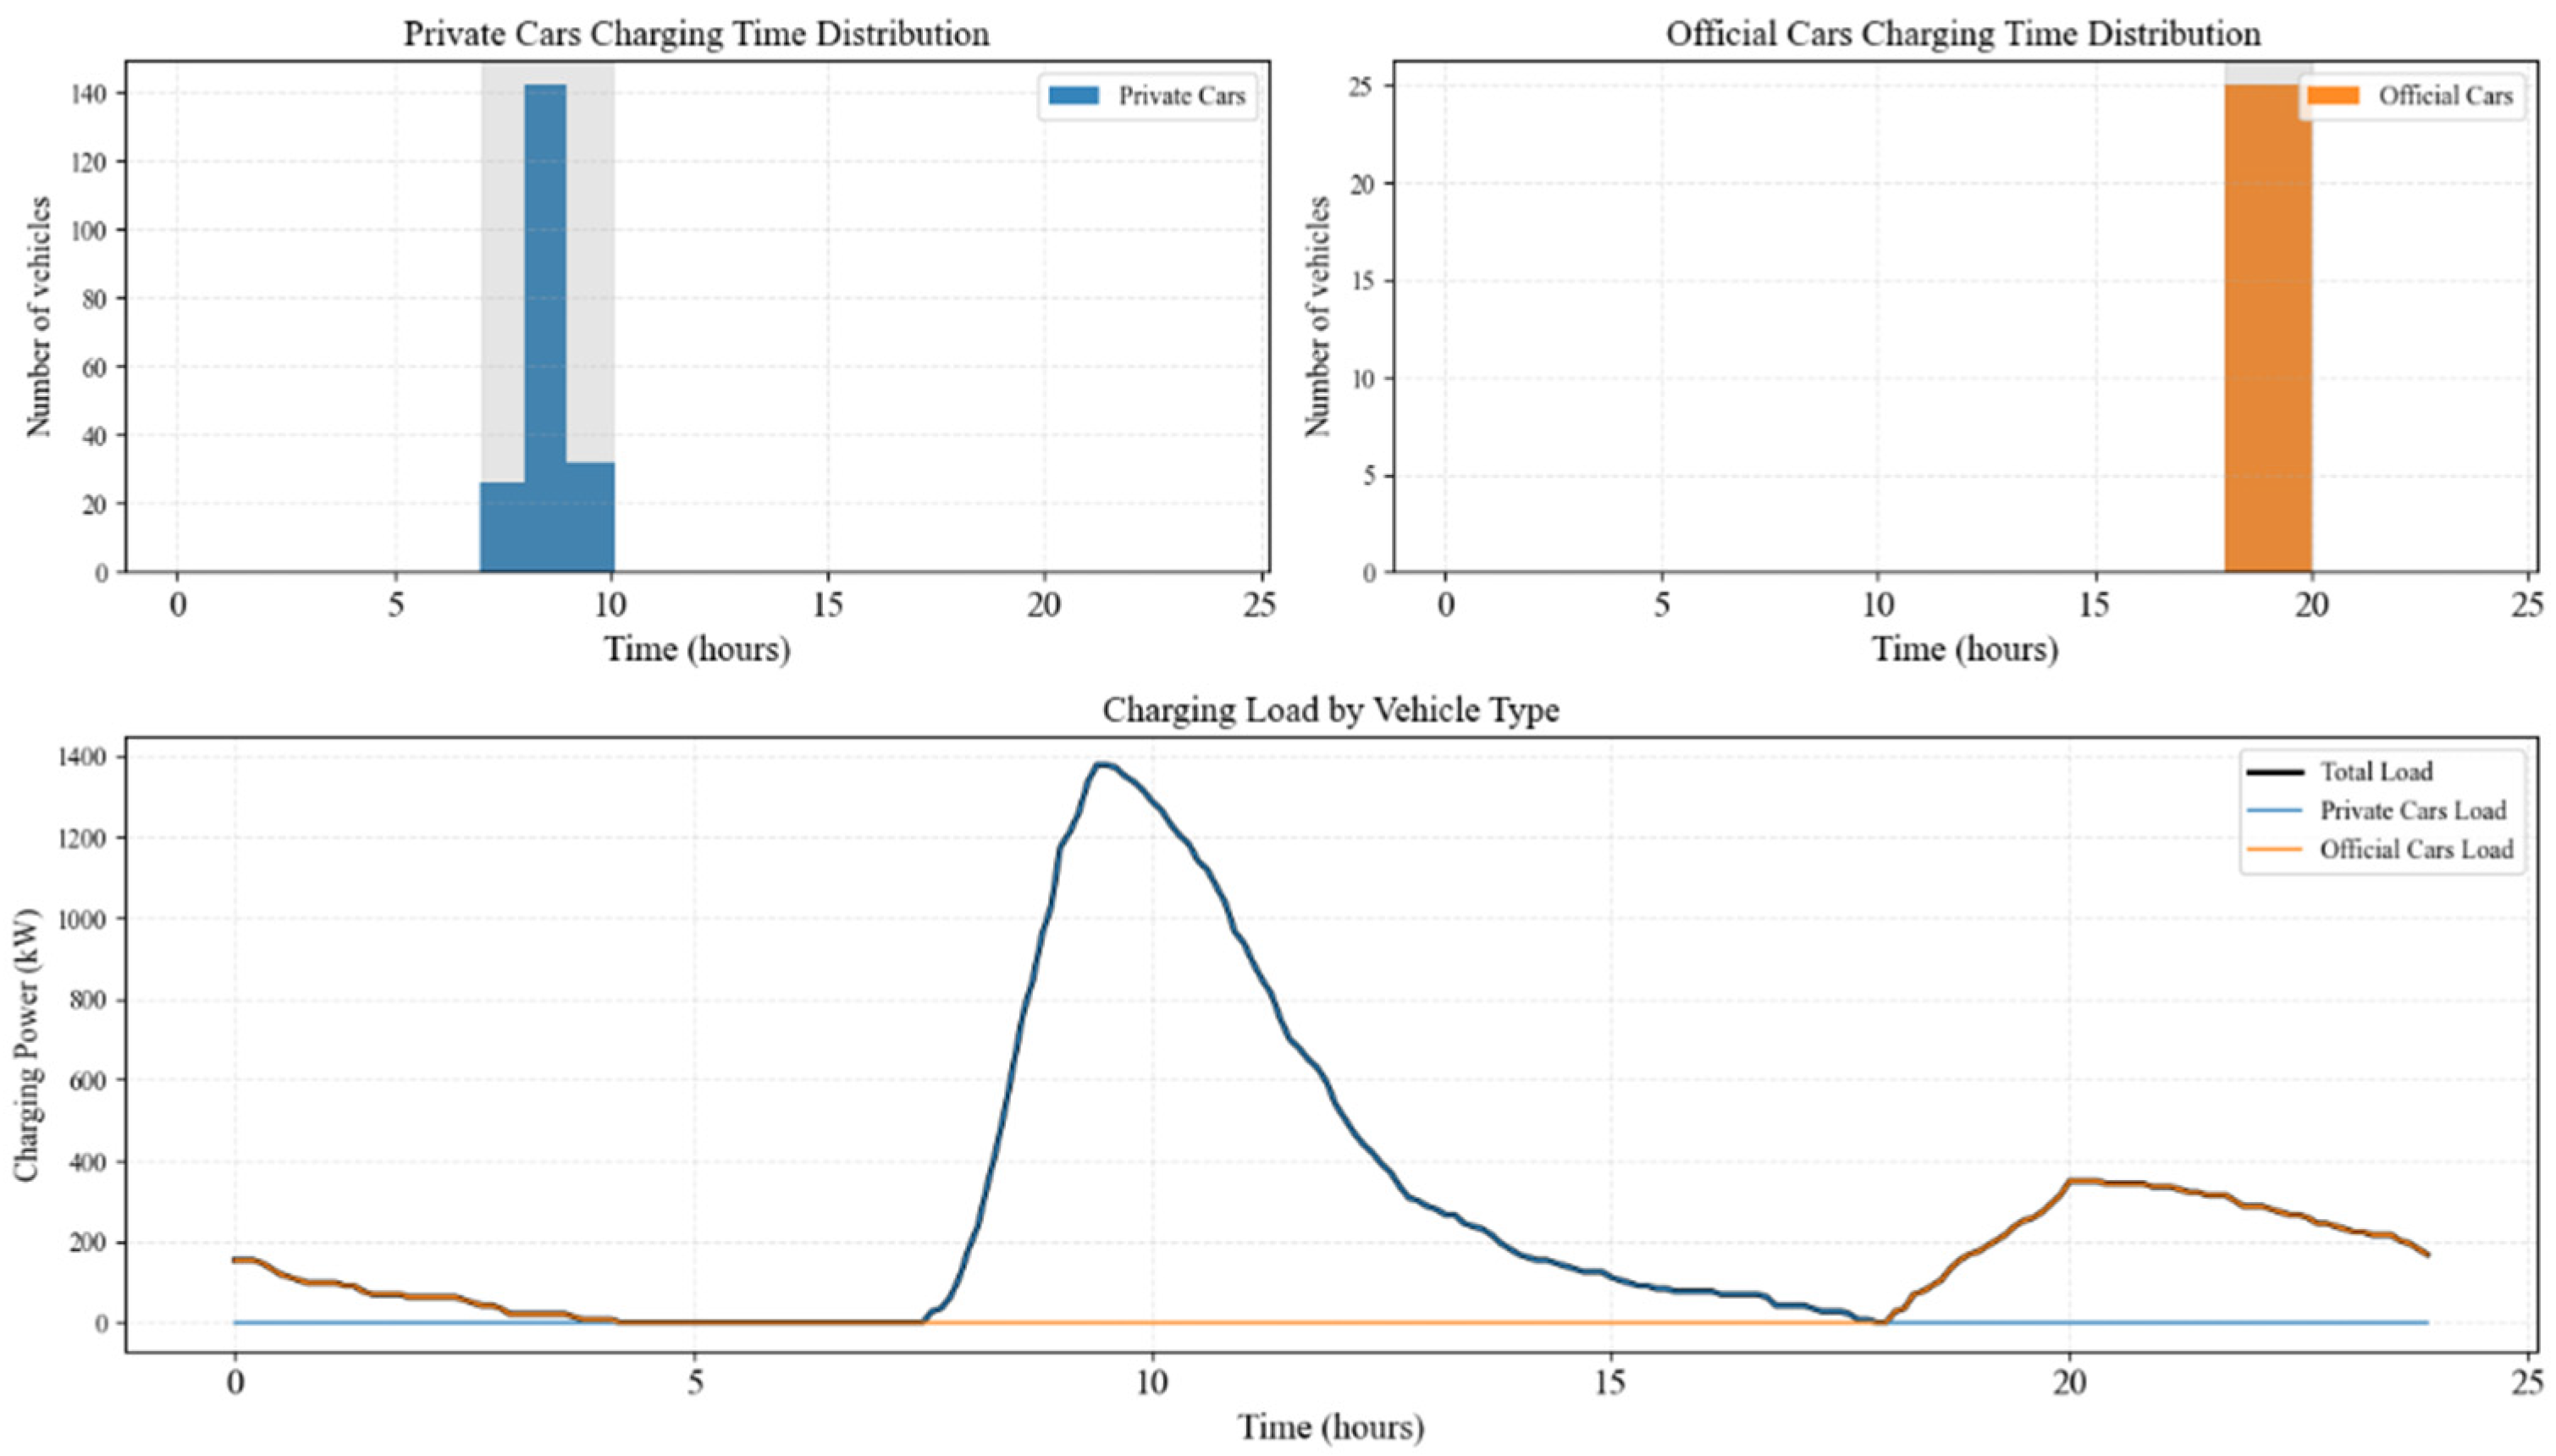
Electric official vehicles are mainly used for official business, daily office work, or specific official activities. They have a high frequency of use, and most trips have clear official purposes and plans. According to the survey on official vehicles, compared with private cars, the driving routes and mileage of official vehicles are more regular and predictable. This is because they usually operate around fixed office locations, meeting venues, and service areas. The average driving distance per trip is 50–200 km, and charging is conducted after completing official tasks. Charging is usually scheduled from 18:00 to 20:00, and slow charging is sufficient to meet their driving needs.
Electric taxis usually operate on a two-shift system on weekdays. Their driving routes are more flexible compared with private cars, and a higher maximum range is required to ensure profitability. Taxi drivers may choose to charge during periods of low electricity demand to take advantage of lower electricity prices, and fully charge the battery before shift handover. To avoid morning and evening peak hours, charging is usually scheduled from 11:30 to 14:00 during the day and from 2:00 to 5:00 at night, with two charging sessions per day. The average daily driving distance is 350–500 km. Charging methods include fast charging and slow charging, but most drivers adopt fast charging to minimize non-operation time for maximum profit. Drivers can also perform fast charging in intervals according to their daily schedule and immediate needs to ensure timely energy replenishment.
Electric logistics vehicles mainly serve urban distribution and warehouse transportation. After completing their daily transportation tasks at night, these vehicles are generally parked in logistics zones or warehouses, so the charging process does not affect operational efficiency. The average driving distance per trip is 200–500 km, and charging is conducted after the completion of transportation tasks, usually scheduled from 22:00 to 4:00. Due to their large battery capacity and the requirement for shorter charging time, fast charging is generally selected.
2.6. TOU Tariff
TOU Tariff is a refined electricity pricing strategy. It sets differentiated electricity prices for different time periods by analyzing user load patterns and fluctuations in power supply costs. Its core lies in using price signals to guide various users to increase electricity consumption during off-peak periods of the power grid and reduce it during peak periods. This achieves peak shaving and valley filling, optimizes grid load, improves resource utilization efficiency, and helps users save costs. The TOU Tariff adopted in this study is shown in
Table 1 below [
4].
3. Monte Carlo Simulation of Charging Load
The Monte Carlo method is a class of numerical simulation techniques based on random sampling. When system inputs are uncertain or analytically intractable, probability distributions are assigned to key variables, and numerous stochastic experiments are performed to estimate the mean, variance, and confidence intervals of the outputs, thereby approximating the true solution. The theoretical foundation of this method lies in the Law of Large Numbers and the Central Limit Theorem, which state that as the number of trials M increases, the sample mean converges toward the true value, while the variance diminishes proportionally to 1/M.
In the context of EV charging, parameters such as vehicle arrival time, initial SOC, daily mileage, dwell duration, charging preference, and charging power exhibit inherent stochastic characteristics influenced by the functional attributes of each district. Monte Carlo simulation explicitly models these uncertainties through repeated random sampling and accumulates them over a minute-level time horizon to generate probabilistic load profile distributions. These distributions are then used to evaluate system-level indicators such as peak–valley difference, overload risk, and energy storage requirements.
To explore the temporal impact of EV charging behavior on the power grid, one day is discretized into 1440 min, and simulations are conducted for three representative districts:
Residential district, including private EVs and electric taxis;
Industrial district, including private EVs and electric logistics vehicles;
Office district, including private EVs and official EVs.
The battery capacity of electric logistics vehicles is set to 100 kWh, while that of other vehicles is 60 kWh. A two-stage charging process is adopted:
Constant-current (CC) stage: The battery is charged at a fixed current until the voltage reaches a preset threshold, rapidly increasing the SOC to approximately 80%;
Constant-voltage (CV) stage: Once the threshold voltage is reached, the voltage is held constant while the current gradually decreases to a very low level, ensuring precise control of the charging process, preventing overcharging, and reducing battery degradation.
This dual-phase charging strategy effectively balances charging efficiency and battery protection. In addition, a shared energy storage system rated at 1200 kWh with a charge/discharge power of 400 kW is deployed to mitigate load fluctuations among the districts and improve overall energy-utilization efficiency.
The comprehensive process is depicted in
Figure 2. The flow begins with initializing parameters for different zones, followed by Monte Carlo simulation to generate load profiles, and concludes with the aggregation of charging loads for forecasting.
During the calculation and analysis process, this study adopts several simplified assumptions for ease of processing:
The research objects include private EVs, electric official vehicles, electric logistics vehicles, and electric taxis.
The number of simulated vehicles is set as follows: 300 private EVs and 50 electric taxis in residential areas; 50 electric official vehicles and 250 private EVs in office areas; and 250 private EVs and 50 electric logistics vehicles in industrial areas.
Private EVs and electric official vehicles mainly use slow-charging piles, while all electric taxis and electric logistics vehicles use fast charging piles. The charging power of fast-charging stations is set within the range of 20–40 kW, while that of slow-charging stations is configured within 3.5–7 kW.
3.1. Simulation of Residential Areas
The charging load curve of the residential area is shown in
Figure 3, and the residential area’s charging load values at different times are presented in
Table 2.
As can be seen from
Figure 3 and
Table 2, the distribution of private EVs’ charging time shows an obvious concentrated trend, with the peak time at approximately 17:30. This time period corresponds to the behavioral pattern of residents charging their vehicles intensively after returning home from work. A large number of private EVs start charging, forming a high peak area in the time distribution histogram. The distribution of electric taxis’ charging time is relatively independent and clearly different from that of private EVs. It can be seen from the histogram that they charge intensively during specific time periods (such as intervals between daytime operations, nighttime shift handovers, etc.), which reflects the impact of taxi operation characteristics on charging time. In the vehicle-type-specific charging load curve, the load of private EVs and electric taxis overlaps to form the total load curve. The load of private EVs rises relatively gently over time and then falls after reaching the peak. Due to the fast-charging characteristics of electric taxis, steeper load peaks appear during their concentrated charging periods. Under the combined effect of the two, the total load curve shows a complex fluctuating pattern, which reflects the comprehensive impact of different vehicle types’ charging behaviors on the overall electricity load of residential areas.
3.2. Simulation of Industrial Areas
The charging load curve of the industrial area is shown in
Figure 4, and the industrial area’s charging load values at different times are presented in
Table 3.
As shown in
Figure 4 and
Table 3, private EVs concentrate charging after work starts on workdays (8:00–10:00), which aligns with the commuting schedule of industrial staff. Due to the cycle of transportation tasks, electric logistics vehicles focus on charging from 22:00 at night to 4:00 the next day to replenish energy after completing the day’s transportation. This pattern is highly consistent with the “operation–rest” rhythm of industrial production. During daytime (9:00–12:00), temporary energy replenishment of private EVs, electricity consumption of industrial equipment, and vehicle charging overlap, forming a daytime load peak with a steep rise and fall in the curve. Driven by the fast charging of electric logistics vehicles, a secondary peak emerges. Owing to the high power and strong concentration of fast charging, the fluctuation range of the load curve is significant. Overall, the load fluctuation is deeply tied to the “operation-interval” cycle of industrial production, reflecting the comprehensive impact of different vehicle types’ charging behaviors on the overall electricity load of the industrial area.
3.3. Simulation of Office Areas
The charging load curve of the office area is shown in
Figure 5, and the office area’s charging load values at different times are presented in
Table 4.
As shown in
Figure 5 and
Table 4, the main types of charging vehicles in the office area are private EVs and electric official vehicles. Driven by commuting behavior, private EVs show a dual-peak characteristic: “before work in the morning (7:00–9:00) and after work in the evening (18:00–20:00)”. Before work, car owners replenish energy in a timely manner after arriving at the office area to ensure daytime travel; after work, they finish the day’s commute and conduct concentrated charging operations. Restricted by the cycle of official activities, electric official vehicles charge intensively at a fixed time (18:00–20:00). Official activities basically end during this period, and vehicles return to the site for unified energy replenishment. This time period highly overlaps with the evening peak charging time of private EVs, amplifying the charging load pressure during this period. The load curve of the office area is deeply consistent with the “work–rest” rhythm of office hours, showing a “dual-peak + trough” pattern. Since both types of vehicles use slow charging, the load grows relatively gently but lasts for a long time. The curve presents a wide peak platform, which represents the continuous impact of the superposition of the two slow-charging loads and reflects the comprehensive impact of different vehicle types on the office area’s load.
In summary, due to differences in vehicle types, usage scenarios, and regional functions, residential areas and office areas have distinct characteristics in charging time distribution and load properties. These differences provide a basis for formulating targeted orderly-charging strategies and optimizing power grid load distribution in the future. It is necessary to design suitable charging management schemes based on their respective characteristics to achieve the goals of peak shaving, valley filling, and improving the operation efficiency of the power grid.
4. Optimization and Control Strategy Based on the DDPG Algorithm
To address the scheduling problem with continuous action space, multiple constraints, and multiple optimization objectives for multi-zone EV charging scenarios, this study adopts the DDPG algorithm. This algorithm integrates the core technologies of the Actor–Critic framework and DQN. Its core structure consists of dual neural networks, and each network is further divided into an Online network and a Target network. The experience replay mechanism ensures the independence and diversity of training samples. The Online network updates its parameters using the gradient descent method, while the Target network adopts a soft update strategy to stabilize the learning process and accelerate convergence. In the evaluation phase, the Critic–Target network is responsible for estimating the Q-value of the state–action pair in the next time period, based on which the effectiveness of the current strategy is evaluated. In addition, to enhance the exploration ability of the agent, the algorithm introduces Gaussian noise disturbance into the strategy execution process.
Figure 6 illustrates the detailed architecture of the proposed DDPG model. The framework is built upon the Actor–Critic structure, where the Actor network maps the current state to a specific action, and the Critic network evaluates the action by estimating its Q-value. As depicted, both the Actor and Critic utilize a dual-network mechanism consisting of Online networks for real-time decision-making and parameter updates, and Target networks for providing stable training targets. The diagram also explicitly shows the Experience Replay Memory, which stores historical interaction data (si, ai, ri, si + 1). During the training process, random batches are sampled from this memory to update the neural networks, while the Gaussian noise module is introduced to the action output to enhance the exploration capability of the agent.
4.1. State Space
Scheduling decisions rely on the state information of multiple zones, which is specifically shown in the formula.
where
t represents the current time,
Ept represents the current electricity price (USD/kWh), est represents the residual energy capacity of the shared energy storage at t (kWh),
es-soct represents the SOC of the shared energy storage at time t,
ec-sock,m,n,t represents the SOC of the
n-th vehicle in the
m-th model in the
k-th district at t (kWh),
erk,m,n,t represents the remaining charging energy of the
n-th vehicle in the
m-th model in the
k-th district at t (kWh), and
edk,m,n,t represents the remaining charging time of the
n-th vehicle in the
m-th model in the
k-th district at
t.
Mk represents the number of vehicle types in the
k-th district,
Nk,m represents the number of vehicles of the
m-th type in the
k-th district, and k = 1,2,3 represents the following districts: 1 = residential, 2 = office, and 3 = industrial.
4.2. Action Set
The park center selects the action set
at based on the current state space
st.
where
p*k,m,n,t represents the number of vehicles of the m-th type in the k-th district the charging power at time
t,
ps,t represents the discharge/charge power of energy storage at time t.
4.3. Reward Function
This study establishes an optimization model aimed at suppressing load fluctuations and minimizing costs, with the objective functions of minimizing the mean square error (MSE) of the load curve and minimizing user costs.
where
Ps,c,t represents the charge power of the energy storage system at time t.
represents the average target load for the day,
cost represents the total electricity cost,
f represents the mean square error,
varo represents the pre-scheduling MSE,
costo represents the original cost, and the reward function weighting is
α = 0.5,
β = 0.5.
4.4. Constraints
When adjustable loads respond to the baseline, they are limited by their adjustment capacity, and the configuration of energy storage can enhance the overall response capability. The response range of the load relative to the predicted load curve at time period t is further defined as follows:
where
SOC(
t) represents the SOC of the equipment at time
t;
Pst represents the charging/discharging power of the energy storage system (kW);
θ represents the efficiency coefficient; Δ
t represents the time step (h);
EVcap represents the rated capacity of the equipment (kWh).
Equation (13) indicates that the physical upper limit of the SOC is 1, ensuring that the SOC does not exceed the actual maximum capacity in calculations.
Equation (14) represents the “fluctuation range constraint” for the SOC of energy storage. It is used to limit the variation range of the SOC of the equipment during the scheduling cycle, so as to ensure the safety and functional stability of the equipment.
SOCexp represents the expected SOC, SOC(Tdep) represents the actual SOC at the scheduling trigger time Tdep, and δSOC represents the maximum allowable SOC fluctuation of the equipment.
4.5. DDPG Model
For the Critic network, its target is defined as
yi-Qw(
st,
at). The parameters of the Critic network are updated by minimizing the loss value, and the loss function for the Critic network update is
where
ai = πθ(
s)
+ τ, and
τ represents the exploration noise in the behavior policy.
The Actor–Target network is used to provide the policy for the next state, while the Actor–Online network provides the policy for the current state. By combining the Q-value function of the Critic–Online network, the policy gradient of the Actor network during parameter update can be obtained:
For the Target network parameters,
where
λ∈(0,1) denotes the soft update coefficient.
Figure 7 details the operational workflow of the proposed DDPG-based orderly-charging strategy. The process initiates with the initialization of the simulation environment, state space construction, and the definition of the Markov Decision Process (MDP) elements, including the specific reward function design. Subsequently, the algorithm enters an iterative training loop. In each step, an action is selected based on the current policy and executed in the environment. The resulting experience tuple (
si,
ai,
ri,
si+1) is stored in the replay buffer. To optimize the policy, a mini-batch of transitions is randomly sampled to update the parameters of the Critic and Actor networks, followed by a soft update of the Target networks. This iterative learning continues until the maximum number of episodes is reached or the early-stopping criterion is met. Finally, the trained model outputs the optimal power allocation plan for EV charging and energy storage.
5. Case Study
5.1. Parameter Settings
Based on the above Monte Carlo method, a dataset is generated with an hourly time granularity. The experiment uses adjustable loads from industrial, office, and residential zones together with energy storage to form the load response curves. The optimization model is DDPG with an early-stopping strategy. Experiments are implemented in PyCharm (Python 3.10). The computing platform is equipped with an RTX 4060 Ti GPU from NVIDIA Corporation in Santa Clara, CA, USA; an Intel Core i5-12600KF CPU from Intel Corporation in Santa Clara, CA, USA; and 32 GB RAM from Kingston Technology Corporation in Fountain Valley, CA, USA.
The DDPG hyperparameters are determined via a large number of experiments and tuning, as summarized in
Table 5.
5.2. Orderly Charging Based on DDPG
Figure 8 shows the multi-zone orderly-charging load curves under the DDPG policy.
From
Figure 8 and
Table 6 and
Table 7, DDPG achieves strong results for multi-zone orderly charging. Across the three zones types, the total morning peak (8:00–12:00) reduction is 2296.38 kW, and the evening peak (17:00–22:00) reduction is 1335.92 kW, yielding a cumulative peak-period reduction of 3632.30 kW. After scheduling, peak values during peak periods in each zone drop noticeably; the “spiky” shape of the curves is substantially flattened, demonstrating the strategy’s ability to suppress peak loads. In some zones, valley-period loads increase relative to pre-scheduling levels, thereby achieving “peak shaving and valley filling,” improving the grid load profile and enhancing hosting capacity. Overall, the DDPG orderly-charging plus storage coordination mechanism significantly depresses peak values. By adapting to the distinct consumption characteristics of residential, office, and industrial zones, it dynamically optimizes EV charging load distribution to reduce peak loads and fill valleys, improving distribution-grid operational stability.
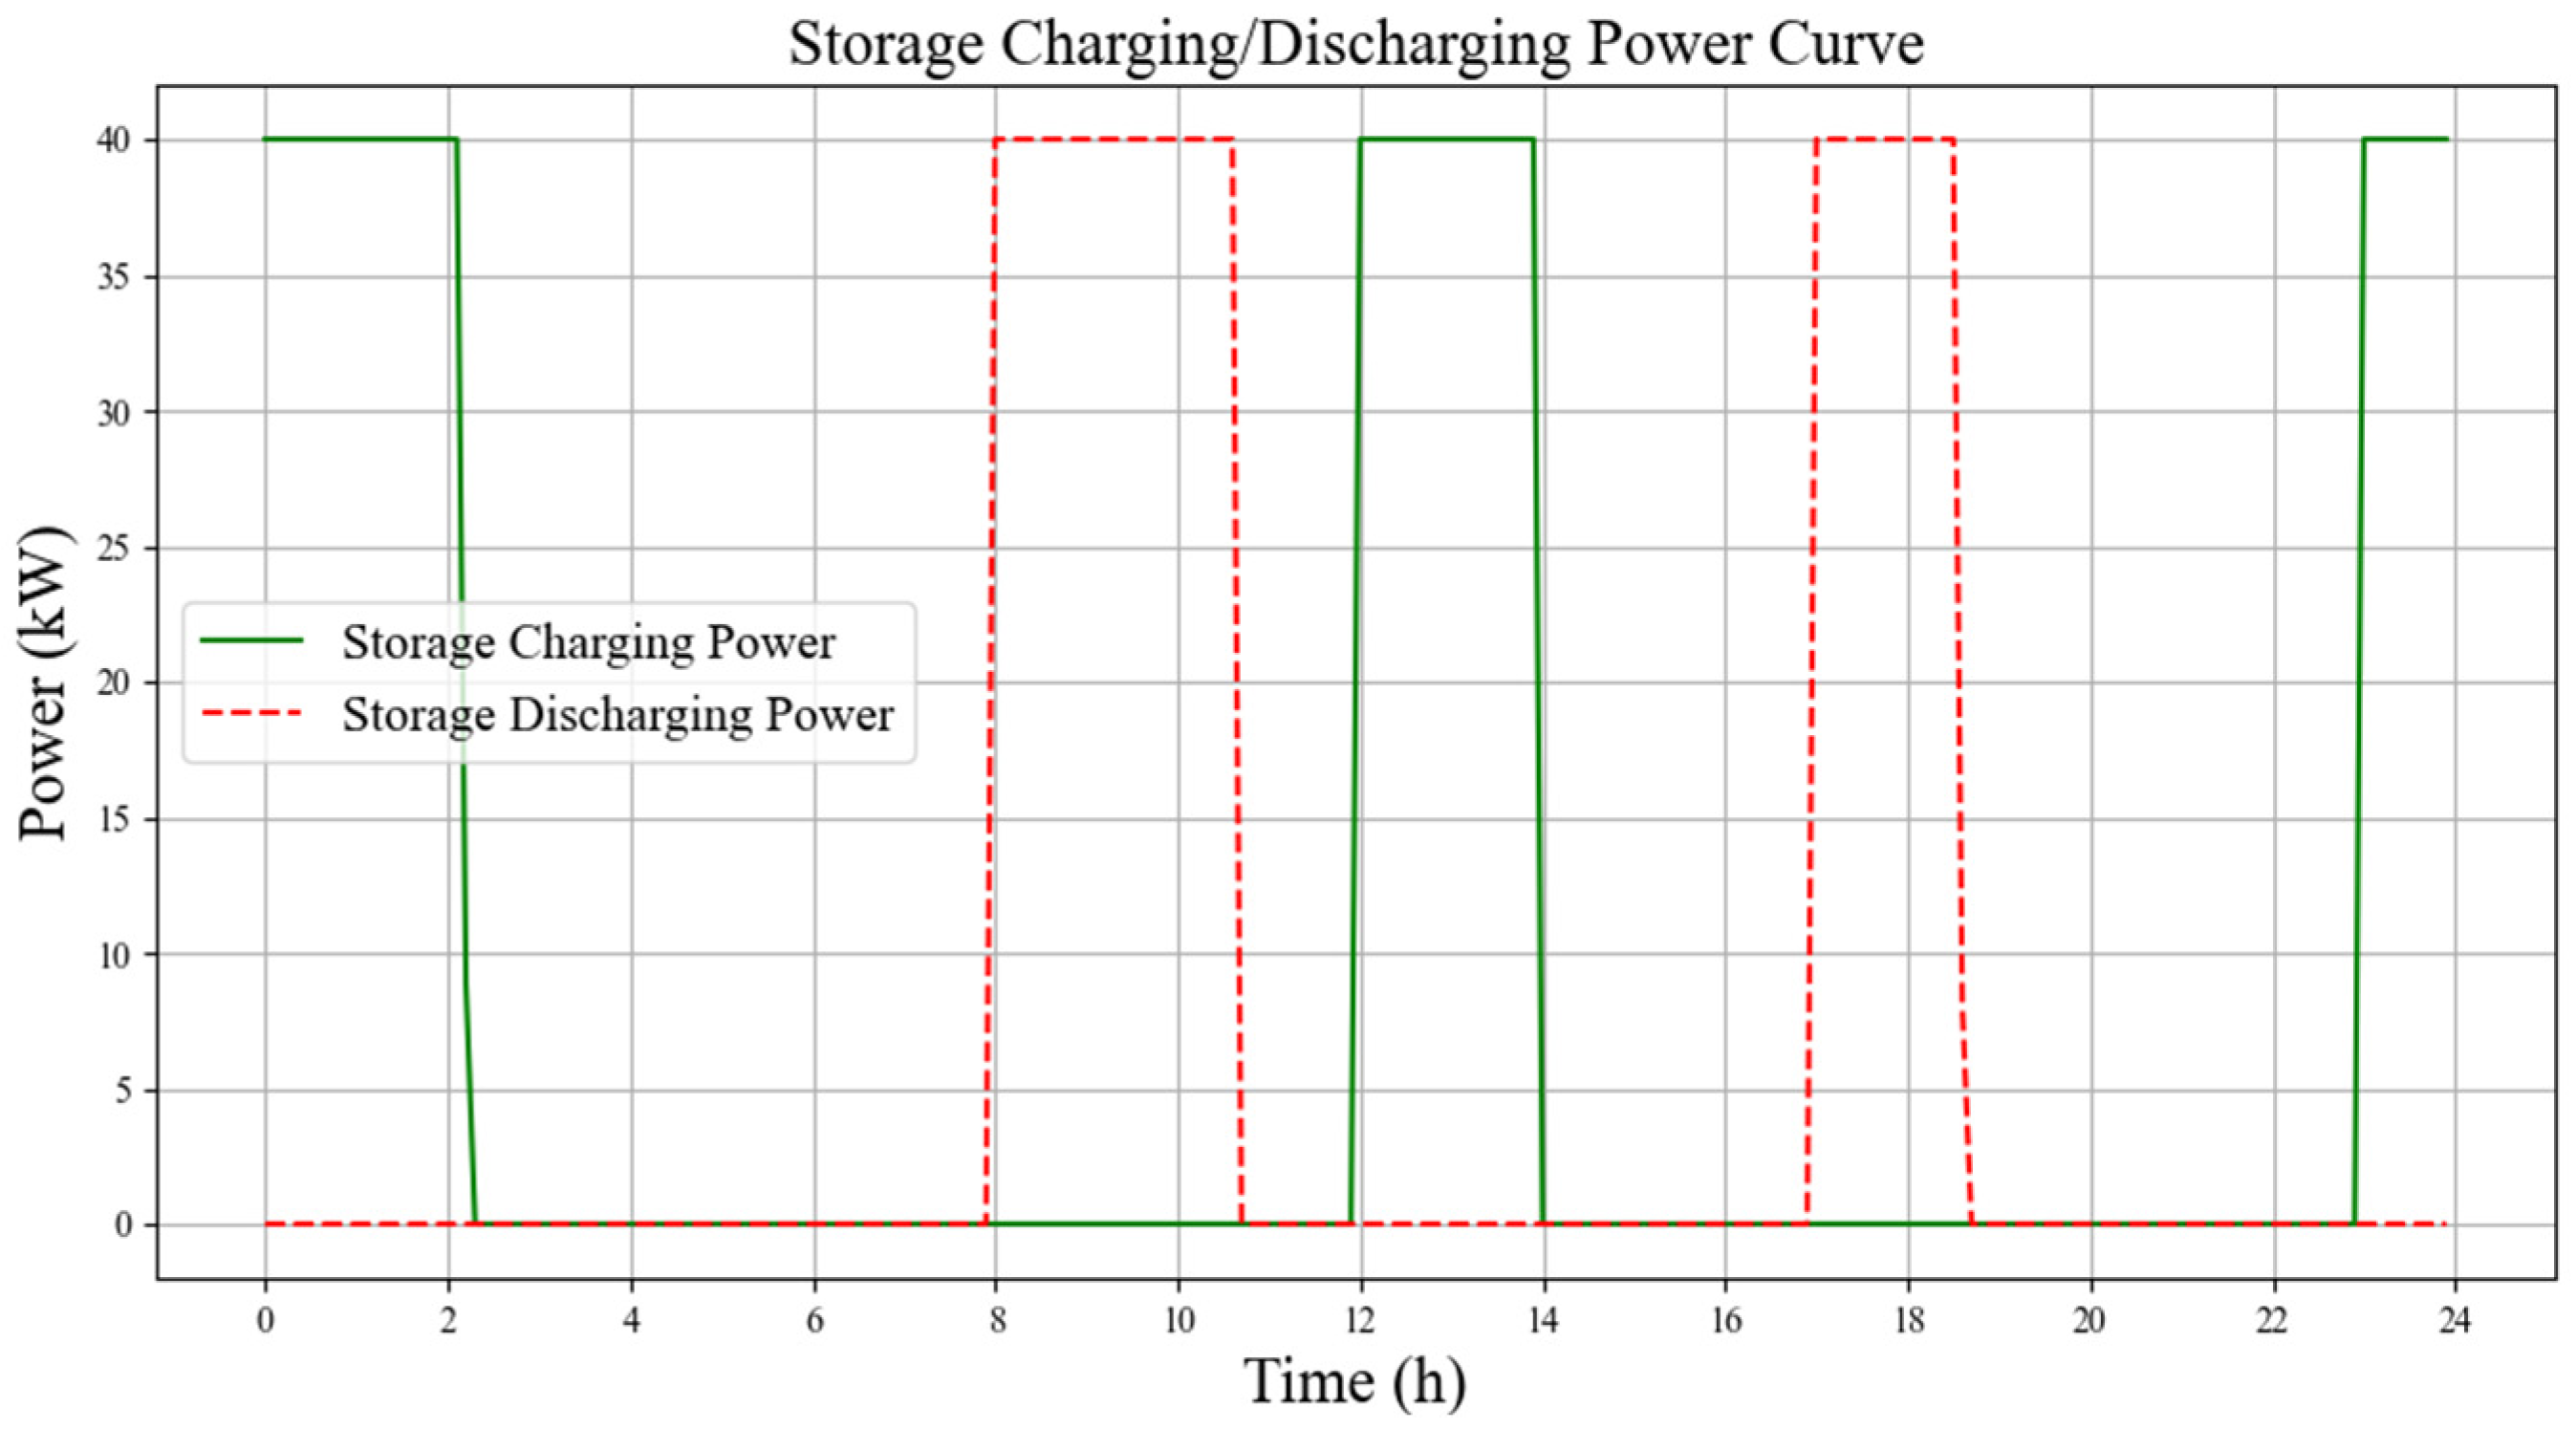
As shown in
Figure 9, the storage system starts charging during the early valley period (initial energy 400 kWh) and reaches full charge by 02:00. Entering the morning peak, it begins discharging at 08:00 and continues until 11:00, precisely matching peak demand. After 12:00 (midday valley), it charges again and maintains charging until 14:00. At 17:00 (evening peak), it discharges once more to support supply and finally resumes charging during the late-night valley at 23:00. This charge/discharge cycle closely follows the morning–evening peak rhythm, effectively “empowering” multi-zone orderly charging to achieve peak shaving and valley filling.
We compare Twin Delayed Deep Deterministic Policy Gradient (TD3), DDPG, Soft Actor–Critic (SAC), and the multi-objective Particle Swarm Optimization algorithm (MOPSO). All algorithms adopt early stopping with at least 100 episodes, patience of 20 episodes, and a convergence threshold of 0.1. The results are as follows.
From
Figure 10,
Figure 11 and
Figure 12 and
Table 8, algorithmic differences in computational efficiency are evident. TD3 requires 253.20 s, DDPG 240.30 s, SAC 607.64 s, and MOPSO 1148.53 s. In terms of electricity cost optimization, all algorithms share the same baseline cost for unordered charging (USD 2994.85), but differences lie in the optimized costs and savings. Among untuned RL methods, TD3 saves USD 491.69 (16.42%), DDPG saves USD 511.49 (17.08%), SAC saves USD 469.54 (15.68%), and MOPSO saves USD 472.36 (15.77%). Overall, the traditional MOPSO algorithm lags significantly behind in both computational efficiency and cost optimization, highlighting the advantages of RL in multi-zone orderly-charging scheduling. DDPG performs the best, with the shortest runtime and the largest cost savings, demonstrating its superiority in both training efficiency and cost optimization. As shown in the reward comparison plot, with the addition of Gaussian noise, the DDPG not only excels in computational efficiency and cost reduction but also achieves a larger exploration range in the early stage of training to fully traverse the strategy space. Subsequently, it gradually shifts from short-term high-reward strategies to more stable long-term strategies, realizing the minimization of cost and variance and ultimately finding a better solution. Thus, it is the most reliable and effective solution for multi-zone EV orderly-charging strategies.
6. Discussion
6.1. Data Validity and Algorithmic Performance Analysis
The proposed method allows for external validation and data traceability, as the basic data is derived from the U.S. public dataset (
https://nhts.ornl.gov). This external public dataset serves as effective external validation, addressing the issue of data traceability. Furthermore, the Monte Carlo method is a common approach in the research on orderly charging of electric vehicles, and the research can be fully reproduced according to the descriptions in the manuscript [
30,
31,
32,
33,
34].
Regarding algorithmic performance, the DDPG algorithm demonstrates superior computational efficiency and optimization capability compared to baseline methods (TD3, SAC, and MOPSO). As detailed in
Table 8, DDPG achieves the highest cost savings (17.08%) with the shortest computation time. It should be noted that these specific results are valid for the presented case study. Unlike the traditional MOPSO algorithm, which suffers from computational bottlenecks in high-dimensional state spaces, DDPG effectively handles the continuous action space of multi-zone scheduling.
A notable feature observed in the training process (
Figure 12) is the oscillation of the reward curve during the initial phase (episodes 0–40). It is crucial to clarify that this oscillation does not indicate algorithmic instability; rather, it reflects the agent’s active exploration driven by the introduced Gaussian noise. This mechanism prevents the agent from converging prematurely to local optima—a common limitation in greedy strategies. As training progresses, the transition from exploration to exploitation ensures that the agent converges to a robust, long-term optimal policy, confirming the strategy’s stability for practical deployment.
6.2. Comparative Analysis of Scheduling Methodologies
As shown in
Table 9, this study compares the application of traditional heuristic algorithms and single-scenario deep reinforcement learning in multi-zone electric vehicle orderly-charging scheduling. Traditional heuristic algorithms like MOPSO, IPSO, PSO, and GA perform well in low-dimensional static optimization scenarios and are easy to implement without the need for complex network training processes. However, these methods suffer from the “curse of dimensionality” in large-scale systems, resulting in low computational efficiency. Additionally, their scheduling costs are typically about 20% higher than those of deep reinforcement learning-based strategies. While these methods can effectively find local optima in small-scale, single-zone scheduling problems, they often fall short when dealing with the complexity of multi-zone charging scheduling [
35,
36,
37].
In contrast, single-scenario deep reinforcement learning methods, such as DDPG, DQN, SAC, and TD3, exhibit stronger capabilities in handling complex nonlinear load relationships and multi-objective optimization problems. These methods do not rely on precise power grid mathematical models and can adaptively optimize the charging schedule, demonstrating strong generalization abilities. However, these methods are limited in that they do not fully account for the complex behaviors of different vehicle types in mixed-function zones, which may lead to suboptimal user demand matching in multifunctional zone scheduling. Most of these algorithms primarily focus on spatiotemporal scheduling in a single zone, so while they can provide effective solutions for single-scenario problems, they have limitations when applied to multi-zone scheduling [
46].
In the comparison, the DDPG-based closed-loop framework strategy performs exceptionally well. By integrating multi-source heterogeneity (such as three types of functional zones and four vehicle types), it accurately reflects the complexity of real-world scenarios and effectively solves the spatiotemporal coupling problem. Additionally, the continuous action space of the DDPG algorithm allows for flexible power allocation, enhancing its robustness against prediction errors.To ensure the reproducibility of the proposed DDPG-based orderly-charging strategy,
Appendix A provides the data samples.
These comparative results demonstrate that reinforcement learning methods are more advantageous than heuristic methods, completing the benchmarking with prior published research.
7. Conclusions
In response to the challenges posed by large-scale EV integration—namely, uneven multi-zone charging load distribution that increases distribution-grid stress, degrades user experience, and raises costs—this paper proposes a multi-zone orderly-charging strategy based on DDPG. By constructing a differentiated model, a closed-loop control framework, and an optimization algorithm, the approach simultaneously improves distribution-grid operational efficiency and user charging benefits. The main conclusions are as follows:
The “spatiotemporal load” model accurately reflects real-world scenarios, integrating vehicle types, charging behaviors, and spatiotemporal patterns through Monte Carlo simulation, providing reliable data for subsequent strategies.
The “load forecasting–dynamic storage regulation–real-time power allocation” framework optimizes grid load characteristics, reducing peak loads by 2296.38 kW in the morning and 1335.92 kW in the evening, while increasing valley loads, thereby smoothing grid fluctuations.
The DDPG algorithm outperforms others (TD3, SAC, MOPSO) in computation time (240.30 s), cost savings, achieving USD 511.49 in savings (17.08%), and an MSE of 312,575.99.
In conclusion, the proposed strategy effectively mitigates operational stress on distribution grids and reduces users’ charging costs, providing a scalable and efficient solution for orderly EV charging across multiple zones.
Despite the promising simulation results achieved by the DDPG-based orderly-charging strategy for multi-zone EV scenarios, there remains ample room for improvement. Future work will include real-time traffic data for dynamic charging decisions based on route, traffic, and distance. Current work focuses on economic optimization, neglecting network constraints. Future research will embed electrical topology in DDPG to balance efficiency and security, with cross-zone energy support and VPP coordination.
Author Contributions
Conceptualization, C.L. and X.Y.; methodology, C.L. and X.Y. software, C.L.; validation, X.L. and C.Q.; formal analysis, X.Y.; investigation, C.L.; resources, C.L.; data curation, C.L.; writing—original draft preparation, C.L. and X.Y.; writing—review and editing, X.L.; visualization, C.Q.; supervision, C.L.; project administration, C.L.; funding acquisition, C.L. All authors have read and agreed to the published version of the manuscript.
Funding
This work was funded by the Youth Innovation Science and Technology Support Program of Shandong Colleges and Universities 2024KJH086. This work is supported by the National Natural Science Foundation of China Youth Program 62403286, Shandong Provincial Natural Science Foundation ZR2024QF192 and Youth Innovation Science and Technology Support Program of Shandong Colleges and Universities 2024KJH086.
Institutional Review Board Statement
Not applicable.
Informed Consent Statement
Not applicable.
Data Availability Statement
The raw data supporting the conclusions of this article will be made available by the authors on request.
Conflicts of Interest
The authors declare no conflict of interest.
Abbreviations
The following abbreviations are used in this manuscript:
| CC | Constant Current |
| CV | Constant Voltage |
| DDPG | Deep Deterministic Policy Gradient |
| DQN | Deep Q-Network |
| DRL | Deep Reinforcement Learning |
| EV | Electric Vehicle |
| MOPSO | Multi-Objective Particle Swarm Optimization |
| SAC | Soft Actor–Critic |
| TD3 | Twin Delayed Deep Deterministic Policy Gradient |
| TOU | Time-of-Use |
| VPP | Virtual Power Plant |
| SOC | State of Charge |
| MSE | Mean Square Error |
| PSO | Particle Swarm Optimization |
| IPSO | Improved Particle Swarm Optimization |
| GA | Genetic Algorithm |
Nomenclature
The following nomenclature is used in this manuscript:
| Variable | Description | Unit |
| Bi | Rated battery capacity | kWh |
| P | Rated charging power | kW |
| η | Charging efficiency | - |
| E100 | Energy consumption per 100 km | kWh |
| EVcap | Rated capacity of equipment | kWh |
| x | Initial charging time | h |
| μs | Expected value of initial charging time | h |
| σ | Standard deviation of charging time | - |
| L | Daily driving distance | km |
| μd | Expected value of driving distance | km |
| σd | Std. deviation of driving distance | - |
| Tdep | Departure time | h |
| SOC | State of Charge | % |
| socstart | SOC at the start of charging | % |
| socend | SOC at the end of charging | % |
| Ept | Current electricity tariff | $/kWh |
| est | Residual energy of shared storage | kWh |
| es-soct | SOC of shared energy storage | % |
| ec-sock,m,n,t | SOC of vehicle n in district k | % |
| erk,m,n,t | Remaining charging energy | kWh |
| edk,m,n,t | Remaining charging time | h |
| at | Action set | - |
| P*k,m,n,t | Vehicle charging power | kW |
| ps,t | Storage charge/discharge power | kW |
| f | Mean square error | kW2 |
| cost | Total electricity cost | $ |
Appendix A
To ensure the reproducibility of the proposed DDPG-based orderly-charging strategy, this appendix provides the data samples. Due to space constraints, the complete time-series data, including private loads, base loads for each zone, and the full synthetic charging profiles for all 24 h, have been uploaded to a public repository. Researchers interested in further verification or comparative studies can access the detailed experimental process data at the following URL:
https://github.com/jysdzrx/mul-zones-data.git (accessed on 17 December 2025).
References
- Zheng, Y.; Niu, S.; Shang, Y.; Shao, Z.; Jian, L. Integrating plug-in electric vehicles into power grids: A comprehensive review on power interaction mode, scheduling methodology and mathematical foundation. Renew. Sustain. Energy Rev. 2019, 112, 424–439. [Google Scholar] [CrossRef]
- Cui, D.; Wang, Z.; Liu, P.; Zhang, Z.; Wang, S.; Zhao, Y.; Dorrell, D.G. Coordinated charging scheme for electric vehicle fast-charging station with demand-based priority. IEEE Trans. Transp. Electrif. 2023, 10, 6449–6459. [Google Scholar] [CrossRef]
- Yan, X.; Chen, Y.; Ma, J.; Huang, Z.; Zeng, J.; Zeng, J. Comprehensive bidding strategy for electric vehicle aggregators participating in multiple markets considering response uncertainty. Power Syst. Technol. 2025, 49, 1459–1468. [Google Scholar]
- Zhang, R. Research on Orderly EV Charging Strategies Based on Time-of-Use Pricing. Doctoral Dissertation, Shanxi University of Technology, Hanzhong, China, 2024. [Google Scholar]
- Chen, P.; Liu, Y.; Yuan, C. Reconstruction strategy to enhance open-access capacity of distribution networks considering EV charging modes. Power Syst. Technol. 2025, 49, 177–186. [Google Scholar]
- Wang, M.; Yuan, X.; Zeng, F.; Lü, S.; Han, H.; Miao, H.; Pan, Y. Review of key technologies for planning and operation of electric vehicle charging infrastructure. Electr. Power Autom. Equip. 2025, 45, 65–76. [Google Scholar]
- Hao, J.; Wei, F.; Ai, X.; Fang, J.; Xu, Y.; Wen, J. Scheduling strategy for electric-vehicle load aggregators under price- and incentive-based demand response. Power Syst. Technol. 2022, 46, 1259–1269. [Google Scholar]
- Wang, X.; Zhou, B.; Tang, H. Coordinated charging/discharging control strategy for electric vehicles considering user factors. Power Syst. Prot. Control 2018, 46, 129–137. [Google Scholar]
- Zhang, L.; Sun, C.; Cai, G. Two-stage optimization strategy for orderly charging/discharging of electric vehicles based on PSO. Proc. CSEE 2022, 42, 1837–1852. [Google Scholar]
- Jiang, Y.; Yu, A.; Huang, M. Spatiotemporal dual-scale guided orderly charging strategy for electric vehicles considering user satisfaction. China Electr. Power 2020, 53, 122–130. [Google Scholar] [CrossRef]
- Hussain, S.; Irshad, R.R.; Pallonetto, F.; Hussain, I.; Hussain, Z.; Tahir, M.; Abimannan, S.; Shukla, S.; Yousif, A.; Kim, Y.S.; et al. Hybrid coordination scheme based on fuzzy inference mechanism for residential charging of electric vehicles. Appl. Energy 2023, 352, 121939. [Google Scholar] [CrossRef]
- Xu, Y.; Liu, H.; Sun, S.; Mi, L. Bi-level optimal scheduling of multi-microgrid systems considering demand response and shared energy storage. Electr. Power Autom. Equip. 2023, 43, 18–26. [Google Scholar]
- Chrysopoulos, A.; Mitkas, P.A. Customized time-of-use pricing for small-scale consumers using multi-objective particle swarm optimization. Adv. Build. Energy Res. 2018, 12, 25–47. [Google Scholar] [CrossRef]
- Du, W.; Ma, J.; Yin, W. Orderly charging strategy of electric vehicle based on improved PSO algorithm. Energy 2023, 271, 127088. [Google Scholar] [CrossRef]
- Ge, X.; Yang, Y.; Wang, B.; Jiang, X. EV charging guidance and coordinated compensation strategy considering trip urgency. Electr. Power Autom. Equip. 2024, 44, 81–88+97. [Google Scholar]
- Gao, Y.; Xie, C.; Zhang, G.; Cao, M.; Sun, L. Low-carbon coordinated operation scheduling for campus integrated energy systems with electric-vehicle integration. Electr. Eng. 2025, 26, 14–25+34. [Google Scholar]
- Wang, R.; Gao, H.; Luo, L.; Chen, M.; Xu, J.; Liu, J. A review of optimal operation for novel distribution systems based on deep reinforcement learning. Electr. Power Autom. Equip. 2025, 45, 152–164. [Google Scholar]
- He, S.Y.; Kuo, Y.H.; Wu, D. Incorporating institutional and spatial factors in the selection of the optimal locations of public electric vehicle charging facilities: A case study of Beijing, China. Transp. Res. Part C Emerg. Technol. 2016, 67, 131–148. [Google Scholar] [CrossRef]
- Zhang, F.; Yang, Q.; An, D. CDDPG: A deep-reinforcement-learning-based approach for electric vehicle charging control. IEEE Internet Things J. 2020, 8, 3075–3087. [Google Scholar] [CrossRef]
- Li, X.; Xiang, Y.; Lyu, L.; Ji, C.; Zhang, Q.; Teng, F.; Liu, Y. Price incentive-based charging navigation strategy for electric vehicles. IEEE Trans. Ind. Appl. 2020, 56, 5762–5774. [Google Scholar] [CrossRef]
- Sepehrzad, R.; Khodadadi, A.; Adinehpour, S.; Karimi, M. A multi-agent deep reinforcement learning paradigm to improve the robustness and resilience of grid connected electric vehicle charging stations against the destructive effects of cyber-attacks. Energy 2024, 307, 132669. [Google Scholar] [CrossRef]
- Mansour, S.H.; Azzam, S.M.; Hasanien, H.M.; Tostado-Véliz, M.; Alkuhayli, A.; Jurado, F. Deep reinforcement learning-based plug-in electric vehicle charging/discharging scheduling in a home energy management system. Energy 2025, 316, 134420. [Google Scholar] [CrossRef]
- Colak, A.; Fescioglu-Unver, N. Deep reinforcement learning based resource allocation for electric vehicle charging stations with priority service. Energy 2024, 313, 133637. [Google Scholar] [CrossRef]
- Lin, Y.P.; Zhang, K.; Shen, Z.M.; Ye, B.; Miao, L. Multistage large scale charging station planning for electric buses considering transportation network and power grid. Transp. Res. Part C Emerg. Technol. 2019, 107, 423–443. [Google Scholar] [CrossRef]
- Zhou, J.; Xiang, Y.; Zhang, X.; Sun, Z.; Liu, X.; Liu, J. Optimal self-consumption scheduling of highway electric vehicle charging station based on multi-agent deep reinforcement learning. Renew. Energy 2025, 238, 121982. [Google Scholar] [CrossRef]
- Mohammed, M.; Oke, J. Origin-destination inference in public transportation systems:a comprehensive review. Int. J. Transp. Sci. Technol. 2023, 12, 315–328. [Google Scholar] [CrossRef]
- Liu, L.; Huang, Z.; Xu, J. Multi-agent deep reinforcement learning based scheduling approach for mobile charging in internet of electric vehicles. IEEE Trans. Mob. Comput. 2024, 23, 10130–10145. [Google Scholar] [CrossRef]
- Hou, H.; Wang, Y.; Xie, C.; Xiong, B.; Zhang, Q.; Huang, L. A dispatching strategy for electric vehicle aggregator combined price and incentive demand response. IET Energy Syst. Integr. 2021, 3, 508–519. [Google Scholar] [CrossRef]
- U.S. Department of Transportation, Federal Highway Administration. 2017 National Household Travel Survey. Available online: https://nhts.ornl.gov (accessed on 10 May 2025).
- Liu, Y.; Zhu, J.; Sang, Y.; Sahraei-Ardakani, M.; Jing, T.; Zhao, Y.; Zheng, Y. An aggregator-based dynamic pricing mechanism and optimal scheduling scheme for the electric vehicle charging. Front. Energy Res. 2023, 10, 1037253. [Google Scholar] [CrossRef]
- Wang, Y.; Infield, D. Markov Chain Monte Carlo simulation of electric vehicle use for network integration studies. Int. J. Electr. Power Energy Syst. 2018, 99, 85–94. [Google Scholar] [CrossRef]
- Sun, C.; Che, Y. Monte Carlo-based Prediction of Electric Vehicle Charging Load and Coupling Mechanisms of Multiple Information Sources. Int. J. Renew. Energy Res. 2025, 15, 42–55. [Google Scholar] [CrossRef]
- Polat, Ö.; Eyüboğlu, O.H.; Gül, Ö. Monte Carlo simulation of electric vehicle loads respect to return home from work and impacts to the low voltage side of distribution network. Electr. Eng. 2021, 103, 439–445. [Google Scholar] [CrossRef]
- Liu, C.; Lin, Z. How uncertain is the future of electric vehicle market: Results from Monte Carlo simulations using a nested logit model. Int. J. Sustain. Transp. 2017, 11, 237–247. [Google Scholar] [CrossRef]
- Wan, Z.; Li, H.; He, H.; Prokhorov, D. Model-free real-time EV charging scheduling based on deep reinforcement learning. IEEE Trans. Smart Grid 2018, 10, 5246–5257. [Google Scholar] [CrossRef]
- Li, Y.; Yu, C.; Shahidehpour, M.; Yang, T.; Zeng, Z.; Chai, T. Deep reinforcement learning for smart grid operations: Algorithms, applications, and prospects. Proc. IEEE 2023, 111, 1055–1096. [Google Scholar] [CrossRef]
- Alqahtani, M.; Hu, M. Dynamic energy scheduling and routing of multiple electric vehicles using deep reinforcement learning. Energy 2022, 244, 122626. [Google Scholar] [CrossRef]
- Hadian, E.; Akbari, H.; Farzinfar, M.; Saeed, S. Optimal allocation of electric vehicle charging stations with adopted smart charging/discharging schedule. IEEE Access 2020, 8, 196908–196919. [Google Scholar] [CrossRef]
- Fang, B.; Li, B.; Li, X.; Jia, Y.; Xu, W.; Liao, Y. Multi-objective comprehensive charging/discharging scheduling strategy for electric vehicles based on the improved particle swarm optimization algorithm. Front. Energy Res. 2021, 9, 811964. [Google Scholar] [CrossRef]
- Pan, K.; Liang, C.D.; Lu, M. Optimal scheduling of electric vehicle ordered charging and discharging based on improved gravitational search and particle swarm optimization algorithm. Int. J. Electr. Power Energy Syst. 2024, 157, 109766. [Google Scholar] [CrossRef]
- García-Álvarez, J.; González, M.A.; Vela, C.R. A genetic algorithm for scheduling electric vehicle charging. In Proceedings of the 2015 Annual Conference on Genetic and Evolutionary Computation, Madrid, Spain, 11–15 July 2015; pp. 393–400. [Google Scholar]
- Li, S.; Hu, W.; Cao, D.; Dragicevic, T.; Huang, Q.; Chen, Z.; Blaabjerg, F. Electric vehicle charging management based on deep reinforcement learning. J. Mod. Power Syst. Clean Energy 2021, 10, 719–730. [Google Scholar] [CrossRef]
- Han, Y.; Li, T.; Wang, Q. A DQN based approach for large-scale EVs charging scheduling. Complex Intell. Syst. 2024, 10, 8319–8339. [Google Scholar] [CrossRef]
- Xiao, Q.; Zhang, R.; Wang, Y.; Shi, P.; Wang, X.; Chen, B.; Fan, C.; Chen, G. A deep reinforcement learning based charging and discharging scheduling strategy for electric vehicles. Energy Rep. 2024, 12, 4854–4863. [Google Scholar] [CrossRef]
- Li, H.; Zhu, J.; Zhou, Y.; Feng, Q.; Feng, D. Charging station management strategy for returns maximization via improved TD3 deep reinforcement learning. Int. Trans. Electr. Energy Syst. 2022, 2022, 6854620. [Google Scholar] [CrossRef]
- Ge, X.; Cao, S.; Fu, Y.; Hu, W. Spatiotemporal two-scale optimal scheduling of electric vehicles based on regional decoupling. Proc. CSEE 2023, 43, 7383–7396. [Google Scholar]
| Disclaimer/Publisher’s Note: The statements, opinions and data contained in all publications are solely those of the individual author(s) and contributor(s) and not of MDPI and/or the editor(s). MDPI and/or the editor(s) disclaim responsibility for any injury to people or property resulting from any ideas, methods, instructions or products referred to in the content. |
© 2026 by the authors. Published by MDPI on behalf of the World Electric Vehicle Association. Licensee MDPI, Basel, Switzerland. This article is an open access article distributed under the terms and conditions of the Creative Commons Attribution (CC BY) license.