Article

Systematic Planning of Electric Vehicle Battery Swapping and Charging Station Location and Driver Routing with Bi-Level Optimization

School of Transportation and Logistics Engineering, Shandong Jiaotong University, Jinan 250357, China
*
Author to whom correspondence should be addressed.
World Electr. Veh. J. 2025, 16(9), 499; https://doi.org/10.3390/wevj16090499
Submission received: 1 June 2025 / Revised: 15 August 2025 / Accepted: 1 September 2025 / Published: 4 September 2025

Abstract

The rapid growth of electric vehicles (EVs) has significantly increased the demand for charging infrastructure, posing a challenge in balancing charging demand and infrastructure supply. The development of battery swapping and charging stations (BSCSs) is crucial for addressing these challenges and serves as a fundamental pillar for the sustainable advancement of EVs. This study develops a bi-level optimization model for the location and route planning of BSCSs. The upper-level model optimizes station locations to minimize total cost and service delay, while the lower-level model optimizes driver travel routes to minimize total time. An updated Non-Dominated Sorting Genetic Algorithm (UNSGA) is applied to enhance solution efficiency. The experimental results show that the bi-level model outperforms the single-level model, reducing total cost by 1.5% and travel time by 6.6%. Compared to other algorithms, the UNSGA achieves 9.43% and 8.23% lower costs than MOPSO and MOSA, respectively. Furthermore, BSCSs, despite 15.42% higher construction costs, reduce driver travel time by 22.43% and waiting time by 71.19%, highlighting their operational advantages. The bi-level optimization method provides more cost-effective decision support for EV infrastructure investors, enabling them to adapt to dynamic drivers’ needs and optimize resource allocation.

Graphical Abstract

1. Introduction

The global emphasis on environmental protection and energy transition has accelerated the growth of the electric vehicle (EV) industry, resulting in a continuous increase in market demand. As a sustainable and efficient mode of transportation, EVs are emerging as a key trend in the future of mobility [1,2]. However, the widespread adoption of EVs has revealed key challenges in charging infrastructure, such as facility shortages, long queuing times, high costs, inefficient layouts, and poor management. The charging and queuing problem is a result of the limitation of land resources, high construction and operation costs, and inconsistent technical standards. Reasonable planning of the location and routing of EV battery swapping and charging stations (BSCSs) is important for improving the convenience of EVs, promoting the enhancement of the EV industry, and achieving sustainable transportation [3]. In response to these challenges, several cities have begun deploying comprehensive BSCS networks that integrate both battery swapping and charging services. These mixed-service stations provide efficient energy replenishment solutions for EV users, enabling faster turnaround and improved convenience. Combining charging and battery swapping in a single infrastructure represents an emerging scenario with significant research potential and practical value for the development and planning of EV infrastructure.
In order to improve the coverage and rationality of BSCSs, enhance the level of charging technology, and establish mature business models, investigators have started to attempt to introduce objective optimization methods to analyze the characteristics of various problems in BSCS, in order to broaden the thinking of planning methods. However, single objective optimization often only focuses on one objective and ignores other important factors, making it difficult to meet the needs of practical problems [4]. The location and route planning of EV BSCSs is a complex multi-objective optimization (MOO) problem. On the one hand, it is necessary to consider minimizing the total cost, and on the other hand, it is necessary to minimize the total service delay. MOO aims to simultaneously optimize multiple conflicting objective functions in order to find a set of optimal solutions that balance different objectives. As a powerful optimization algorithm, the Non-Dominated Sorting Genetic Algorithm (NSGA) possesses the benefits of robust worldwide searching capabilities, good adaptability, and high parallelism, making it appropriate for resolving MOO problems [5]. This research aims to design a multi-objective bi-level optimization model based on the NSGA to meet the various charging needs of EV drivers, obtain suitable planning solutions, and provide guarantees for the sustainable development of the transportation industry. The novelty of this research can be divided into two aspects. Firstly, a multi-objective bi-level optimization model integrating both charging and battery swapping modes is developed, addressing the hybrid charging scenario rarely considered in existing studies. Secondly, the research fully considers multiple limiting factors in practical application scenarios. And it establishes bi-level models to more accurately meet the diverse charging needs of EVs. There are three primary contributions of this paper:
First, a bi-level programming framework is constructed to jointly optimize the location of battery swapping and charging stations (BSCSs) and the routing behavior of electric vehicle users. This structure enables hierarchical coordination between infrastructure investment and user demand, improving planning rationality and operational efficiency.
Second, this study incorporates EV user behavior analysis to examine how drivers respond to different service conditions, such as battery levels and queuing times. The results provide decision-making support for designing user-oriented charging and swapping infrastructure.
Finally, a comparative analysis is conducted between hybrid charging–swapping stations and traditional charging-only stations. The results demonstrate that BSCSs offer superior cost-efficiency and service satisfaction under different planning scenarios. The findings provide theoretical support and practical guidance for the commercial deployment of mixed charging infrastructure.
The remainder of this paper is organized as follows. Section 2 reviews the relevant literature on EV charging infrastructure planning and optimization techniques. Section 3 defines the problem and design of the bi-level solving scheme. Section 4 introduces the notation and mathematical formulation. Section 5 presents the updated NSGA used for model optimization. Section 6 conducts a case study and analyzes the model’s performance. Section 7 concludes this study and discusses future research directions.

2. Literature Review

Early studies on the location and sizing of EV CSs primarily adopted deterministic or single-objective formulations aimed at minimizing either construction or travel costs [6]. Subsequent works introduced MOO methods to balance system cost, service quality, and spatial coverage, with objectives including minimizing cost, user delay, and unmet demand [6,7]. Geographic information system (GIS)-based approaches have been applied to filter candidate sites using land use, grid access, and traffic flow data, thereby enhancing spatial realism [8]. However, most of these models treat user demand as static and ignore feedback effects between station placement and routing or congestion. Another stream of research integrates queuing models into station planning, recognizing that waiting time is a major determinant of perceived service quality [4]. These models account for arrival rates, station capacity, and dwell times, revealing that cost-driven designs alone can create congestion externalities that degrade service performance.
While the majority of research has focused on pure CSs, recent work has examined hybrid battery swapping and charging stations (BSCSs) to alleviate long charging times and improve peak throughput. Battery swapping can reduce dwell times and smooth load profiles. This heterogeneity complicates inventory management and limits coverage. Some studies address this by treating swap penetration as a scenario variable or by segmenting the fleet into compatible and incompatible classes. Even moderate swapping penetration has been shown to reduce charging congestion, but its cost advantage depends heavily on swap-pack inventory strategies and logistics operations [9,10].
Bi-level optimization has emerged as a natural framework for EV infrastructure planning, with investors in the upper level determining station locations and capacities, and users in the lower level choosing routes and refueling actions [6,8,9]. Compared to sequential two-stage models, bi-level formulations capture the feedback between infrastructure layout and user response, reducing the risk of suboptimal deployment. Lower-level models range from shortest-path formulations with range constraints [8] to stochastic user equilibrium with time-dependent costs [4,11]. Given the computational complexity of exact bi-level models, researchers often adopt multi-objective evolutionary algorithms (MOEAs), such as the NSGA-II [6,12], Multi-Objective Particle Swarm Optimization (MOPSO) [13], or Multi-Objective Simulated Annealing (MOSA) [14], with enhancements including adaptive crossover/mutation rates and elitist strategies to maintain solution diversity.
Recent studies have highlighted the importance of incorporating driver heterogeneity, including range anxiety, value of time, and detour tolerance [6,7]. Integrating Origin–Destination (OD) demand patterns and time-of-day variations can shift optimal station placement toward high-betweenness corridors and hubs, while capacity must be tuned to empirical arrival distributions to avoid bottlenecks. For BSCSs, user routing decisions are also influenced by swap availability and the perceived reliability of charged inventory, linking route choice directly to station-level inventory management.
Infrastructure planning interacts closely with power system constraints and logistics operations. For CSs, transformer capacity limits and time-of-use tariffs affect operational costs and encourage load shifting [8,10]. For BSCSs, swap-pack inventory management and charging cycles introduce an additional battery logistics layer, including inventory sizing, recharge scheduling, and inter-station redistribution [10]. Neglecting these factors can lead to underestimation of costs or overestimation of service reliability, especially under peak demand conditions.
Despite advances, three main gaps remain: (1) limited treatment of hybrid infrastructures: few studies jointly optimize CS–BSCS networks under realistic compatibility and inventory constraints; (2) insufficient integration of behavior and layout: sequential models often ignore the feedback between routing and location decisions; and (3) lack of algorithmic adaptability: many MOEAs use static parameters, whereas adaptive operators can improve feasibility and Pareto-front quality in bi-level settings [11]. This study addresses these gaps by conducting the following: proposing a bi-level, multi-objective model for BSCS location and driver routing with explicit service-delay terms; considering hybrid charging–swapping networks with scenario-based swapping compatibility; and developing an improved NSGA with elitism and adaptive probabilities to enhance convergence and diversity. The model is validated on a real urban network using OD-based demand data and is compared with MOPSO, MOSA, and a two-stage baseline.

3. Problem Description and Design of the Solving Scheme

3.1. Problem Description

With the continual advancement of technology and the ongoing implementation of supportive policies, the number of EVs is growing rapidly, which in turn increases the demand for efficient charging and swapping infrastructure. Although the current number of BSCSs and their development scale remain limited, the BSCS mode represents a forward-looking approach to EV infrastructure. By integrating battery swapping and charging in a single station, BSCSs address key challenges in energy replenishment, reduce user waiting time, and improve overall convenience. Therefore, studying the location and routing optimization of BSCSs is not only relevant for emerging pilot projects but also provides valuable insights for future large-scale deployment, making this research both timely and forward-looking [11].
In our problem, the decision-makers in the upper-level location model are the investors who must select N sites from M candidate locations to establish BSCSs, where N < M. Investors need to balance the number of stations with driver experience while considering various costs and land constraints, aiming to achieve a high level of driver satisfaction at a relatively low construction and operational cost. The decision-makers in the lower-level model are EV owners, whose primary objective is to minimize their total travel time, which includes both driving time and detention time at the station.
EV drivers depart from their original location, based on their remaining battery level and personal needs, and navigate to the nearest established BSCS. Upon arrival, they assess the waiting time and their current battery status before deciding whether to charge or swap their battery. Finally, they continue their journey toward their destination. The time drivers spend at the station is fed back to the upper-level decision-makers, who use this data to refine the station layout. This feedback mechanism allows investors to continuously optimize BSCS locations, ensuring an improved driver experience while maintaining cost efficiency. Due to significant design differences across EV brands, it is difficult to accurately determine which vehicles are compatible with battery swapping services. Moreover, variations in battery health and degradation among individual vehicles make it challenging to estimate available charging capacity. To simplify the modeling process, the following assumptions are adopted:
(1)
All EVs are battery electric vehicles and capable of both charging and battery swapping.
(2)
The battery capacity of each EV has no significant variation.
(3)
EV arrivals follow a bimodal Poisson distribution.

3.2. Design of Bi-Level Solving Scheme

Understanding different Origin–Destination (OD) routes can help drivers choose the most convenient and efficient driving route, so that a suitable BSCS can be quickly found when charging is needed. The length of the OD path, traffic conditions, and other factors can also affect drivers’ charging needs and decisions [12]. By statistically analyzing the OD path data of a large number of EVs, potential high-demand areas can be identified, allowing for targeted planning of BSCS locations. The example of an OD travel path is represented in Figure 1.
As shown in Figure 2, when there are four nodes on the path, two BSCSs have two feasible solutions. In Figure 2a, it can be seen that the percentage of vehicle travel required for a car to cross the OD path between nodes is 40%, 60%, and 30%, respectively, which exceeds the energy capacity of a single charge. As shown in Figure 2b, when BSCSs are added at two consecutive nodes along the way, 50% of the power still remains after completing all trips, and the percentage of vehicle mileage at the second node is 72%. As shown in Figure 2c, when BSCSs are added at intervals, all power is consumed at the last node, and the percentage of vehicle mileage at the second node is 93%. Under the same total distance, the second solution requires less charging. In practical applications, GIS technology can be combined to conduct detailed analysis of urban transportation networks, land use, power supply layout, etc. The location of BSCSs is planned based on the traffic flow, distribution of EV ownership, and potential charging demand in different regions [15]. Specific evaluation factors need to be selected based on quantifiable indicators in GIS. The digital elevation model is integrated into GIS, distance buffering analysis is performed on the road network map of the power supply area, and the model is used as a reference object to perform hierarchical analysis on single factors. After assigning weights to each factor, the overall evaluation is calculated to ultimately select the appropriate location for the BSCSs [9]. The schematic diagram of the expanded network generation is shown in Figure 3.
As shown in Figure 3, after using GIS, it is found that when the shortest path between two nodes can be completed before the power is consumed, there is no need to charge at the intermediate node. As shown in Figure 3a, there are four initial nodes, and the power consumption decreases when one path is added. As shown in Figure 3b, after expanding the network, two artificial nodes are added to ensure the possibility of a round-trip. The power consumption of nodes 1 to 4 has undergone a transition, allowing them to travel from the departure node to the destination node at half battery level. This means that the EV can complete the round-trip travel without having to fully recharge at the intermediate nodes, further improving the energy efficiency and convenience of the charging infrastructure.
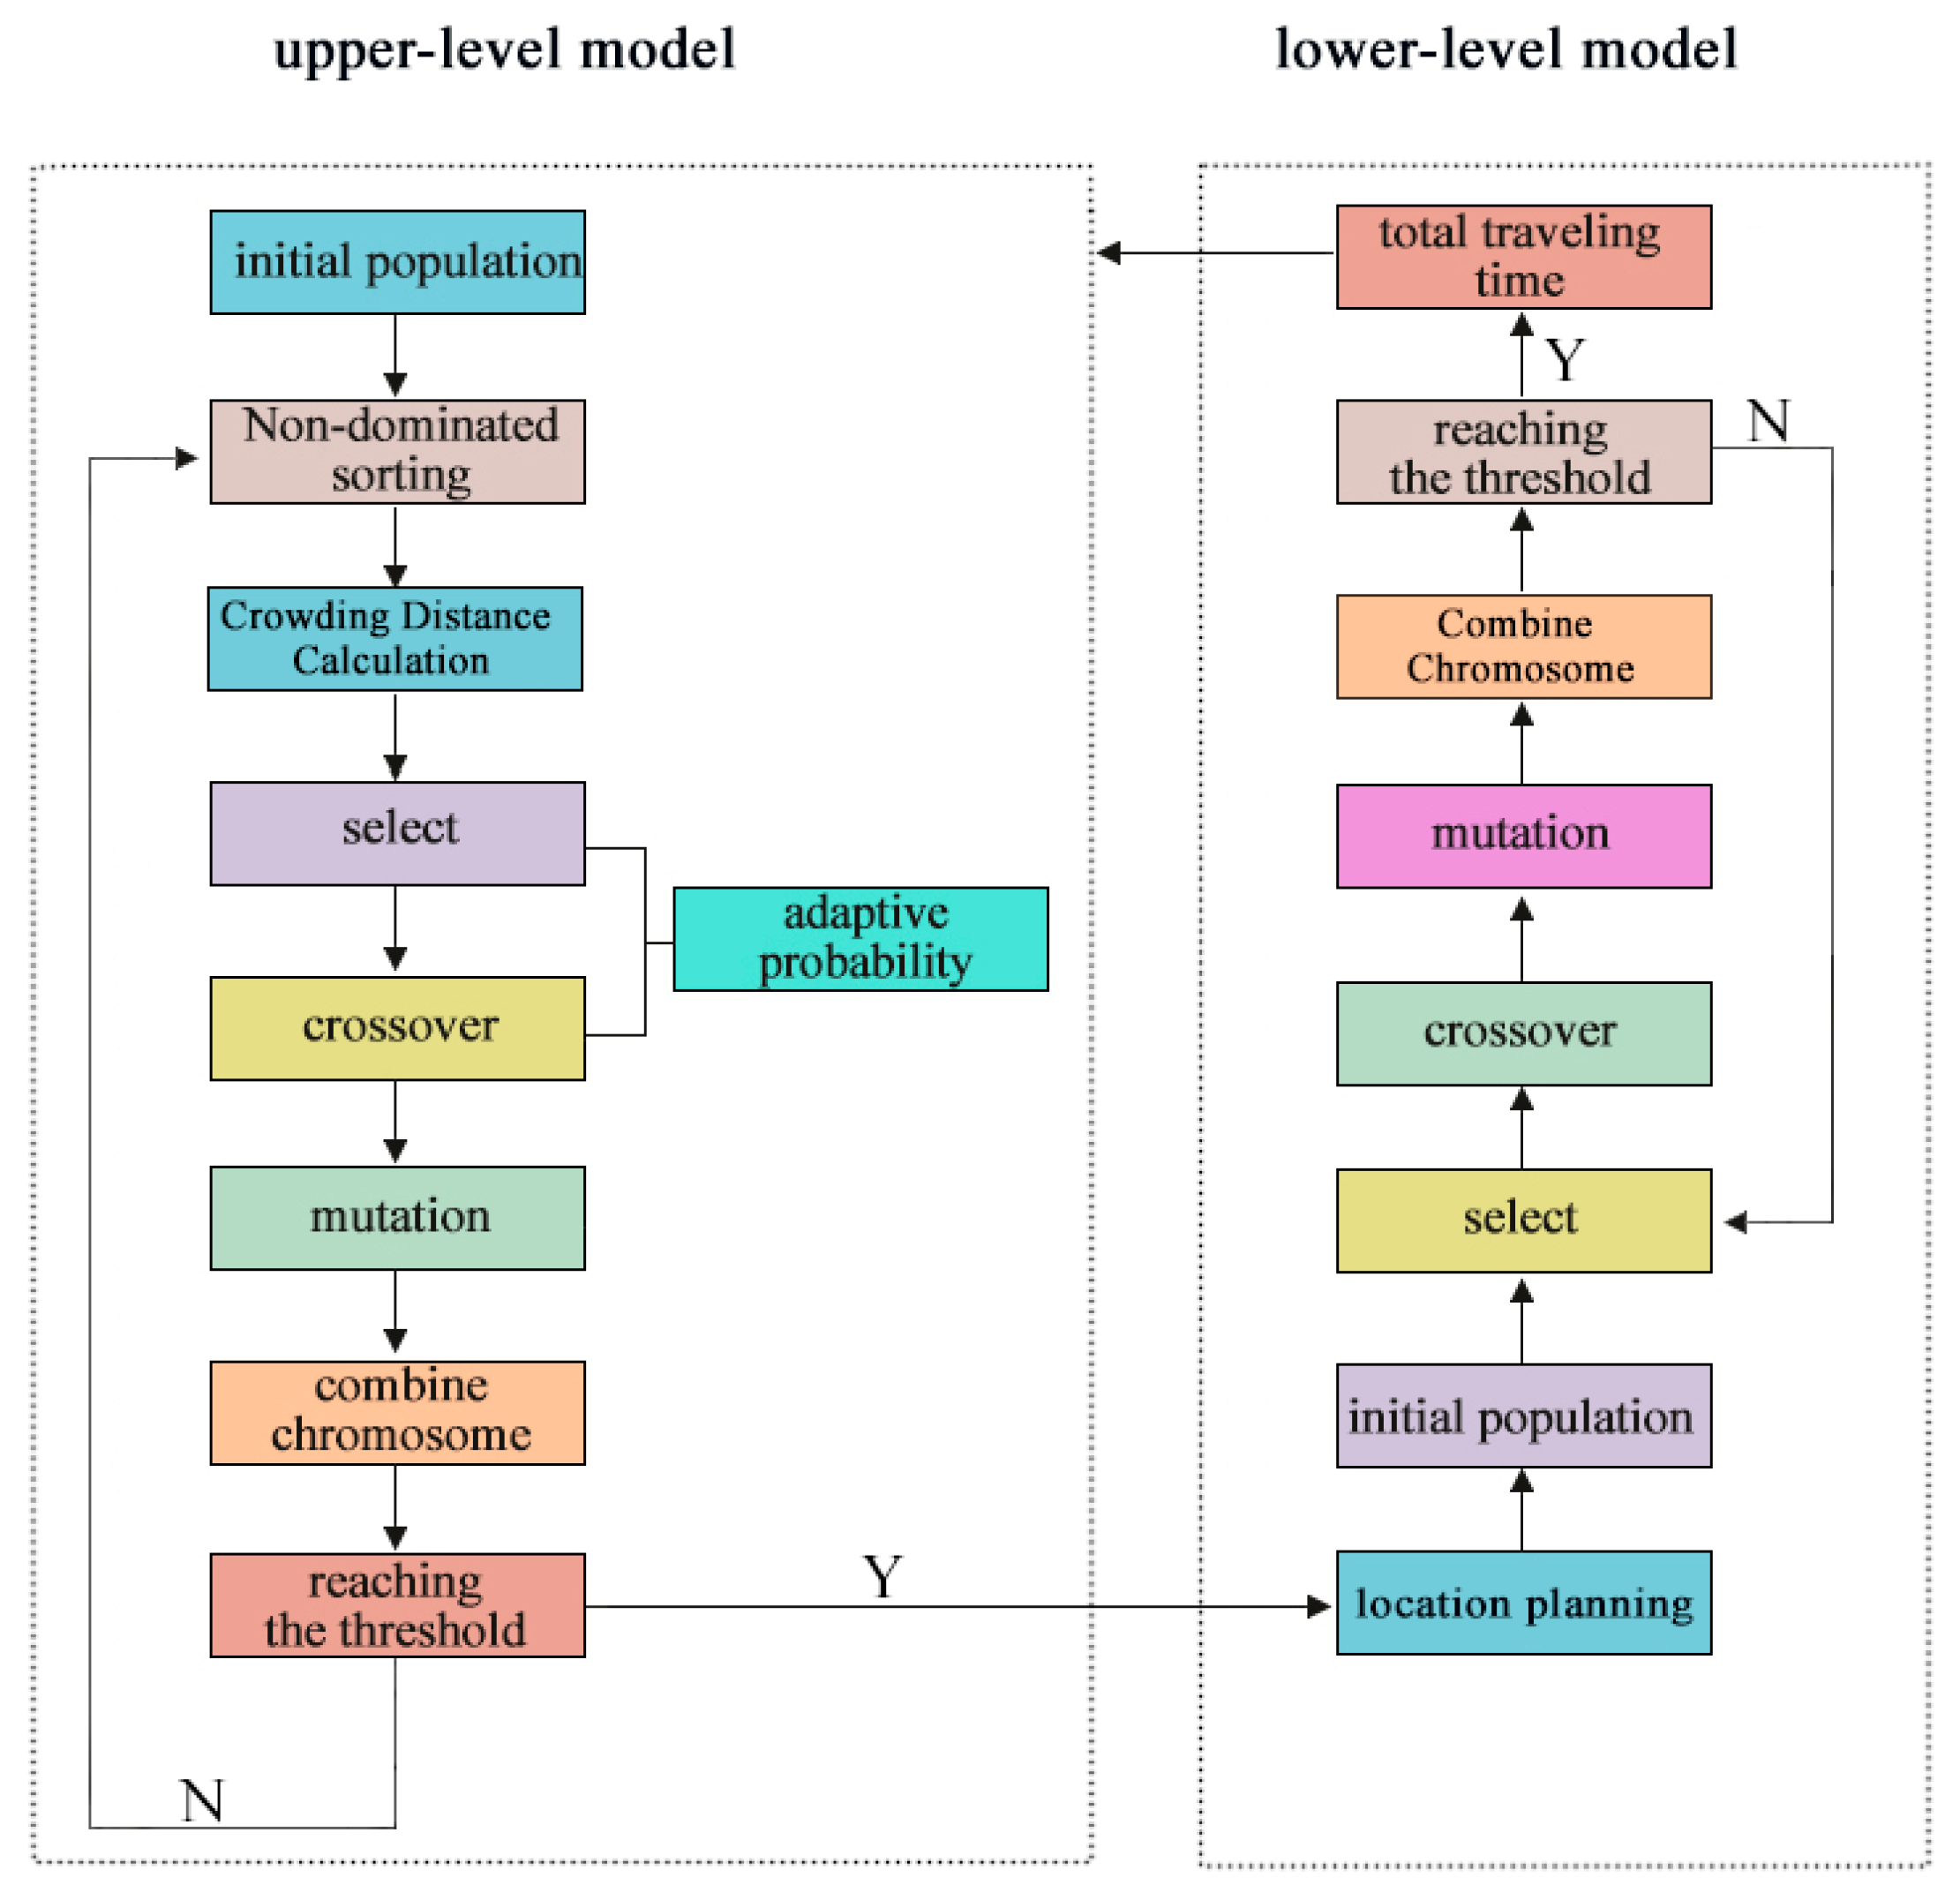
The bi-level model for the location and route planning of an EV BSCS is shown in Figure 4.
As shown in Figure 4, the model for the location and route planning of an EV BSCS is divided into two levels. The upper-level model determines the location of the BSCS based on minimizing the total cost and service delay while simultaneously considering the coverage area and service quality of the BSCS. The entire cost consists of the construction cost, operation cost, and charging cost. Service delays include waiting time for the EV to arrive at the BSCS and charging and battery swapping time. The waiting time can be calculated based on the capacity of the BSCS and the arrival rate of EVs. The service time can be calculated by the battery swapping capacity and the EV’s charging capability. The lower-level model determines route planning based on minimizing the total travel time, while considering traffic congestion and the range of the EV. This includes the travel time of EVs from the departure point to the BSCS, as well as the travel time from the BSCS to the destination. After clarifying multiple objective functions, a weighted sum is used to handle conflicts between multiple objective functions, and a multi-objective optimization model for EV BSCSs is constructed.

4. Formulation of a Bi-Level Optimization Model for Location and Route Planning of BSCSs

4.1. Upper-Level Model of Location

In the location planning of EV BSCSs, relying on a single-objective function often fails to capture the complexity of real-world requirements. In practice, both economic efficiency and service quality need to be considered simultaneously. Therefore, multiple objectives should be incorporated, including minimizing drivers’ charging or swapping time, minimizing construction and operational costs of BSCSs, and ensuring adequate coverage and accessibility for EV users.
The upper-level model is primarily designed to determine the optimal locations of BSCSs by balancing these competing objectives. Specifically, it aims to achieve the following:
1.
Minimize total costs: This includes the fixed investment for constructing stations, operational costs, and costs associated with component usage and battery distribution.
2.
Minimize service delay for drivers: Efficient service reduces waiting times and improves user satisfaction. The model evaluates service delays based on drivers’ arrival times and the times when they actually receive charging or swapping services.
3.
Satisfy practical constraints: Station capacity, geographic coverage, and the maximum number of stations are explicitly considered to ensure feasibility and operational reliability.
By explicitly formulating these objectives, the upper-level model provides a systematic framework for selecting BSCS locations that can effectively balance cost efficiency and user satisfaction. The output of this model serves as input for the lower-level routing optimization, which determines optimal EV paths and charging strategies.
P1:
M i n   C   =   min ( S w   +   C T   +   C Z   +   C s   +   C d ) D i M i n   Z   =   min S d
subject to:
k K d k t k   +   i N 0 f i a i     P 0
d min     d i j     d max
Q i     Q max
Q min   <   Q i
i = 1 n D i     M
( 1   +   Y k i ) D i > 0 ,       i N *
k = 1 K Y k i S i     U max
S i n   =   S i s     S ir , S i r     0.5 S i s 0 , S i r   >   0.5 S i s
D i   =   1     if   a   charging   station   is   located   at   node   i , 0     otherwise .         i N o
Y k i   =   1 ,   if   t w i   <   t c 0 ,   otherwise
Equation (1) represents the multi-objective function, aiming to minimize the total cost associated with the construction and operation of BSCSs, including construction costs, transportation costs, component losses, charging and swapping service costs, battery dispatching costs, and service delay time; Sw is the total costs of the BSCSs, CT is the transportation cost, Cz is the cost of component loss, Cs is the total charging service and swapping service costs, Cd is total cost of battery dispatching, Sd is the service delay time, and Di is the decision variable. Equation (2) imposes a constraint on the fixed cost, ensuring that it does not exceed the available budget, thereby guaranteeing economic feasibility. dk is the budget k requirement for OD, tk is the amount of electricity required to complete the trip, fi is the fixed cost of setting up the BSCS, ai is the node location i conditions of a BSCS, and f0 is the maximum budget. Equation (3) specifies the minimum and maximum allowable distances between stations to avoid excessive proximity that could lead to resource waste, as well as overly large distances that could result in insufficient service coverage. dmin is the minimum distance from one charging station to another, dmax is the maximum distance from one charging station to another, and dij is the distance between charging station i and charging station j . Equations (4) and (5) constrain the maximum and minimum service capacities of each station, ensuring that stations are neither overloaded nor underutilized. Qi is the total number of services provided by charging station i, Qmax is the maximum service capacity of the charging station, and Qmin is the minimum number of services to ensure the operation of the charging station. Equation (6) limits the total number of BSCSs to be constructed, considering that each station requires significant land occupation and imposes a substantial load on the power grid. Therefore, the number of stations must be controlled to balance infrastructure availability, investment constraints, and grid stability. Equation (7) ensures that station i , selected by driver k , exists. Equation (8) limits the utilization rate of battery swapping equipment to prevent overload, Si is the capacity of the swapping service at station i , and Umax is the maximum swapping service rate. Equation (9) regulates the battery replenishment quantity to avoid insufficient inventory, S n i is the battery replenishment quantity of station i , S i s is the maximum stocking capacity of batteries at station i , Sir is the current quantity of batteries at station i , Equations (10) and (11) are decision variable constraints, t w i is the waiting time of user i, and tw is the charging time.
The specific formulations of the multi-objective function are as follows:
S W   =   S j   +   Z j
T   =   j J r R C r j d r j l r
C z   =   k K C k X k
C s   =   i = 1 N k = 1 K ( 1     Y k i ) C e c   +   Y k i C e s
C d   =   C d i N b
S d   =   i = 1 N ( t i s     t i a )
Equation (12) represents the construction and operating costs of each BSCS. The fixed investment Sj includes the land cost, construction cost, and equipment cost required to build the station, while the operating cost Zj covers daily maintenance, labor, and energy consumption. Considering the need to deliver electricity from the power transmission center to each BSCS, Equation (13) captures the corresponding transportation cost, Crj is the freight rate, drj is the relative distance between the power transmission centers and drivers, and Lr is the power consumption. Equation (14) quantifies the cost of component loss to account for wear and usage of the BSCS, where Ck is the fixed cost of component operation, and Xk is usage of the BSCS. Equation (15) represents the total cost of charging and swapping services at the BSCS, where C e c is the cost of the charging service, and C e s is the cost of the swapping service. Equation (16) represents the cost of battery dispatching from the distribution center, where C d i is the cost of dispatching from the distribution center, and Nb is total number of batteries required to be distributed. Equation (17) expresses the maximum satisfaction as the minimum service delay, calculated based on the difference between the arrival time and the service start time of each EV, where t i s is the time when the ith EV arrives at the charging station, and t i a is the time when the ith EV starts receiving service.

4.2. Lower-Level Model of Routing

The lower-level model focuses on optimizing the routing of electric vehicles (EVs) to minimize total travel and service time. While the upper-level model determines the locations of battery swapping and charging stations (BSCSs), the lower-level model addresses the operational aspect of EV movement, determining which stations drivers should visit and in what sequence. Practical feasibility is ensured by imposing constraints such as the maximum number of vehicles that a single BSCS can serve, limiting each driver to receive service only once during the planning horizon, and restricting drivers’ travel distance and waiting time to maintain satisfactory service levels. By explicitly defining these constraints, the lower-level model evaluates feasible routing plans for all drivers based on the locations of BSCSs determined in the upper-level model. Its objective is to minimize total travel and waiting times while respecting operational limits, thereby improving service efficiency and user satisfaction. Additionally, the outputs of the lower-level model can be fed back to the upper-level model in an iterative bi-level optimization process to further refine station locations.
P2:
M i n   T t o t a l   =   i = 1 n Z i m ( T i m   +   t i m )
subject to:
t m w   <   t max u
d m i     d max u
T l o w     T i     T h i g h ,     i
i = 1 n Z i m   =   1
Z i m ( E i m   +   ο     μ E m l )     0
m = 1 M Z m i ( t )     C i ( t )   +   β
Z i m   =   1   if   user   m   travels   to   charging   station   i   0   otherwise
Equation (18) minimizes the total travel time of EVs from their starting points to the charging stations and during charging service, Z l m is the decision variable, Ttotal is the total travel time from the starting point to the charging station, T i m is the time when electric vehicle m travels to charging station i , and t i m is the time when EV m receives service at charging station i . Equations (19) and (20) represent the constraints on the maximum detour distance and the maximum time that EV drivers are willing to wait, ensuring service remains acceptable, where t m w is the waiting time of the driver m , t m a x u is the maximum time that the driver will wait, d m i is the distance from driver m to the charging station i , and d max u is the maximum distance that the driver will accept. Equation (21) represents the adaptation constraints between a BSCS and the surrounding traffic flow, ensuring that station operations remain compatible with road conditions. Ti is the average traffic flow of roads around the charging station i during peak hours, Tlow is the lower limit of the set adaptive traffic flow, and Thigh is the upper limit of the set adaptive traffic flow. Equation (22) represents the service frequency constraint, ensuring that each EV driver can receive charging or swapping service only once during a single trip. Equation (23) represents the energy constraint of EVs traveling to a BSCS, ensuring that vehicles have sufficient energy to reach the station safely under traffic conditions, where E i m is the required energy from driver m to BSCS i , E m l is the remaining energy of user m , o is the safety energy, and μ is the traffic congestion coefficient [16]. Equation (24) represents the maximum number of vehicles that can travel to a BSCS during a given period, ensuring that the station does not exceed its service capacity, where Ci(t) is the service capacity of station i during t period, and β is the coefficient of queuing. Equation (25) is a decision variable constraint.

5. Design of an Updated NSGA

After building a bi-level model for the location and route planning of BSCSs, the NSGA is applied to address the upper-level model due to its suitability for solving non-deterministic polynomial (NP-hard) problems. When solving the location and route planning problem for EV BSCSs, the NSGA can increase the possibility of finding global optimal solutions or approximate global optimal solutions by simulating biological evolution processes. Traditional genetic algorithms may find it difficult to find satisfactory solutions when dealing with multi-objective optimization problems due to conflicts between objectives. The NSGA is a multi-objective optimization genetic algorithm based on the Pareto optimal. It was proposed by Srinivas and Deb in 1995, and it solves the multi-objective optimization problem. Meanwhile, the research aims to improve the performance of algorithms in multi-objective optimization problems by introducing elite retention strategies and adaptive probability to better balance the relationships between multiple objectives.
This paper incorporates an adaptive probability mechanism that dynamically adjusts these rates based on population diversity and convergence status. When diversity decreases or premature convergence occurs, mutation probability increases to enhance exploration and avoid local optima; when far from convergence, crossover probability is prioritized to accelerate convergence. This adaptive strategy improves search flexibility, solution quality, and robustness.
As shown in Figure 5, in the optimization process, an updated NSGA is applied to the bi-level model. The steps of the updated NSGA are as follows:
Step 1: Initial population. Randomly generate the initial population P0,
P 0   =   x 1 , x 2 , , x n , x i R n
where xi represents the ith individual, and n represents the population size.
Step 2: Non-dominated sorting and Crowding Distance Calculation:
m 1 , 2 ,   f m x i     f m x j   a n d   m ,   f m x i   <   f m x j
where fm(xi) represents the fitness value of the mth objective function for the individual xi. If Equation (27) holds, then xi is said to dominate xj. Based on this dominance relationship, the population is divided into multiple non-dominated fronts, F1, F2, …, Fn, where F1 contains all non-dominated solutions. Once the non-dominated sorting is completed, the crowding distance for each solution is calculated. In the NSGA, the crowding distance is a metric used to estimate the density of solutions surrounding a particular solution in the objective space, which helps maintain population diversity. For each objective function, fm individuals within a given front are sorted in ascending order. The boundary individuals are assigned an infinite crowding distance to ensure they are always selected. For an individual x, the crowding distance for objective m is calculated as follows:
d m ( x )   =   f m ( x i + 1 )     f m ( x i 1 ) f m max     f m min
where xi+1 and xi−1 are the immediate neighbors of x in the sorted order for objective m, and f m max and f m min represent the maximum and minimum values of f m in the front.
The overall crowding distance for x is then given by summing the distances over all objectives:
d ( x )   =   m = 1 2 d m ( x )
Step 3: Select an adaptive crossover and mutation.
Based on crowding distance and non-dominated sorting, a subset of chromosomes is selected; individuals with lower crowding distances are more likely to be selected, while those with higher non-dominated rankings are more likely to be selected. Then, the selected individuals undergo crossover and mutation operations, where the crossover probability and mutation probability are as follows:
P c   =   P c max     P c max     P c min 1 R i
P m   =   P m min   +   P m max     P m min R i     1 R i
where P c is the crossover probability, P c max is the maximum crossover probability, and P c min is the minimum crossover probability. R i represents the non-dominated ranking of individual i. Similarly, P m is the mutation probability, P m min is the minimum mutation probability, and P m max is the maximum mutation probability. By employing adaptive crossover and mutation probabilities, the search space of solutions is enhanced, thereby preventing premature convergence and reducing the likelihood of the solution set becoming trapped in local optima.
Step 4: Chromosome merging and iteration.
After the crossover and mutation operations are completed, the chromosomes from both the parent and offspring populations are merged and subjected to non-dominated sorting, thus eliminating the individuals with poorer fitness. If the current iteration has not reached the maximum limit, the process returns to Step 2; otherwise, the final result is output.
Similarly, the lower-level model iterates through the steps of initializing the population, selection, crossover, and mutation until the threshold is reached, yielding the total travel time of drivers. This feedback further influences the decision-making of the upper-level model. The process is repeated until three iterations have been completed.

6. Case Study

6.1. Basic Information and Data

In order to analyze the effectiveness of the bi-level model for the location and route planning of EV BSCSs designed for research, and evaluate the computational performance of genetic algorithms on actual road networks, the basic performance of the research method was tested by comparing the calculation deviation, running time, and total costs of the algorithms. This study selected specific areas of Chengdu for the analysis and carried out a multi-objective optimization test of EV BSCS positioning and line planning in specific areas of Chengdu. The city of Chengdu was divided into multiple zones using GIS technology, including industrial, commercial, residential, and restricted areas. The rational layout of Chengdu city’s EV facilities provides effective methods and references. However, due to the large volume of data, the detailed test results are not presented in this study. By testing the network, we aimed to evaluate the positioning and line planning of target optimization effects to cope with the growing demand of EV drivers and further optimize the structure of urban traffic and energy.
This study used three different algorithms. The updated NSGA (UNSGA) was compared with the Multi-objective Particle Swarm Optimization (MOPSO) algorithm and the Multi-Objective Simulated Annealing (MOSA) algorithm to evaluate the relative advantages and disadvantages of the genetic algorithm in EV BSCS location and route planning problems. This paper introduces the two-stage model for comparison with the bi-level model. The two-stage model optimizes decisions sequentially in two separate phases, treating location decisions first and routing decisions second. In contrast, the bi-level model integrates these decisions hierarchically, where the upper-level problem influences the lower-level problem, allowing for a more coordinated and interactive optimization process.
Considering the conflict between functional objectives, the upper-level decision-makers prioritize the lowest-cost solution, while the lower-level decision-makers prefer the most convenient option. Since investors, as the upper-level decision-makers, typically hold a dominant position in practice, the location solution is chosen from the Pareto front generated by the upper-level model based on the lowest cost. The lower-level decision-makers then provide feedback and further optimize the upper-level model accordingly.

6.1.1. System Cost Analysis

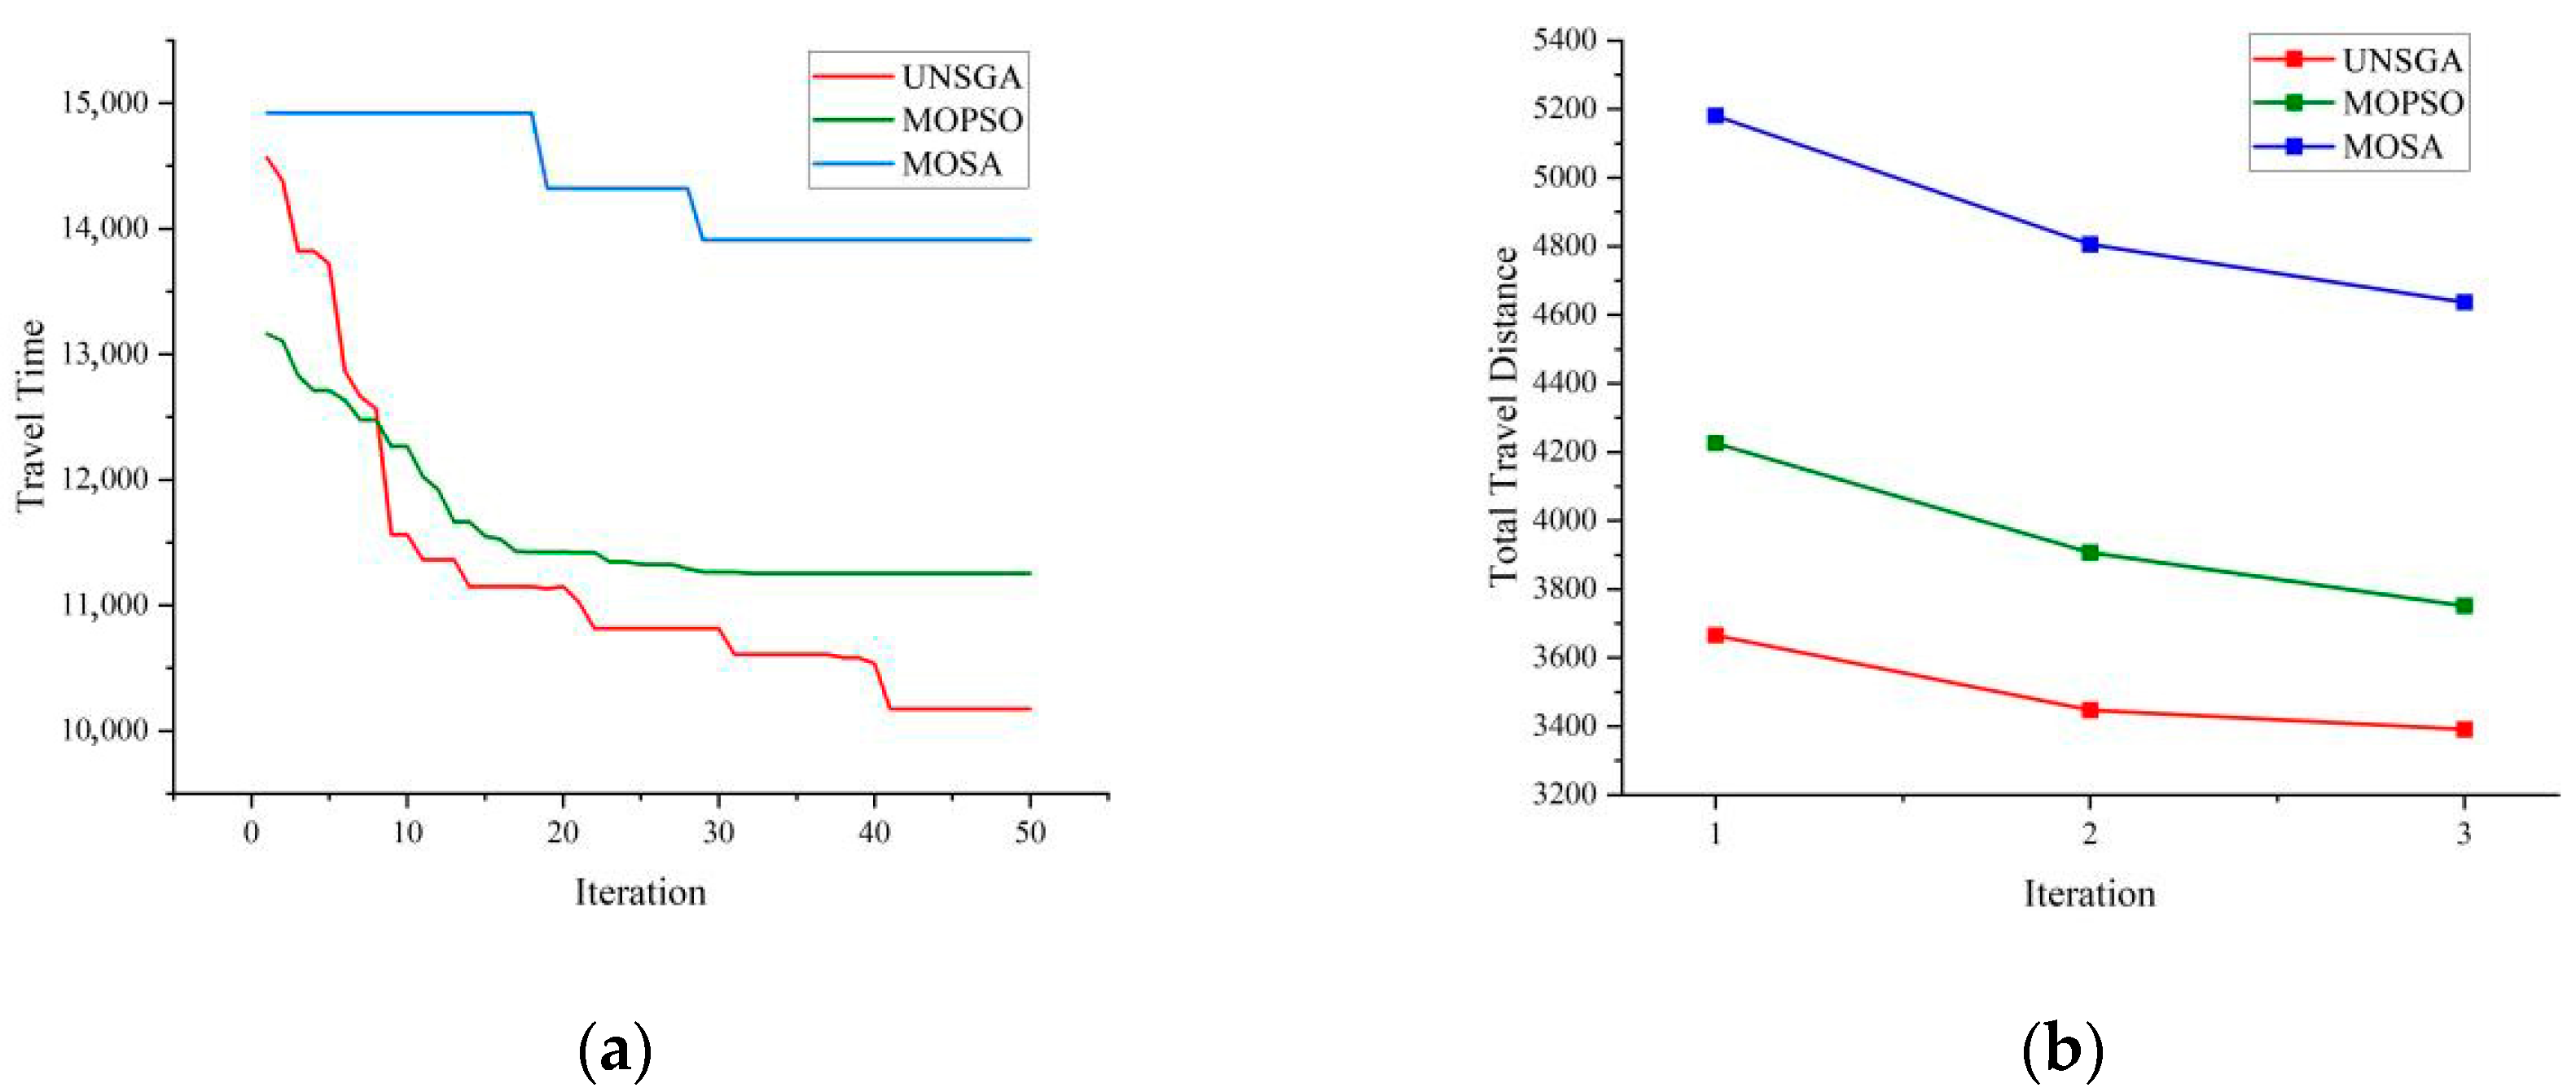
As shown in Figure 6a, the cost of the UNSGA is 9.43% and 8.23% lower than that of the MOPSO and MOSA algorithms, respectively. Figure 6b illustrates the performance of the three algorithms in the bi-level model, with the NSGA results being 9.29% and 7.90% lower than MOPSO and MOSA, respectively. Comparing graphs a and b in Figure 6, it can be observed that the bi-level model offers better optimization results. After two iterations of feedback from the lower-level model, the cost decreased by 1.67%.

6.1.2. User Travel Behavior Analysis

Figure 7a shows the number of OD pairs based on the two-stage model, and Figure 7b shows the number based on the bi-level model. Compared to the two-stage model, the number of OD pairs in the 0–10 km range increased by 4, the 20–40 km range decreased by 6, the 40–60 km range increased by 2, and there was no change in the 60–80 km range. Although some drivers’ travel distances increased, the average travel distance decreased by 10.26%. The bi-level model demonstrates superior performance in avoiding local optima.
Compared to the two-stage model Figure 8a, the bi-level model Figure 8b optimization reduces travel time by 6.60%, 11.22%, and 10.49%, respectively. In the bi-level model, the NSGA algorithm achieves the smallest optimization improvement of only 6.6%. However, in terms of travel time, the NSGA outperforms MOPSO and MOSA by 8.03% and 25.58%, respectively. The NSGA provides a more stable solution set, with better optimization ability and higher efficiency than the other two algorithms.
Under the bi-level optimization framework, the optimization results of the lower-level path planning model feed into the upper-level location decision-making. For example, with the NSGA, the lower-level model influences the upper-level model, reducing the total cost by 1.5%. After adjusting the upper-level model, the driver travel paths are further optimized, resulting in a 6.6% reduction in travel time. This demonstrates that the bi-level optimization model offers significant advantages over the two-stage model by better balancing infrastructure construction costs and driver travel efficiency and improving the overall planning outcome.

6.2. Performance Tests for BSCS Mode and CS Mode

6.2.1. Cost and Detention Time Analysis

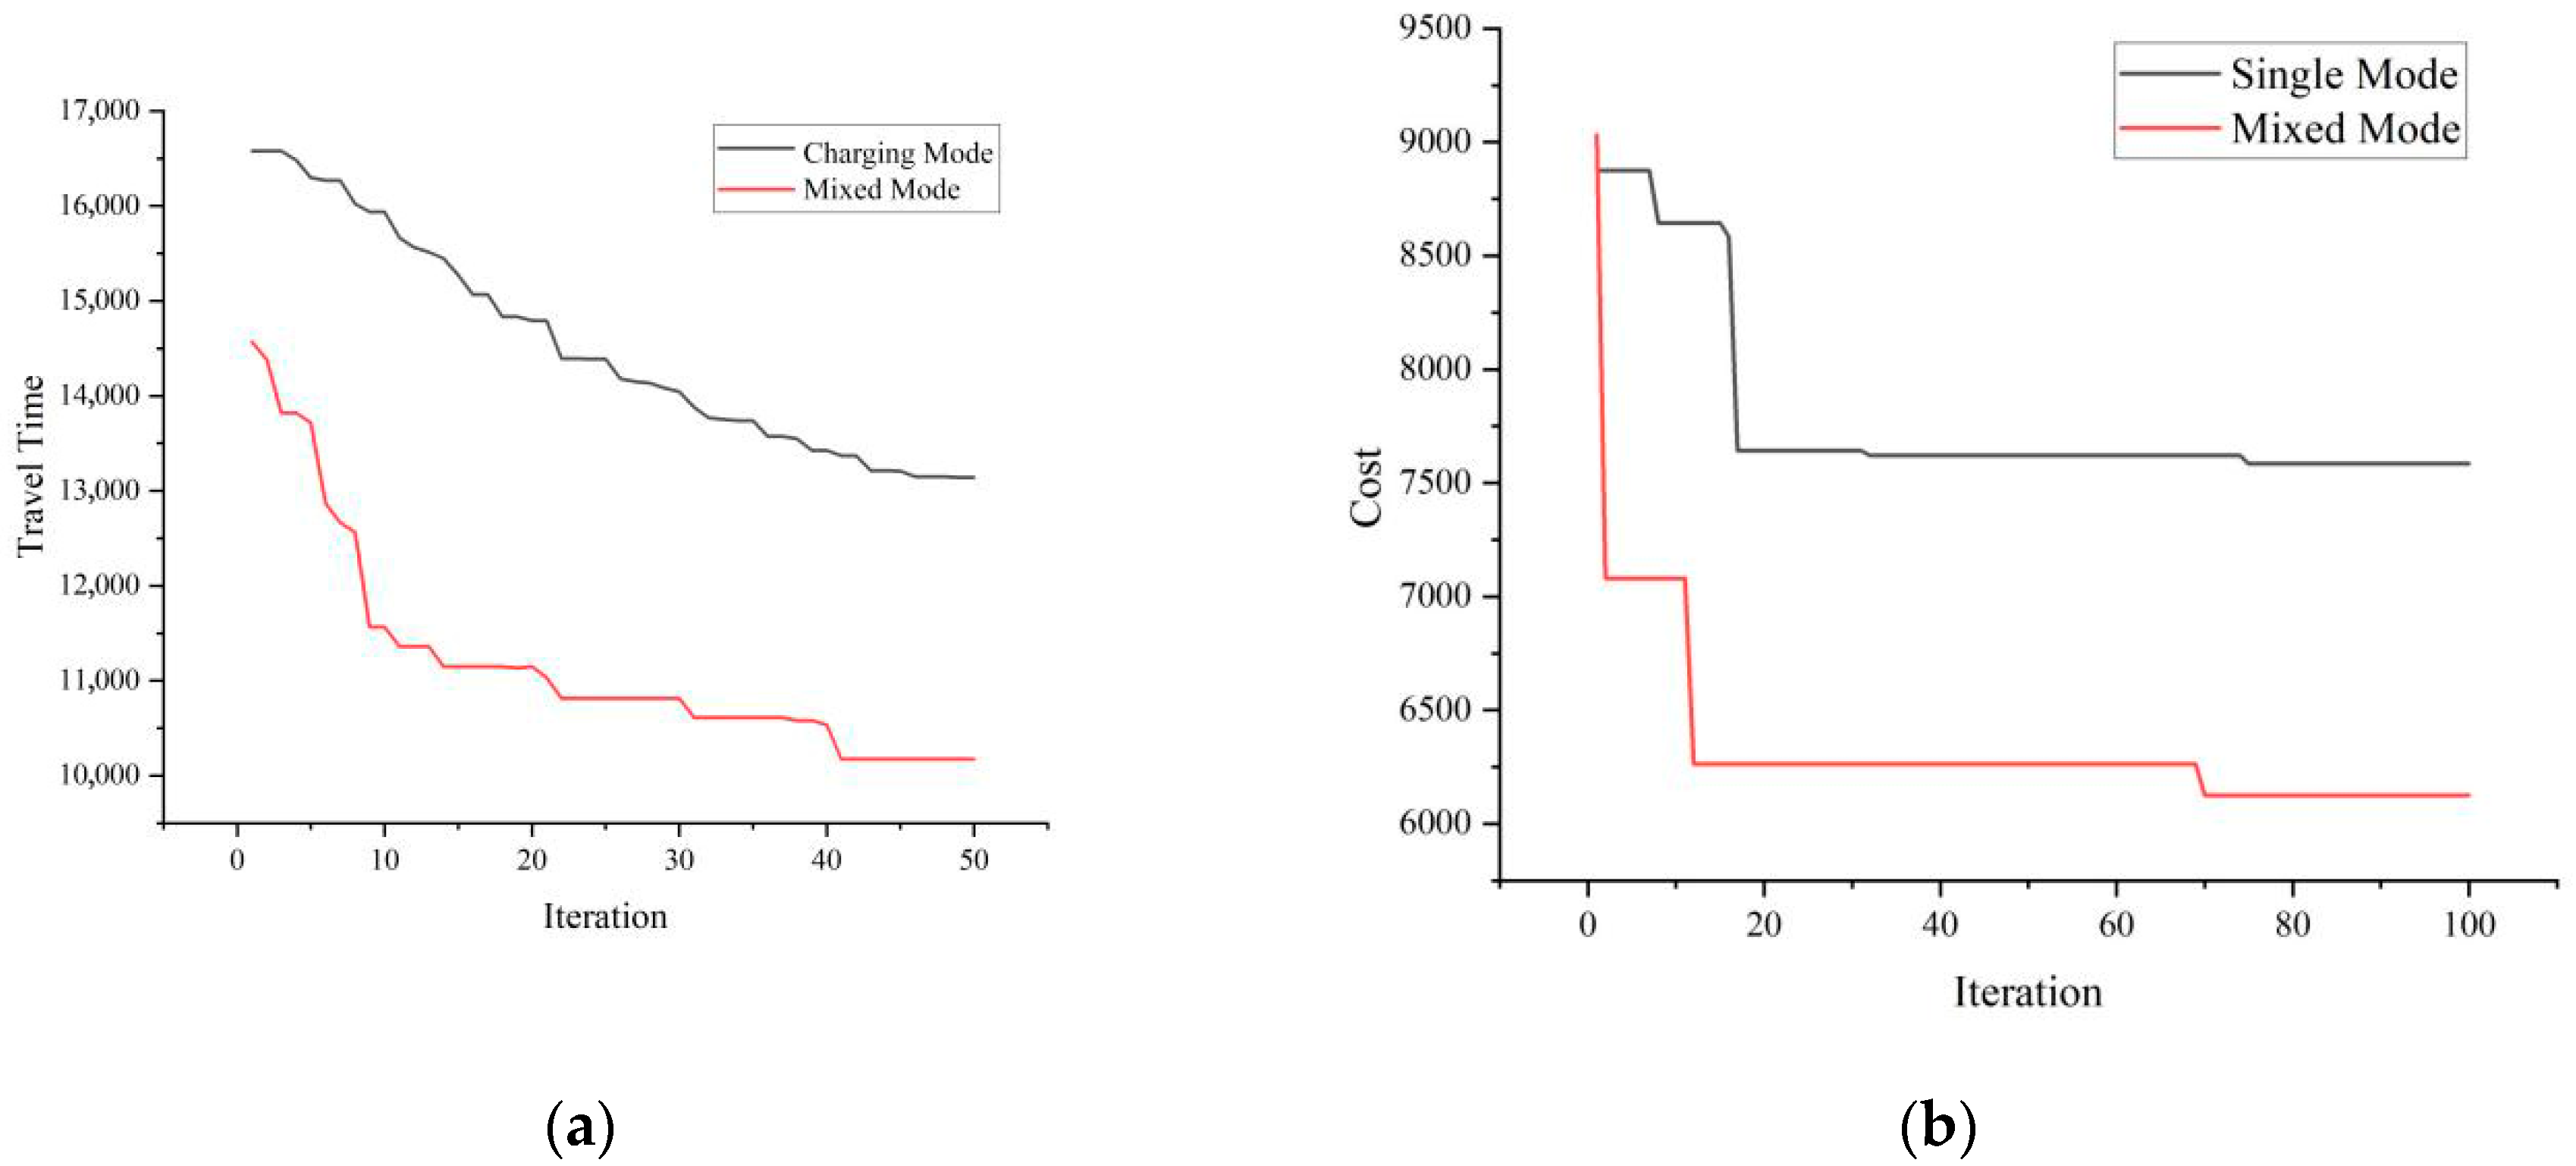
The test results based on replacing the BSCSs with CSs and removing all swapping services and related costs are shown in Figure 9.
As shown in Figure 9, it can be observed that the total cost of CSs using the UNSGA is 15.42% lower than that of BSCSs, with the reduced cost mainly attributed to construction costs. However, the drivers’ travel time increased by 22.43%, and the waiting time at CSs is 71.19% higher than that at BSCSs. Although the total cost of CSs is lower than that of BSCSs, 92.61% of the cost reduction comes from construction costs. The mixed mode requires a higher initial investment, but in terms of ongoing maintenance costs, the difference between the two models is minimal.
Figure 10 shows the detention time of charging drivers at the station under different modes. In the charging and swapping mode, 95% of charging drivers spend less than 60 min at the station, while in the charging-only mode, only 80% of charging drivers stay for less than 60 min. BSCSs effectively divert charging drivers, reducing the pressure on charging piles. The hybrid model helps reduce drivers’ waiting time at the station, improving overall service efficiency and market competitiveness.
Therefore, in EV infrastructure planning, despite requiring higher construction costs, investing in hybrid charging and swapping stations not only enhances the driver experience but also improves the operational efficiency of the new energy transportation system.

6.2.2. Performance of Satisfaction Rate Between CSs and BSCSs

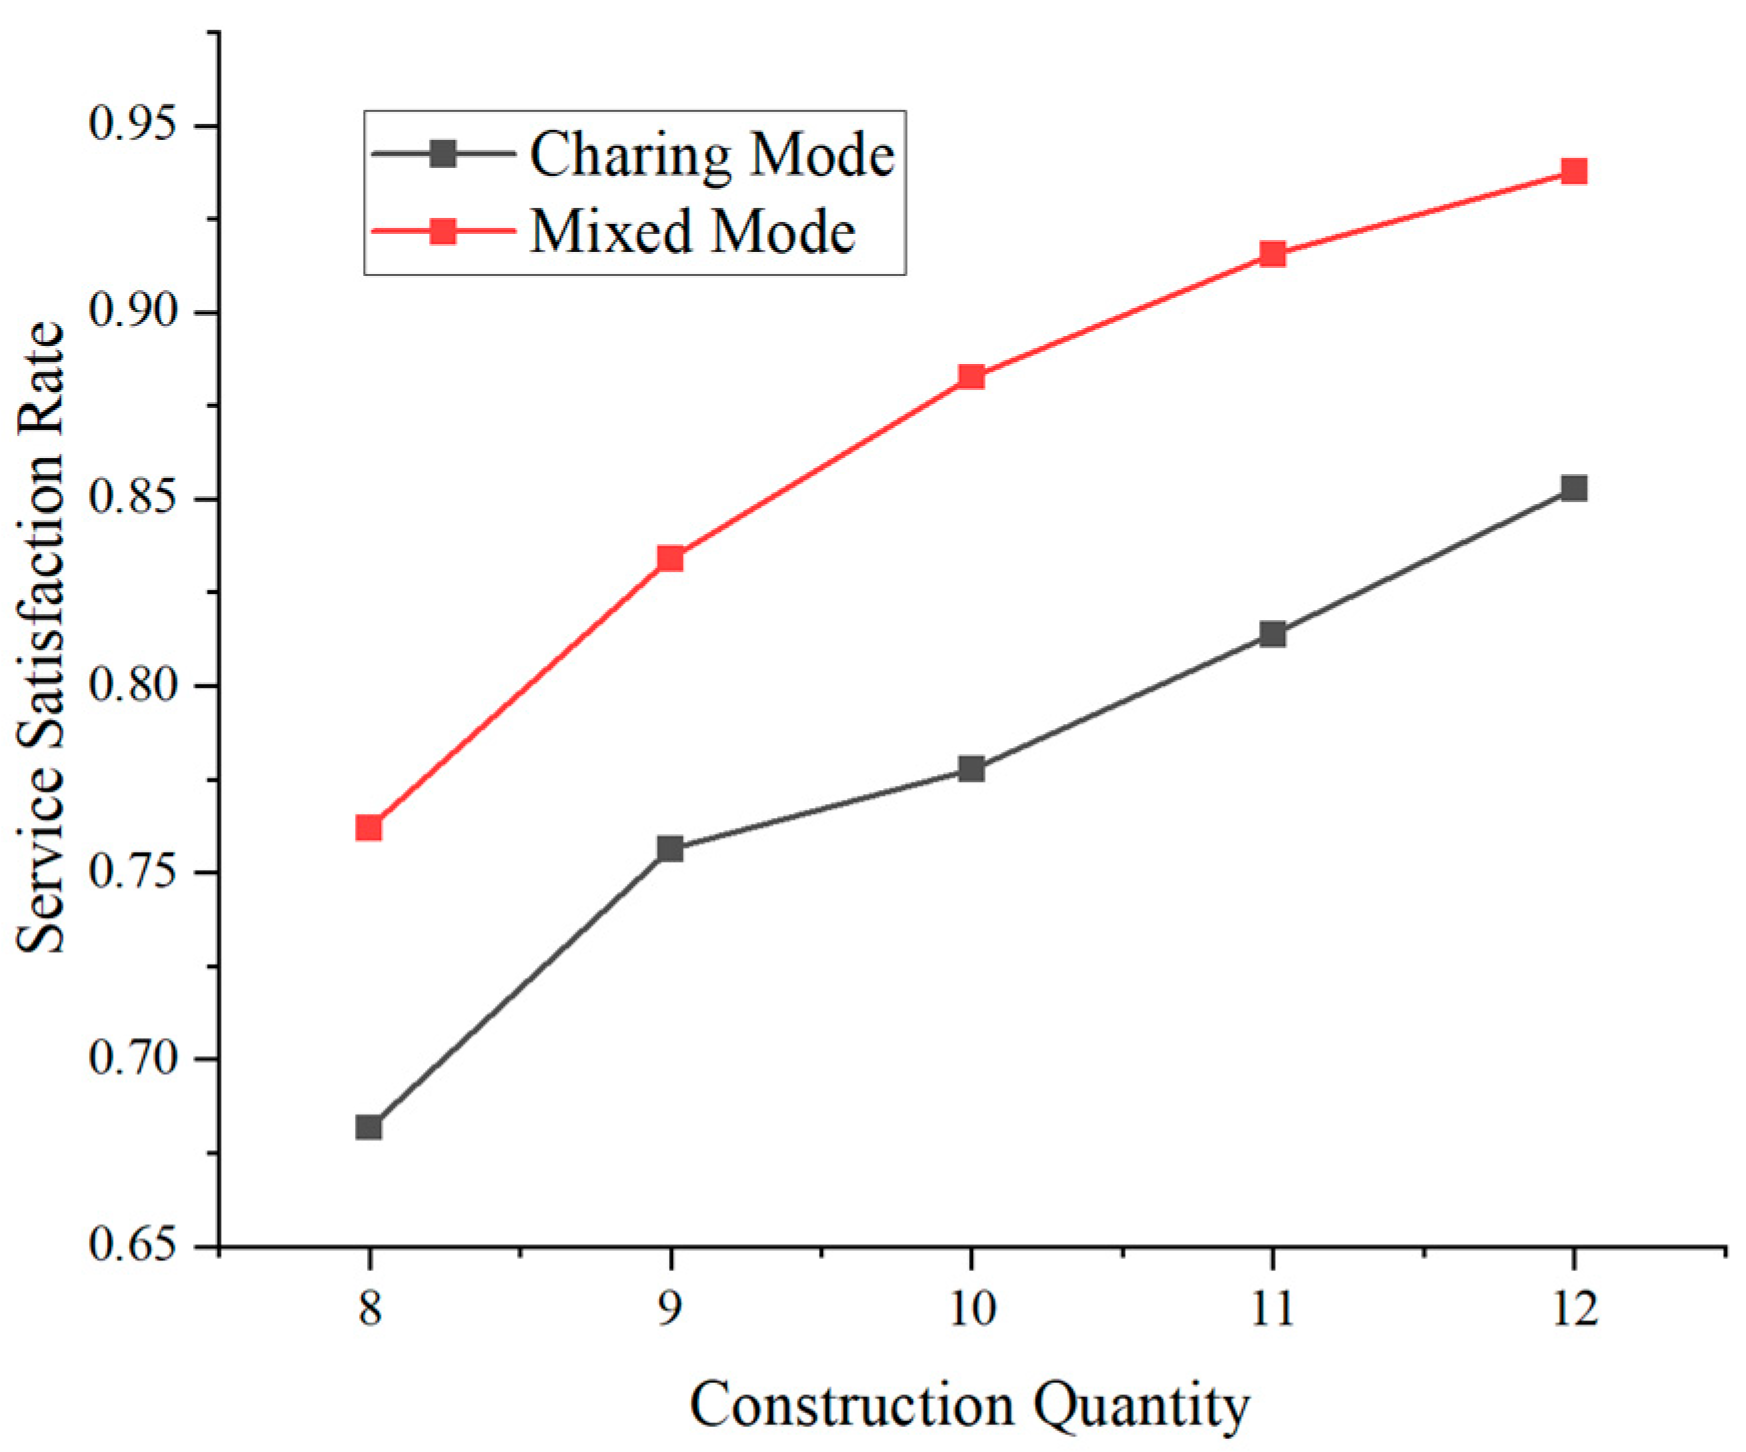
As shown in Figure 11, under the same number of constructed stations, the service satisfaction rate of BSCSs is higher than CSs.
Conversely, to achieve the same level of service satisfaction, a greater number of CSs is required. BSCSs offer higher service efficiency, as the battery swapping mode can significantly improve service throughput and enhance drivers’ satisfaction.
As shown in Table 1 and Table 2, for both the CS and BSCS systems, the marginal gain in service satisfaction decreases progressively with each additional station. This indicates that once the service coverage and capacity reach a certain threshold, further expansion may lead to resource redundancy and diminishing efficiency returns. In the early stages of deployment, CSs exhibit lower total construction costs and slightly greater satisfaction improvements with additional stations compared to BSCSs. However, although BSCSs require higher per-station investment, they consistently deliver higher overall satisfaction levels across all configurations. Moreover, while the growth rate of total cost in CSs is lower than that of BSCSs, the limited service capacity per CS station necessitates the construction of more stations to achieve the same level of satisfaction as BSCSs. As a result, the total cost required by a CS to reach comparable satisfaction levels can exceed that of a BSCS.
Due to its battery swapping capability, the BSCS system can more effectively adapt to peak–valley load fluctuations. During periods of high grid pressure or vehicle concentration, the BSCS system can deliver services more rapidly through battery swapping, offering greater operational flexibility. In contrast, the CS system is constrained by a longer charging duration, resulting in a rigid upper limit on its service capacity. Therefore, the BSCS system demonstrates a more effective balance between infrastructure investment and service performance, making it a more cost-effective and sustainable solution for long-term EV charging network planning.

7. Conclusions

This study develops a bi-level optimization framework to address the planning problem of EV BSCSs, integrating infrastructure location decisions with user routing behavior. The upper-level model minimizes total system cost and service delay by optimizing station locations, while the lower-level model minimizes user travel time based on individual path choices. An NSGA is proposed to enhance convergence quality and solution diversity.
The results demonstrate that the proposed bi-level model significantly outperforms two-stage models, reducing total cost and improving user satisfaction through coordinated infrastructure and behavior-level optimization. Comparative analysis further reveals that, although the BSCS system involves a higher initial investment, it delivers superior service efficiency and achieves higher satisfaction levels with fewer stations, making it more cost-effective in the long term.
From a practical perspective, this study offers several important contributions. First, the model supports the commercial deployment of hybrid charging–swapping stations by quantifying the service advantages and investment trade-offs, providing guidance for private investors and policymakers. Secondly, the BSCS system offers greater operational flexibility, particularly during peak periods, by alleviating charging congestion through fast battery swapping, thereby improving overall charging efficiency. Moreover, the swapping model facilitates centralized battery recovery and coordinated management, which contributes to the sustainable reuse and circulation of batteries. Third, the integration of routing behavior modeling helps reveal that EV users make decisions based not only on battery level or travel time, but also on queue length and perceived convenience. This insight enables the design of more adaptive, user-centered service systems.
This study has some limitations that warrant further investigation. Due to the lack of available data, it is currently difficult to estimate the actual proportion of EVs capable of battery swapping. To simplify the modeling process, we assumed that all EVs support both charging and swapping. Future research could address this assumption by incorporating heterogeneous EV types. Furthermore, the current study assumes full standardization and compatibility between charging and battery swapping services. Future research will reduce this assumption by incorporating scenarios with varying technical standards and partial compatibility rates, thereby providing a more realistic representation of heterogeneous EV fleets.
Overall, this study provides a practical, data-driven approach to EV infrastructure planning, offering theoretical and technical support for the development of scalable and user-oriented charging networks. Future research may explore dynamic pricing mechanisms, time-dependent demand, and grid interaction to further strengthen the model’s applicability in complex urban contexts.

Author Contributions

Conceptualization, B.C. and J.C.; methodology, B.C. and H.F.; software, B.C. and H.F.; validation, B.C.; formal analysis, B.C.; investigation, B.C.; resources, J.C.; data curation, B.C. and H.F.; writing—original draft preparation, B.C.; writing—review and editing, B.C., J.C. and H.F.; visualization, B.C.; supervision, J.C. All authors have read and agreed to the published version of the manuscript.

Funding

This research was funded by the Shandong Provincial Key Research and Development Plan (Soft Science Projects) under Grant No. 2024RZB0703.

Data Availability Statement

The original contributions presented in this study are included in the article. Further inquiries can be directed to the corresponding author.

Conflicts of Interest

The authors declare no conflicts of interest.

References

  1. Zhang, Q.; Yu, H.; Zhang, G.; Ma, T. Optimal planning of flood-resilient electric vehicle charging stations. Comput. Aided Civ. Infrastruct. Eng. 2023, 38, 489–507. [Google Scholar] [CrossRef]
  2. Liu, H.; Li, Y.; Zhang, C.; Li, J.; Li, X.; Zhao, Y. Electric vehicle charging station location model considering charging choice behavior and range anxiety. Sustainability 2022, 14, 4213. [Google Scholar] [CrossRef]
  3. Hu, D.; Huang, L.; Liu, C.; Liu, Z.W.; Ge, M.F. Data driven optimization for electric vehicle charging station locating and sizing with charging satisfaction consideration in urban areas. IET Renew. Power Gener. 2022, 16, 2630–2643. [Google Scholar] [CrossRef]
  4. Guillet, M.; Hiermann, G.; Kröller, A.; Schiffer, M. Electric vehicle charging station search in stochastic environments. Transp. Sci. 2022, 56, 483–500. [Google Scholar] [CrossRef]
  5. Ademulegun, O.O.; MacArtain, P.; Oni, B.; Hewitt, N.J. Multi-stage multi-criteria decision analysis for siting electric vehicle charging stations within and across border regions. Energies 2022, 15, 9396. [Google Scholar] [CrossRef]
  6. Zhang, B.; Zhao, M.; Hu, X. Location planning of electric vehicle charging station with users’ preferences and waiting time: Multi-objective bi-level programming model and HNSGA-II algorithm. Int. J. Prod. Res. 2023, 61, 1394–1423. [Google Scholar] [CrossRef]
  7. Xu, D.; Pei, W.; Zhang, Q. Optimal planning of electric vehicle charging stations considering user satisfaction and charging convenience. Energies 2022, 15, 5027. [Google Scholar] [CrossRef]
  8. Banegas, J.; Mamkhezri, J. A systematic review of geographic information systems based methods and criteria used for electric vehicle charging station site selection. Environ. Sci. Pollut. Res. 2023, 30, 68054–68083. [Google Scholar] [CrossRef] [PubMed]
  9. Sun, X.; Li, J.; Zhou, Y. Optimal planning of hybrid charging and battery swapping stations for electric vehicles. Appl. Energy 2023, 345, 121229. [Google Scholar] [CrossRef]
  10. Lai, Z.; Li, S. Towards a multimodal charging network: Joint planning of charging stations and battery swapping stations for electrified ride-hailing fleets. Transp. Res. Part B Methodol. 2024, 183, 102928. [Google Scholar] [CrossRef]
  11. Ben Abbes, S.; Rejeb, L.; Baati, L. Route planning for electric vehicles. IET Intell. Transp. Syst. 2022, 16, 875–889. [Google Scholar] [CrossRef]
  12. Froger, A.; Jabali, O.; Mendoza, J.E.; Laporte, G. The electric vehicle routing problem with capacitated charging stations. Transp. Sci. 2022, 56, 460–482. [Google Scholar] [CrossRef]
  13. Mahmoudian, F.; Moghaddam, A.H.; Davachi, S.M. Genetic-based multi-objective optimization of alkylation process by a hybrid model of statistical and artificial intelligence approaches. Can. J. Chem. Eng. 2022, 100, 90–102. [Google Scholar] [CrossRef]
  14. Fang, C.; Chen, X.; Li, X.; Fang, Y.; Li, S.; Shao, S.; Samorani, M.; Lu, H. Strategic XFC Charging Station Placement in Equilibrium Traffic Networks. IEEE Trans. Intell. Transp. Syst. 2025, 26, 4865–4877. [Google Scholar] [CrossRef]
  15. Soczówka, P.; Lasota, M.; Franke, P.; Żochowska, R. Method of Determining New Locations for Electric Vehicle Charging Stations Using GIS Tools. Energies 2024, 17, 4546. [Google Scholar] [CrossRef]
  16. Zhang, T.; Chen, X.; Wu, B.; Dedeoglu, M.; Zhang, J.; Trajkovic, L. Stochastic modeling and analysis of public electric vehicle fleet charging station operations. IEEE Trans. Intell. Transp. Syst. 2022, 23, 9252–9265. [Google Scholar] [CrossRef]
Figure 1. Behavior of EV drivers at a BSCS.
Wevj 16 00499 g001
Figure 2. Example of an OD travel path. (a) path node; (b) feasible plan 1; (c) feasible plan 2.
Wevj 16 00499 g002
Figure 3. Expanding network generation. (a) sample network; (b) expanded network.
Wevj 16 00499 g003
Figure 4. Bi-level solving scheme for location and route planning of a BSCS.
Wevj 16 00499 g004
Figure 5. Procedure of the bi-level optimization model based on the updated NSGA.
Wevj 16 00499 g005
Figure 6. The performance of algorithms in solving the location problem: (a) two-stage model; (b) bi-level model.
Wevj 16 00499 g006
Figure 7. Comparison of OD in different models: (a) two-stage model; (b) bi-level model.
Wevj 16 00499 g007
Figure 8. Comparison of travel time in the single- and bi-level models: (a) two-stage model travel time curve; (b) bi-level model travel time curve.
Wevj 16 00499 g008
Figure 9. Performance of the NSGA in different modes: (a) travel time in different modes; (b) cost in different modes.
Wevj 16 00499 g009
Figure 10. Detention time of charging drivers in different modes.
Wevj 16 00499 g010
Figure 11. Service satisfaction rate of charging drivers in different modes.
Wevj 16 00499 g011
Table 1. Charging service satisfaction rate at CSs.
Quantity of CSsSatisfied Rate of Charging ServiceTotal Cost
868.18%2238.64
975.64%2597.35
1077.76%2774.47
1181.39%3097.98
1285.27%3469.25
Table 2. Charging service satisfaction rate at BSCSs.
Quantity of BSCSsSatisfied Rate of Charging ServiceTotal Cost
876.21%2784.92
983.42%3132.66
1088.27%3481.16
1191.55%3828.71
1293.76%4176.58
Disclaimer/Publisher’s Note: The statements, opinions and data contained in all publications are solely those of the individual author(s) and contributor(s) and not of MDPI and/or the editor(s). MDPI and/or the editor(s) disclaim responsibility for any injury to people or property resulting from any ideas, methods, instructions or products referred to in the content.