Article

Criterion Circle-Optimized Hybrid Finite Element–Statistical Energy Analysis Modeling with Point Connection Updating for Acoustic Package Design in Electric Vehicles

1
Hubei Provincial Key Laboratory of Pure Electric Vehicle Powertrain Design and Testing, Xiangyang 441053, China
2
School of Automotive and Traffic Engineering, Hubei University of Arts and Science, Xiangyang 441053, China
*
Author to whom correspondence should be addressed.
World Electr. Veh. J. 2025, 16(10), 563; https://doi.org/10.3390/wevj16100563
Submission received: 20 March 2025 / Revised: 8 April 2025 / Accepted: 22 April 2025 / Published: 2 October 2025

Abstract

This research is based on the acoustic package design of new energy vehicles, investigating the application of the hybrid Finite Element–Statistical Energy Analysis (FE-SEA) model in predicting the high-frequency dynamic response of automotive structures, with a focus on the modeling and correction methods for hybrid point connections. New energy vehicles face unique acoustic challenges due to the special nature of their power systems and operating conditions, such as high-frequency noise from electric motors and electronic devices, wind noise, and road noise at low speeds, which directly affect the vehicle’s ride comfort. Therefore, optimizing the acoustic package design of new energy vehicles to reduce in-cabin noise and improve acoustic quality is an important issue in automotive engineering. In this context, this study proposes an improved point connection correction factor by optimizing the division range of the decision circle. The factor corrects the dynamic stiffness of point connections based on wave characteristics, aiming to improve the analysis accuracy of the hybrid FE-SEA model and enhance its ability to model boundary effects. Simulation results show that the proposed method can effectively improve the model’s analysis accuracy, reduce the degrees of freedom in analysis, and increase efficiency, providing important theoretical support and reference for the acoustic package design and NVH performance optimization of new energy vehicles.

1. Introduction

Hybrid statistical energy analysis (FE-SEA) models play an important role in predicting the high-frequency dynamic response of automotive structures, especially in the design of acoustic packages for new energy vehicles. New energy vehicles face unique acoustic challenges, such as high-frequency noise from electric motors and electronic devices, wind noise, and road noise at low speeds, due to the special characteristics of their power systems and operating conditions, and these noise problems directly affect the vehicle’s driving experience. Therefore, optimizing the acoustic package design of new energy vehicles to reduce in-vehicle noise and improve acoustic quality has become an important issue in automotive engineering. In this context, the FE-SEA model effectively solves the problem of predicting the mechanical environment in the mid-frequency band by dividing the automotive structure into deterministic and stochastic subsystems, and modeling them using the finite element method (FEM) and statistical energy analysis (SEA), respectively. Traditional FEM and boundary element methods are limited in the middle- and high-frequency bands due to the need for many degrees of freedom and sensitivity to parameter variations, while SEA methods, although applicable to high frequencies, do not satisfy the assumptions in the middle and low-frequency bands, resulting in a lack of accuracy. The core of the FE-SEA method lies in hybrid connection modeling, which describes the structural uncertainty through the introduction of uncertain parameters and fully takes into account the effects of the relative positions of boundaries and point connections as well as the structural dynamical properties of the structure. Simulation results show that the method provides reasonable correction criteria for point connection modeling and improves the analysis accuracy. In the automotive industry, the FE-SEA method can significantly reduce the analysis degrees of freedom and efficiently perform structural acoustic vibration response and fatigue analyses, which is crucial for optimizing the NVH performance of vehicles and directly affects the comfort and safety of vehicles. In addition, by introducing the concept of judgment circle, the point connection correction factor is further optimized, which makes the modeling and correction of the model more accurate under the boundary effect and multi-subsystem coupling conditions and provides a more reliable basis for the prediction of the high-frequency dynamic response of automotive structures, which is a hot and difficult point of the current research. In this study, an improved point-connection correction factor is proposed by optimizing the delineation range of the judgment circle, aiming to further improve the application accuracy of the FE-SEA model in the design of acoustic packages for new energy vehicles and to provide theoretical support and reference for the optimization of the acoustic performance of new energy vehicles.
In the research field of hybrid statistical energy model (FE-SEA) point connection modeling and correction, many scholars have made significant contributions.
Weihong Zhu, Xingrui Ma, Zengyao Han, Yuanjie Zou, et al. [1] proposed a wavelength-based point connection correction factor in their study published in the Journal of Computational Mechanics, which effectively improved the accuracy of hybrid FE-SEA point connection modeling. They first established a hybrid point connection model for an infinite plate structure based on wave theory and then proposed a point connection correction factor based on a decision circle according to the dynamic characteristics of the plate structure system. The simulation results show that this correction factor can effectively estimate the impact of boundaries on point connections. Jintao S [2] explored the FE-SEA modeling and acoustic performance of heavy commercial vehicles based on experimental statistical energy parameters in his study published in Applied Sciences, providing a reference for the application of hybrid FE-SEA models in complex structures. They established a hybrid FE-SEA commercial vehicle model using the experimental statistical energy parameter modeling method and correction method, studied the model division of complex substructures and subsystem connection modeling of heavy truck cabs, and optimized the acoustic performance of the cab by obtaining statistical energy parameters such as modal density, internal loss factor, and coupling loss factor through experimental methods. Wenjun Luo, Hao Cao, and Zizheng Zhang [3] predicted the vibration response and structural noise of bridges under train operation and meeting conditions in their study “Analysis of Bridge Vibration and Noise due to Train Passing based on FE-SEA Hybrid Method”. The results show that when trains meet, the vibration acceleration levels of each plate increase, with the main frequency band being 40~120 Hz and the peak frequency being 65 Hz. Shuming Chen, Dengfeng Wang, and Jianming Zan [4] predicted the interior noise of passenger cars by combining the finite element method and statistical energy analysis, providing an effective analytical tool for automotive noise control and optimization. Yuyang He, Xiaoxiong Jin, and Xiaolong Qin [5] analyzed the modeling method of mid-frequency noise in vehicles and established a hybrid FE-SEA model for passenger cars. They calculated the radiation efficiency of the FE vehicle body, measured the powertrain suspension excitation and body suspension excitation through experiments, measured the engine compartment sound radiation excitation in an anechoic chamber, established a CFD wind tunnel simulation model, and calculated the external wind excitation. They then predicted interior noise using the hybrid FE-SEA model after applying the excitation and compared it with the experimental results. Charpentier A, Sreedhar P, Gardner B [6], et al. used a hybrid FE-SEA model to improve vehicle interior noise design, providing a new perspective for vehicle interior noise control. Yigang Wang, Zhang Jie, and Wuzhou Yu [7] analyzed the propagation characteristics of automotive wind noise based on the statistical energy method, providing theoretical support for wind noise control. Bennxing Wang, Xiaomin Lian, and Sifa Zheng [8] predicted the interior sound pressure level of heavy trucks, providing a scientific basis for truck noise control. Yong Che, Hao Liu, and Shunsheng Guo [9] predicted the interior noise of pure electric vehicles based on the SEA model, providing a new method for new energy vehicle noise control. Deyuan Yao and Qizheng Wang [10] introduced the principles and applications of statistical energy analysis in detail. Their book “Principles and Applications of Statistical Energy Analysis” is an important reference for understanding and applying the SEA method. Yong Zhang, Kunxiang Wang, and Chen Sheng [11] analyzed the hybrid FE-SEA method for mid-frequency noise in a special vehicle, providing an effective solution for special vehicle noise control, Langley, R.S. and Bremner, P. [12] reviewed the advancements of hybrid FE-SEA methods in mid-frequency structural-acoustic problems and discussed the coupling techniques between deterministic (FEM) and statistical (SEA) subsystems in their study published in the Journal of Sound and Vibration. Ma, X., Zhu, W., and Han, Z. [13] proposed a wavelength-based point connection correction factor and validated it through experimental case studies on automotive panels in their study published in Mechanical Systems and Signal Processing, Zhang, Y., Wang, K., and Sheng, C. [14] focused on high-frequency noise from electric motors and battery systems, showcasing the efficiency of hybrid FE-SEA in reducing computational costs for EV acoustic packages in their study published in Applied Acoustics.

2. The Hybrid FE-SEA Method Theory

2.1. Basic Theory of the Hybrid FE-SEA Method

The theoretical foundation of the hybrid FE-SEA method asserts that the energy of a random subsystem is composed of two parts: direct field energy and resonant field energy. Direct field energy refers to the initial energy input into the subsystem through connection points without undergoing boundary reflection, whereas resonant field energy accumulates over time due to multiple reflections within the structure, as illustrated in Figure 1.

2.2. Mutual Exchange Principle Based on Wave Theory

In many cases, the resonant field energy can be viewed as a sum of multiple independent components at random boundaries [15]. Through the mutual exchange relationship, the influence of the resonant field generated at deterministic boundaries (i.e., reactive resonant forces) can be determined around the resonant field energy. This relationship provides the foundation for coupling between statistical energy analysis models and finite element models, enabling effective integration of the two methods for analysis purposes.
D d i r q = f + f r e v
Assuming the hybrid boundary connecting a random subsystem with a finite element structure has q degrees of freedom, the random subsystem’s dynamic response can be expressed as the product of the direct field stiffness matrix D d i r and an external load f , plus the resisting resonant force f r e v induced by the resonant field at the hybrid boundary. This representation highlights the energy exchange between the direct field and the resonant field, reflecting their coupled nature.

2.3. Coupled System Equations

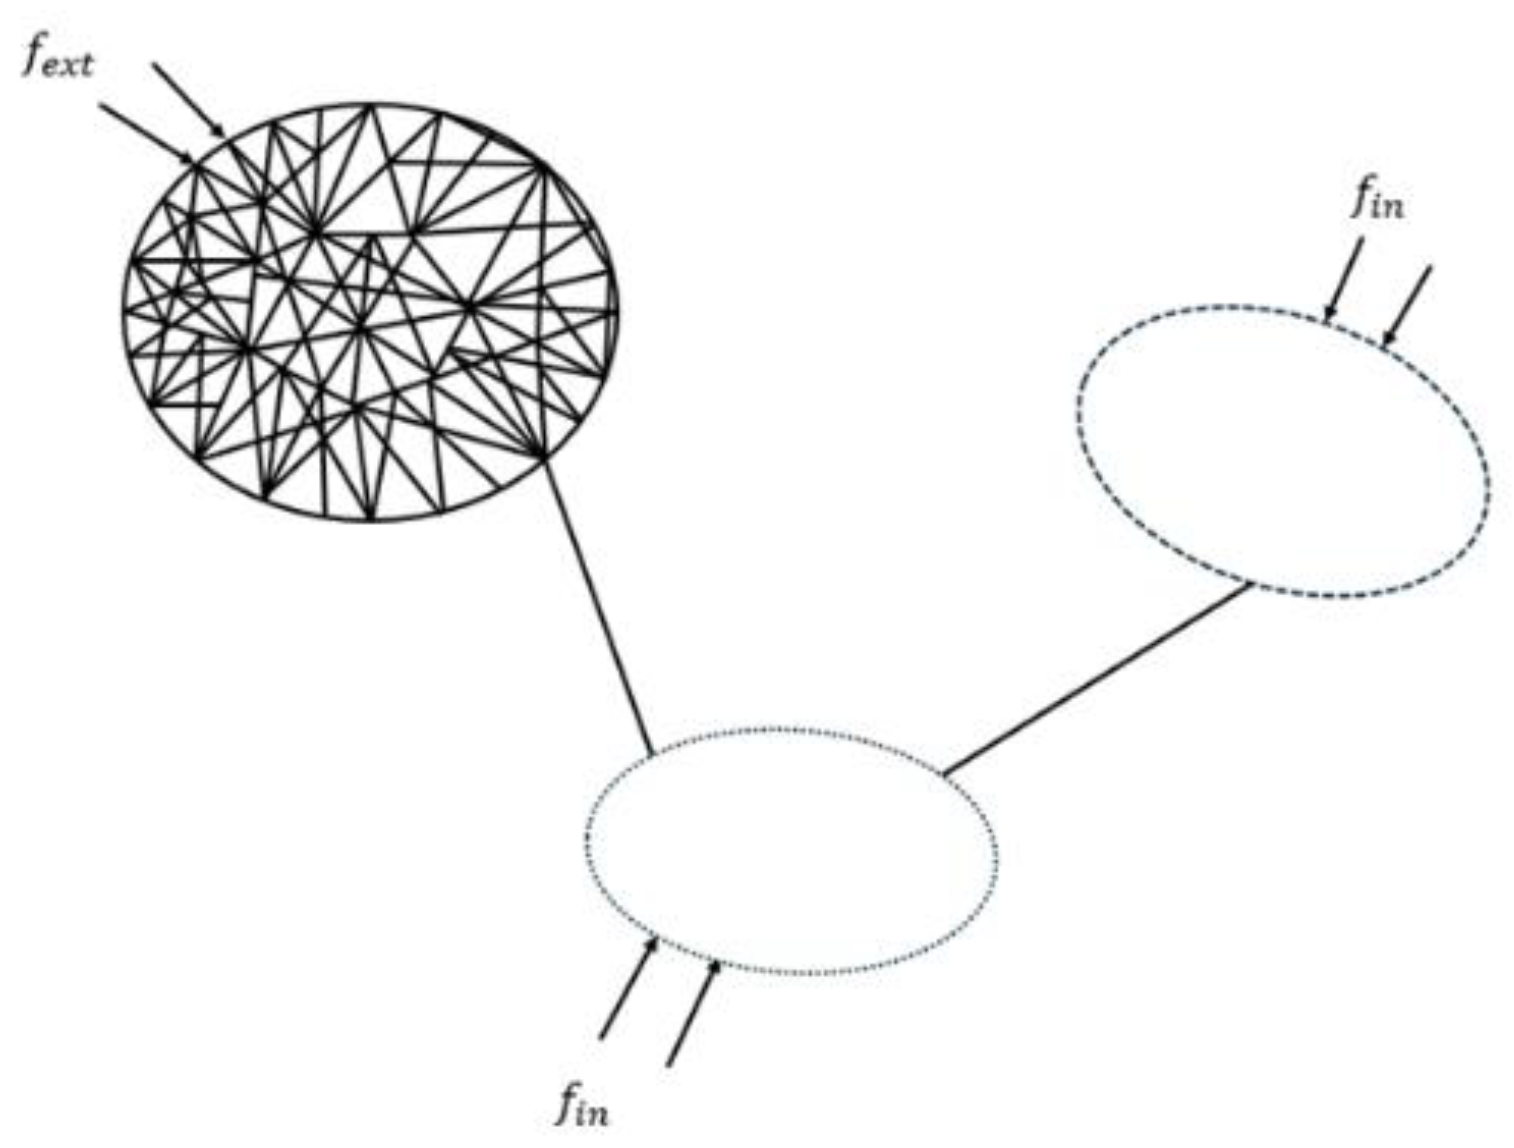
In the hybrid FE-SEA method based on wave theory, the system is typically divided into multiple subsystems. Subsystems are classified into two categories based on their characteristic size relative to wavelength: deterministic subsystems and probabilistic subsystems. Deterministic subsystems, where characteristic size is comparable to wavelength, are suited for finite element modeling (FEM). Probabilistic subsystems, with characteristic sizes larger than wavelength, are better modeled using statistical energy analysis (SEA), as illustrated in Figure 2.
For a coupled system in the hybrid FE-SEA method based on wave theory, the system is typically divided into multiple subsystems. Subsystems are classified into two categories based on their characteristic size relative to wavelength: deterministic subsystems and probabilistic subsystems. Deterministic subsystems, where characteristic size is comparable to wavelength, are suited for finite element modeling (FEM). Probabilistic subsystems, with characteristic sizes larger than wavelength, are better modeled using statistical energy analysis (SEA), as illustrated in Figure 2. The system boundary is further classified into two types: deterministic boundary and random boundary. A deterministic boundary represents the solid-line boundary of a subsystem, while a random boundary represents the dashed-line boundary. The hybrid connection refers to a connection between a subsystem with a grid structure and one without, while the random connection refers to a connection between two subsystems without grid structures. f e x t : external load acting on the deterministic subsystem f i n : external load acting on the probabilistic subsystem.
For coupled systems, due to their composition of deterministic and probabilistic subsystems, assuming the dynamic stiffness matrix of the deterministic subsystem is, the non-coupled dynamic equation for the deterministic subsystem can be derived through the mutual exchange relationship as:
f r e v m = 0 f r e v m f r e v m H = a m L m { D d i r m }
Therefore, the coupled deterministic system equations can be represented by the following equations:
S q q = D t o t 1 S f e x t f e x t D t o t H + 4 Π w D t o t 1 m E m n m I m { D d i r m } D t o t H
Among them, D t o t represents the total kinetic stiffness matrix of the system; [·] denotes the ensemble average; the symbol · H indicates the conjugate transpose and inversion operations of a matrix. This formula indicates that the response of a deterministically coupled system is related not only to the external loads of the deterministic system but also to the reactions of the stochastic subsystems.

3. The Hybrid FE-SEA Point Connection Model

3.1. Finite Element Model for No-Boundary Plate Structure Hybrid Point Connection

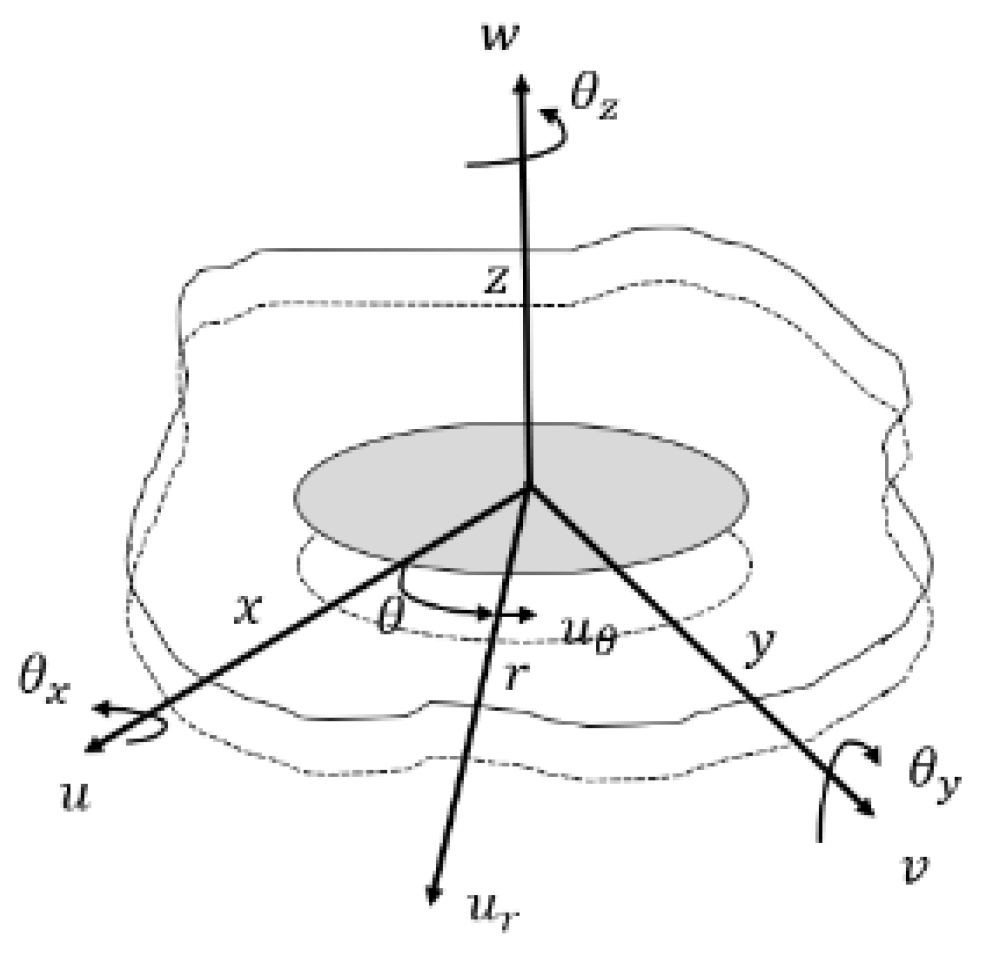
The hybrid point connection model in finite element modeling (FEM) provides a more accurate simulation of the connection characteristics in actual structures. Since real structures are typically finite, the location and boundary conditions at the connections can be complex and variable. The hybrid point connection model considers the influence of boundaries on the connection modeling, thereby improving the precision of the analysis results. For component j , as illustrated in Figure 3, if it has a no-mess rigid circular face, this circle is embedded within the local coordinates of component j and contains six degrees of freedom: [ w j 1   w j 2   w j 3   w j 4   w j 5   w j 6 ] T , where the first three represent translational freedoms, and the last three represent rotational freedoms.

3.1.1. Equations of Motion for No-Boundary Plate Structure

The hybrid point connection is modeled as a no-mass circular face in an infinite thin plate. The waves in the plate can be categorized into 11 types [16], including three kinds of propagating wave associated with face displacement w , face surface curvature θ x and θ y , and eight classes of dissipative waves, along with two types of longitudinal wave and two types of shear wave associated with face displacements u and v , as well as three types of shear wave related to rotational displacement   θ z . In polar coordinates centered at the circular face’s center ( r , θ , z ), the plate’s face displacement consist of six types of wave: propagating waves related to w , θ x , and θ y .
u z r , θ = a 0 b H 0 2 k b r + a 1 s b H 1 2 ( k b r ) sin θ + a 1 c b H 1 2 ( k b r ) cos θ
+ a 0 b n H 0 2 i k b r + a 1 s ( b n ) H 1 2 i k b r sin θ
+ a 1 c b n H 1 2 ( i k b r ) cos θ
In this formula, u z is the out-of-plane displacement in polar coordinates; H n ( 2 ) is the Hankel function of the second kind of order n; a 0 b , a 1 s b , a 1 c b are the amplitudes of propagating waves related to w , θ x , θ y ; a 0 b n , a 1 s ( b n ) , a 1 c b n are the amplitudes of dissipative waves related to w , θ x , θ y ; k b is the wave number in the bending direction.
Since the in-plane motion is related to dilatational waves and shear waves, the displacements along the radial direction u r and the tangential direction u θ in polar coordinates can be expressed by the following formulas:
u r r , θ = φ r + 1 r θ
u θ r , θ = 1 r φ θ r
Among them, φ denotes the stretch wave potential function; denotes the shear wave function.

3.1.2. The Relationship Between Displacement and Wave Number

Plate structures contain 11 types of wave, and each node in the structure has only six degrees of freedom. Therefore, additional constraint equations are required to supplement the motion equations. If the displacement of the circular circumference connected to the plate is located at r = a , then the relationship between the out-of-plane displacement in polar coordinates and the displacement in the orthogonal coordinate system is as follows:
u z a , θ = w + a θ x sin θ a θ y cos θ
For any θ position, combining this equation with the previous formulas, the following conclusions can be drawn:
w = a 0 b H 0 2 k b r 0 + a 0 b n H 0 2 ( i k b r 0 )
θ x = 1 r 0 a 1 s b H 1 2 k b r 0 + a 1 s b n H 1 2 ( i k b r 0 )
θ y = 1 r 0 a 1 c b H 1 2 k b r 0 + a 1 c b n H 1 2 ( i k b r 0 )
On the one hand, there is no relative sliding between the plate and the connected circular surface, that is, the slope of any point along the radial direction on the connection must be equal to the slope in the corresponding direction on the plate at that position. Therefore, by differentiating Equations (4) and (7) concerning and equating the terms related to, three displacement coordination conditions expressed by wave coefficients can be obtained:
k b a 0 b H 0 2 k b r 0 i k b a 0 b n H 0 2 i k b r 0 = 0
a 1 s b k b H 1 2 k b r 0 1 r 0 H 1 2 k b r 0 a 1 s ( b n ) i k b H 1 2 k b r 0 + 1 r 0 H 1 2 i k b r 0 = 0
a 1 c b k b H 1 2 k b r 0 1 r 0 H 1 2 k b r 0 a 1 c ( b n ) i k b H 1 2 k b r 0 + 1 r 0 H 1 2 i k b r 0 = 0
The relationship between the in-plane displacement of the point connection in polar coordinates and the displacement in the orthogonal coordinate system is as follows:
u r a , θ = u cos θ + v sin θ
u 0 a , θ = a θ z u sin θ + v cos θ
The in-plane motion of the plate can be described by in-plane tensile and in-plane shear waves:
u r r , θ = a 1 c ( e ) H 0 2 k e r H 1 2 ( k e r ) k e r cos θ +                          
a 1 s ( e ) H 0 2 k e r H 1 2 ( k e r ) k e r cos θ +
1 k s r a 1 s ( s ) H 1 2 k s r cos θ a 1 c ( s ) H 1 2 k s r sin ( θ )
u θ r , θ = 1 k e r a 1 s ( e ) H 1 2 k e r cos θ a 1 c ( e ) H 1 2 k e r sin ( θ )
a 0 e H 1 2 k s r a 1 c e H 1 2 k e r sin θ + a 0 s H 1 2 k s r
a 1 c s H 0 2 k s r H 1 2 k s r k s r cos θ a 1 s s H 0 2 k s r H 1 2 k s r k s r sin θ
Projecting the in-plane displacement in polar coordinates onto the Cartesian coordinate system, the interrelationship between the six degrees of freedom w and the coefficients a of the 11 types of wave in the plate structure can be obtained from the previous formulas:
w = Q 1 a
The five displacement coordination conditions at the point connection boundary are:
Q 2 a = 0

3.1.3. Relationship Between Forces and Waves at Connections

From the theory of plate bending in polar coordinates, the total shear force V r and the bending moment M r on a thin plate are, respectively:
V r θ = D 3 u z r 3 + 1 r Z 2 u Z r 2 1 r 2 u z r 2 3 v 0 r 3 2 u z θ 2 + 2 v 0 r 2 3 u z r θ 2
M r θ = D 2 u z r 2 + v 0 r 2 2 u z θ 2 + v 0 r u z r
By performing a coordinate transformation from polar to Cartesian coordinates, the bending moments M x and M y , as well as the shear force F z , can be determined.
M x = r 0 2 π r V r M r sin θ d θ
                                                                                M y = r 0 2 π r V r M r cos θ d θ
F z = r 0 2 π V r d θ
From the above formulas, the relationship between the bending moments M x ,   M y   a n d   t h e   s h e a r   f o r c e     F z can be obtained. Therefore, the relationship between the shear forces F x , F y and the bending moment M z in the orthogonal coordinate system and the stresses σ r r   a n d   σ r θ in the polar coordinates are, respectively, as follows:
F x = h r 0 2 π a r r cos θ a r θ sin θ d θ
F y = h r 0 2 π a r r sin θ + a r θ cos θ d θ
M z = h r 0 2 π σ r θ d θ
From the above formulas, the relationship between the shear forces F x , F y , the bending moment M z , and the waves can be derived, and thus the relationship between the six forces and the wave amplitudes can be further derived.
F = S a

3.1.4. Direct Field Dynamic Stiffness Matrix of Mixed Point Connection

From the relationship between the wave number coefficients and the boundary displacements, and the displacement compatibility conditions, we can obtain:
Q 1 Q 2 a = Q a = w 0
Taking the inverse of both sides:
a = Q 1 w 0 = P R w 0
Simplifying the above equation yields:
a = P w
Substituting the above equation into F = S a we can obtain the traditional direct dynamic stiffness matrix of the point connection commonly used:
D d i r , = S P
where D d i r , is the direct dynamic stiffness matrix of the point connection for an infinite structure.

4. Point Connection Correction Factor

4.1. Conventional Point Connection Correction Methods

In the field of mixed finite element-statistical energy analysis (FE-SEA) modeling, point connection correction methods play a crucial role in improving the accuracy of model predictions. The academic community has proposed various correction methods, including wave-based point connection correction factors, radiation angle methods, energy flow models, coupled loss factors, vibration acoustic analysis, and the application of FE-SEA methods. These methods aim to address boundary effects caused by infinite structure assumptions in mixed point connection modeling. Weihong J and colleagues proposed a mixed point connection correction factor based on wave theory. This factor determines a circle as a reference to effectively estimate the influence of boundaries on point connections and improves the precision of mixed point connection modeling. Additionally, researchers have explored correction methods for radiation radius in mixed point connections, and issues related to mixed line connections. By establishing a triangular wave function model and directly computing the stiffness matrix, they proposed methods for correcting shape functions. These research achievements not only progress the theory but also demonstrate strong practical applicability, laying a solid foundation for the further development and application of FE-SEA technology, and playing an increasingly important role in structural acoustics analysis. With advancements in computational technology and increasing engineering demands, it is expected that FE-SEA technology will continue to expand and deepen in international research and applications.

4.2. Wave-Based Correction Factor Model

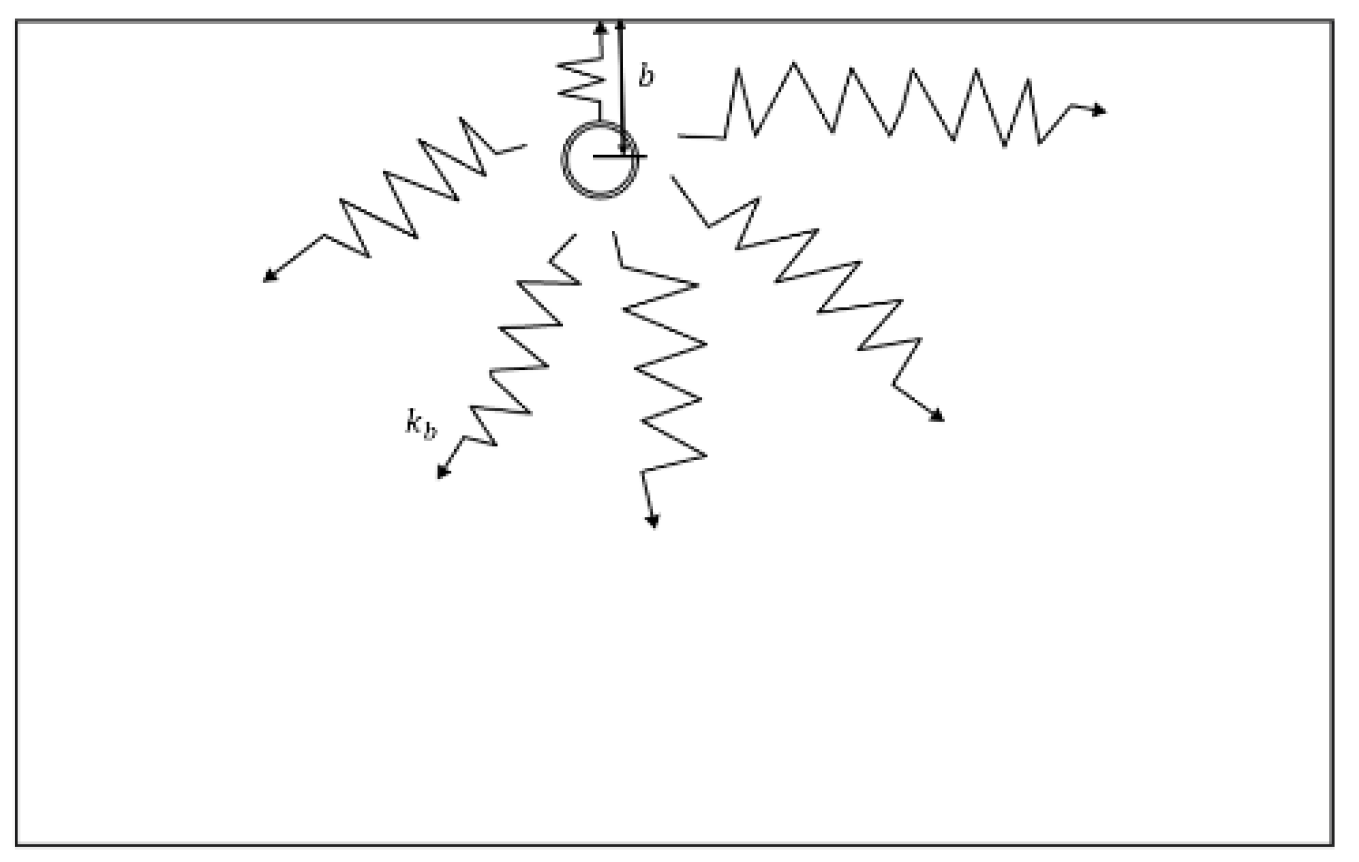
In this paper, we analyze the wave characteristics within a structure to construct a correction factor for point connection dynamic stiffness. This correction factor can be used to adjust the point connection model, thereby more accurately modeling the influence of boundaries on the structure and improving overall analysis precision. In the study, we consider a bounded plate structure, as shown in Figure 4. The plate structure radiates energy through point connections with wave number k b . According to classical plate theory, the bending wave number is defined as λ b :
λ b = 2 π k b

4.3. Circular Optimization Determination

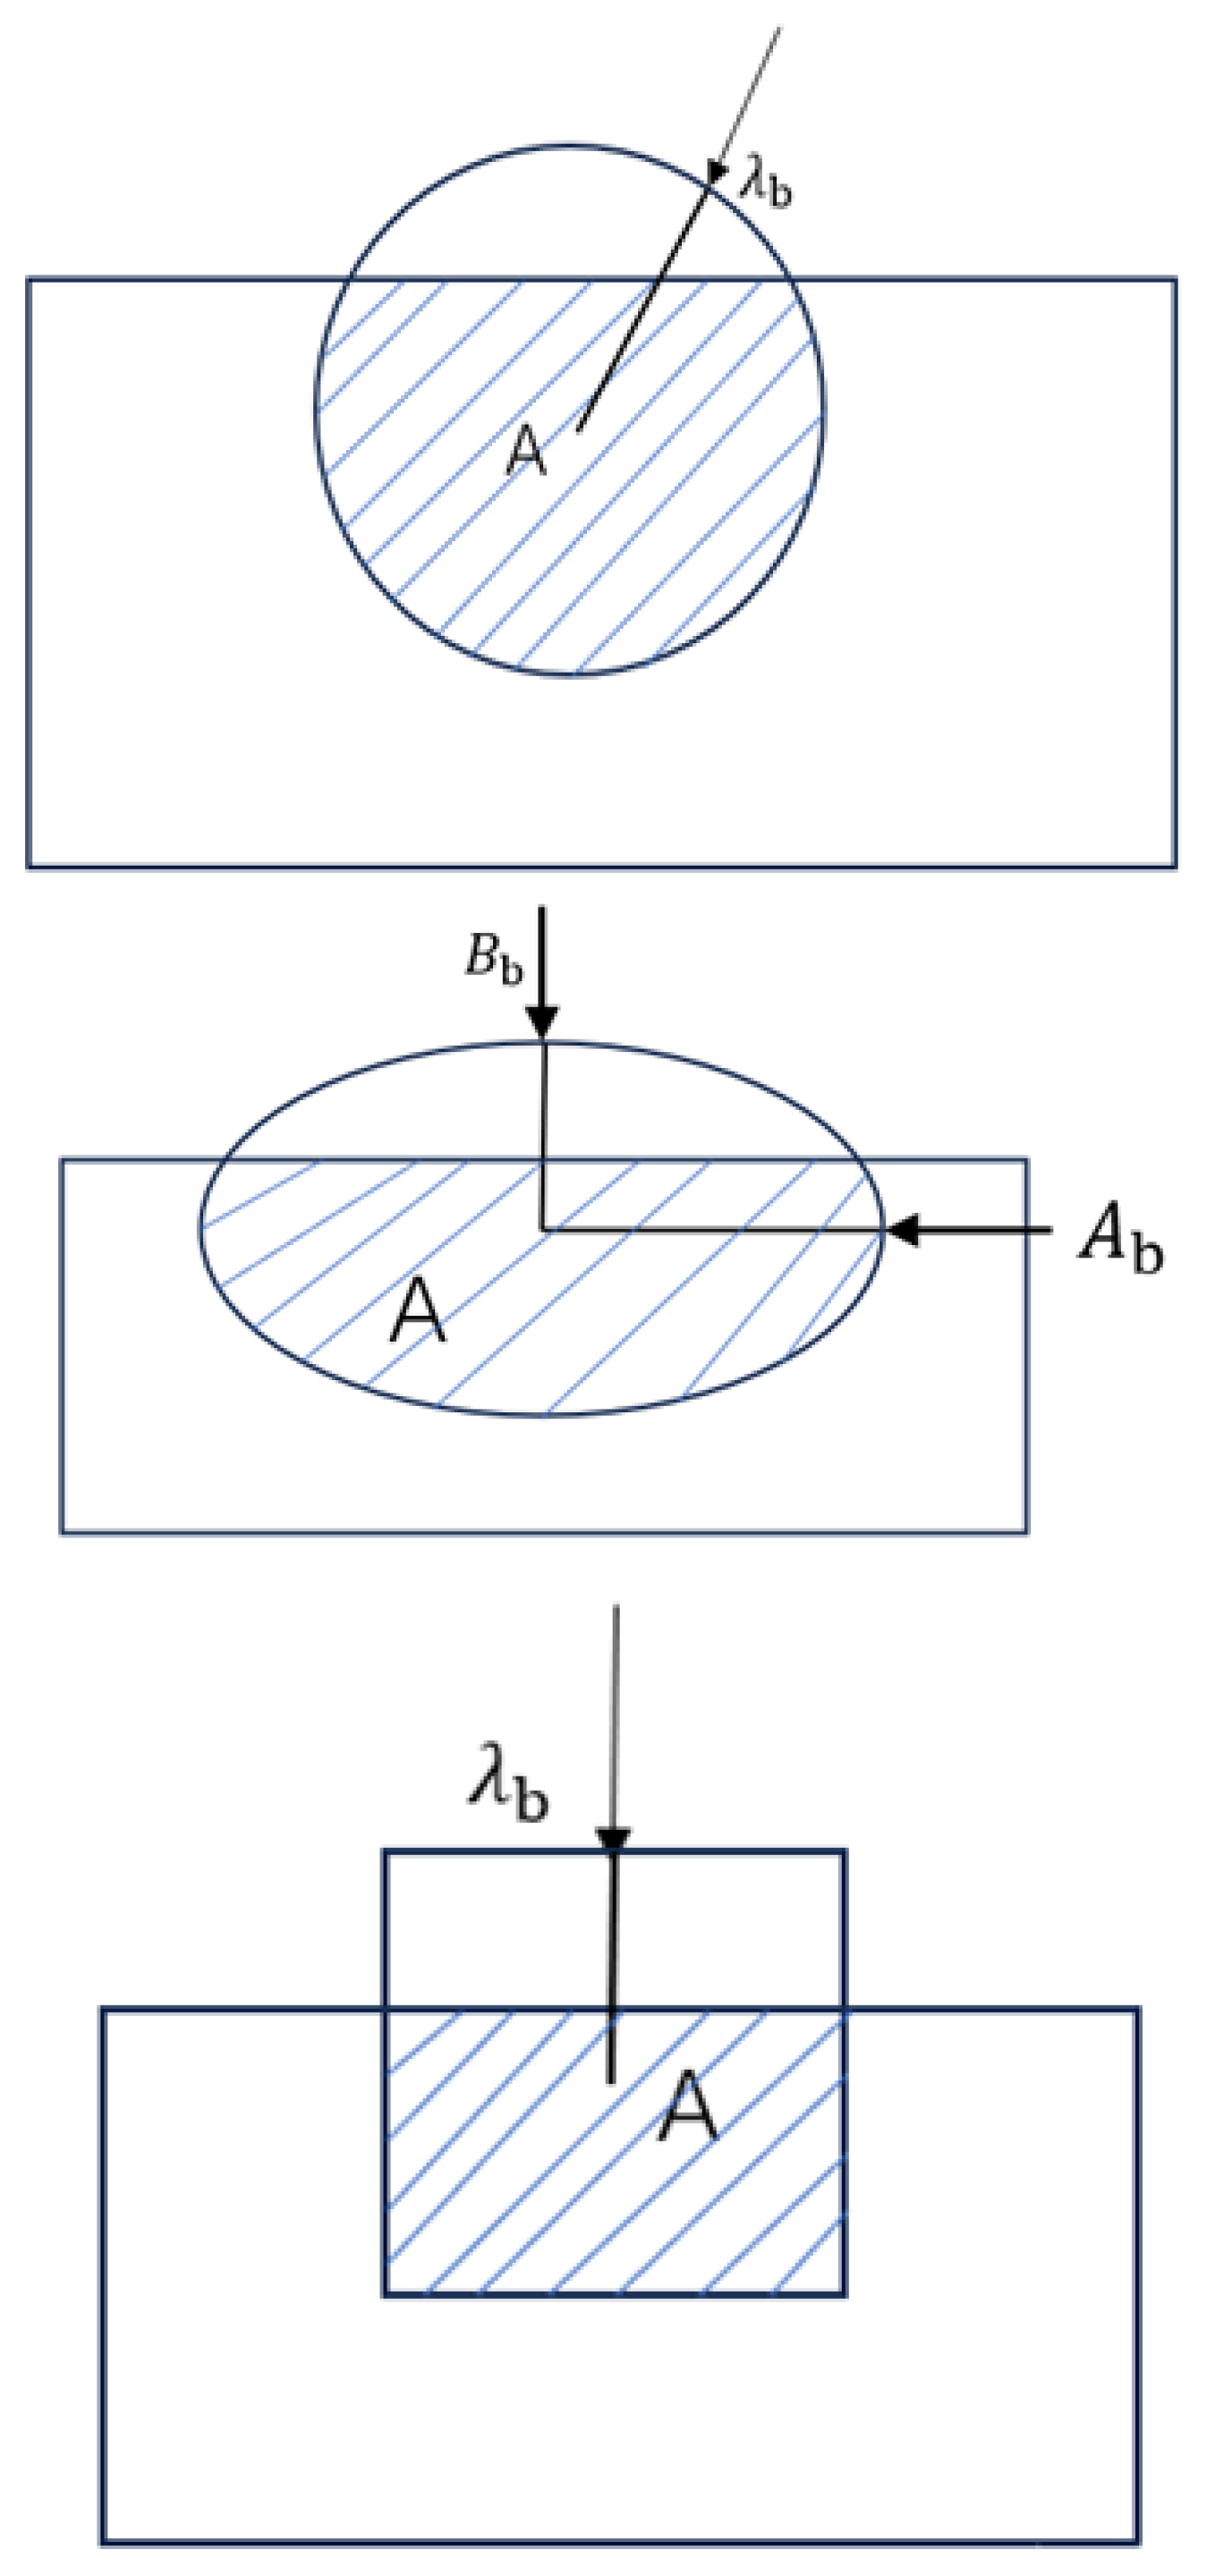
A decision circle is established with the connection point as the center, and the wavelength λ b in the structure as the radius. The area of intersection between the structural region and the decision circle is defined as the corrected area of the point connection under frequency f . As shown in Figure 5, the decision circle is constructed in various shapes, including circular, square, and elliptical decision areas. The correction factor for the point connection is defined as the ratio of the corrected area to the area of the decision circle.
Among them, B b = 1 2 A b , B b = λ b .
Based on the above ratio of the area of the region of the judgment circle, the correction factor can be obtained as:
β λ 1 = S A π λ b 2 = S A f 2 π 2 ρ h D
β λ 2 = S A 2 π λ b 2 = S A f 4 π 2 ρ h D
β λ 3 = S A λ b 2 = S A f 2 π ρ h D

5. Mixed Point Connection Correction

5.1. Construction of the Mixed Point Model

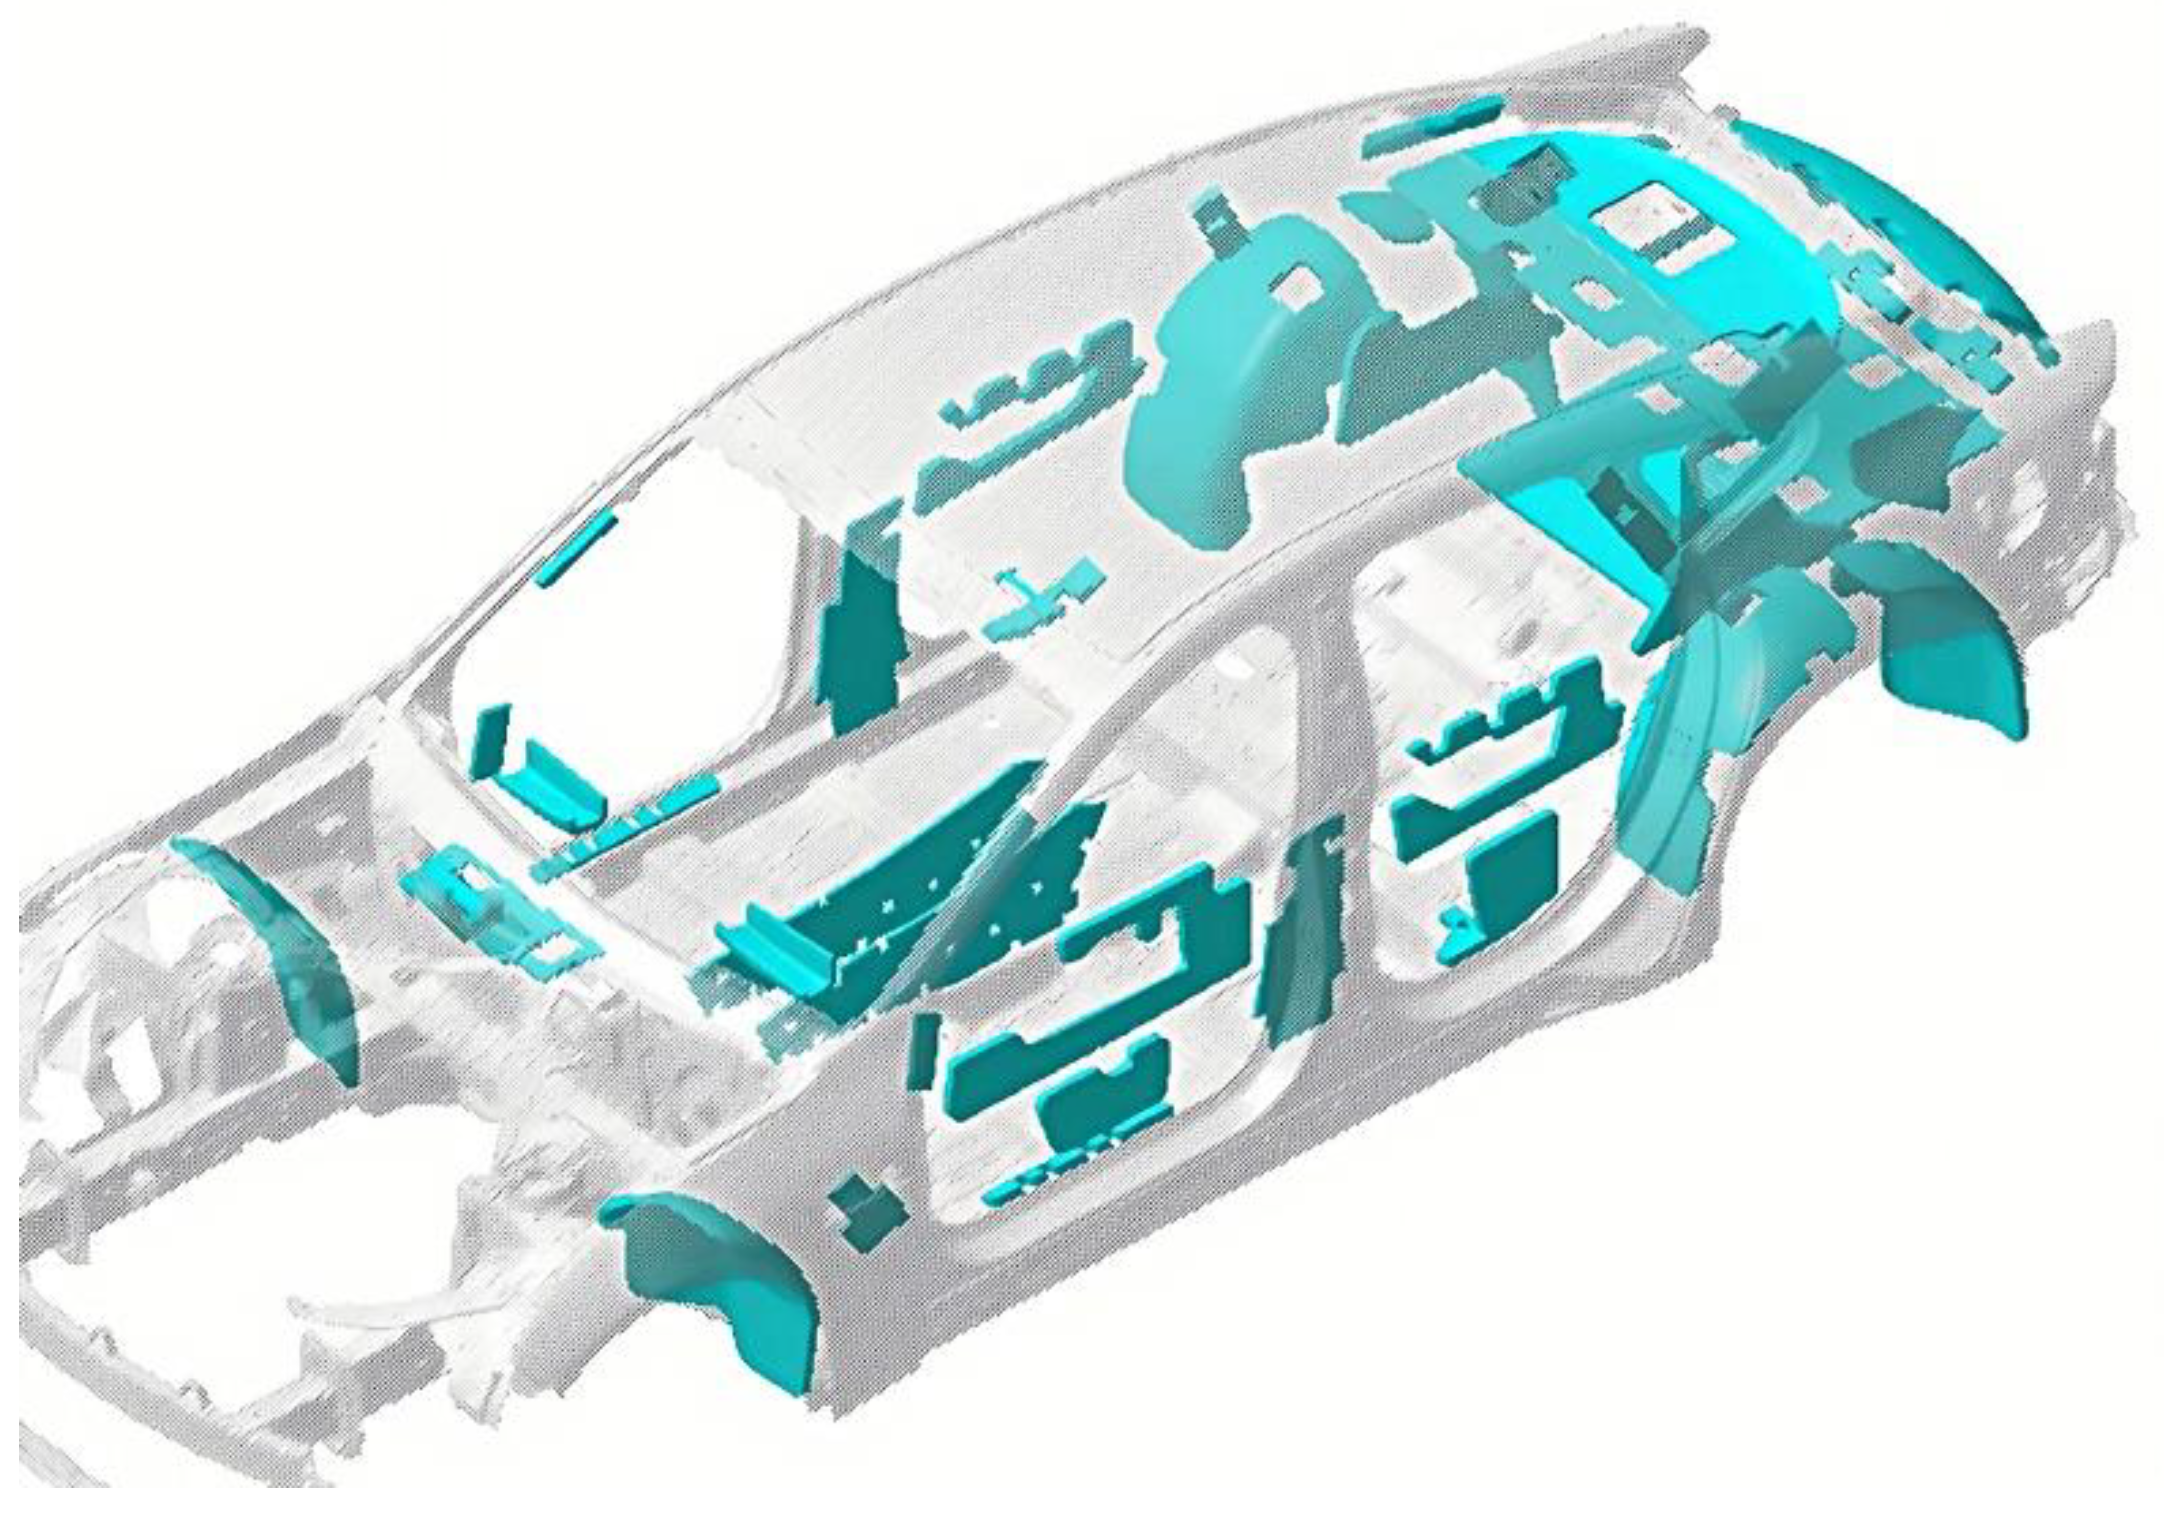
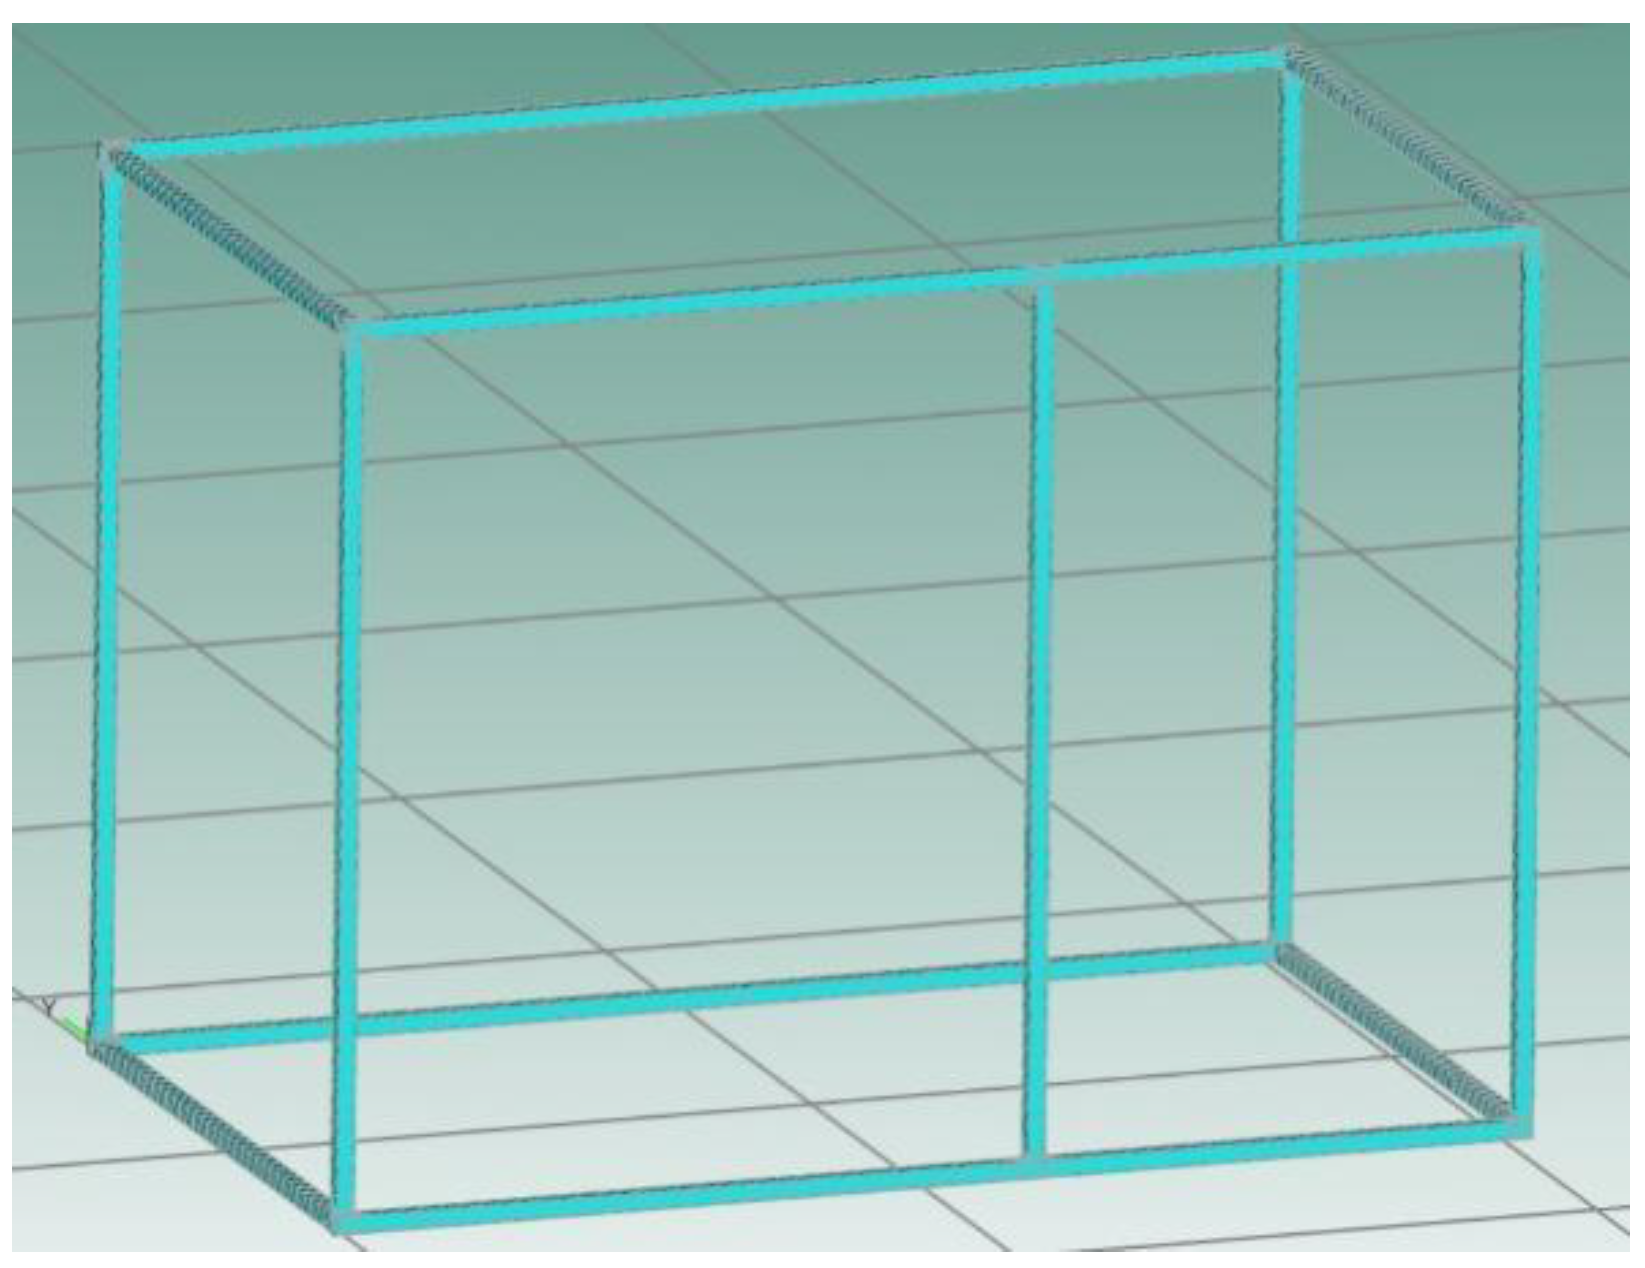
Through simulation analysis, the accuracy of the mixed point connection model under different correction factors has been verified. As shown in Figure 6, the vehicle acoustic package model is selected, and the mixed point model shown in Figure 7 is used for simulation analysis. In this model, the thin plate is connected to the beam structure via nodes. The beam is a hollow square steel beam with a height of 870 mm, a thickness of 2 mm, a length of 1520 mm, and a width of 1000 mm. The two thin plates are aluminum plates with dimensions of 826 mm × 1100 mm and 600 mm × 1100 mm, respectively, and a thickness of 1 mm. The material properties are shown in Table 1, and the vibration frequency ranges from 16 Hz to 1600 Hz, with a load applied to the beam. Ideally, the radiation angle of the point connection is 360°, and the correction factor is 1. The connection part of the model uses the derived mixed point connection model, with the radiation radius correction factor introduced for adjustment. The planar motion of the thin plate and the beam structure are modeled using the finite element method, while the vertical motion of the thin plate is modeled using the statistical energy analysis method. Figure 8 and Figure 9 show the finite element model and the statistical energy model, respectively (Ref. [17]). Compared with the existing radiation angle method, the radiation angles are set to 360°, 180°, and 90°, which are converted to equivalent correction factors of β = 1, β = 0.5, and β = 0.25, respectively, according to the literature and equations.

5.2. Simulation Analysis of the Model Under a 90-Degree Radiation Angle

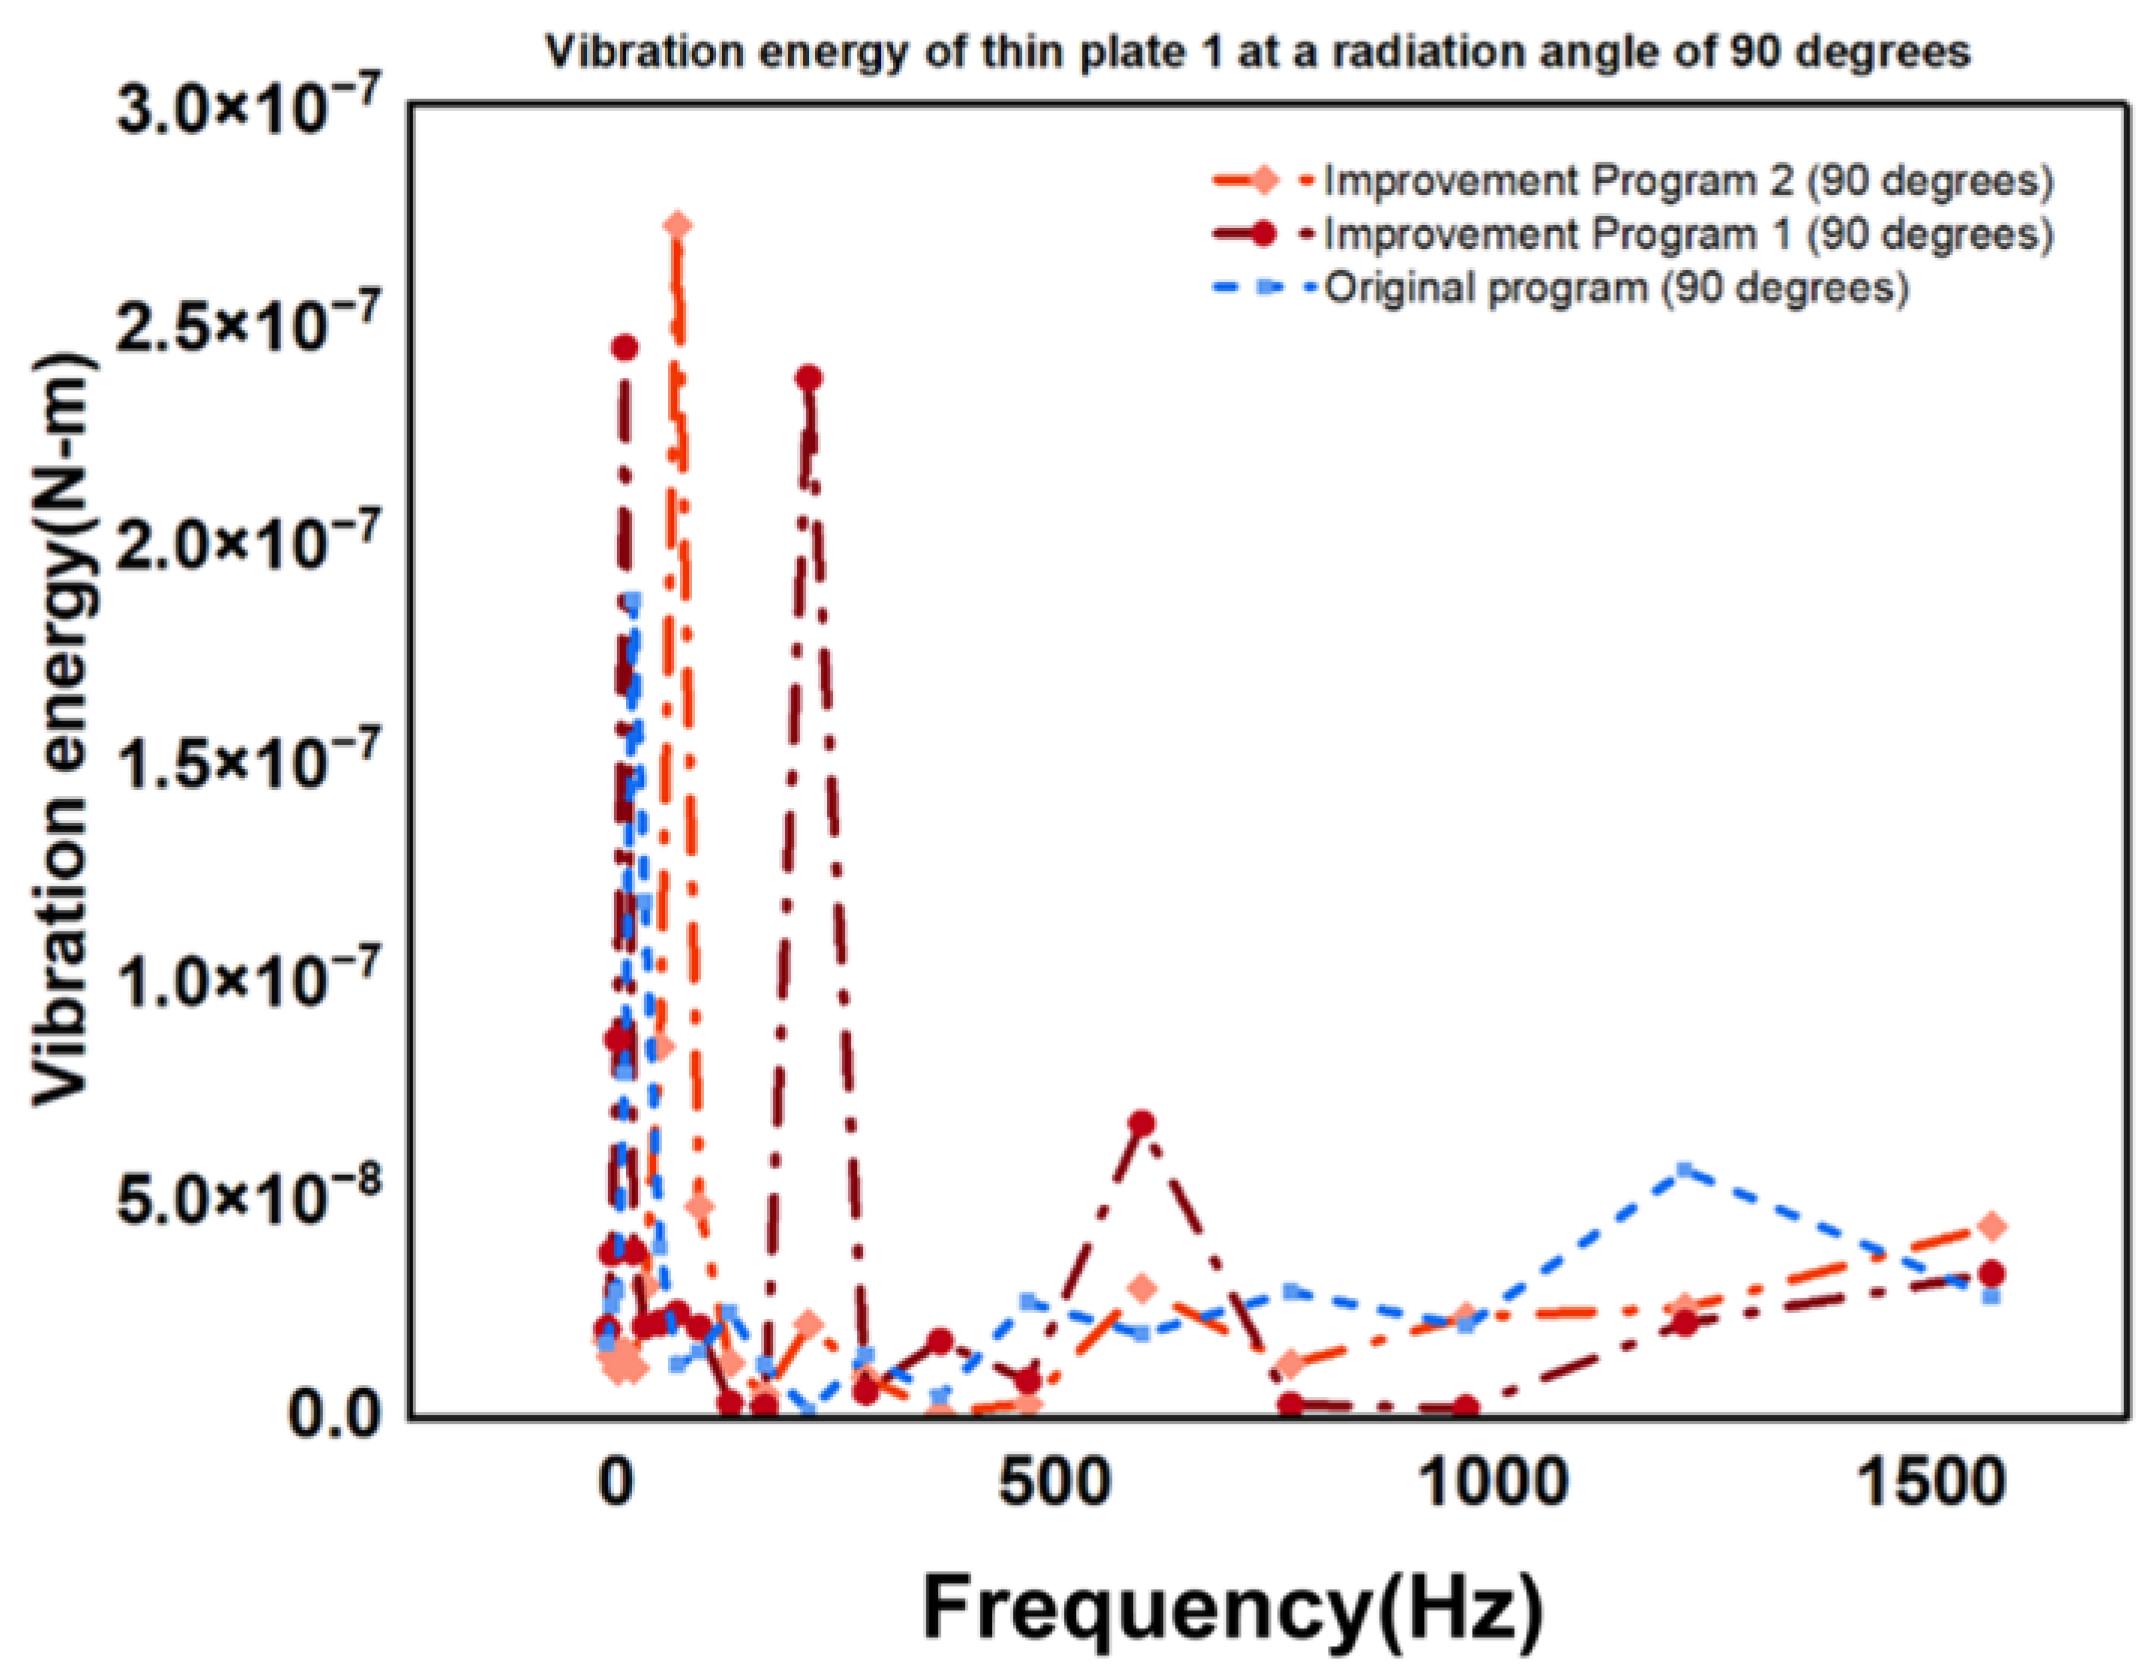
Figure 10 shows the energy changes of Thin Plate 1 under a 90-degree radiation angle. The three lines represent the original program and two improved programs. At low frequencies (16–50 Hz), the energy values of each program are relatively low, indicating less energy dissipation. Around 50 Hz and 100 Hz, the energy value of Improved Program 2 increases significantly, with a more intense vibration response and greater energy dissipation. Above 200 Hz, the energy values of each program tend to converge.
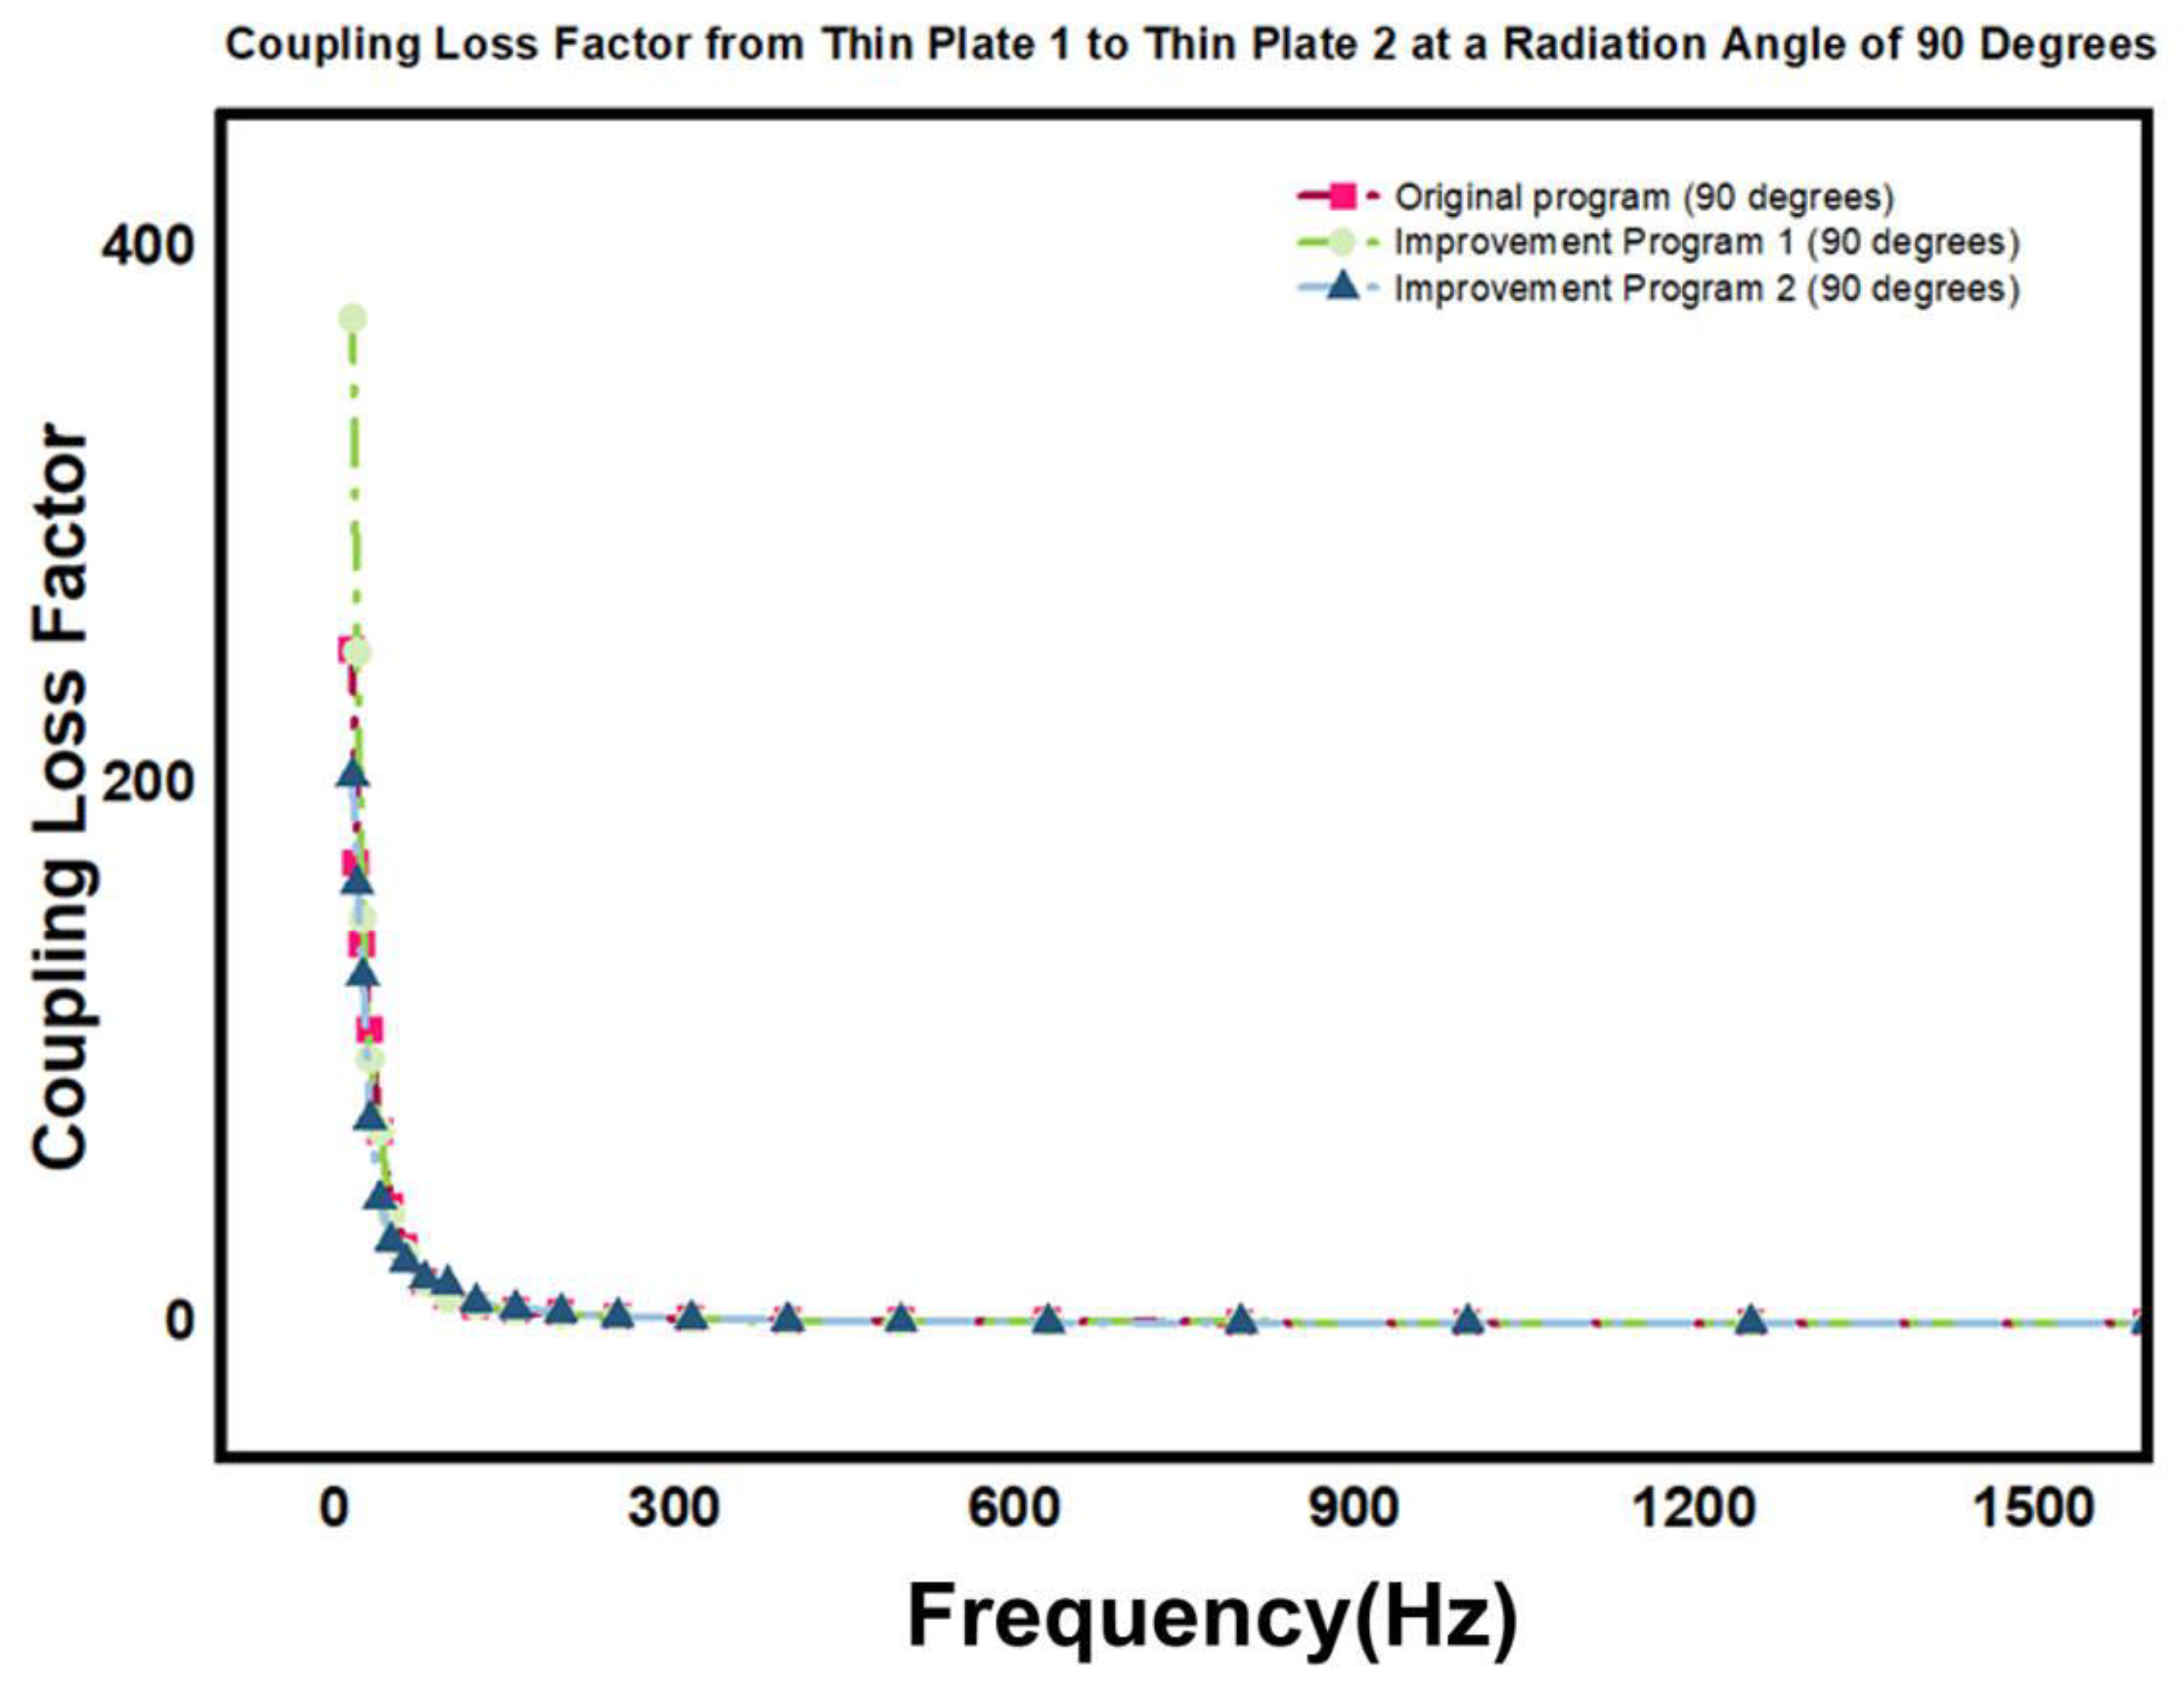
Figure 11 displays the variation of the coupling loss factor from Thin Plate 1 to Thin Plate 2 with frequency under a 90-degree radiation angle. At low frequencies, the coupling loss factor of the original program is the highest, resulting in the lowest energy transfer efficiency. As the frequency increases, the coupling loss factors of each program decrease, and the energy transfer efficiency improves. Improved Program 2 has the lowest coupling loss factor and the highest energy transfer efficiency, demonstrating the best performance.
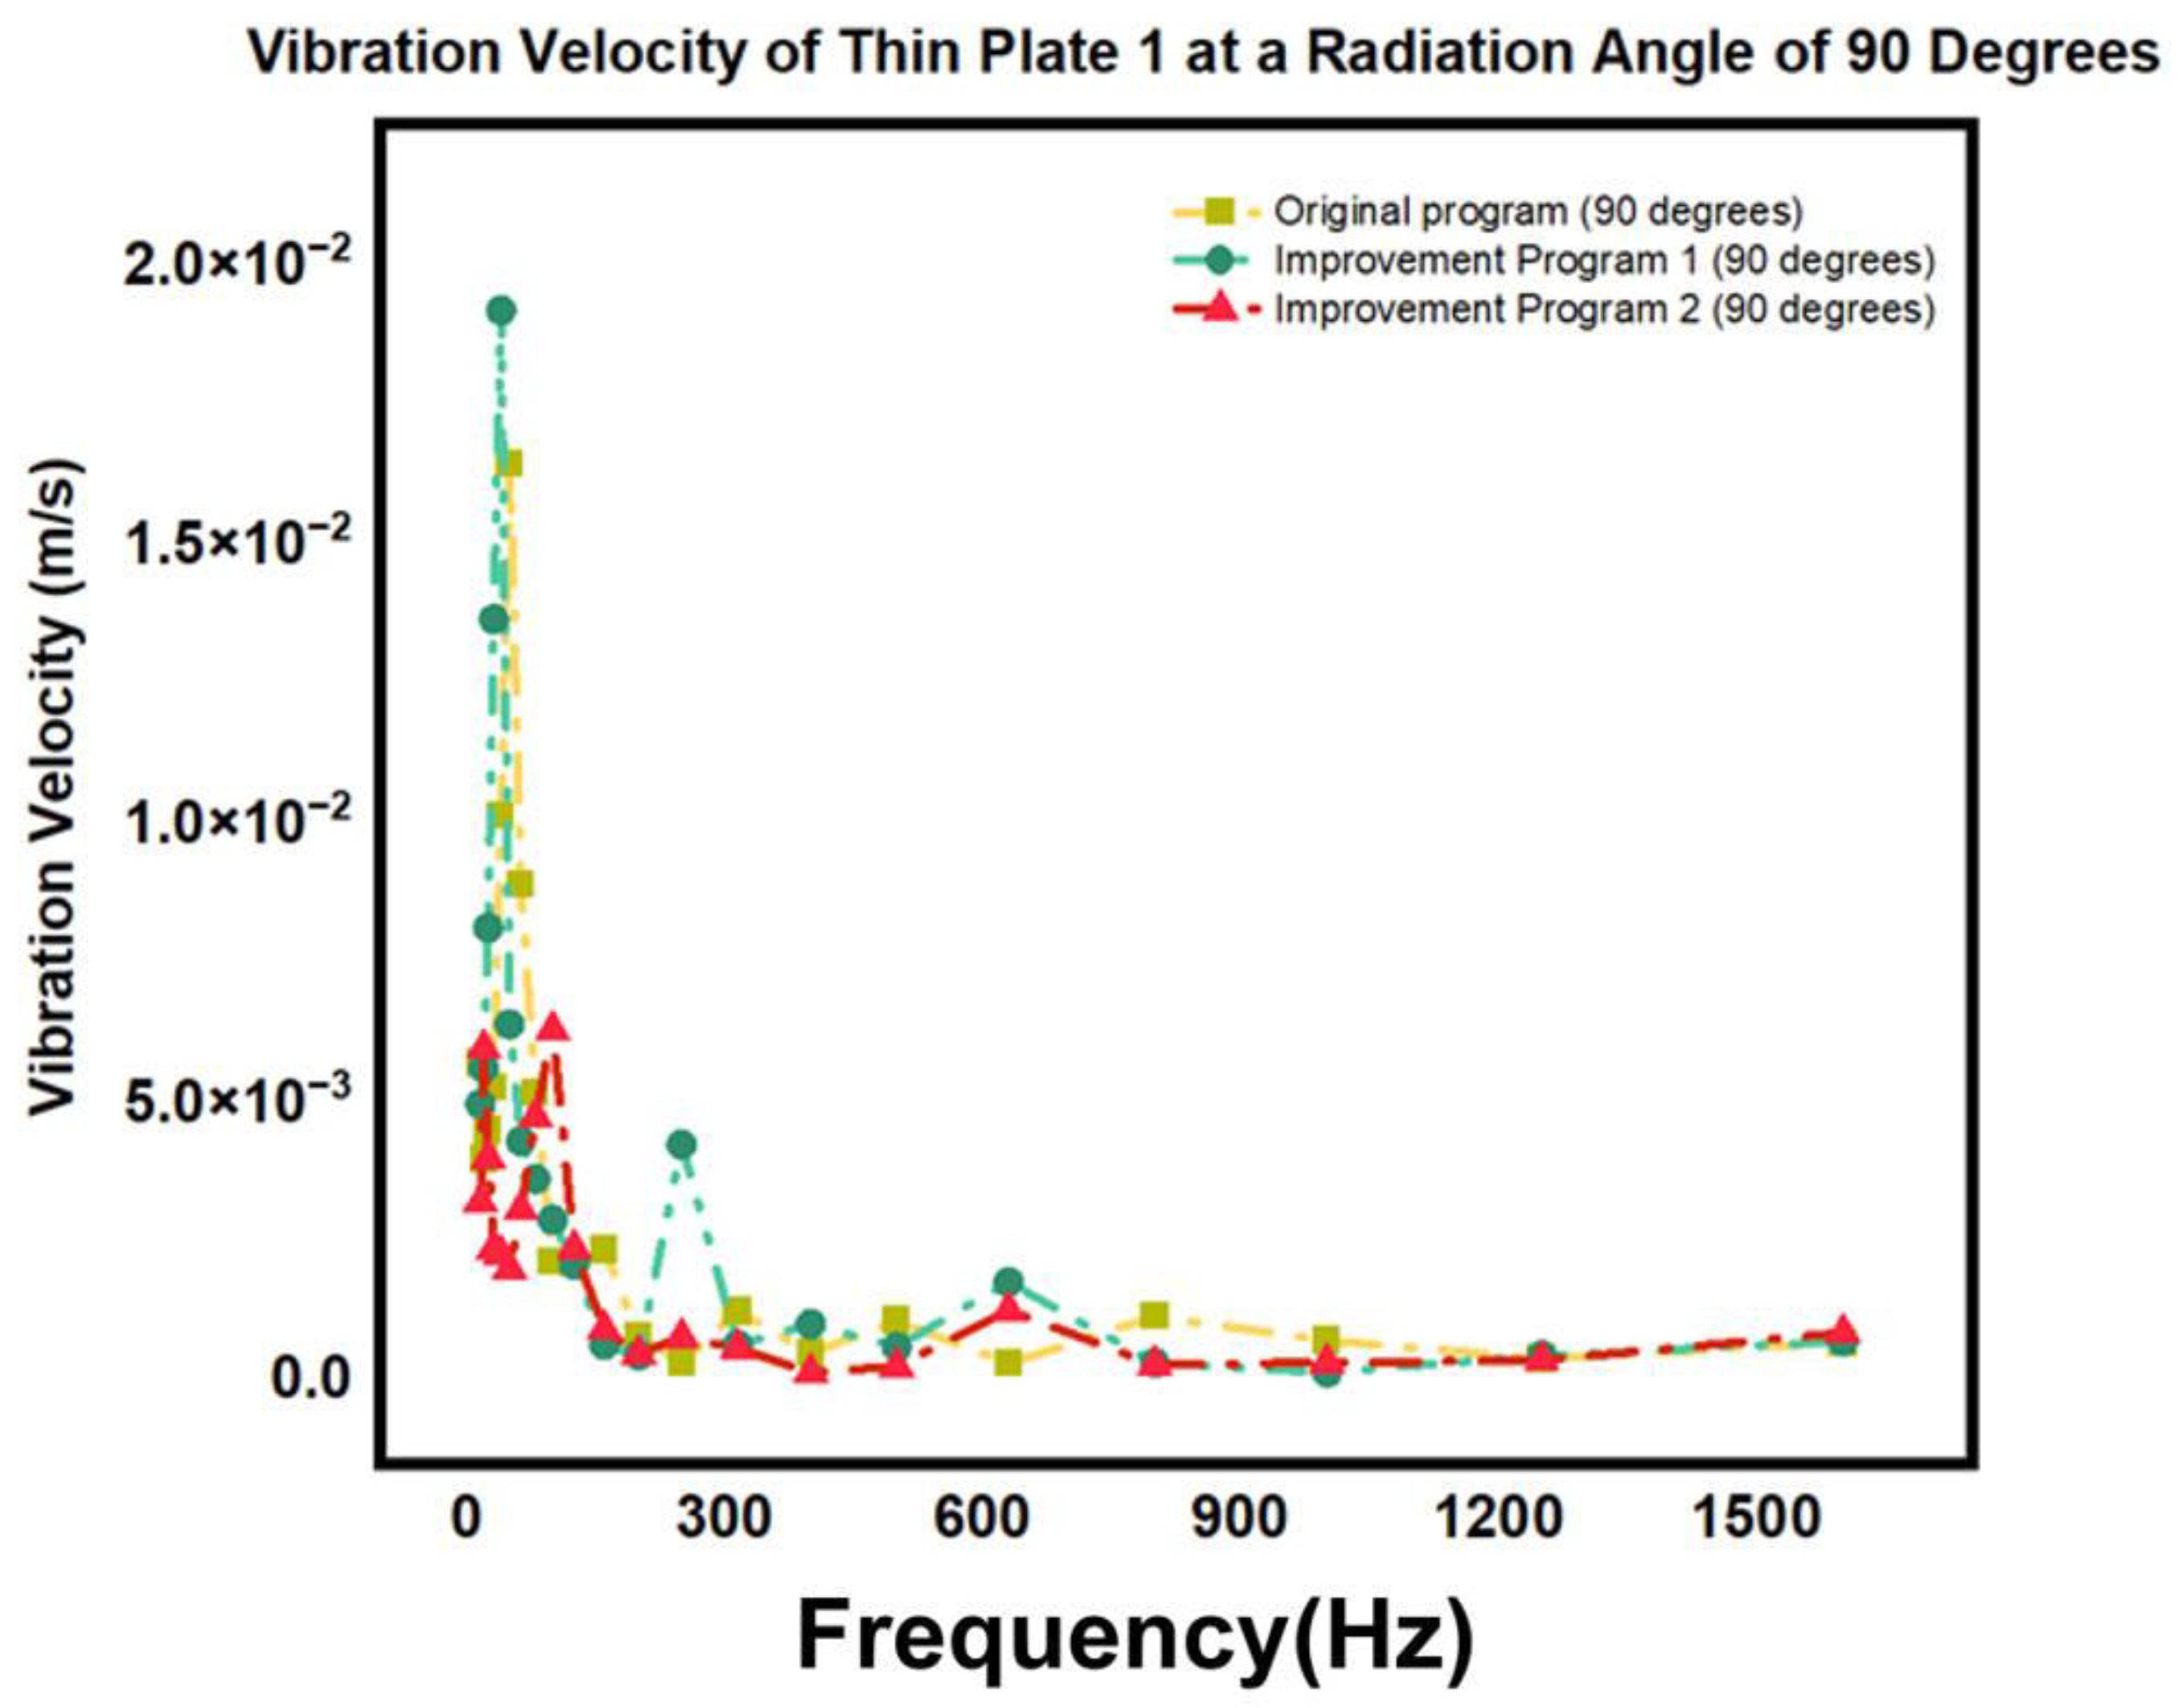
Figure 12 illustrates the variation of the vibration velocity of Thin Plate 1 with frequency under a 90-degree radiation angle. At low frequencies, the vibration velocities of each program are similar. Around 50 Hz and 100 Hz, the vibration velocity of Improved Program 2 increases significantly, reaching a peak before gradually decreasing. At higher frequencies, the vibration velocities tend to be consistent, but Improved Program 2 remains slightly higher at certain points, indicating a greater intensity of vibration response.
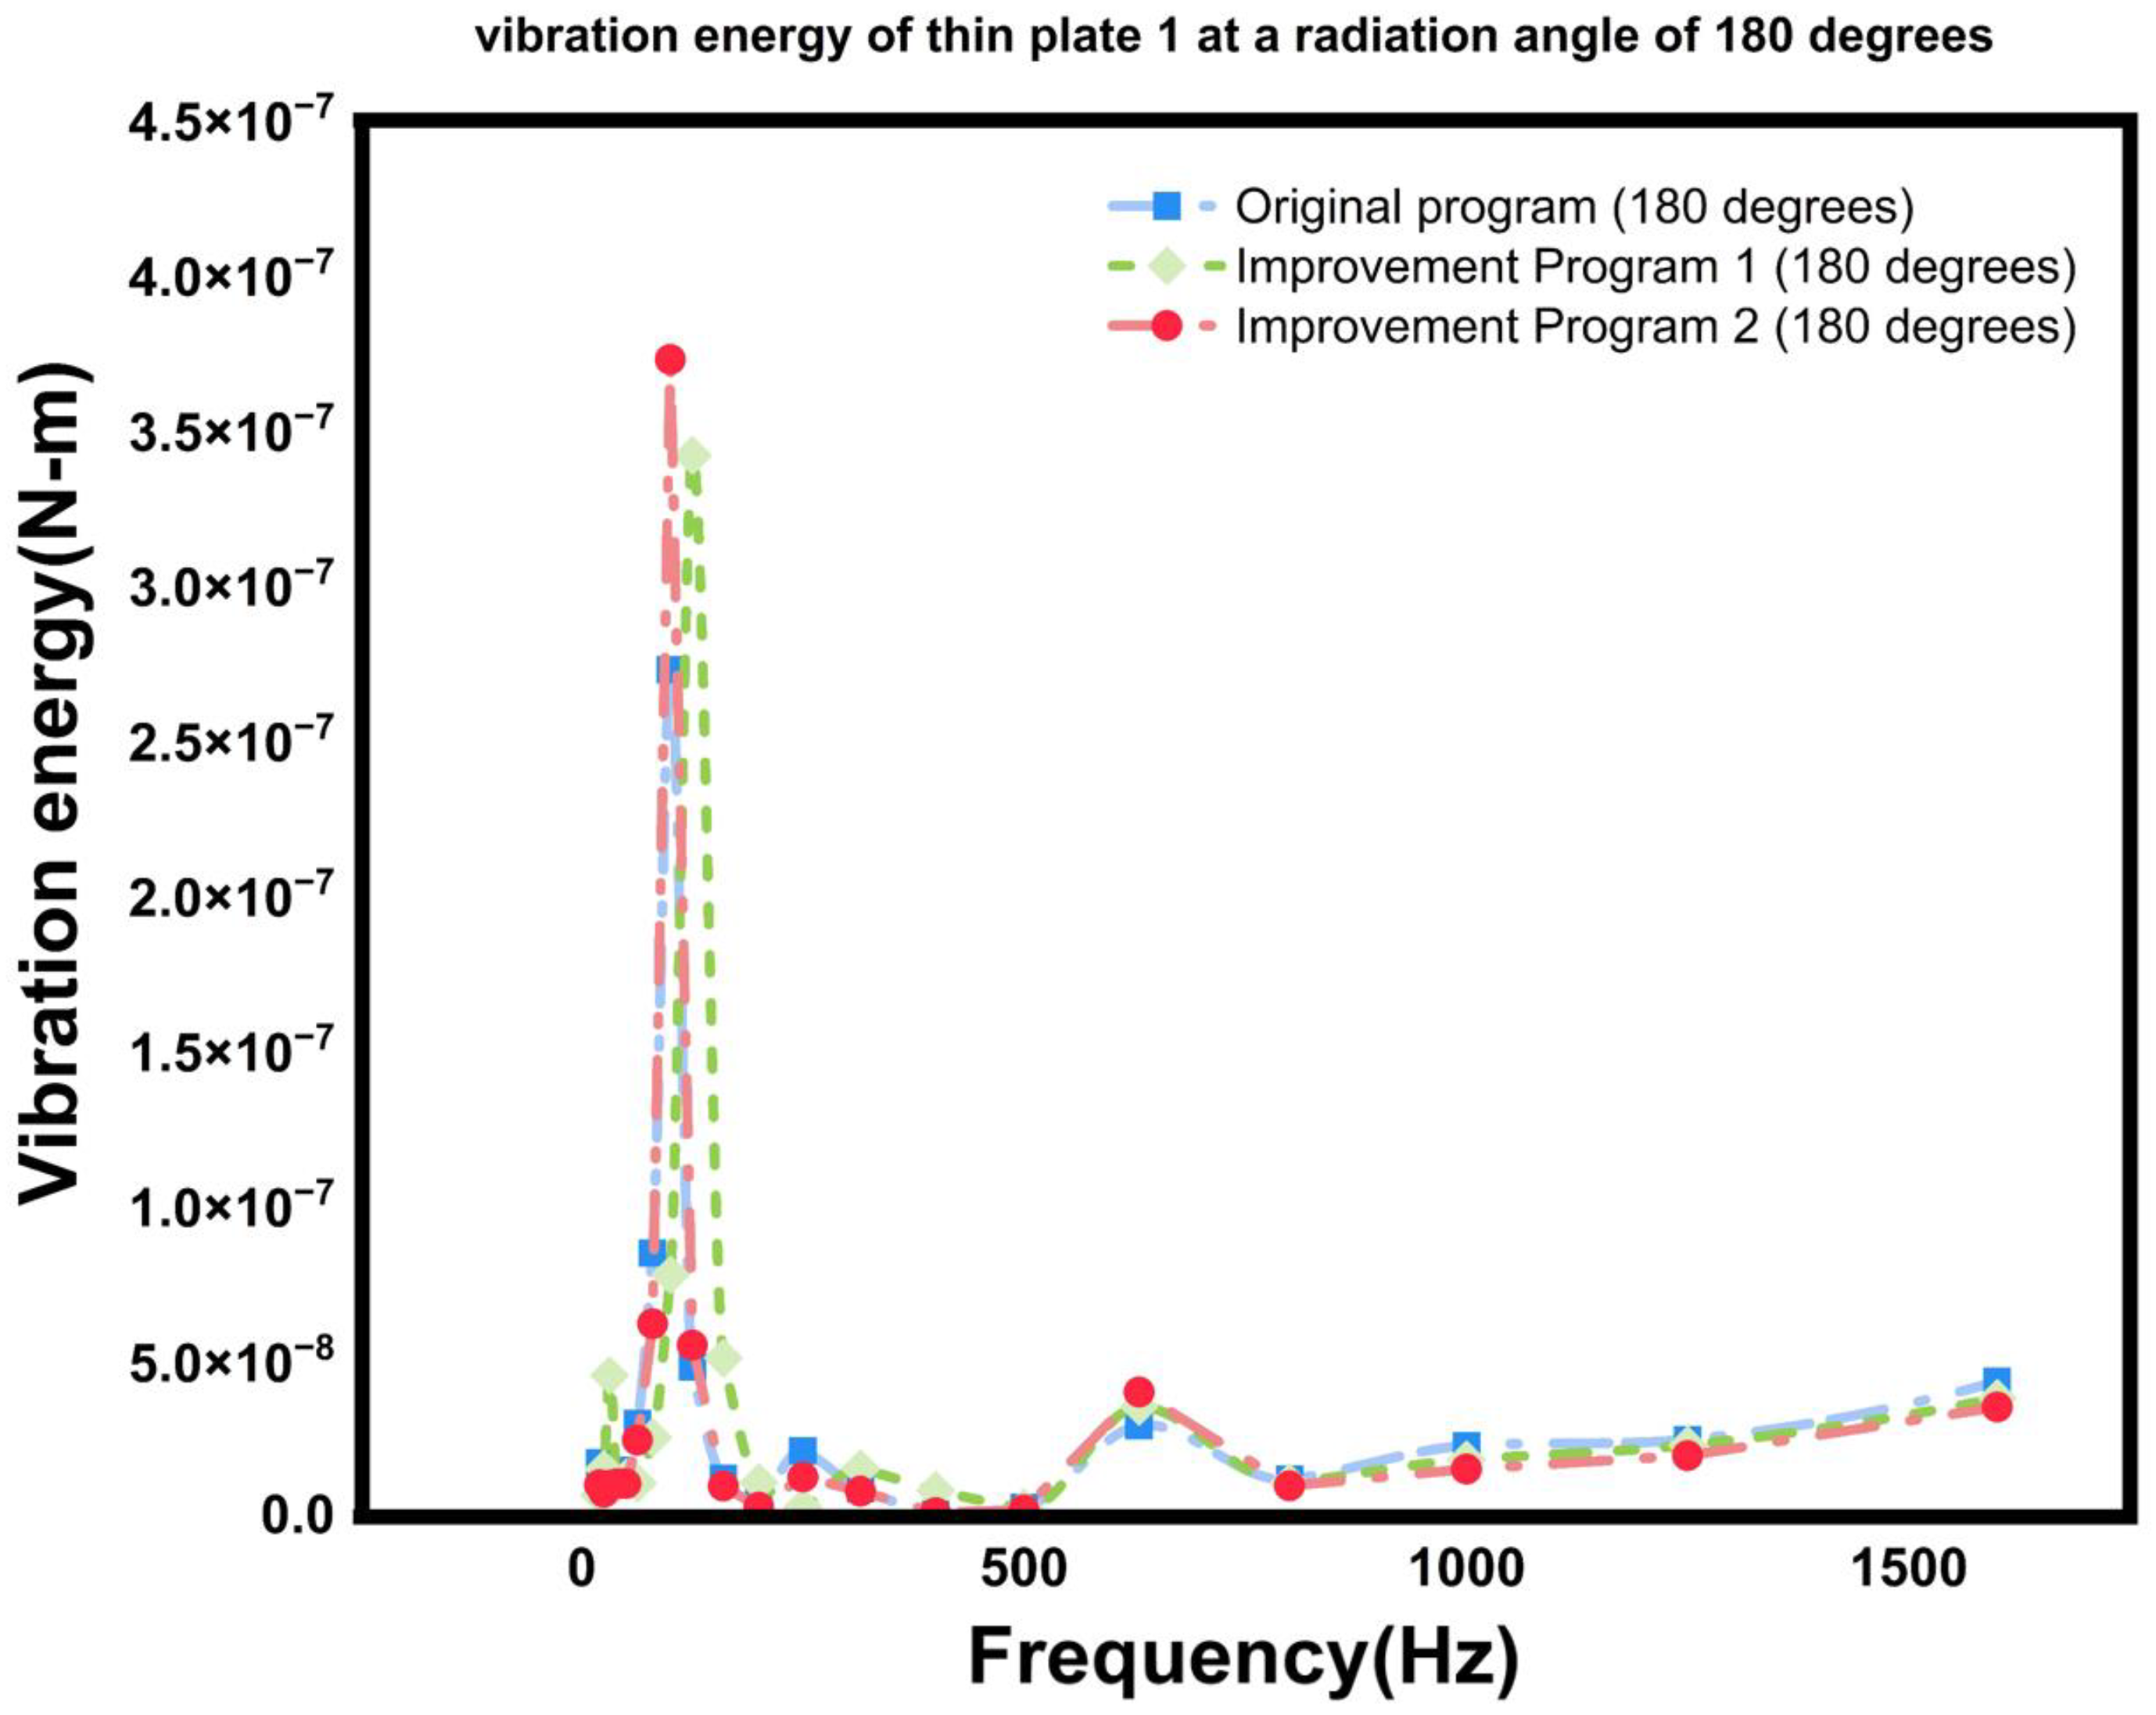
Figure 13 shows the energy changes of Thin Plate 1 under a 180-degree radiation angle, with the three lines representing the original program and two improved programs. At low frequencies (16–50 Hz), the energy values of each program are relatively low, indicating less energy dissipation. Around 50 Hz and 100 Hz, the energy value of Improved Program 2 increases significantly, with greater energy dissipation and a more intense vibration response. At higher frequencies, the energy values tend to converge, but Improved Program 2 remains slightly higher at certain points, indicating relatively greater energy dissipation.
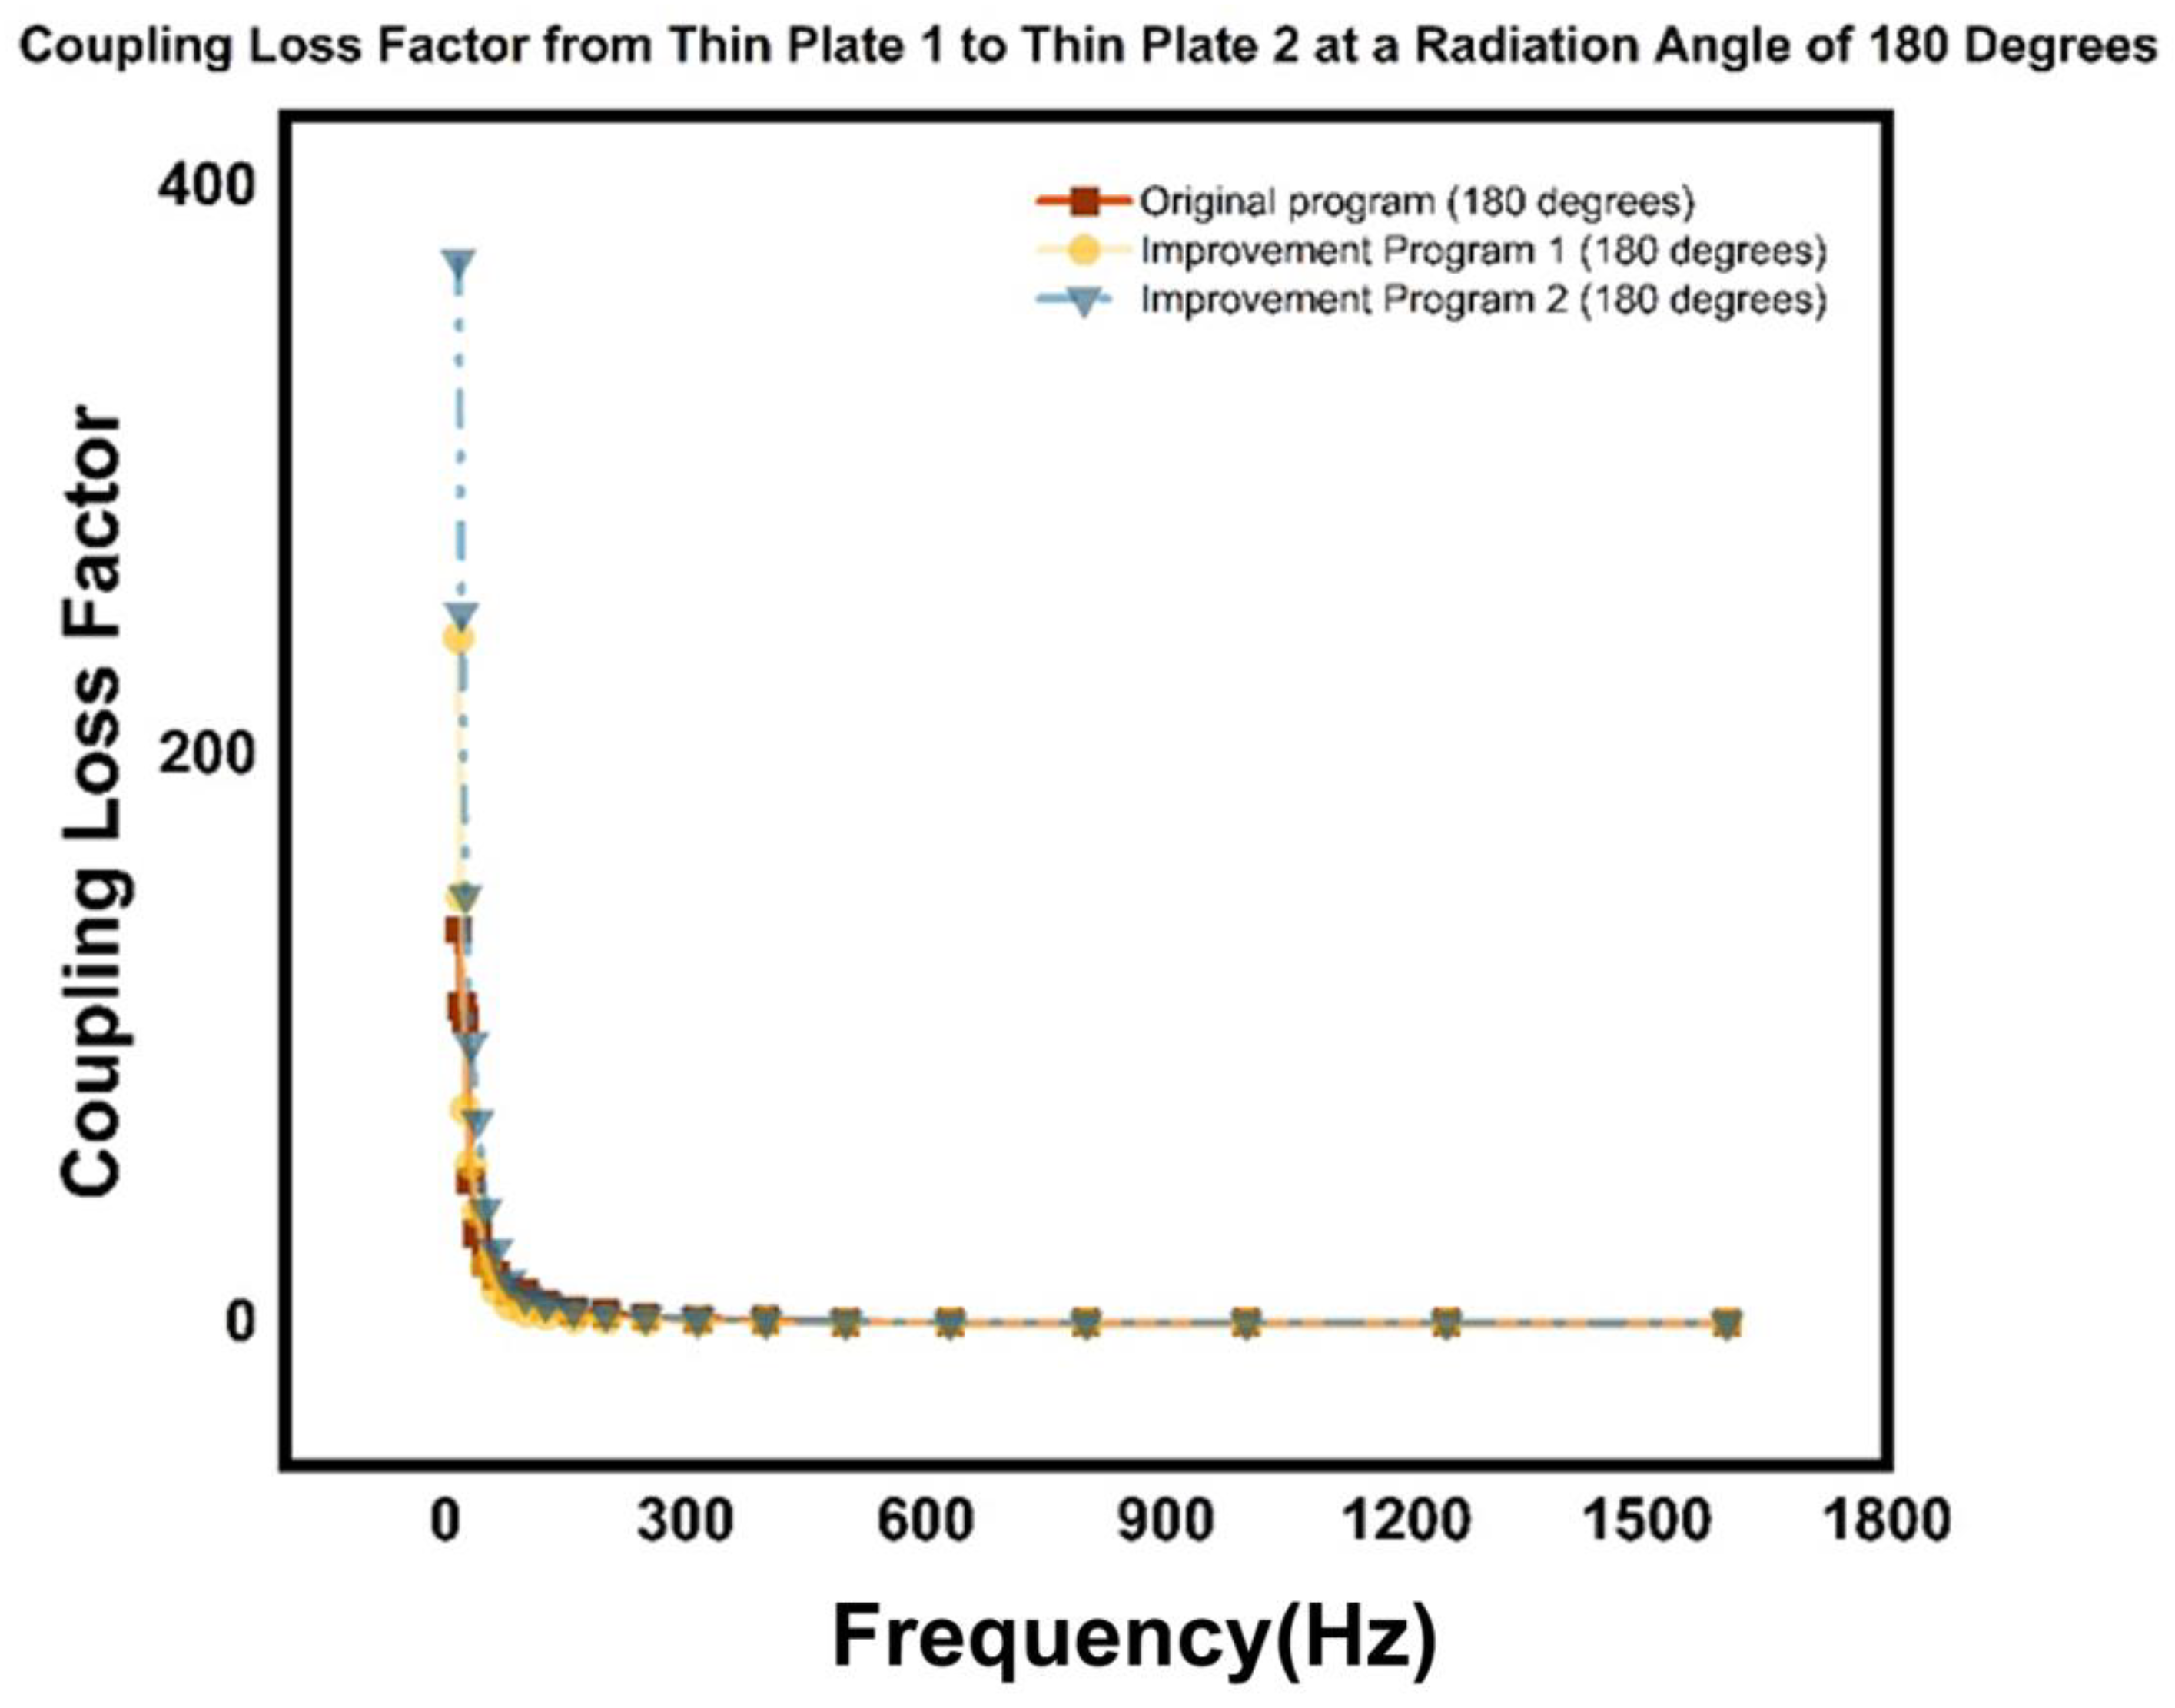
Figure 14 shows the variation of the coupling loss factor from Thin Plate 1 to Thin Plate 2 with frequency under a 180-degree radiation angle. At low frequencies, the coupling loss factor of the original program is the highest, resulting in the lowest energy transfer efficiency. As the frequency increases, the coupling loss factors of each program gradually decrease, and the energy transfer efficiency improves. Improved Program 2 has the lowest coupling loss factor and the highest energy transfer efficiency, with the least energy loss, showing the best performance.
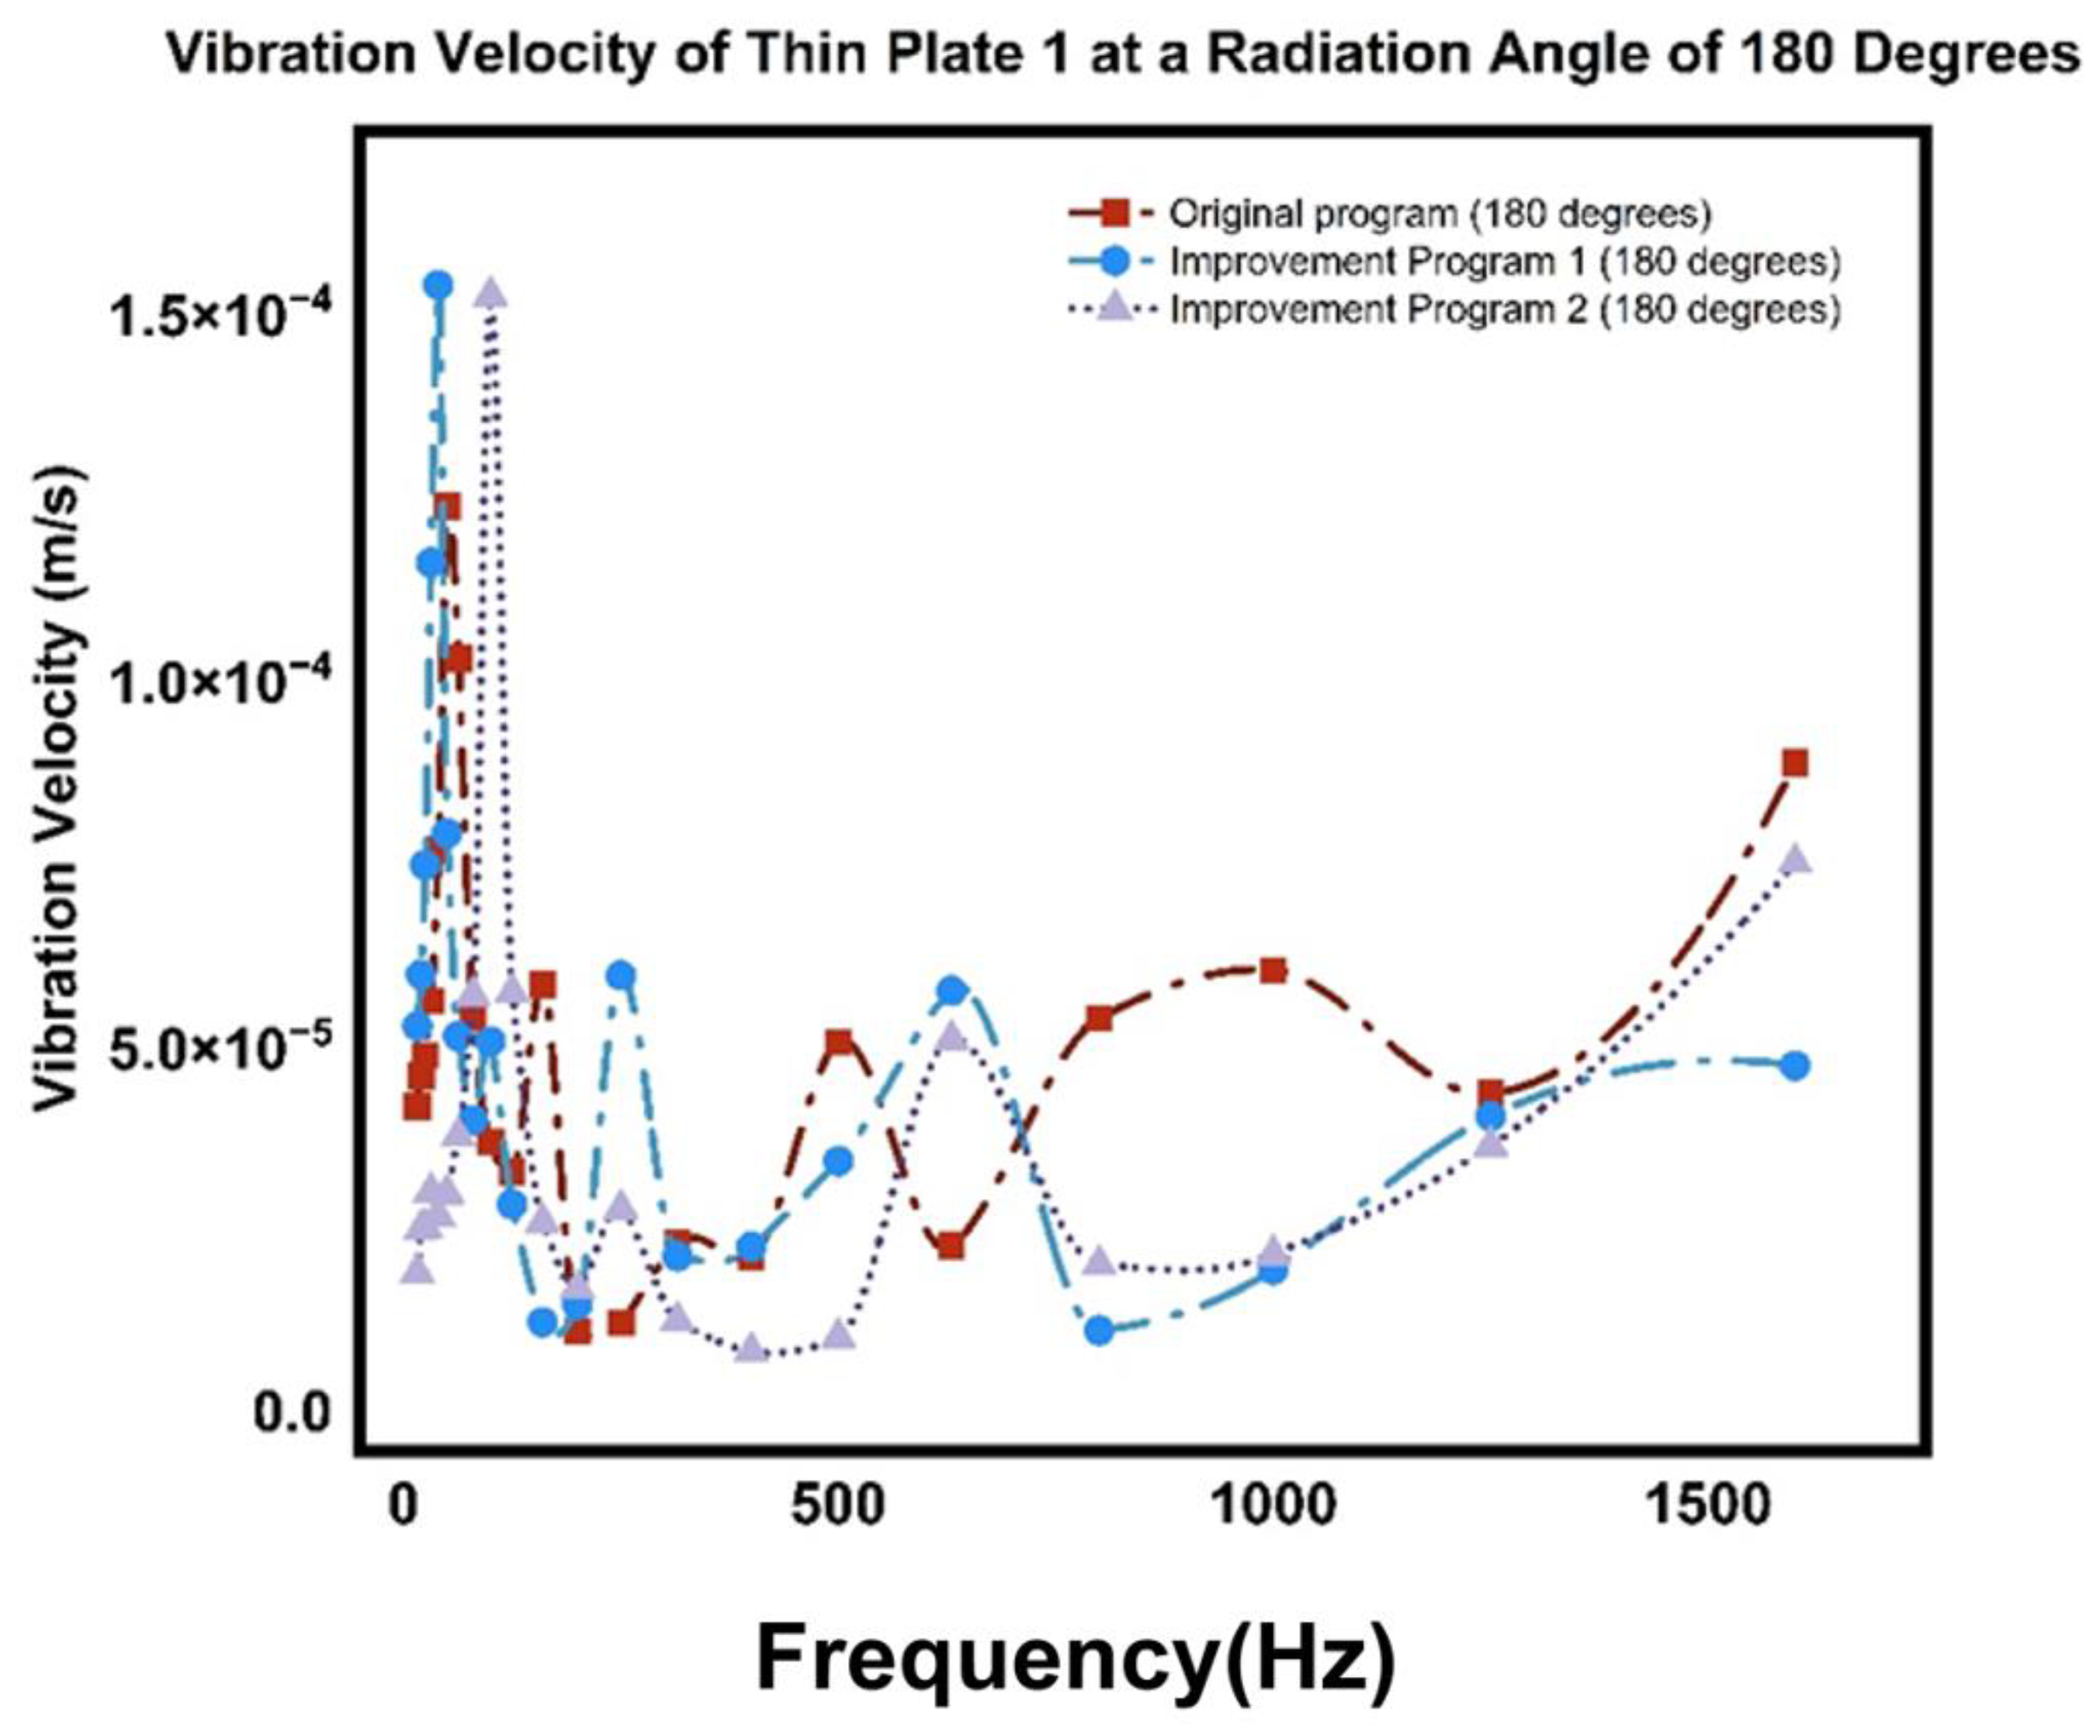
Figure 15 illustrates the variation of the vibration velocity of Thin Plate 1 with frequency under a 180-degree radiation angle. At low frequencies, the vibration velocities of each program are similar, with comparable vibration response intensity. Around 50 Hz and 100 Hz, the vibration velocity of Improved Program 2 increases significantly, reaching a peak before gradually decreasing, indicating the highest vibration response intensity, which then weakens with increasing frequency. At higher frequencies, the vibration velocities tend to be consistent, but Improved Program 2 remains slightly higher at certain points, indicating relatively greater vibration response intensity.

5.3. Simulation Analysis of the Model at a Radiation Angle of 360 Degrees

Figure 16 shows the energy changes of Thin Plate 1 under a 360-degree radiation angle, with the three lines representing the energy values of the original program and two improved programs as the vibration frequency changes. In the low-frequency range, the energy values of all programs are relatively low, indicating less energy dissipation in the system. Around 50 Hz, the energy value of Improved Program 2 increases significantly, exceeding the other programs, indicating greater energy dissipation and a more intense response at this frequency. Around 100 Hz, Improved Program 2 again shows an energy peak. At higher frequencies, the energy values tend to converge, but Improved Program 2 remains slightly higher at certain points, indicating relatively greater energy dissipation at these frequencies.
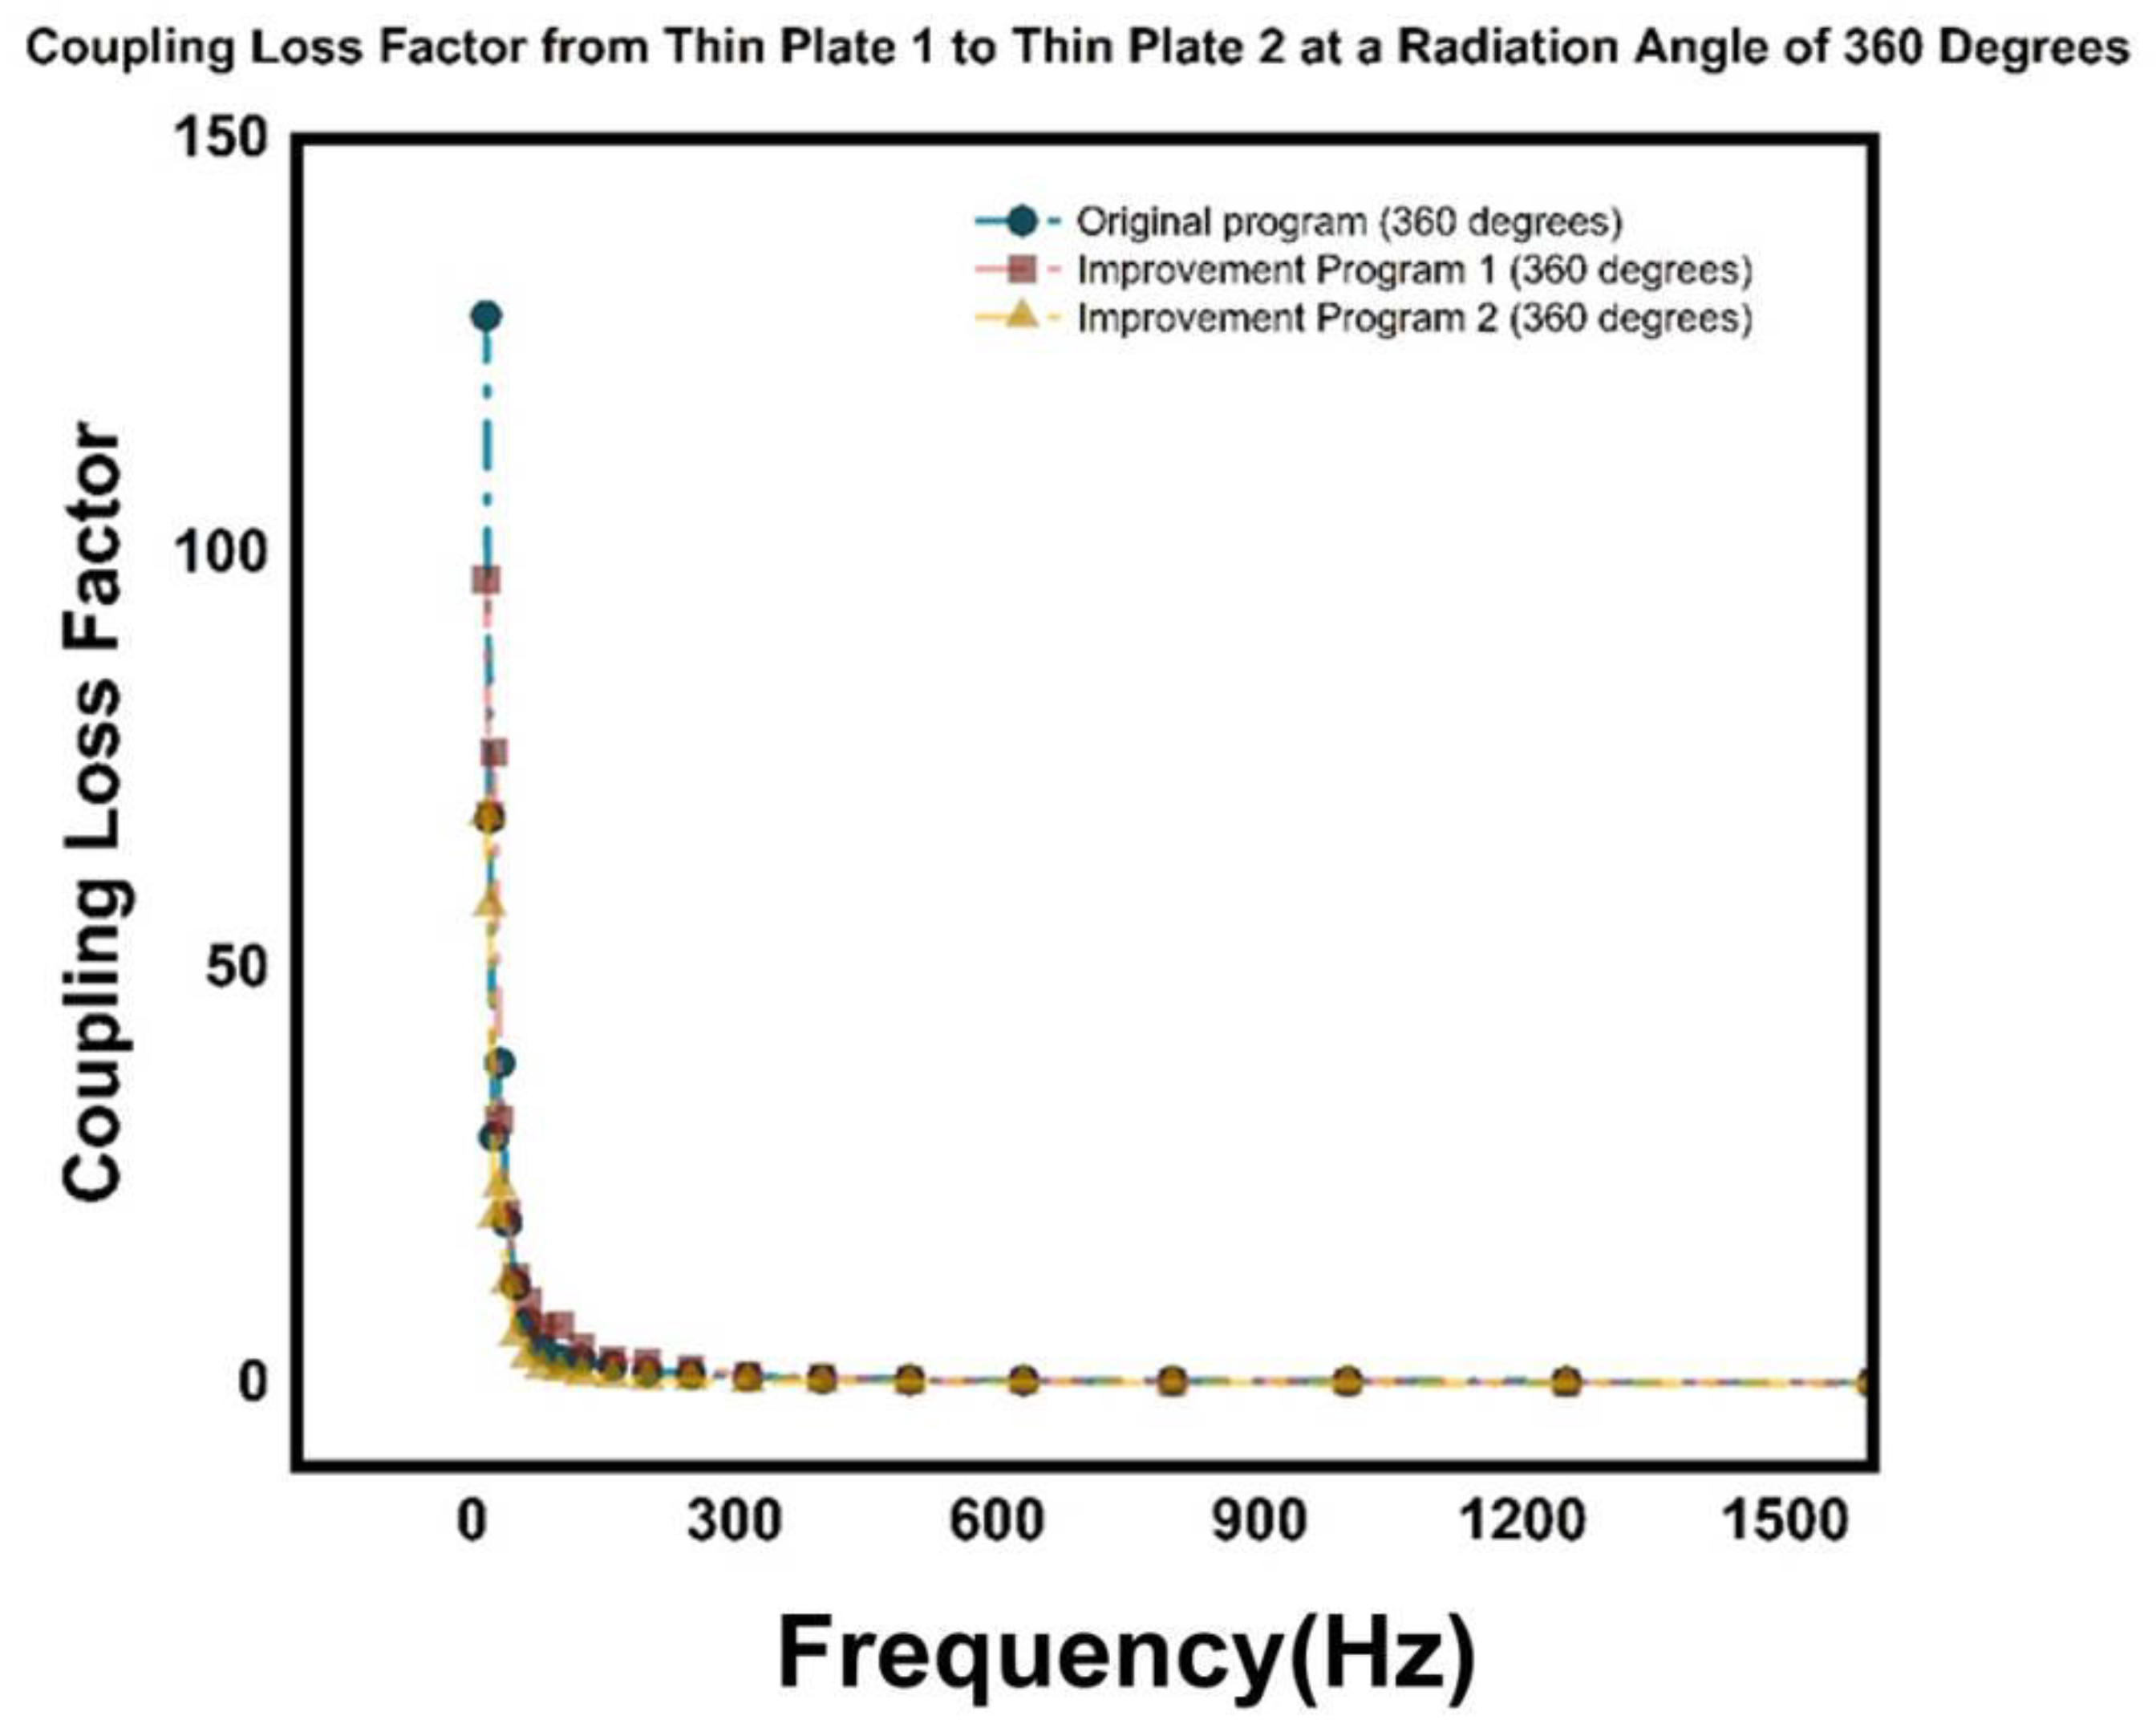
Figure 17 shows the variation of the coupling loss factor from Thin Plate 1 to Thin Plate 2 with frequency under a 360-degree radiation angle. In the low-frequency range, the coupling loss factor of the original program is the highest, indicating the lowest energy transfer efficiency and the greatest energy loss. As the frequency increases, the coupling loss factors of all programs gradually decrease, and the energy transfer efficiency gradually improves. Throughout the entire frequency range, Improved Program 2 has the lowest coupling loss factor, indicating the highest energy transfer efficiency and the least energy loss, making it the best-performing of the three programs.
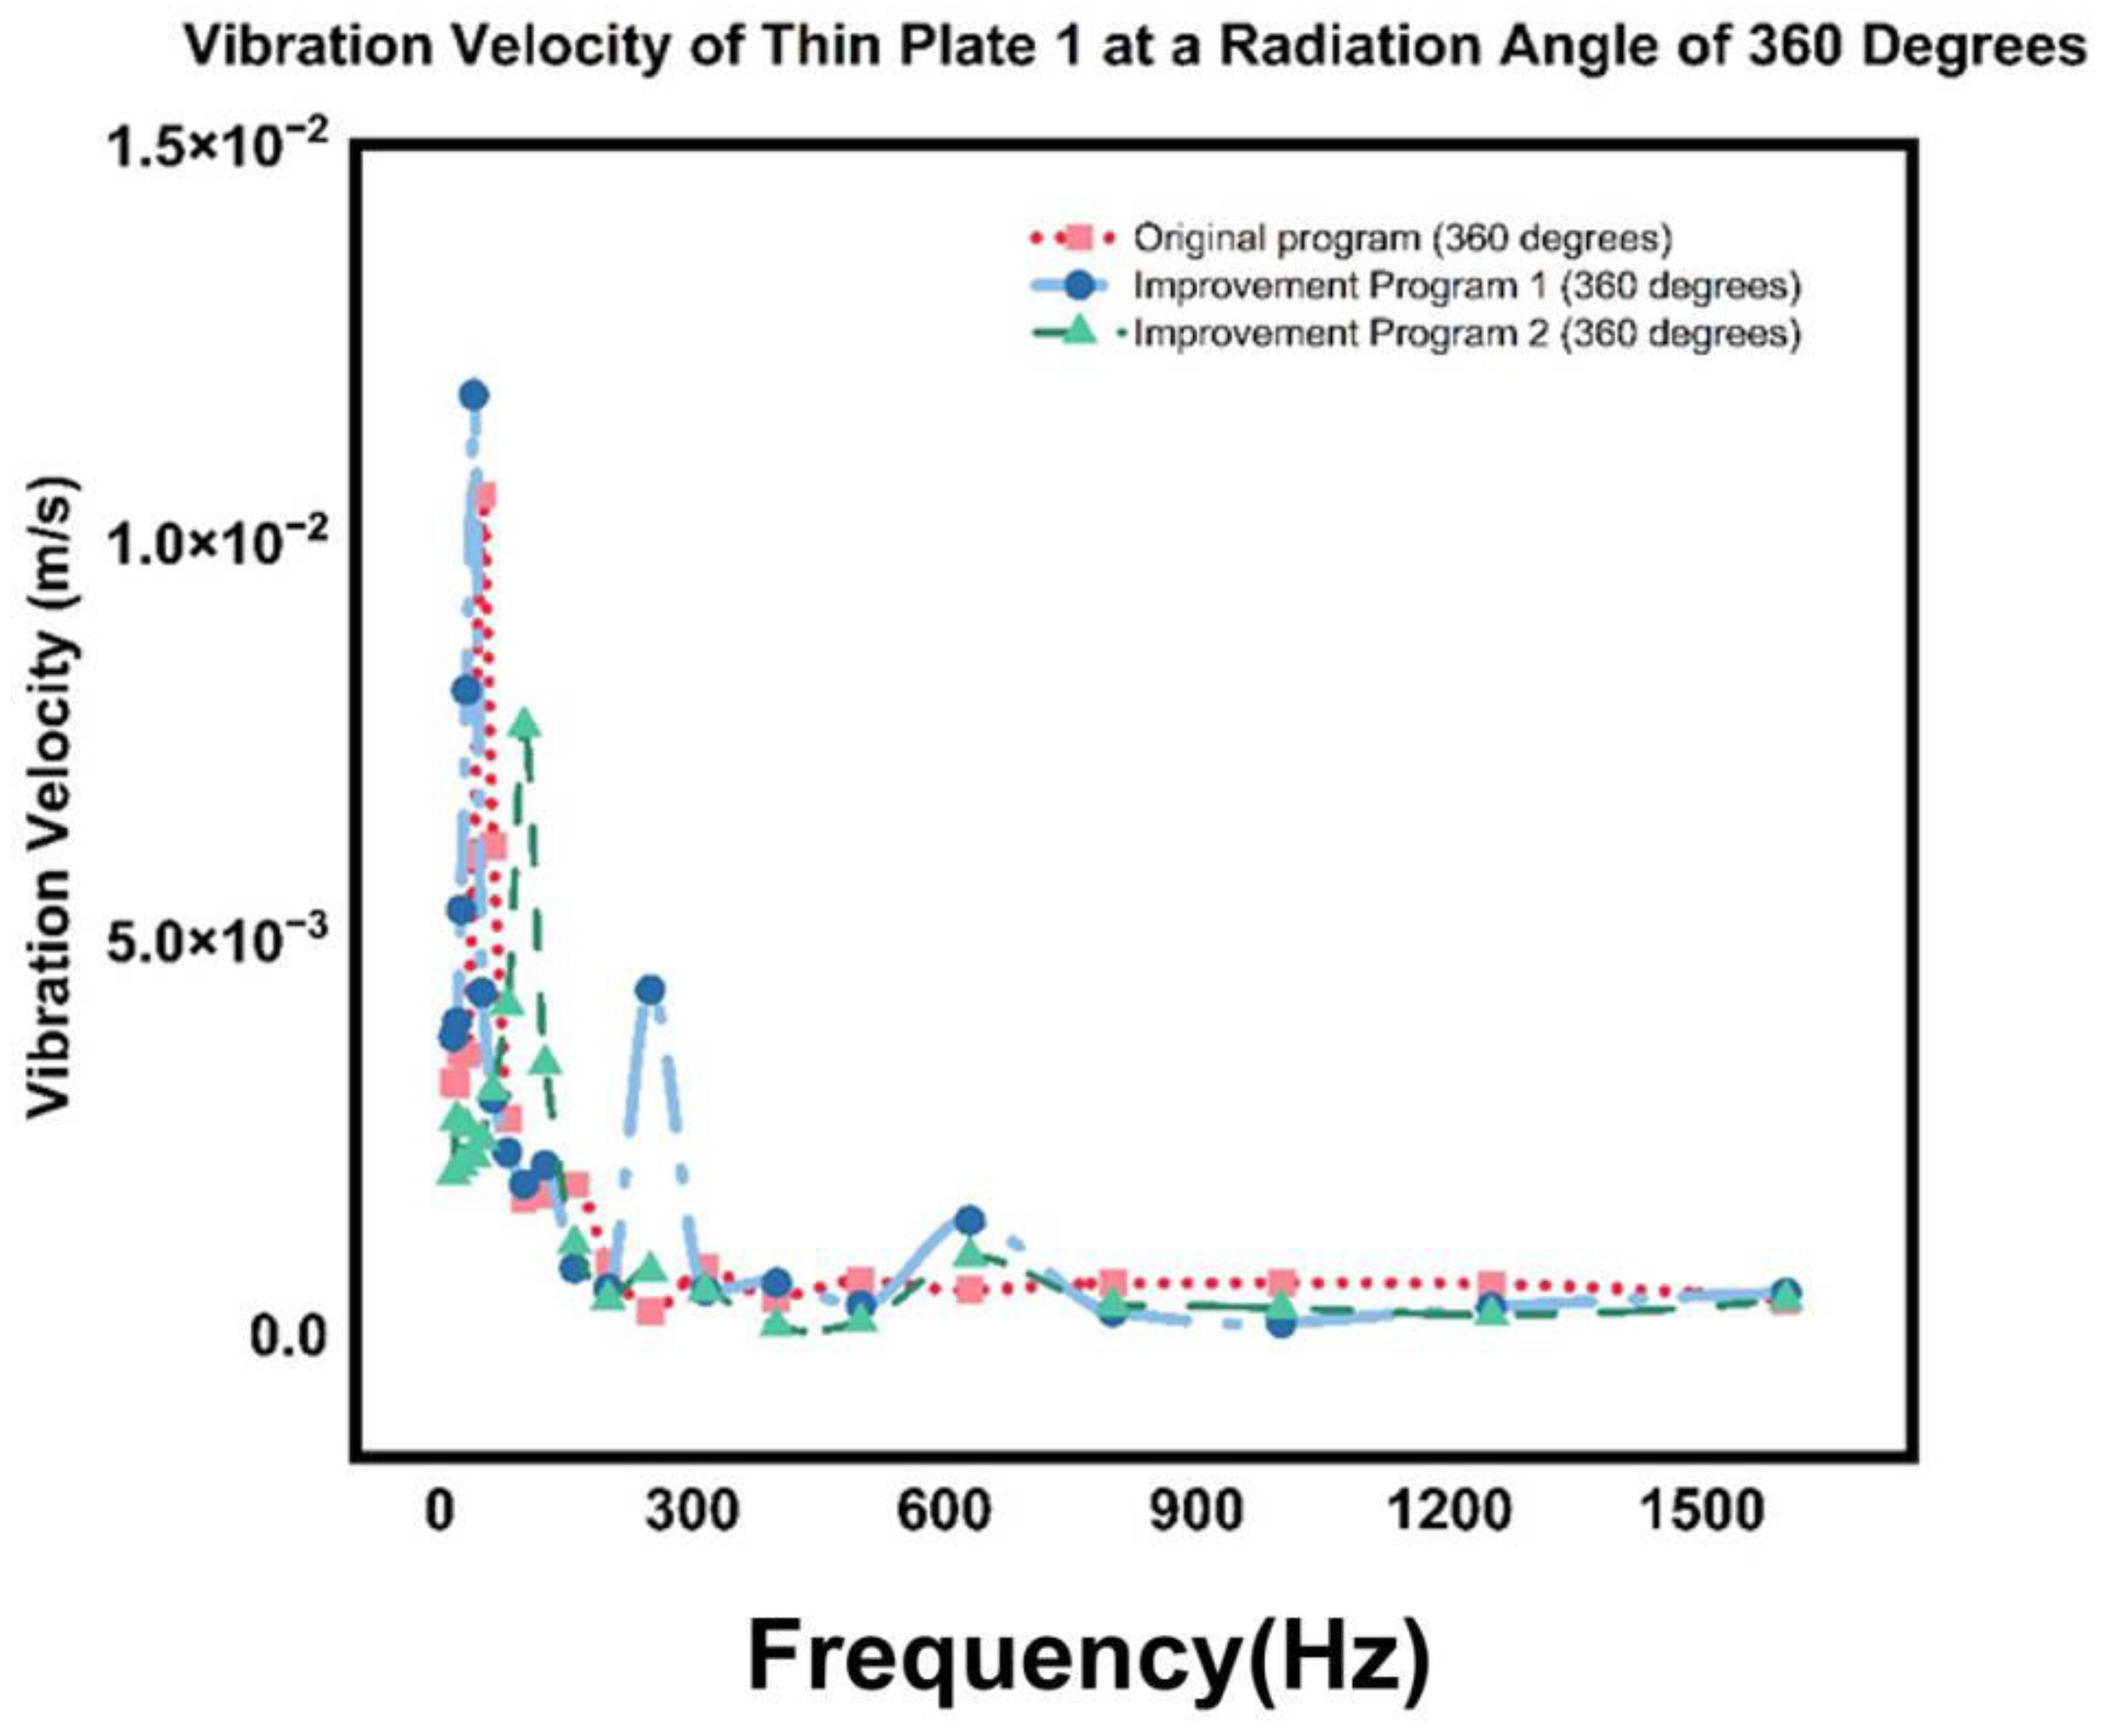
Figure 18 illustrates the variation of the vibration velocity of Thin Plate 1 with frequency under a 360-degree radiation angle. In the low-frequency range, the vibration velocities of all programs are similar, indicating comparable vibration response intensity among the programs. Around 50 Hz, the vibration velocity of Improved Program 2 increases significantly, indicating the highest vibration response intensity at this frequency. Around 100 Hz, Improved Program 2 again reaches a peak before gradually decreasing. At higher frequencies, the vibration velocities tend to be consistent, but Improved Program 2 remains slightly higher at certain points, indicating relatively greater vibration response intensity at these frequencies.

5.4. Analysis of Different Working Conditions Under the FE Subsystem

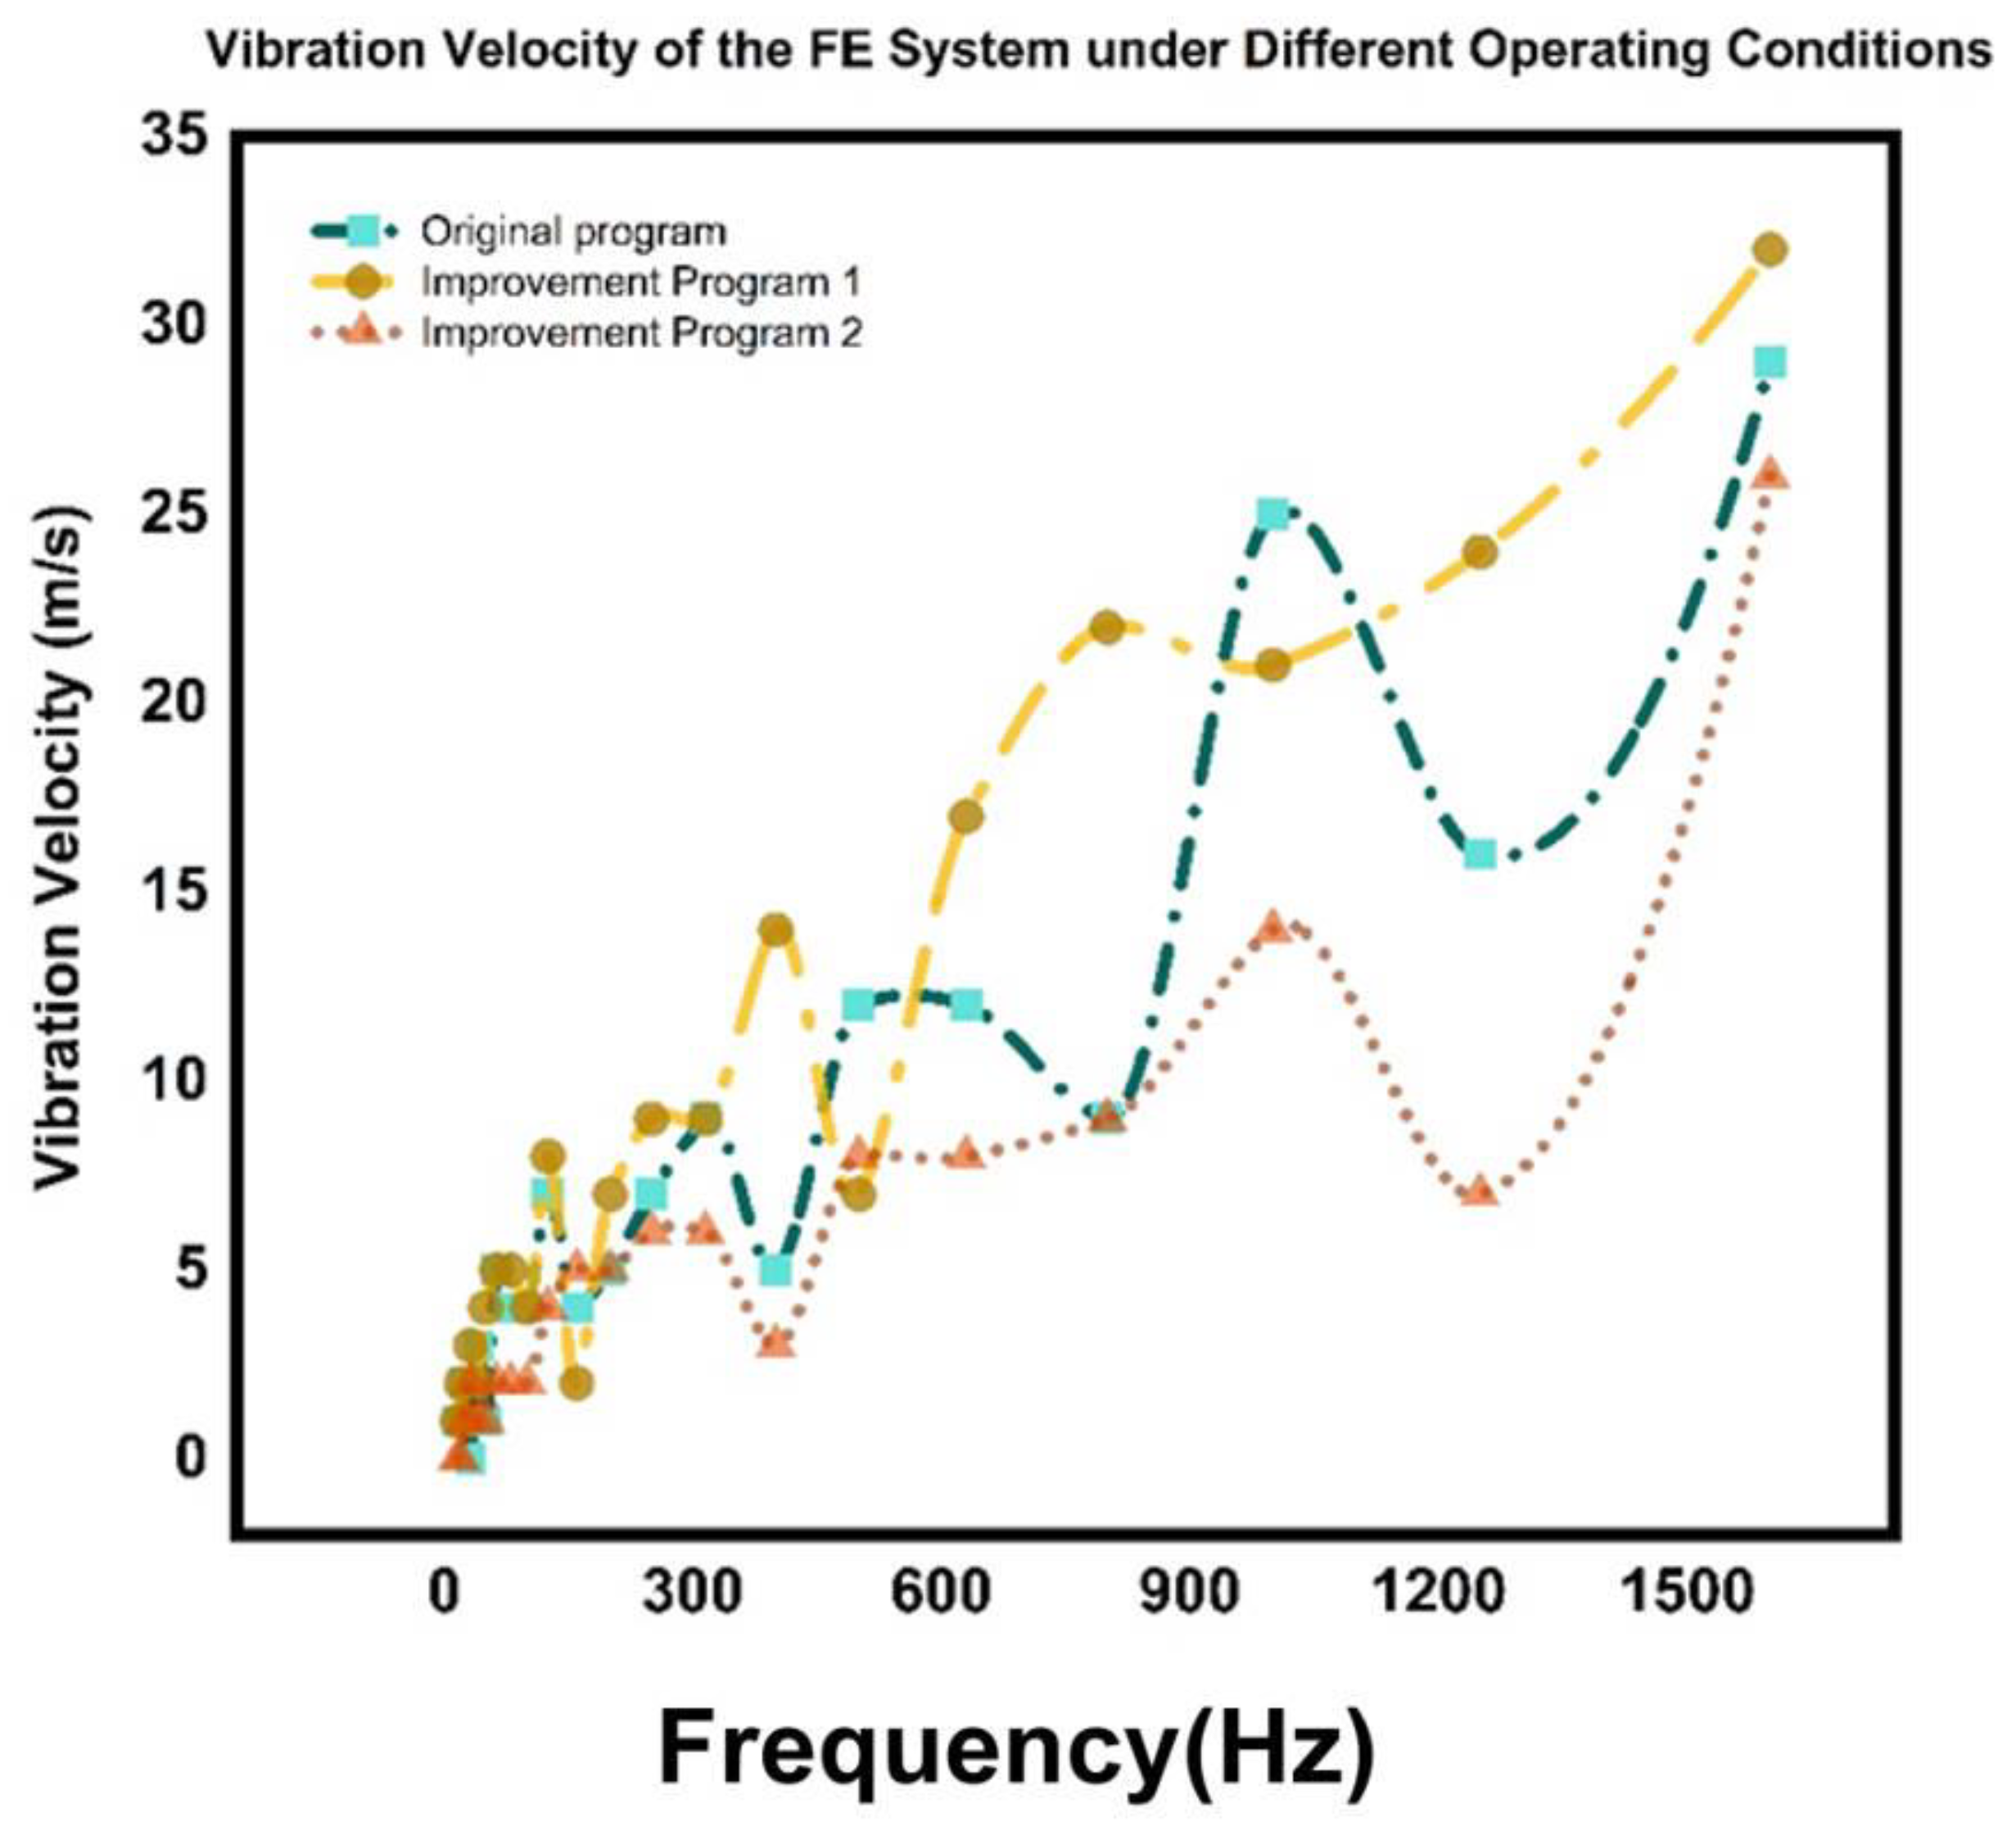
Figure 19 illustrates the variation of vibration velocity of the FE system with frequency under different decision regions, with the three lines representing the original program and two improved programs. At low frequencies, the vibration velocities of all programs are similar, indicating that the vibration response intensities of each program are comparable at these frequencies. As the frequency increases, the vibration velocity of Improved Program 2 increases significantly, exceeding the other programs, showing its greater vibration response intensity at higher frequencies. Especially at higher frequencies (above 1000 Hz), the vibration velocity of Improved Program 2 is significantly higher than the other programs, further proving its maximum vibration response intensity at these frequencies and indicating its superior dynamic performance at these frequencies.

6. Conclusions and Prospects

This study has successfully applied the concept of the decision circle to the hybrid Finite Element-Statistical Energy Analysis (FE-SEA) model, especially in the optimization of the point connection correction factor. By constructing a decision circle centered at the point connection location and with the wavelength as the radius, we were able to quantify the area of intersection between the structural region and the decision circle, thereby defining the corrected area of the point connection at frequency f . Improved Program 2 adopted the correction factor β λ 2 = S A 2 π λ b 2 = S A f 4 π 2 ρ h D , which was calculated based on the ratio of the decision circle area to the corrected area, effectively simulating the impact of the boundary on the point connection and significantly improving the analysis accuracy of the model. Simulation results showed that Improved Program 2 exhibited the lowest vibration velocity of Thin Plate 1 across the entire 16–1600 Hz frequency range, with the improvement being more pronounced near key frequency points such as 100 Hz, 315 Hz, 630 Hz, 1000 Hz, and 1250 Hz. In addition, Improved Program 2 also showed superiority in reducing the energy consumption of Thin Plate 1, with the most significant reduction in energy peaks in the mid-frequency range. These results not only validated the effectiveness of the decision circle concept in the hybrid FE-SEA model but also provided a new analytical tool for automotive NVH performance optimization, contributing to enhanced vehicle comfort and safety.

Author Contributions

Conceptualization, J.L. and T.W.; methodology, J.L.; software, J.L.; vali-dation, J.L. and T.W.; formal analysis, J.L.; investigation, T.W.; resources, J.S.; data curation, J.L.; writing—original draft preparation, J.L.; writing—review and editing, T.W.; visualization, J.L.; supervision, J.S.; project administration, J.S.; funding acquisition, J.S. All authors have read and agreed to the published version of the manuscript.

Funding

This research was funded by the Hubei Provincial Department of Education Science and Technology Research Project under the Project No. D20232602.

Data Availability Statement

The original contributions presented in this study are included in the article. Further inquiries can be directed to the corresponding author.

Conflicts of Interest

The authors declare no conflicts of interest.

References

  1. Zhu, W.; Ma, X.; Han, Z.; Zou, Y. Research on the Correction Factor of Hybrid FE-SEA Point Connections. J. Comput. Mech. 2015, 32, 225–231. [Google Scholar] [CrossRef]
  2. Su, J.; Zheng, L.; Nie, J. Research on Modeling Joining and Joining Modification Method of Hybrid FE-SEA Model. Sci. Rep. 2023, 13, 15853. [Google Scholar] [CrossRef] [PubMed]
  3. Luo, W.; Cao, H.; Zhang, Z.; Jiang, X.; Tang, K. Analysis of Train Intersection Noise on Bridges Based on the Hybrid FE-SEA Method. J. East China Jiaotong Univ. 2021, 38, 1–7. [Google Scholar]
  4. Chen, S.; Wang, D.; Song, X.; Chen, J.; Zan, J. Prediction of Internal Noise in Acoustic Cavities Based on the Hybrid FE-SEA Method. Vib. Shock. 2010, 29, 236–238. [Google Scholar]
  5. He, Y.; Jin, X.; Qin, X. FE-SEA Hybrid Modeling and Analysis Method for In-Car Mid-Frequency Noise. Automot. Technol. 2012, 10, 11–14. [Google Scholar]
  6. Charpentier, A.; Sreedhar, P.; Gardner, B.; Fukui, K. Use of a Hybrid FE-SEA Model of a Trimmed Vehicle to Improve the Design for Interior Noise; SAE: Warrendale, PA, USA, 2009. [Google Scholar]
  7. Wang, Y.; Zhang, J.; Yu, W.; Li, Q.; Liu, Y. Analysis of Automotive Wind Noise Propagation Characteristics Based on Statistical Energy Method. J. Tongji Univ. (Nat. Sci. Ed.) 2018, 46, 1696–1704. [Google Scholar]
  8. Binxing, W.; Xiaomin, L.; Sifa, Z.; Ren, Y.; Liu, Y. Prediction of In-Car Sound Pressure Levels in Heavy Trucks. Automot. Eng. 2016, 38, 234–241. [Google Scholar] [CrossRef]
  9. Che, Y.; Liu, H.; Guo, S.; Wang, Q. Prediction of In-Car Noise in Pure Electric Vehicles Based on SEA Model. J. Wuhan Univ. Tech. Inf. Manag. Eng. 2013, 35, 627–630. [Google Scholar]
  10. Deyuan, Y.; Qizheng, W. Principles and Applications of Statistical Energy Analysis; Beijing Institute of Technology Press: Beijing, China, 1995. [Google Scholar]
  11. Zhang, Y.; Wang, K.; Sheng, X.; Ou, J.; Meng, T. Analysis of Mid-Frequency Noise in a Special Vehicle Using Hybrid FE-SEA Method. Mech. Sci. Technol. 2018, 37, 1698–1704. [Google Scholar] [CrossRef]
  12. Langley, R.S.; Bremner, P. Hybrid FE-SEA Modeling for Mid-Frequency Vibroacoustic Analysis. J. Sound Vib. 2021, 512, 116256. [Google Scholar]
  13. Ma, X.; Zhu, W.; Han, Z. Wave-Based Correction for Hybrid FE-SEA Point Connections. Mech. Syst. Signal Process. 2022, 172, 108932. [Google Scholar]
  14. Zhang, Y.; Wang, K.; Sheng, C. NVH Optimization in Electric Vehicles Using Hybrid FE-SEA. Appl. Acoust. 2023, 205, 109023. [Google Scholar]
  15. Shorter, P.J.; Langley, R.S. Vibro-Acoustic Analysis of Complex Systems. J. Sound Vib. 2005, 288, 669–699. [Google Scholar] [CrossRef]
  16. Shorter, P.J.; Langley, R.S. A Hybrid FE-SEA Method for the Analysis of Complex Vibroacoustic Systems. J. Acoust. Soc. Am. 2005, 105, 1657–1671. [Google Scholar]
  17. Mace, B.R.; Shorter, P.J. Energy Flow Models from Finite Element Analysis. J. Sound Vib. 2000, 233, 369–389. [Google Scholar] [CrossRef]
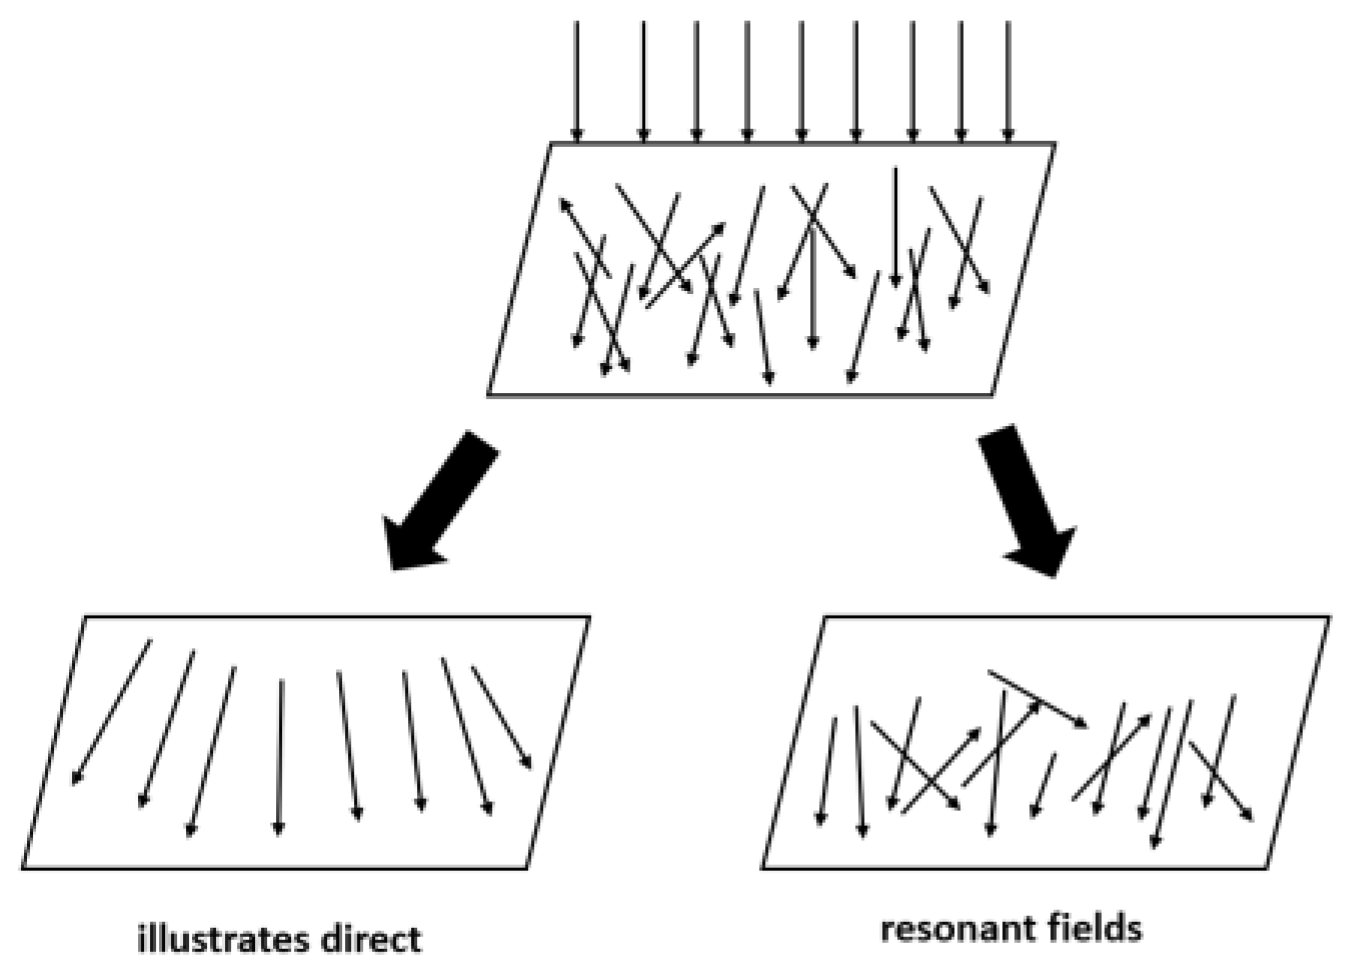
Figure 1. Illustration of direct and resonant fields.
Wevj 16 00563 g001
Figure 2. Coupled System.
Wevj 16 00563 g002
Figure 3. Model of hybrid point connection for unbounded plate structure.
Wevj 16 00563 g003
Figure 4. Modified factor model.
Wevj 16 00563 g004
Figure 5. Optimization of decision area.
Wevj 16 00563 g005
Figure 6. Acoustic package model of XPeng P7.
Wevj 16 00563 g006
Figure 7. Mixed point model.
Wevj 16 00563 g007
Figure 8. Finite element model.
Wevj 16 00563 g008
Figure 9. Mixed model.
Wevj 16 00563 g009
Figure 10. Energy changes of Thin Plate 1 under a 90-degree radiation angle.
Wevj 16 00563 g010
Figure 11. Coupling loss factor from Thin Plate 1 to Thin Plate 2 under a 90-degree radiation angle.
Wevj 16 00563 g011
Figure 12. Vibration velocity of Thin Plate 1 under a 90-degree radiation analysis of the model under a 180-degree radiation angle.
Wevj 16 00563 g012
Figure 13. Energy changes of Thin Plate 1 under a 180-degree radiation angle.
Wevj 16 00563 g013
Figure 14. Coupling loss factor from Thin Plate 1 to Thin Plate 2 under a 180-degree radiation angle.
Wevj 16 00563 g014
Figure 15. Vibration velocity of Thin Plate 1 under a 180-degree radiation angle.
Wevj 16 00563 g015
Figure 16. Energy changes of Thin Plate 1 under a 360-degree radiation angle.
Wevj 16 00563 g016
Figure 17. Coupling loss factor from Thin Plate 1 to Thin Plate 2 under a 360-degree radiation angle.
Wevj 16 00563 g017
Figure 18. Vibration velocity of Thin Plate 1 under a 360-degree radiation angle.
Wevj 16 00563 g018
Figure 19. Vibration velocity of FE system under different judgment regions.
Wevj 16 00563 g019
Table 1. Material properties.
Name Density   ( k g / m 3 ) Poisson’s RatioElastic Modulus (GPa)Damping Loss FactorStructural Thickness (mm)
Steel Beam78000.302000.012
Aluminum Plate27000.33700.011
Disclaimer/Publisher’s Note: The statements, opinions and data contained in all publications are solely those of the individual author(s) and contributor(s) and not of MDPI and/or the editor(s). MDPI and/or the editor(s) disclaim responsibility for any injury to people or property resulting from any ideas, methods, instructions or products referred to in the content.