2.2. Vehicle and Key Components Modeling
The powertrain model comprises a backward vehicle dynamics model, a H-FC durability degradation model, and a battery lifespan degradation model. The required traction force
at the vehicle wheels is determined as follows:
where
denotes the rolling resistance coefficient,
the road gradient,
the aerodynamic drag coefficient,
the frontal area,
the rotational inertia factor,
the acceleration,
the vehicle speed, and 21.15 is a unit conversion coefficient consistency.
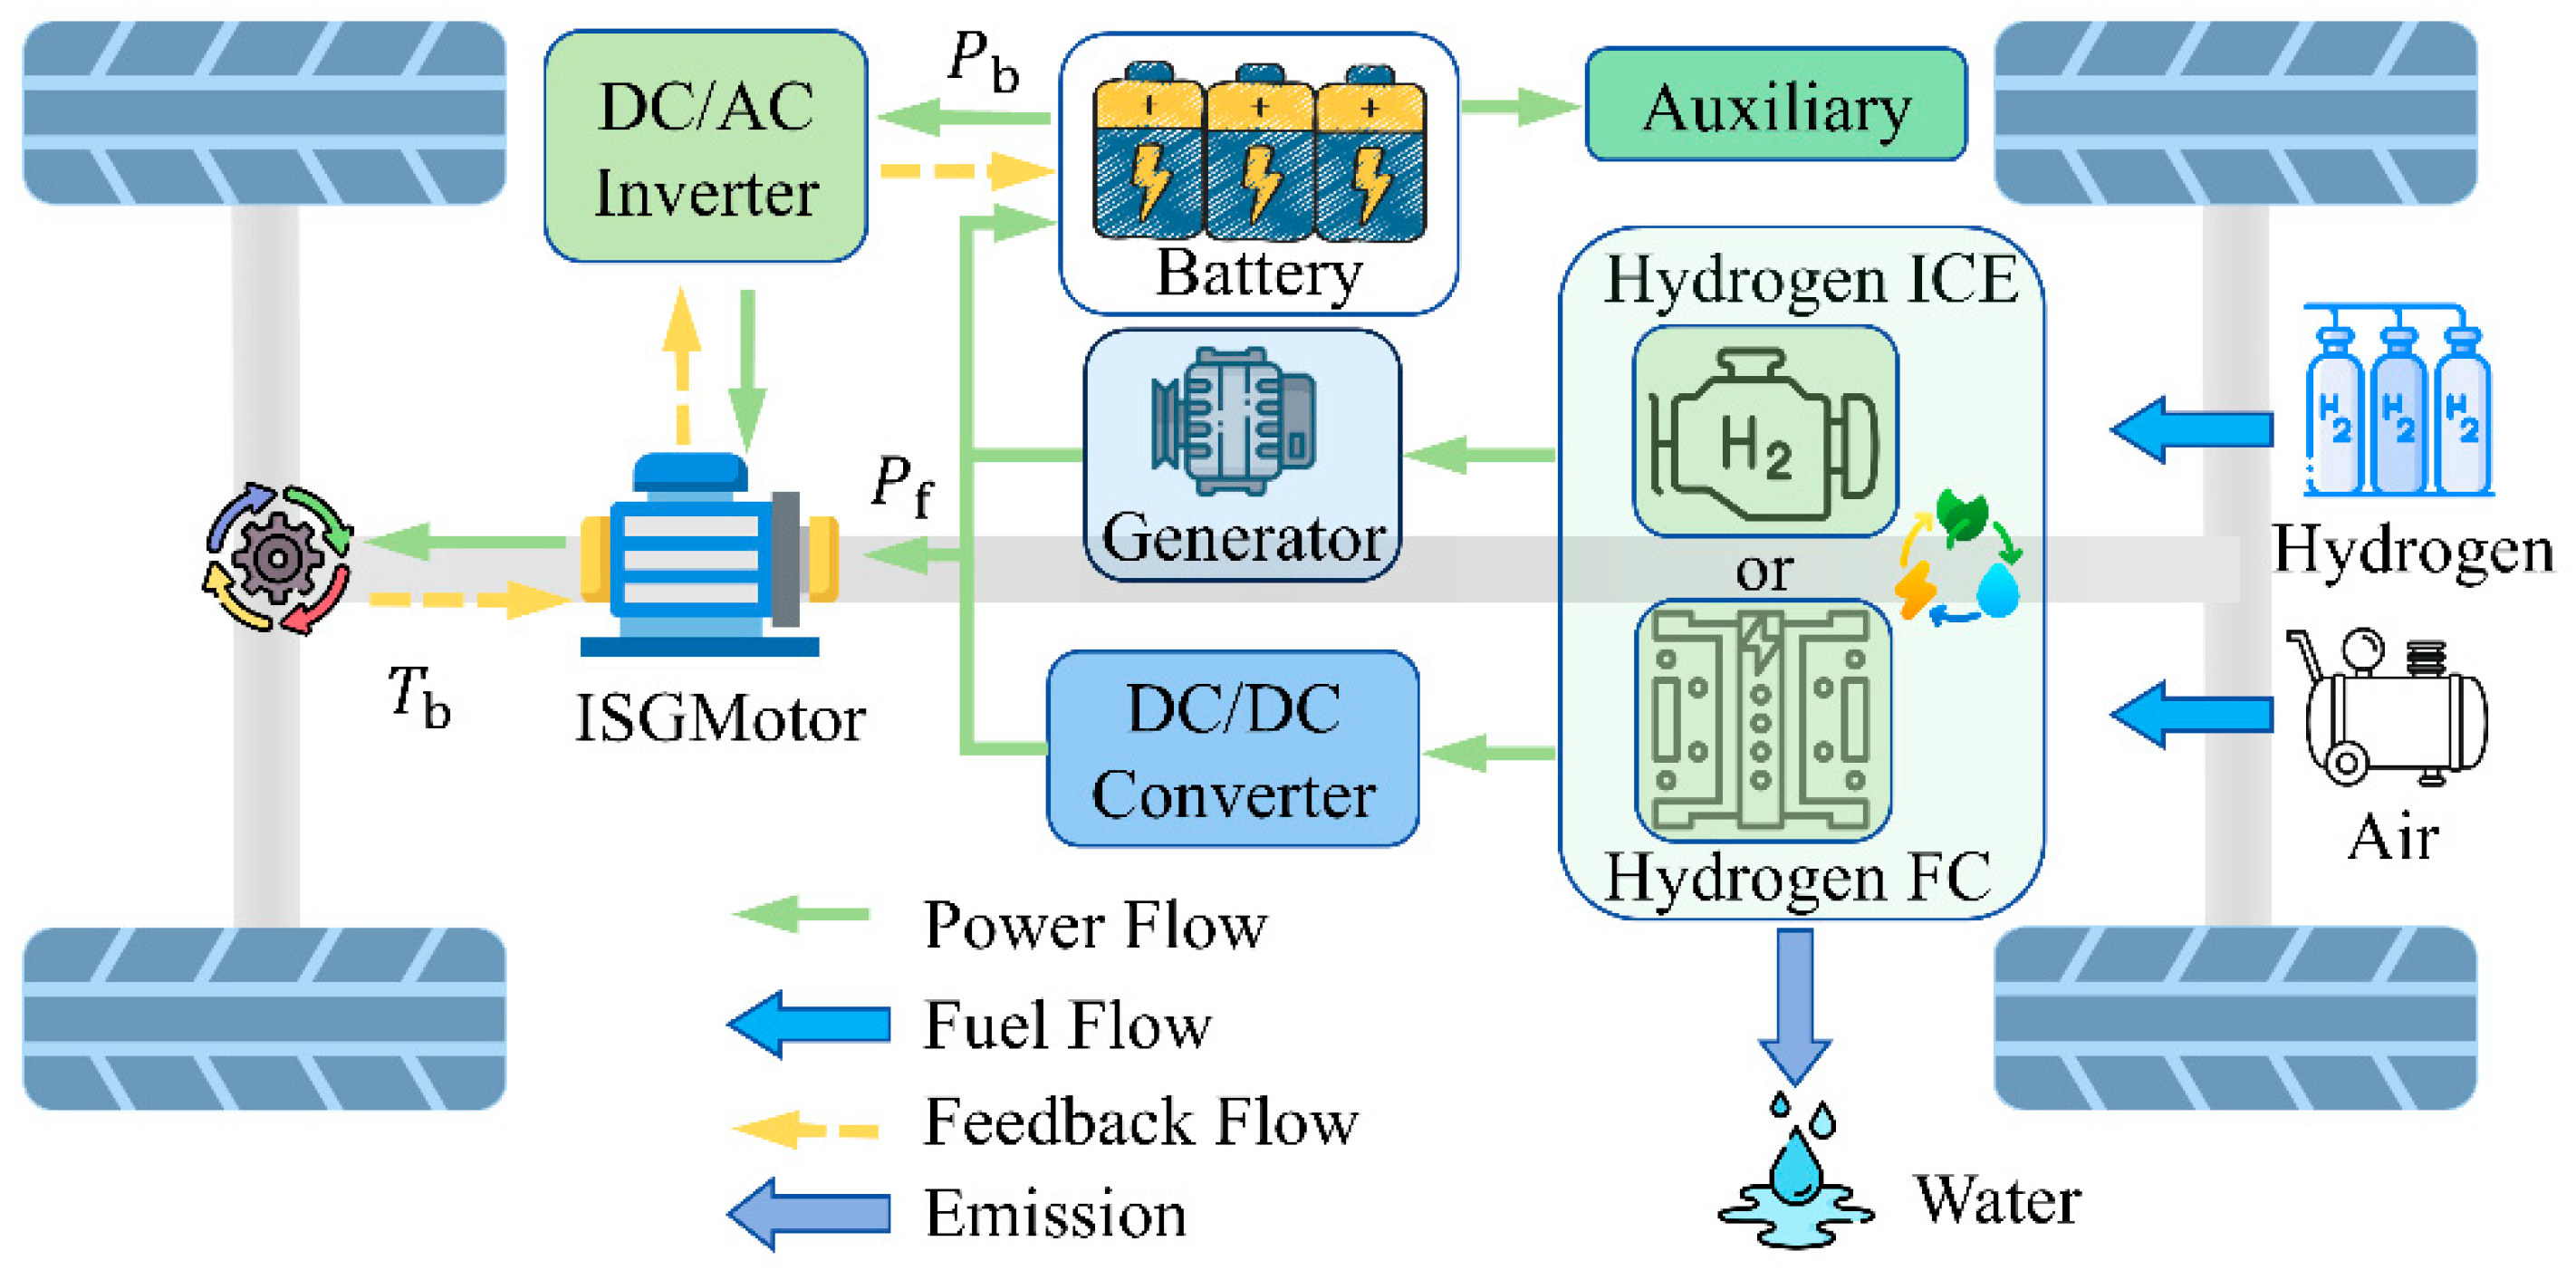
In the vehicle powertrain, the hydrogen energy power system and the battery power system operate collaboratively to supply energy to the electric motor. As expressed in Equation (3), the value of
is derived from the motor MAP, which characterizes the relationship between efficiency, torque, and speed, as depicted in
Figure 2.
Thus, the total power required by the motor, denoted as
, is expressed as follows:
Here,
is the wheel angular velocity,
the wheel final drive ratio,
the wheel transmission efficiency, and
the motor transmission efficiency. The DC/AC inverter efficiency is denoted as
, while
refers to the DC/DC converter efficiency. The power contributions from the hydrogen energy system and the power battery are represented by
and
, respectively.
Figure 3 illustrates the H-ICE efficiency under varying rotational speeds and brake mean effective pressure (BMEP) conditions, based on experimental data obtained from the test platform [
29].
The efficiency curves of the H-FC are derived from data on the Toyota Mirai H-FCV, as provided by Argonne National Laboratory. The studied H-FC delivers a maximum power output of 114 kW and a rated power of 100.7 kW. The specific efficiency characteristics of the hydrogen energy system are presented in
Figure 4 [
30].
The hydrogen energy power system is simplified for the economy and system durability analysis, employing a physical modeling approach. The hydrogen fuel mass flow rate (kg/s)
is determined by the following equation:
where
represents the efficiency of the hydrogen energy system, and LHV denotes the lower heating value of hydrogen (120 MJ/kg).
As part of the energy storage system, the power battery supplies energy while also capturing regenerative braking energy. The equivalent circuit model is adopted to effectively characterize the state of the battery during charge and discharge processes. The SOC is determined by the following equation:
where
represents the current SOC of the battery,
the battery current, and
the battery capacity. The instantaneous battery current
is determined by the following equation:
where
represents the battery open-circuit voltage,
the battery charge and discharge internal resistance, and
the battery power. The relationship between battery open-circuit voltage, equivalent internal resistance, and SOC at 25 °C is illustrated in
Figure 5.
2.3. Estimation of Operational Costs Considering Powertrain Degradation
The H-FC and Li-ion battery systems experience performance degradation under operating, which contributes to an increase in energy consumption. Their long-term durability can be assessed based on the decline over time [
31]. Pei et al. proposed an H-FC degradation model, identifying key degradation mechanisms associated with start/stop cycles, idling, load variations, and high-power loads [
32]. Song et al. further validated the model under comparable conditions but at twice the power level, yielding consistent degradation trends [
33]. This study incorporates the intrinsic degradation of the H-FC system based on the empirical degradation modeling framework proposed in [
34]. The specific parameter definitions are listed in
Table 2, and the corresponding performance degradation is expressed as follows:
where
represents the power degradation rate,
the acceleration coefficient, and
the natural degradation rate. The parameters
,
,
, and
quantify the degradation rates due to load variations, start/stop cycles, idling, and high-power operation, respectively. The variables
and
indicate the number of load variations and start/stop cycles, respectively, while
and
denote the idling (low-power) duration and high-power operation time.
Due to its improved thermal efficiency, hydrogen compatibility, and emission performance compared to conventional internal combustion engines, the H-ICE exhibits a comparable lifespan and is typically not subject to a fixed retirement period. Moreover, H-ICE experiences relatively minor performance degradation compared to H-FC, resulting in a limited impact on the TCO. Therefore, the performance degradation of the H-ICE is not considered in this study. In contrast, the degradation of the H-FC system inevitably impacts system efficiency, with degradation rates varying under different current conditions. The voltage drop exhibits a linear relationship with current [
35]. Consequently, in physical model-based systems, it is assumed that the current remains constant, leading to a direct correlation between voltage and the required power. The power loss at the rated current serves as the basis for determining the polarization curve.
Furthermore, as described in [
36], the H-FC efficiency consists of fuel efficiency, conversion efficiency, and electrical efficiency. It is assumed that the electrical efficiency remains constant and the fuel efficiency is close to 1 and does not change during degradation. The conversion efficiency, however, depends solely on H-FC power output and declines as the power decreases over time due to degradation. Thus, the power and efficiency degradation under any current is characterized as follows:
where
represents the H-FC degradation power curve (kW),
i the sample index,
the initial H-FC power curve, and
the total H-FC system loss. The parameter
characterizes the H-FC degradation efficiency curve. Based on these considerations, this study establishes an H-FC degradation model centered on power decline. The degradation model for H-FC is based on power decline. In this study, the end-of-life of the H-FC is defined as the point when the system power output decreases to 90% of its initial value, corresponding to a 10% degradation in rated performance [
37]. The degradation rate is determined using the system degradation formula, enabling the assessment of the H-FC health state (
), as expressed in the following equation:
In a hybrid electric vehicle, the power battery functions as both a supplemental energy source and an energy recovery unit. Throughout the charging, discharging, and energy recovery processes, the battery capacity gradually deteriorates, with degradation influenced by temperature, charge/discharge rate, and accumulated charge [
38]. This study adopts the cyclic capacity degradation model proposed in [
39], where charge/discharge rate and temperature are identified as the primary factors influencing battery degradation. Thus, based on the Arrhenius equation, the decline in battery capacity is expressed as follows [
40]:
where
represents the pre-exponential factor and
the activation energy, both of which are associated with the battery charge/discharge rate
. The pre-exponential factors for different charge/discharge rates are listed in
Table 3. The gas constant
is 8.31
, while
denotes the absolute temperature (298.15 K), the parameter
the ampere-hour throughput, and
the power law factor, with a value of 0.55. The activation energy
(
is expressed as follows:
When the battery capacity decreases by 20% from its initial value, the battery is considered to have reached the end of its lifespan. Therefore, the total ampere-hour throughput and the number of cycles the vehicle can complete are expressed as follows:
The battery health state can be evaluated based on the change in battery charge, as expressed in the following equation:
where
represents the battery capacity degradation.
TCO comprises tangible costs, intangible costs, and external costs [
41]. Among these, tangible costs represent direct economic expenses, while intangible and external costs vary depending on vehicle types and operating conditions, which are not considered in this study. Therefore, TCO primarily includes purchase costs, operating costs, and maintenance costs. Purchase costs encompass the vehicle price, purchase tax, government subsidies, scrapping/recycling fees, and registration fees. However, the degradation of the Li-ion battery and H-FC directly leads to a reduction in the H-FC’s output power under the same input conditions, thereby lowering its conversion efficiency. This degradation effect should therefore be included in the TCO calculation. Therefore, operating costs include fuel consumption costs and the degradation costs of Li-ion battery and H-FC. The TCO formulation is expressed as follows:
where
represents the purchase cost,
the operating cost,
the maintenance cost, and
the energy replenishment impact factor. Powertrain degradation significantly influences both degradation costs and fuel consumption, leading to variations in overall operating expenses. The vehicle fuel consumption cost is expressed as follows:
where
represents the distance traveled by the vehicle in the
year of operation,
the vehicle service life,
the discount rate,
the energy consumption per 100 km, and
the unit fuel price. The relevant parameters for powertrain degradation cost, including battery and H-FC lifespan-related factors, are summarized in
Table 4, and they can be calculated using the following equations [
42].
Note: In Equation (21), 1000 is used to normalize the unit from Wh to kWh, aligning with the unit of
. In Equation (22), the factor 0.01 converts the percentage value of
to its decimal form.
where represents the single-trip battery degradation cost, the single-trip H-FC degradation cost, and and the system rated power. The total powertrain degradation cost is then calculated as follows:
where
denotes the full-cycle H-FC cost,
the full-cycle battery cost, and
the single-trip driving distance (km). The TMC is calculated as follows:
where
denotes the total maintenance and servicing cost in year
. The scrapping and recycling cost is given by the following:
where
represents the purchase cost and
the number of H-FC replacements.
Table 4.
Key parameters of hydrogen energy system and battery.
Table 4.
Key parameters of hydrogen energy system and battery.
| Parameter (Parameter Symbol) | Value (Unit) |
|---|
| Battery price () | 900 (CNY/kWh) |
| H-FC prices ) | 2500 (CNY/kW) |
| H-ICE ) | 200 (CNY/kW) |
| Power loss in end-of-life H-FC ) | 0.1 (-) |
| Supplementary energy impact factor ) | 0.0028 (-) |
| Annual mileage ) | 200,000 (km) |
| Vehicle life-cycle ) | 3 (year) |
| Discount rate ) | 0.05 (%) |
| Hydrogen prices ) | 35 (CNY/kg) |


 ,
, 