1. Introduction
Battery Energy Storage Systems (BESSs) play a crucial role in modern power systems, supporting applications such as frequency regulation, peak load shaving, and the integration of renewable energy [
1,
2]. Recently, their use in electric vehicle (EV) charging has gained prominence, particularly as the fast-charging infrastructure expands to meet the growing demand for EV adoption [
2]. While BESSs can mitigate grid stress and enhance power quality at charging sites [
3], their integration introduces challenges related to harmonic, interharmonic, and supraharmonic emissions [
4]. These emissions, driven by power electronic switching, can vary with operating conditions and impact the grid’s power quality and harmonic hosting capacity [
4,
5,
6]. Notably, even harmonics, often overlooked, may become significant under unbalanced conditions. From a grid-planning perspective, the use of BESSs for peak shaving can be viewed as a localized demand-side management (DSM) action, analogous to the DSM strategies described in [
7], which smooth load profiles and reduce transformer stress. However, unlike traditional DSM, which focuses on reducing peak active power, the converter-based DSM action of the BESS also modifies spectral emissions by changing the operating point and dynamic response of the power converter, thereby altering its interaction with the grid’s frequency-dependent impedance. Despite these concerns, real-world measurement data capturing the full spectral behavior of BESS-assisted EV-charging systems remain limited, highlighting the need for comprehensive studies under practical operating scenarios.
1.1. Literature Survey
A keyword search for Battery Energy Storage Systems (BESSs) in the Scopus database yields approximately 13,500 publications. Refining the search with power quality narrows the results to 54, and further including harmonics reduces the pool to just 25 documents. After excluding studies in which the BESS is connected to a DC bus, topologies inconsistent with the system measured in this paper, a final set of 19 relevant papers was selected for review. Approximately 70% of these studies are simulation-based, with only five presenting field measurements from BESS installations under real operating conditions.
Most simulation studies emphasize control strategies to ensure compliance with power quality standards. For example, Ref. [
8] presents both simulation and hardware-in-the-loop (HIL) results for a 12-pulse converter. However, the observed grid-side harmonics are characteristic of a 6-pulse converter, with notable increases in triplen and odd-order harmonics, resulting from a 40% power imbalance between the delta- and star-connected converter sections. The converter operates at a switching frequency of 1.14 kHz. Supraharmonic emissions are, hence, not reported.
Reference [
9] details field measurements from a large-scale BESS rated at 20 MVA, composed of 2.5 MVA modules connected to a 25 kV medium-voltage (MV) grid via a delta–delta transformer. The reference states that the converters operate within a 3–15 kHz switching frequency range, and spectral data is limited to 7.68 kHz due to measurement constraints. Dominant harmonic orders include the 3rd, 5th, and 11th. However, the variations in harmonic emissions across different operating modes are not discussed.
Reference [
10] examines harmonic compliance in an islanded microgrid where a vehicle with vehicle-to-grid (V2G) capability is integrated into the network. The focus is on maintaining compliance with the EN 50160 power quality standard, without a detailed harmonic analysis.
Reference [
11] investigates triplen and odd harmonic emissions from a small 4.5 kW residential BESS. Wide variations in current harmonics are observed upon BESS activation, but they remain within the IEEE 1547 (current distortion) and IEEE 519 (voltage distortion) limits. The results, based on a single-phase two-pulse converter, show dominant third, fifth, and seventh harmonics, consistent with the (2p ± 1) pattern.
Reference [
12] describes the design and operation of a 5 MVA BESS integrated into a Caribbean island microgrid. Although the paper mentions improved power quality, no harmonic measurements are provided.
Finally, Ref. [
4] presents results from a BESS supporting up to three 160 kVA EV fast chargers. The BESS is rated at 280 kW, and two operating states are examined: (1) full EV charging sourced from the BESS, and (2) grid power capped at 140 kW. The fifth and seventh harmonics dominate in the harmonic emission. For supraharmonics, the emission at 18 kHz (fast charger switching frequency) increases linearly with the number of EVs, but shows minimal variation with the operating point. Reported frequencies include the 4 kHz BESS switching frequency, its second harmonic, and 18 kHz.
While the reviewed literature includes reports on harmonic emissions [
8] and, to a lesser extent, supraharmonic emissions [
4], interharmonic emissions are notably absent. A further gap is the lack of any reference to IEC emission limits, which is particularly surprising in studies based in Europe (e.g., Ref. [
4]). Among the papers citing IEEE 1547, the results are typically limited to triplen and odd harmonics, with even-order harmonics often omitted without justification. Although some studies do report variations in harmonic emissions, they fail to correlate these changes with specific operating states of the BESS, leaving the influence of system dynamics underexplored.
1.2. Gaps in Existing Standards
The standard IEC 61851-21-1 [
13] classifies EVs as a rechargeable energy storage system (REESS); however, the scope of this standard is limited to on-board charging systems integrated within the vehicle. In contrast, IEC 61851-21-2:2018 [
14], which addresses off-board charging systems, does not categorize such systems as REESS, nor does it explicitly extend the same emission control framework to them.
Off-board chargers are subject to electromagnetic emission testing as per IEC 61851-21-2 [
14], which references IEC 61000-3-12 [
15] for equipment drawing input currents between 16 A and 75 A. For systems exceeding 75 A, the standard recommends consulting the distribution system operator (DSO), indicating that standardized emission limits for high-power off-board chargers (e.g., greater than 50 kW) are not explicitly defined.
Another notable gap is the absence of specified limits for interharmonic and supraharmonic current emissions, which are increasingly relevant given the switching frequencies used in modern power electronic converters.
IEC 61851-21-2 [
14] recommends measuring emissions at 20% and 80% of the converter’s rated output power, but does not provide stage-specific guidelines or thresholds for compliance.
Standards such as IEC 61727 [
16] and IEC 62109-2 [
17] specify the waveform distortion limits for PV inverters primarily at or near their rated capacity or under the specified normal operating conditions.
Furthermore, to the best of the authors’ knowledge, there are currently no dedicated standards specifying the following:
These omissions complicate both the compliance assessment and the assignment of responsibility for emissions in grid-connected EV-charging infrastructures. In the absence of explicit frameworks, the allocation of responsibility depends on contractual arrangements between the EVSE operator, the BESS/charger manufacturer, and the utility. Adopting a shared-responsibility model, as advocated by IEEE 1547 and supported by analytical methods for responsibility allocation [
18], can provide a structured framework in BESS-assisted EV-charging systems. In such a model, BESS/charger manufacturers, EVSE operators, and utilities share accountability for emission control, harmonizing hardware performance, operation, and grid readiness.
1.3. Contributions
This paper aims to address several of the gaps identified in the preceding literature and review applicable standards. The contributions are listed below:
The emission limits for interharmonic, harmonic, and supraharmonic emissions are identified based on the procedures outlined in [
19,
20]. Deviations from these procedures in the reviewed literature are highlighted.
The operation of the BESS module supporting EV charging is classified into five distinct operating stages. The corresponding variations in interharmonic, harmonic, and supraharmonic emissions across these stages are analyzed. This can potentially help identify the operating stages in which the BESS units can be tested, following an effort to determine the limits on emissions from such modules. This has potential implications for the grid integration of BESS modules and who shall be deemed responsible for managing the emissions. IEEE 1547 [
21] identifies the management of harmonic emissions as a shared responsibility between DER operators and utilities, while IEEE 519 [
22] provides distortion limits and design practices for harmonic control.
A comparative analysis between two configurations is carried out: (a) a combined BESS/fast charger module, and (b) a fast charger supplied directly from the grid. To ensure consistency, only results from the grid-supplied charger operating at active power levels below 75 kW are compared with those from the BESS-assisted system, which limits the grid power drawn to 75 kW.
The harmonic hosting capacity of the network is assessed using the measured emissions under two conditions, without EV charging and during EV-charging events. A comparative assessment helps ascertain the contribution of EV charging and BESS operation to the harmonic distortion on the low-voltage grid.
1.4. Overview of the Paper
In
Section 2, the emission limits for interharmonic, harmonic, and supraharmonic emissions are identified based on the procedures outlined in [
17,
19,
20]. Deviations from these procedures in the reviewed literature are highlighted.
In
Section 3 and
Section 4, the operation of the BESS module supporting EV charging is classified into five distinct operating stages. The corresponding variations in interharmonic, harmonic, and supraharmonic emissions across these stages are analyzed.
Section 5 presents a comparative analysis between two configurations: (a) a combined BESS/fast charger module, and (b) a fast charger supplied directly from the grid. To ensure consistency, only results from the grid-supplied charger operating at active power levels below 75 kW are compared with those from the BESS-assisted system, which limits the grid power drawn to 75 kW. In
Section 6, the harmonic hosting capacity of the network is assessed using the measured emissions under two conditions, without EV charging and during EV-charging events.
Finally, in
Section 8, the paper concludes, following a discussion in
Section 7 on the broader implications of the results, and outlines the directions for future research.
2. Materials and Methods
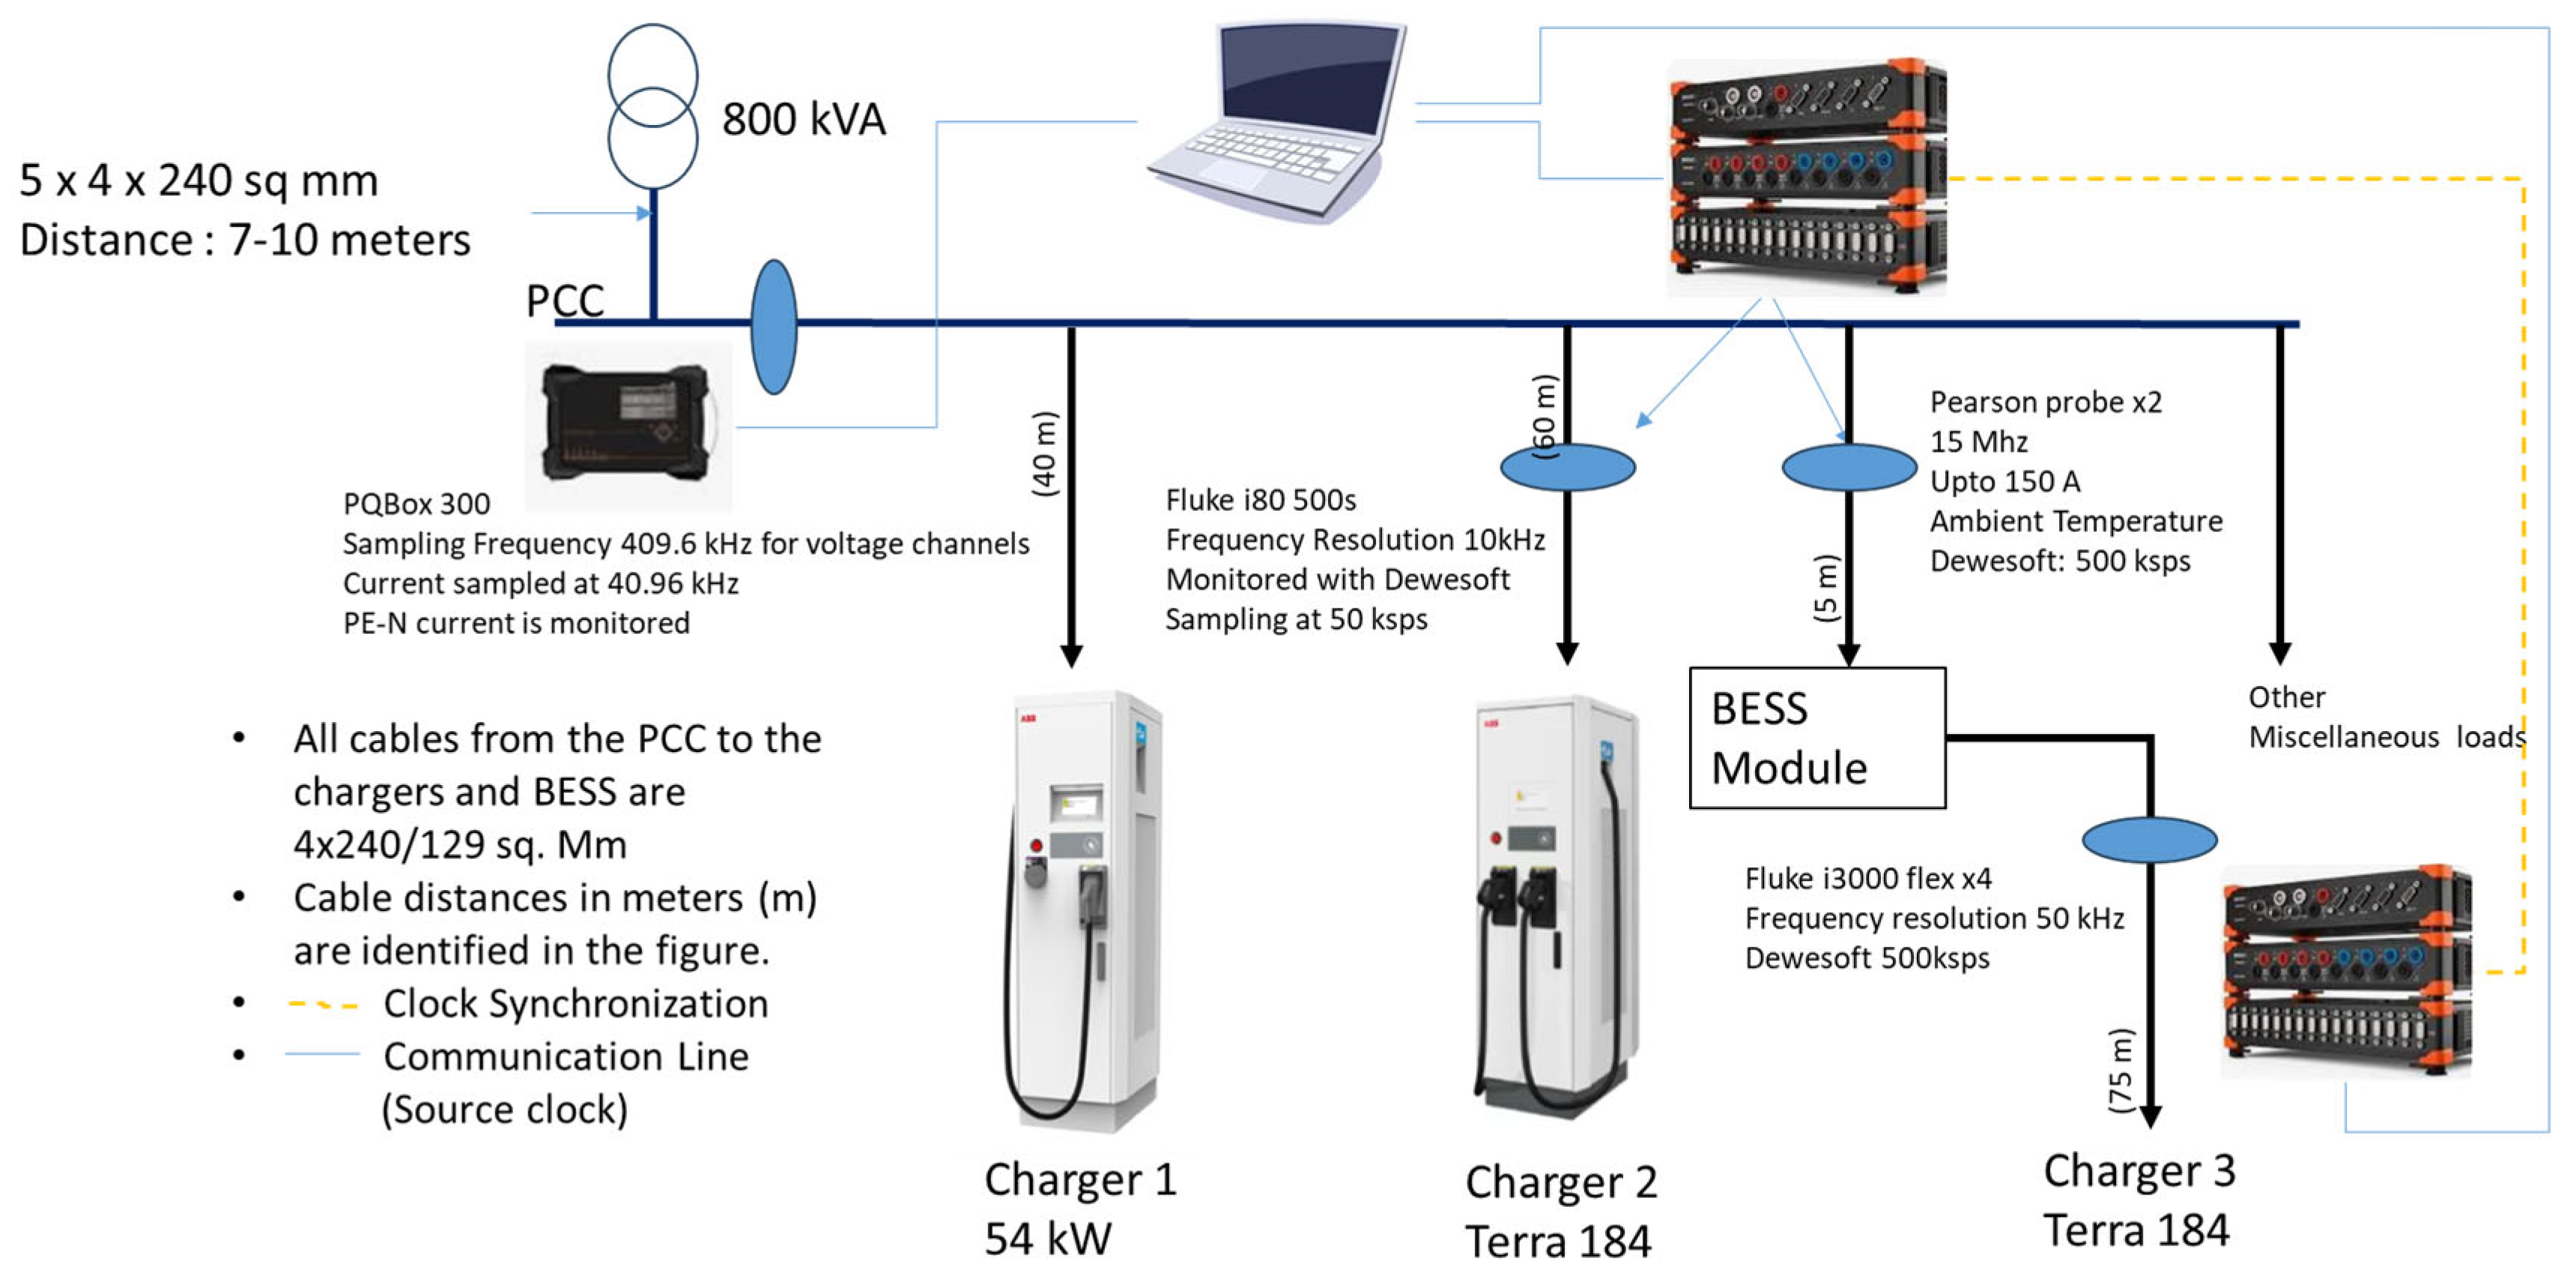
The measurement setup is illustrated in
Figure 1, which shows the electrical connections between the PCC, the BESS, and the three downstream chargers. Cable lengths and conductor cross-sections are indicated in the figure for transparency and reproducibility (e.g., 75 m between BESS and Charger 3, using 4 × 240 mm
2 cable). Measurements were conducted at both the input and output of the BESS using waveform recorders (SIRIUS, manufactured by DEWESoft, Trbovlje, Slovenia).
The BESS module, comprising a battery pack and a bidirectional power converter (which includes both AC–DC and DC–DC stages), supplies AC power to Charger 3 (a Mode 4 charger rated at 180 kW). This configuration is shown in
Figure 1. The BESS regulates power flow to ensure Charger 3 receives its required input without external conversion hardware. Charger 2, also rated at 180 kW but operating independently of the BESS, was monitored at its input using a separate DEWEsoft recorder. A third charger, Charger 1, with a maximum output power of 54 kW, was also connected downstream of the PCC. However, it was not instrumented during the measurement campaign.
Clock synchronization between the two DEWESoft waveform recorders is achieved via a synchronization cable, with both devices referencing a common clock signal provided by the monitoring computer.
Emissions propagating toward the upstream grid were measured using a Power Quality Analyzer (PQBox 300, manufactured by A.Eberle GmbH & Co. KG, Nuremberg, Germany). The PQBox 300 continuously monitors grid-side parameters and is a certified Class A power quality analyzer as per IEC 61000-4-30 [
23]. The clocks of all three monitors employed are synchronized with the monitoring computer employed at the test site. Time alignment across devices was validated using triggered events during operation. All measurement instruments were calibrated prior to testing in accordance with manufacturer procedures, and probe accuracy was verified against known loads.
Instrumentation specifications for the DEWEsoft recorders and the PQBox 300 are summarized in
Table 1, including ADC characteristics, accuracy class, and accuracy. The DEWEsoft system utilizes 16-bit ADCs with user-selectable sampling rates of up to 1 Msps, whereas the PQBox 300 employs 24-bit ADCs at 40.96 ksps for current channels and 409.6 ksps for voltage channels. Current transducer (CT) specifications for the DEWEsoft measurements are provided in
Table 2, along with their bandwidth, sensitivity, and noise floor. The PQBox 300 is supplied with manufacturer-provided CTs, whose performance is already covered by the device’s guaranteed accuracy; hence, separate CT details are not included in
Table 2.
Sampling frequencies vary across devices and measurement points:
Charger 2 input measurements were recorded at 50 kS/s;
Charger 3 input voltage and current were sampled at 500 kS/s;
At the battery storage unit’s input, both voltage and current were sampled at 500 kS/s.
The DEWEsoft recorders captured 550 msec of waveform data every minute during EV charging, and 300 msec every two minutes during idle periods. Post-processing was performed in MATLAB R2023a using 200 msec analysis windows. A Hann window was applied to each analysis segment prior to computing the FFT to reduce spectral leakage. Frequency-domain characteristics were then extracted with a 5 Hz resolution, following IEC 61000-4-7 [
24] grouping rules for harmonic and interharmonic analysis. Supraharmonic emissions in the 2–150 kHz range were evaluated in 200 Hz bands, in accordance with IEC 61000-2-2 [
25]. This multi-resolution framework ensured consistent assessment of harmonics, interharmonics, and supraharmonics across all devices and operating stages.
This combination of synchronized Class A power quality analyzers and high-resolution waveform recorders, together with calibrated current transducers, ensured accurate capture of harmonics, interharmonics, and supraharmonics across the 0–150 kHz range. The use of high sampling rates (up to 500 kS/s), a Hann-windowed FFT with 5 Hz resolution, and IEC-compliant spectral grouping provided sufficient frequency resolution while minimizing leakage. Instrument calibration, noise-floor characterization, and least-count analysis guaranteed that the measurements met the required accuracy for all spectral components.
2.1. Limits
A gap analysis based on the standards IEC 61851-21-1 [
13] and IEC 61851-21-2 [
14] reveals that the emission levels of chargers can exceed 75 A per phase, while specific harmonic current emission limits are not explicitly defined in these standards. The voltage distortion limits considered in this study are based on IEC 61000-2-2 [
25], which applies to low-voltage (LV) networks. To evaluate harmonic compatibility, the harmonic, interharmonic, and supraharmonic current emission limits were established using the methodologies described in references [
19,
20], based on the available system parameters.
The short-circuit power at the Point of Common Coupling (PCC) was calculated using transformer and medium-voltage (MV) network impedance data. The MV network impedance is assumed to be (0.0755 + j0.4494) Ω, while the transformer’s positive-sequence impedance, derived from manufacturer nameplate data, is (0.0024 + j0.015) Ω. The total short-circuit impedance at the PCC is, therefore, (0.0025 + j0.0156) Ω, corresponding to a calculated short-circuit power of 10.13 MVA.
2.1.1. Interharmonic and Harmonic Current Limits
The procedure for deriving the interharmonic current emission limit is based on the principles outlined in IEC 61000-3-6 [
19,
20,
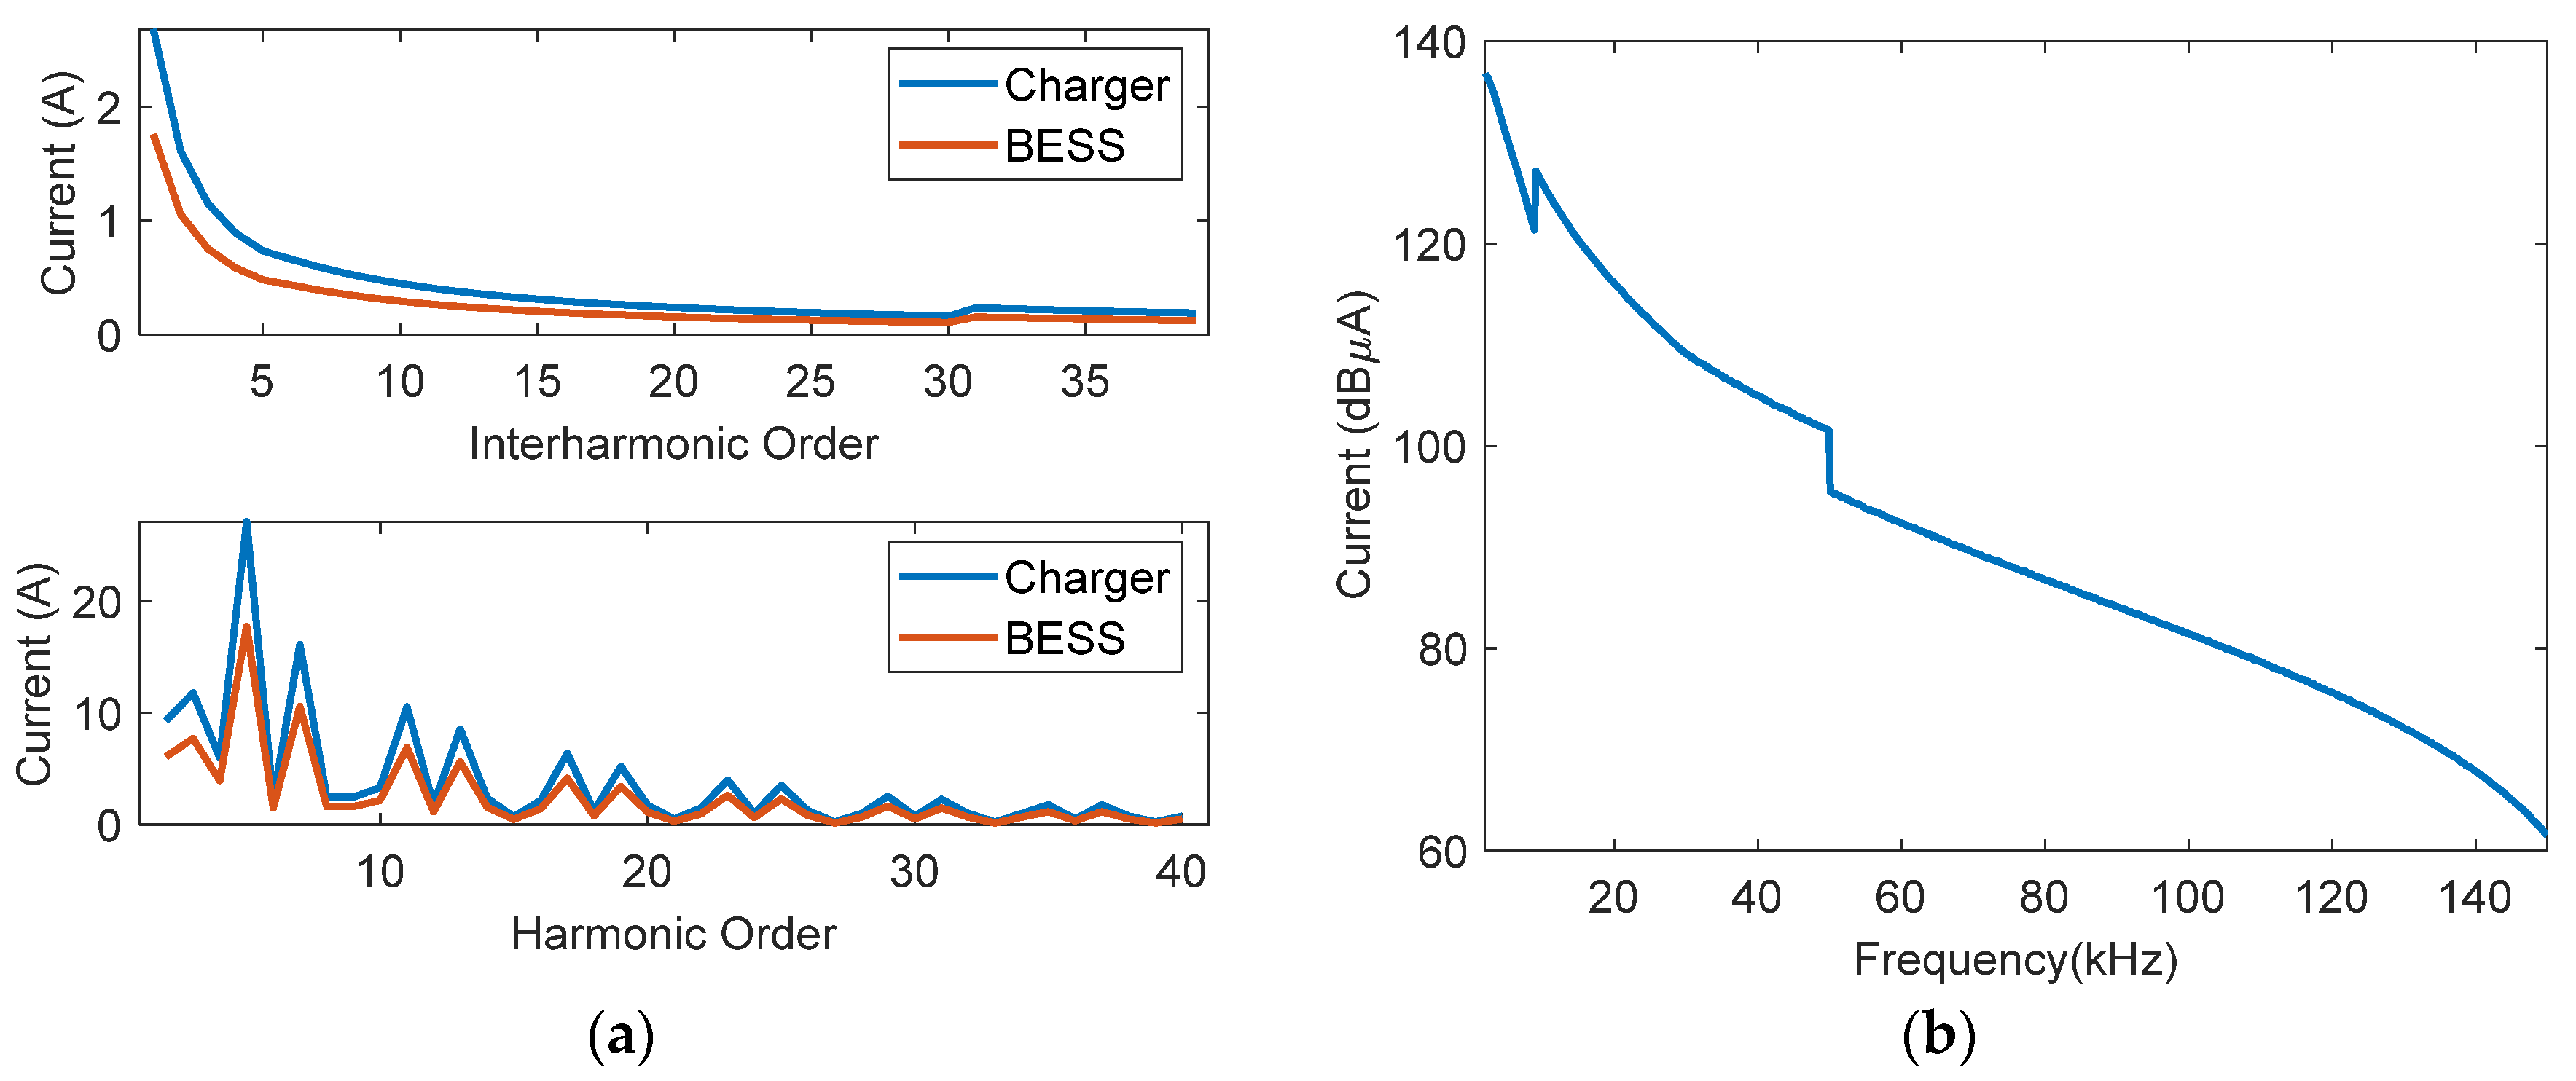
26]. However, due to the inherent variability and uncertainty associated with resonance conditions, which can change dynamically with the switching in or out of loads, it is challenging to precisely identify resonance frequencies. To account for this uncertainty, a Monte Carlo analysis is performed, where the resonance frequency is varied between 50 Hz and 2000 Hz, assuming a uniform distribution. This stochastic approach ensures that the emission limits are robust under a wide range of possible resonance scenarios. The process involves performing 100,000 iterations to effectively capture the variability, and the interharmonic and harmonic emission limits are derived as the 95th percentile values from the simulated data. The final limits obtained and presented in
Figure 2a reflect a conservative estimation, accommodating potential variations in network conditions.
2.1.2. Supraharmonic Current Limits
The procedure is based on the approach outlined in [
19,
20], where the emission limits between 2–9 kHz are determined. In this context, the same approach is extended by incorporating IEC 61000-2-2 [
25] compatibility limits to cover a broader frequency range. As recommended by [
19,
20], the resonance factor (
) varies between 0.8 and 1 to account for uncertainties in the resonance condition. Additionally, the splitting factor (
r), which accounts for the impact of short-circuit power and installation apparent power on impedance, is varied between 0.1 and 1. However, it is essential to note that this specific variation of
r is not strictly in accordance [
19,
20]. To capture the combined uncertainty, a Monte Carlo analysis is performed with 100,000 iterations, enabling the robust estimation of emission limits by statistically analyzing the variability of both resonance conditions and impedance fluctuations. Due to the wide variation of the emission limit across the frequency range, for clear presentation, the limits are presented in dBµA in
Figure 2b. This probabilistic approach ensures that the derived emission limits are conservative and representative of a wide range of possible network scenarios.
3. Operation of the BESS
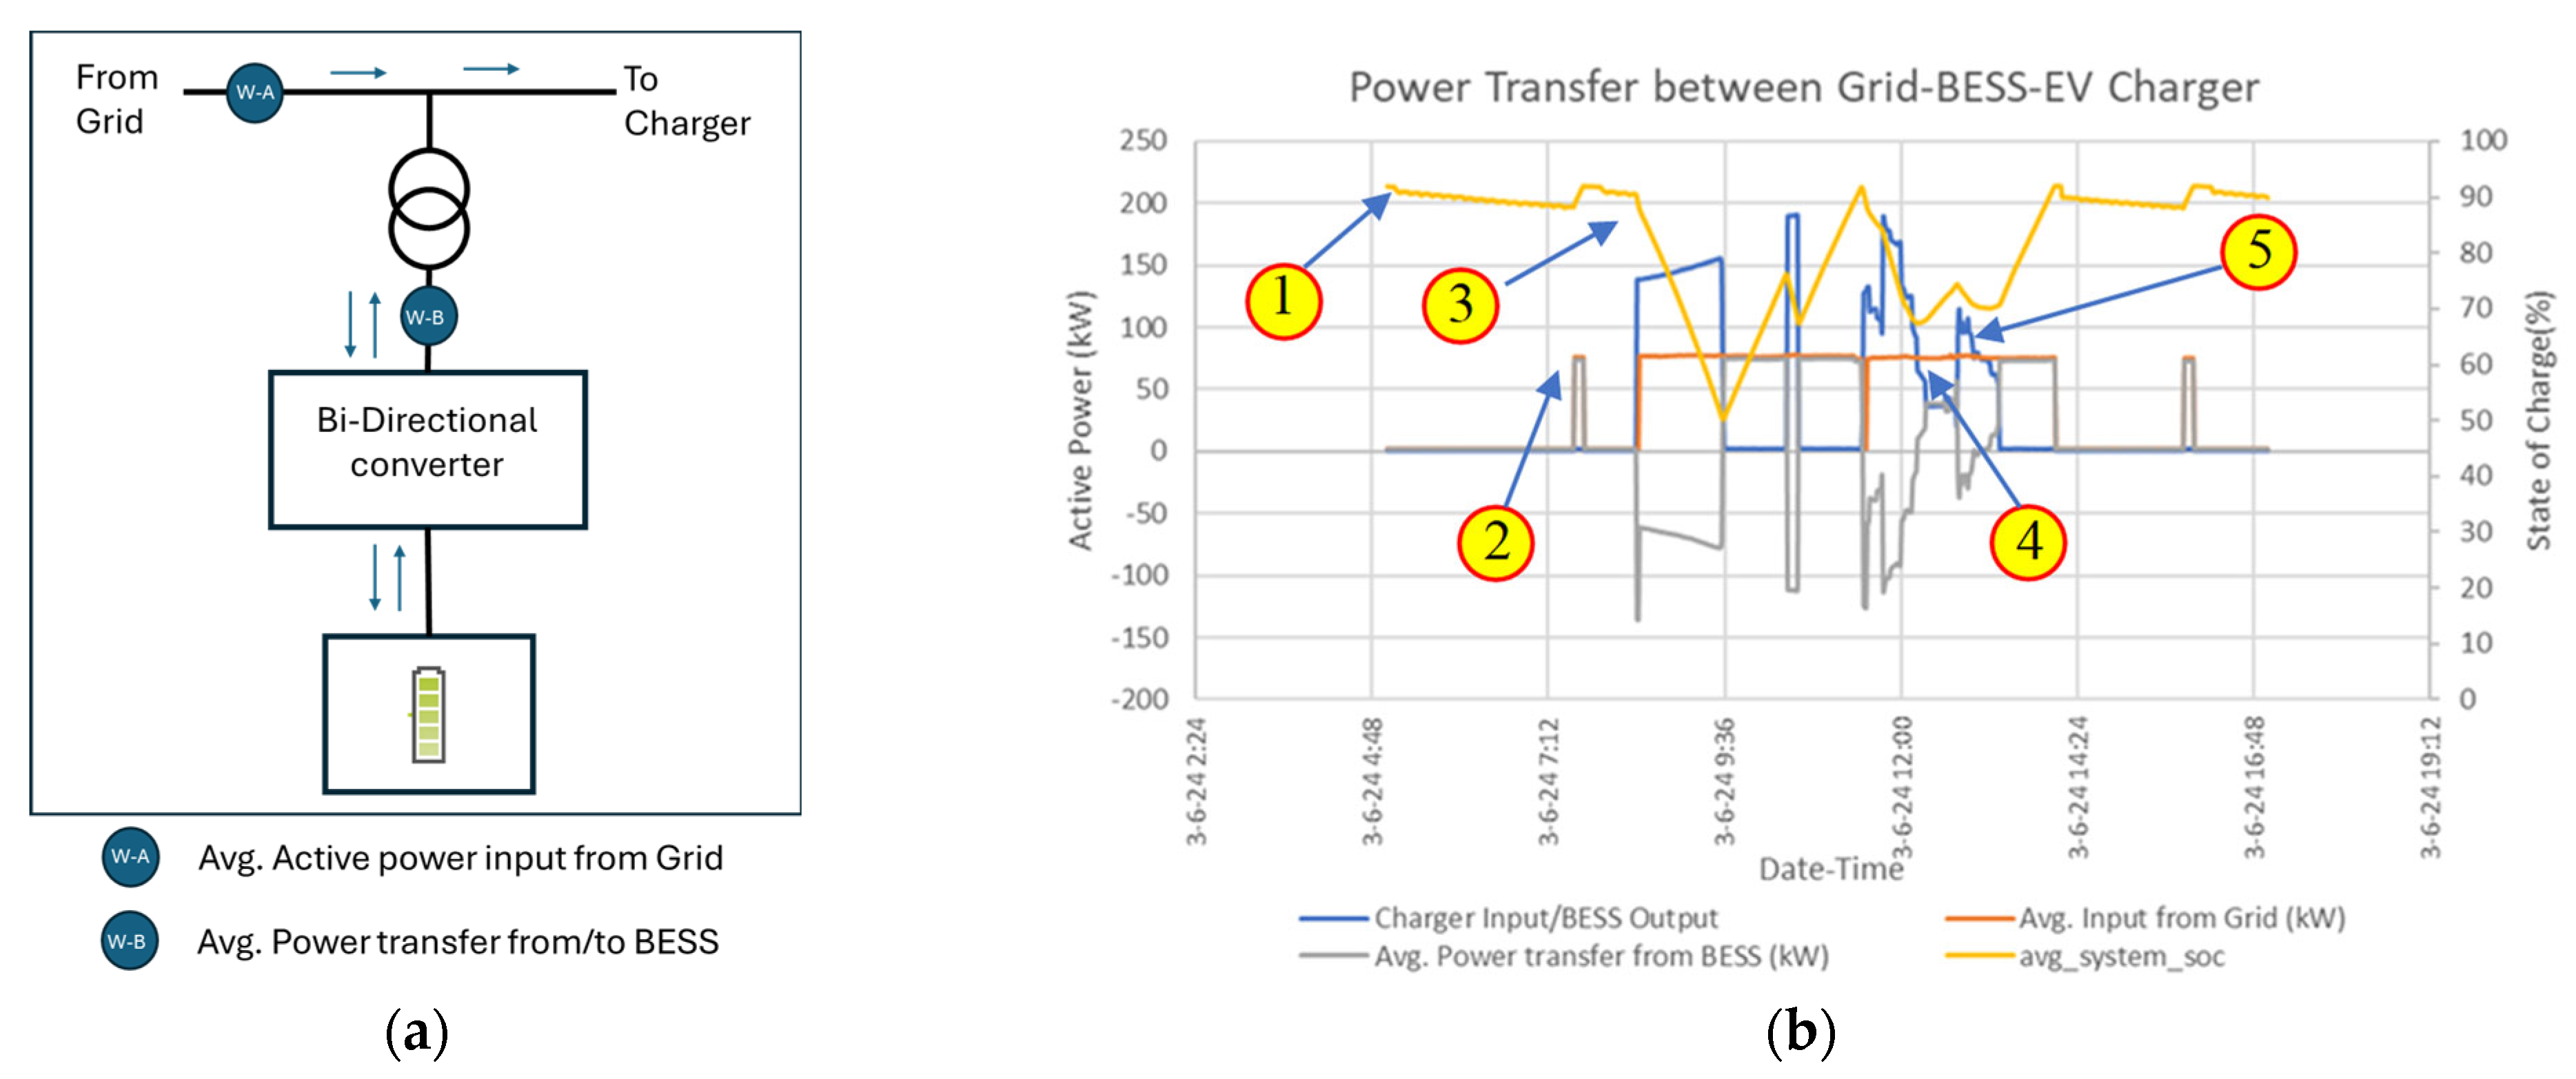
A typical BESS consists of a battery module and a bidirectional power conversion system, incorporating both an AC–DC and a DC–DC stage. The AC–DC converter regulates the power exchange between the BESS and the AC grid, while the DC–DC converter controls the charging and discharging of the battery module. In some configurations, however, the presence of an isolation transformer, as shown in
Figure 3a, may indicate a single-stage conversion process. The battery has a rated capacity of 390 Ah and a nominal voltage of 691 V DC. The overall converter system is rated at 275 kVA. As shown in
Figure 3a, the BESS is connected to the low-voltage AC grid via an isolation transformer. No additional power conversion stages are present beyond those shown in
Figure 3a. The operating principle of the BESS, including the control and power flow, is illustrated in
Figure 3a,b.
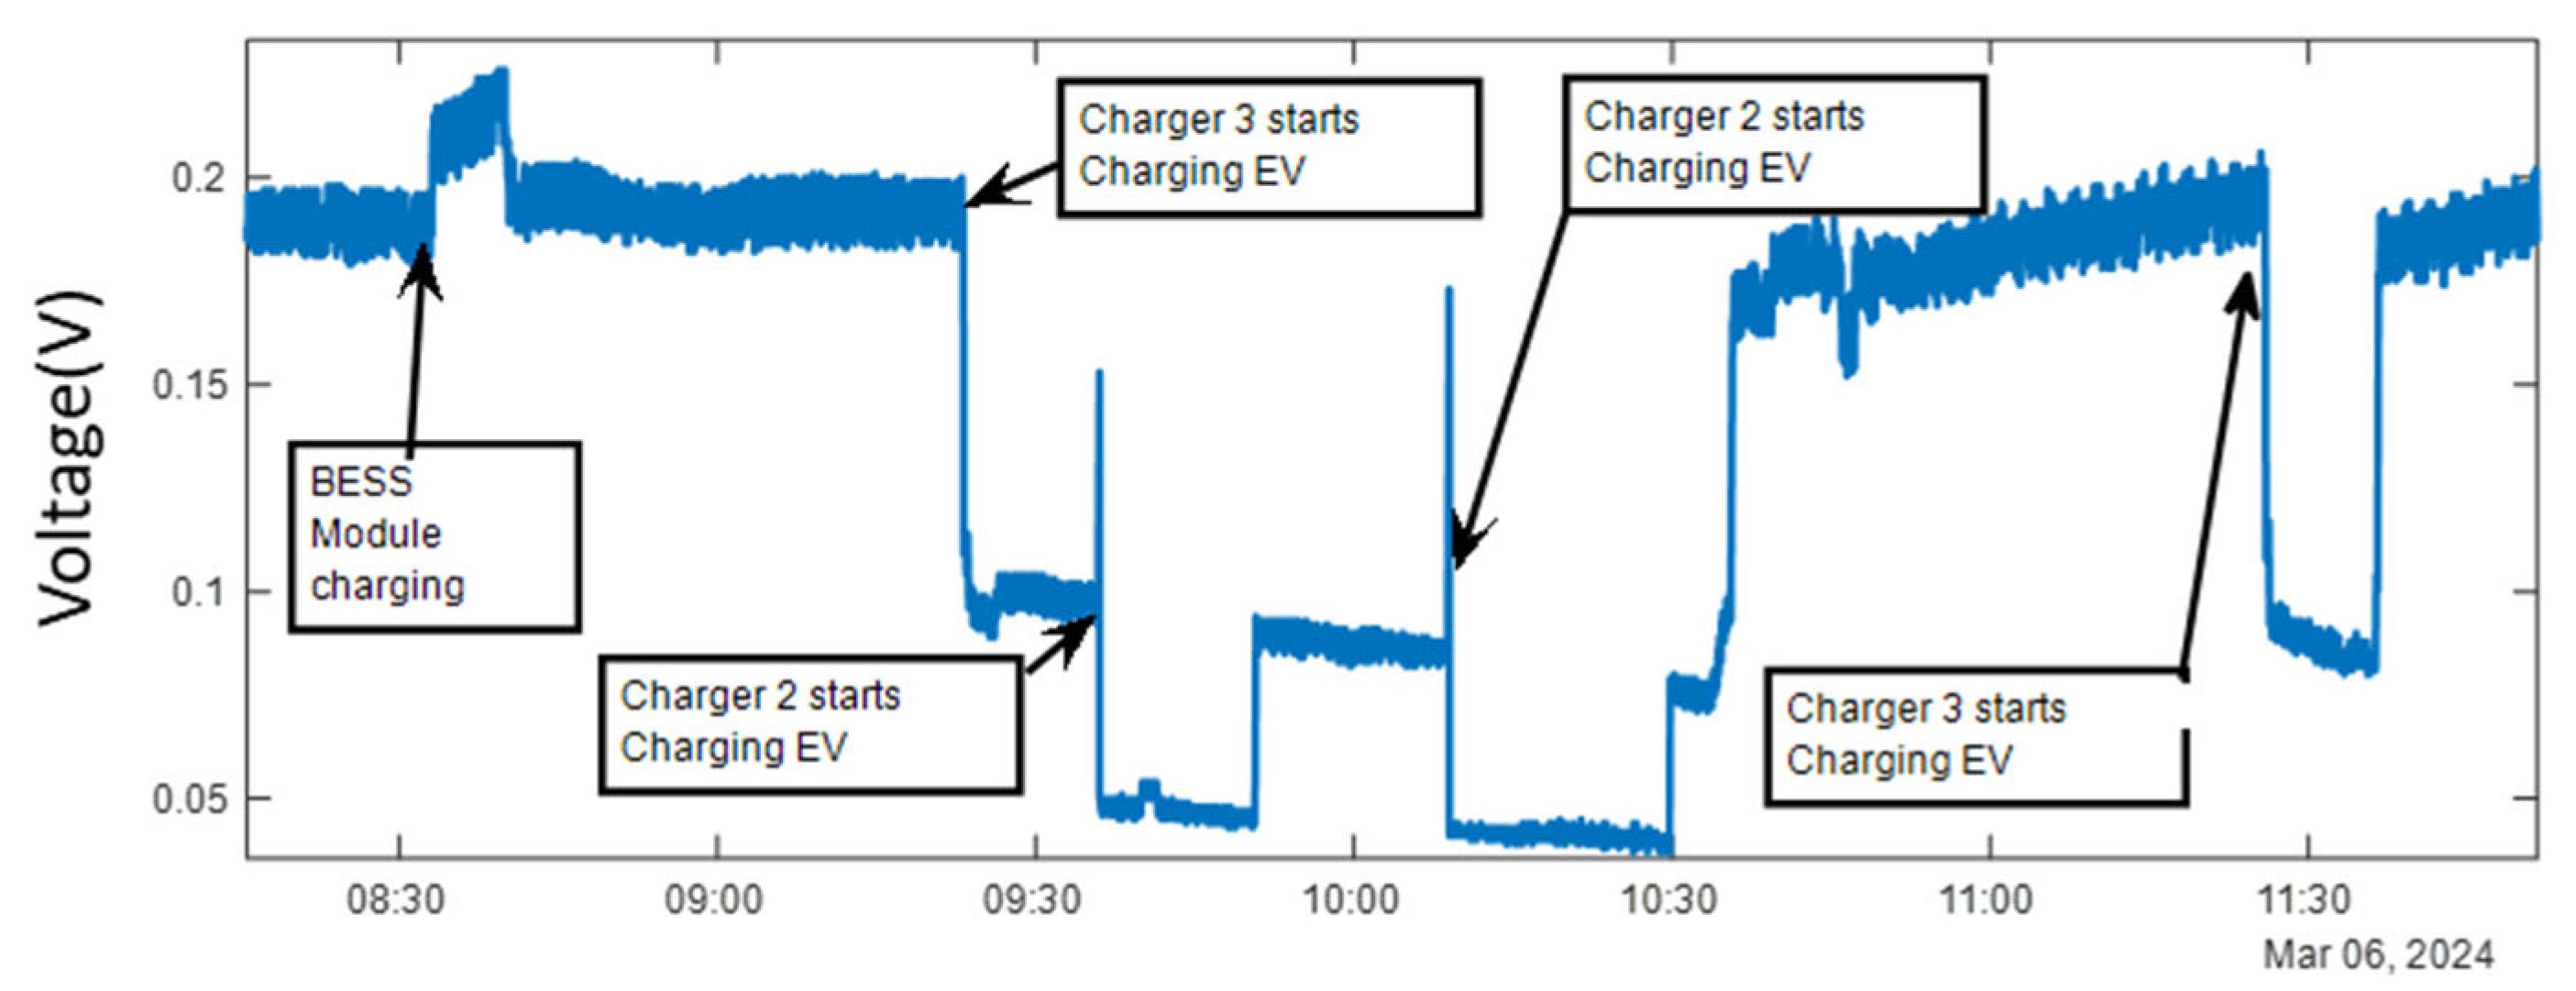
The BESS module operates in peak shaving mode to efficiently manage power demands. In this configuration, the peak load on the Low Voltage (LV) grid is set to 75 kW through user-defined settings on the converter module. Additionally, the maximum state of charge (SoC) for the battery is configured at 90%. The temporal operation of the BESS module is outlined as follows:
- (1)
Initial State and Standby Operation: At the initial time instant identified as ‘1’ in
Figure 3b, the SoC of the battery module is 92%. The battery’s cooling system activates, maintaining optimal operating conditions, resulting in a slight discharge from 92% to approximately 89% SoC at the subsequent instant identified as ‘2’. During this period, the grid demand averages around 1.7 kW, primarily used to compensate for the isolation transformer’s no-load losses, manage the converter’s thermal control, and power the Human–Machine Interface (HMI).
- (2)
Charging Phase: At time instant ‘2’, the bi-directional converter functions as a rectifier, maintaining the grid demand at 75 kW. This power is directed towards charging the battery from 89% to 92% SoC, a process lasting approximately 6 min.
- (3)
High Power Discharge during EV Charging: At time instant ‘3’, an Electric Vehicle (EV) connects to Charger 3, requesting an input power of 136 kW. During the initial 2 min of charging, the entire 136 kW power demand is met solely by the BESS module. Subsequently, the grid demand stabilizes at 75 kW, while the BESS continues to supply the remaining 61 kW. As the EV charging demand escalates from 136 kW to 152 kW, the output of the BESS correspondingly increases from 61 kW to 76 kW. Throughout this session, the SoC of the battery decreases from over 90% to approximately 50%.
- (4)
Post-Charging and Battery Recharge: Upon completion of the charging session, the grid demand remains at 75 kW, which is utilized by the BESS converter to recharge the battery. The SoC increases from 50% to around 76%.
- (5)
Subsequent High-Demand Charging Session: The EV charger demands 190 kW in the next charging session. The grid contribution is maintained at 75 kW, while the BESS module supplies an additional 115 kW. This session lasts for 9 min, during which the SoC decreases from 76% to 67%. Following the session, the grid power is again utilized to charge the battery, increasing its level from 67% to approximately 92%.
- (6)
Low-Demand Charging Phase: At time instant ‘4’, a new charging session begins with a power demand of 36 kW. During this period, the grid demand continues at 75 kW, with an excess of 39 kW allocated to charging the BESS module.
- (7)
Intermediate-Demand Charging Phase: At time instant ‘5’, the charging session requires 114 kW. The grid continues to supply 75 kW, while the remaining 39 kW is sourced from the BESS.
The operation of the BESS module during various charging and discharging phases is summarized in
Table 3. The operation is classified into five stages based on the charger’s active power (P) and the power drawn by the BESS from the grid. The BESS effectively manages peak shaving by maintaining a stable grid demand while dynamically adjusting its output to meet the charging power requirements.
4. Emission Results
The introduction of BESS can significantly affect the harmonic hosting capacity of a power network, particularly in areas with unfavorable impedance characteristics. BESS inverters inject harmonic and supraharmonic currents that interact with the grid’s frequency-dependent impedance, potentially leading to voltage distortion that exceeds acceptable limits. This issue is most critical at specific network locations. At the Point of Common Coupling (PCC) with a high impedance, the weak grid magnifies the harmonic voltage distortion, resulting in a lower hosting capacity and degraded voltage quality. Certain nodes in the network may exhibit resonance at specific frequencies due to the interaction of local inductive and capacitive elements. When the BESS injects harmonic or supraharmonic currents at or near these resonance frequencies, as observed from that node, the grid impedance can be significantly magnified. This results in the amplification of voltage distortion, increasing the risk of instability. These resonant conditions are especially critical because even small amounts of injected current can cause a disproportionately high voltage distortion when aligned with a resonance peak in the frequency response of the grid impedance at that location. Although loads in low-voltage networks have traditionally contributed to harmonic damping due to their resistive characteristics, the growing prevalence of power-electronic-based loads with capacitive or filtered front-ends can reduce this natural damping and, in some cases, exacerbate resonance and voltage distortion.
To evaluate the waveform distortion introduced by the BESS and charger modules during the various operating stages identified in
Section 3, this section presents the recorded interharmonic, harmonic, and supraharmonic emissions corresponding to each mode of operation. For harmonic and interharmonic current emissions, and in accordance with the methodology specified in IEC 61000-3-2 [
27], the arithmetic mean of the emissions observed during each operating stage is calculated and compared against the respective emission limits derived in
Section 2.1. For harmonic voltage emissions up to 2 kHz, root mean square (RMS) values are computed over a three-second aggregation window, and the 99th percentile of these values is compared against the short-time compatibility limits specified in IEC 61000-2-2 [
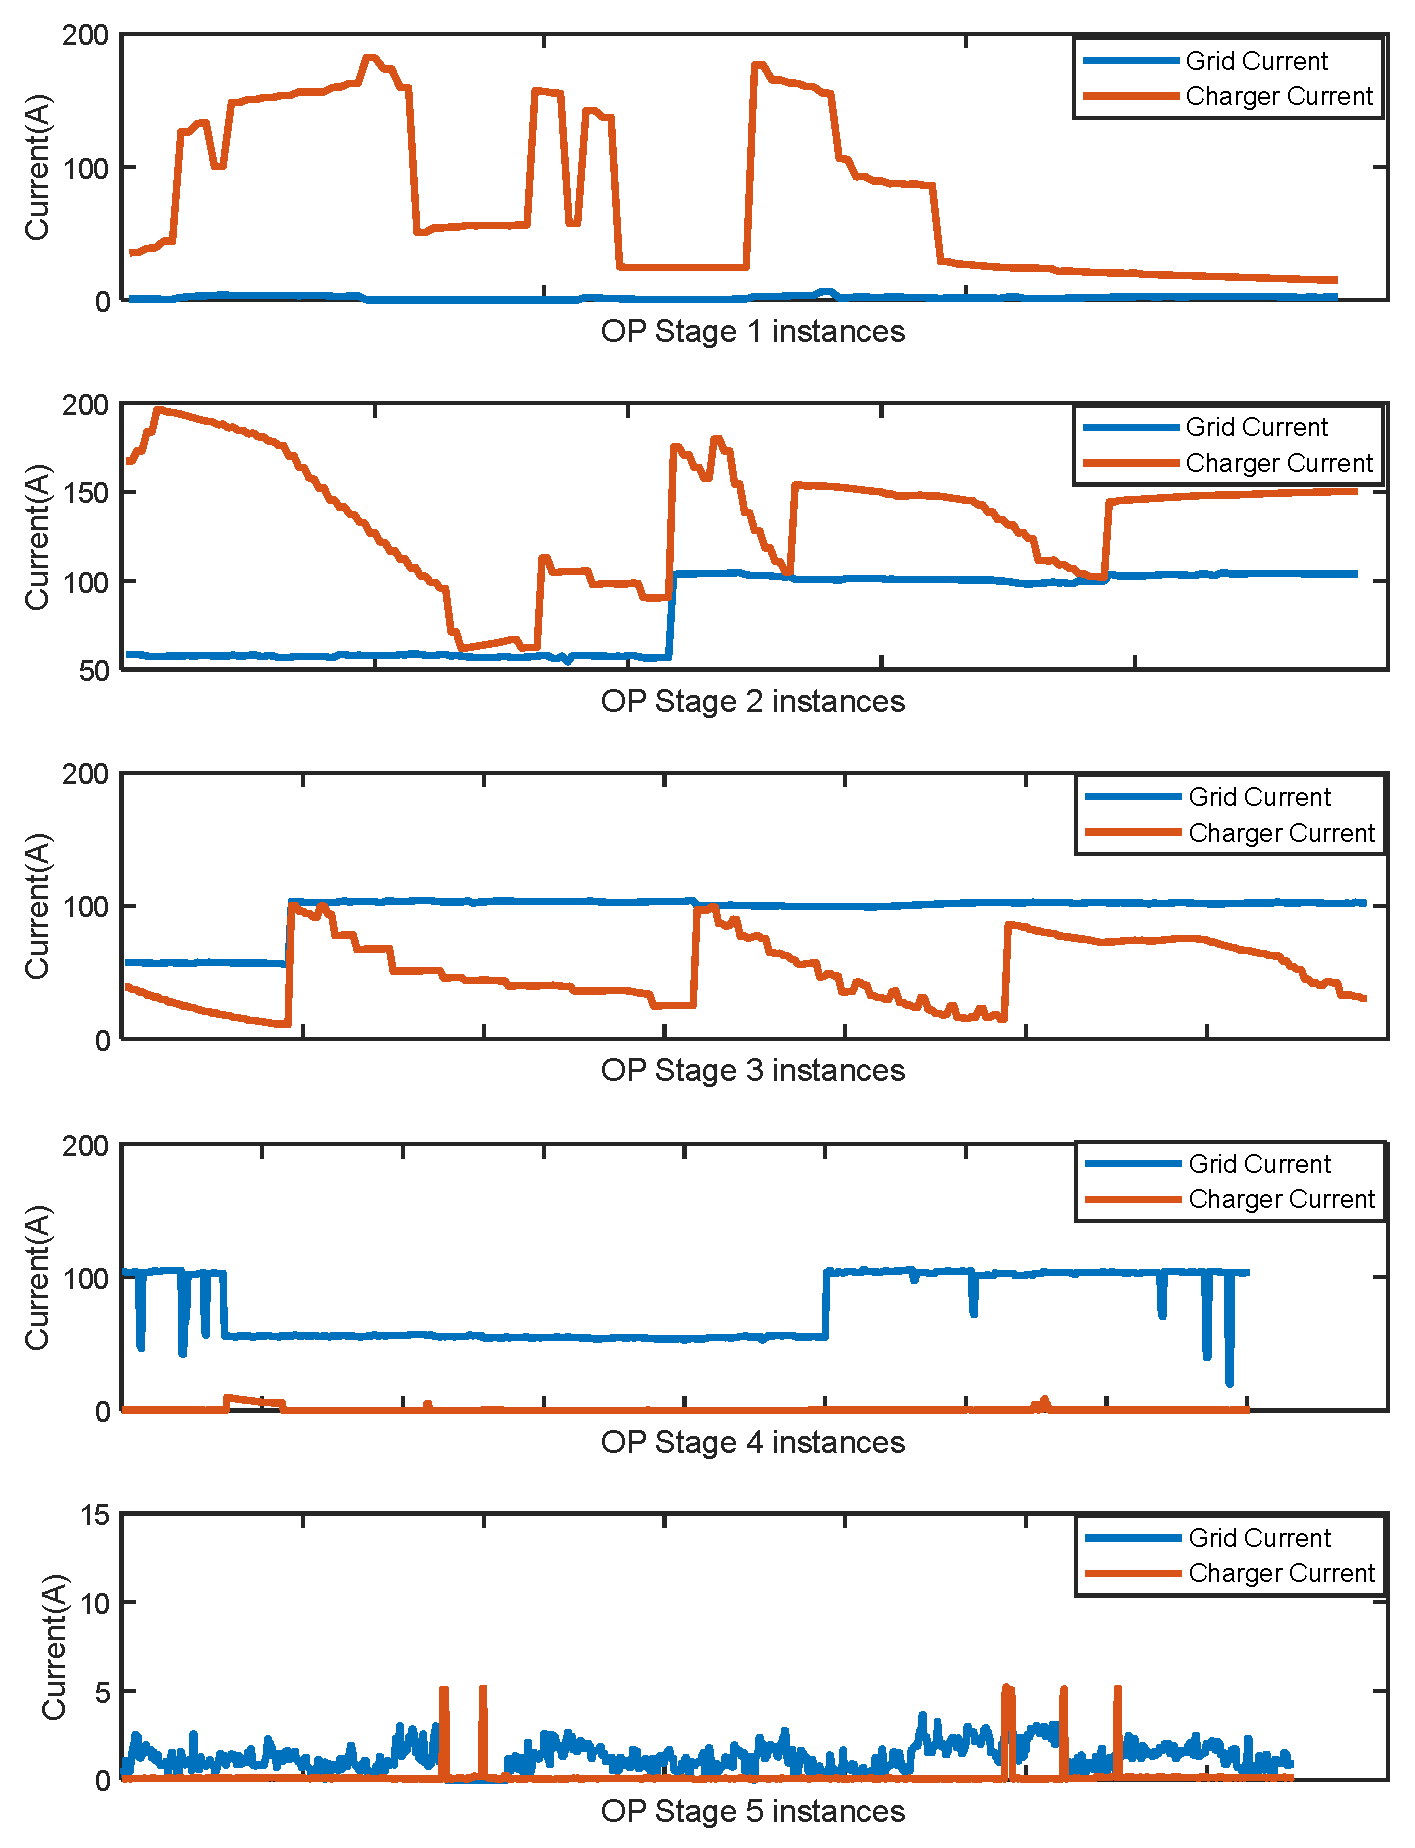
25]. A similar approach is adopted for interharmonic voltage emissions, wherein the three-second aggregated RMS values are benchmarked against the compatibility limit of the next higher even-order harmonic, as recommended by the standard. To aid in the interpretation of the emission behavior, the variation in the fundamental current across operating stages is presented in
Figure 4, providing context for the observed emission patterns under different loading conditions.
In the supraharmonic frequency range (2–9 kHz), the maximum RMS values of the measured supraharmonic voltages and currents are identified for each operating stage. For the 9–150 kHz range, the assessment is carried out using the light quasi-peak (QP) method described in [
28]. The recorded waveforms are post-processed to compute quasi-peak emission levels, whose RMS values are then compared against the compatibility limits defined in IEC 61000-2-2 [
25] for voltage, and against the supraharmonic current emission limits established in
Section 2.1. Since measurements are conducted across all three phases, the maximum value among the phases is reported for each frequency group.
4.1. Converter Topologies, Control Strategies, and Emission Dynamics in EV Chargers and BESS Modules
The charger and BESS module manufacturers typically do not disclose detailed information regarding the converter topology and control strategies employed in their systems. Consequently, researchers rely on literature surveys to identify plausible configurations for such systems. Various converter topologies applicable to EV chargers and bi-directional energy storage systems have been identified in [
29,
30,
31].
Since the BESS converter supports a bi-directional power flow, topologies such as the six-pulse Active Front End (AFE) converter are considered suitable for this application. EV chargers, like those measured in this study, do not typically offer grid support in the reverse direction. Therefore, unidirectional topologies, such as the VIENNA rectifier (a three-level converter), as well as AFE topologies, remain plausible candidates for the front-end converter architecture.
Higher-order multilevel converters are less likely to be used in low-voltage grids due to economic constraints [
32].
Front-end converters with bi-directional energy transfer capabilities generally include a Phase-Locked Loop (PLL), an AC voltage controller, a DC voltage controller, and an AC current controller [
33]. The AC voltage controller’s function is to reduce reactive power injection at the Point of Common Coupling (PCC) when the input voltage magnitude exceeds a predefined threshold. The PLL provides synchronization with the grid frequency, while the DC voltage controller issues an active power reference to the AC current controller to maintain DC-link voltage stability [
33].
A similar control structure may be applied in unidirectional fast chargers, though the presence of an AC voltage controller is not guaranteed. VIENNA rectifiers, in particular, may include an additional control loop to regulate the potential at the midpoint of the DC link [
34,
35].
Each of these control loops typically includes PI or PID controllers, chosen based on manufacturer-specific performance requirements. The BESS module and fast charger incorporate one or more DC–DC converters at the back end to regulate the DC voltage at the battery terminals in response to charging current requests issued by the Battery Management System (BMS). Depending on the required output voltage range, the DC–DC converter topology may vary, commonly implemented as either a resonant converter or a phase-shifted full-bridge (PSFB) converter [
36,
37]. The output voltage of the DC–DC converter is modulated in real time based on the charging current commands communicated by the BMS, typically over a communication protocol compliant with IEC 61851-24 [
38]. According to IEC 61851-23 [
39], which specifies performance requirements for DC fast-charging systems, a minimum current ramp rate of 20 A/s is mandated. This implies that the charger must be capable of adjusting the output current by at least 20 A per second. For a battery terminal voltage of 400 V, this ramp rate translates to a power ramp of
.
This additional power demand must be sourced from the DC link that connects the Active Front End (AFE) converter to the DC–DC converter. The sudden extraction of 8 kW/s causes a temporary drop in the DC link voltage, which must be countered by the DC link voltage controller of the AFE to maintain voltage regulation, typically around 800 V.
Assuming a DC link capacitor of 4000 µF, the total stored energy is
. An 8 kW/s ramp would deplete this stored energy in
. To maintain tight voltage regulation, the DC link controller should respond significantly faster than this depletion time, typically within 20–40 milliseconds [
40]. This sets the required time constant T for the DC link voltage controller, corresponding to a bandwidth ω = 1/T ∈ [25, 50] rad/s (or 4–8 Hz).
The AC-side current controller of the AFE is generally 5–10 times faster than the voltage controller [
40,
41,
42], requiring a response time in the range of 2–8 ms, or a bandwidth of approximately 20–80 Hz. Typically, the bandwidth of the current controllers, as identified in the literature [
30,
37,
40,
41], is greater than 100 Hz. This implies that, for a fundamental frequency of 50 Hz, every transient event, such as a sudden change in active power requested by an EV, leads to a change in the amplitude of the current waveform within a single cycle. These abrupt variations introduce waveform asymmetry, resulting in differences between the positive and negative half-cycles of the current. Such asymmetries are a known cause of even-order harmonics and interharmonics, especially during dynamic events in EV charging. The nature of these transient emissions is strongly influenced by the charging profile selected by the EV or battery manufacturer. This includes factors such as the following:
Switching between different constant current levels (CC–CC transitions);
Transition from constant current (CC) to constant voltage (CV) charging stages;
Variations in charging current commanded by the Battery Management System (BMS) in response to the battery terminal voltage, state of charge (SoC), temperature, or cell health.
As a result, the current waveform, and, hence, its harmonic and interharmonic content, can vary significantly not only across different EV models but also between charging sessions of the same EV. This leads to inconsistent emission patterns, making it challenging to generalize or predict harmonic behavior from EV charging without detailed measurements or dynamic modeling.
4.2. Interharmonics
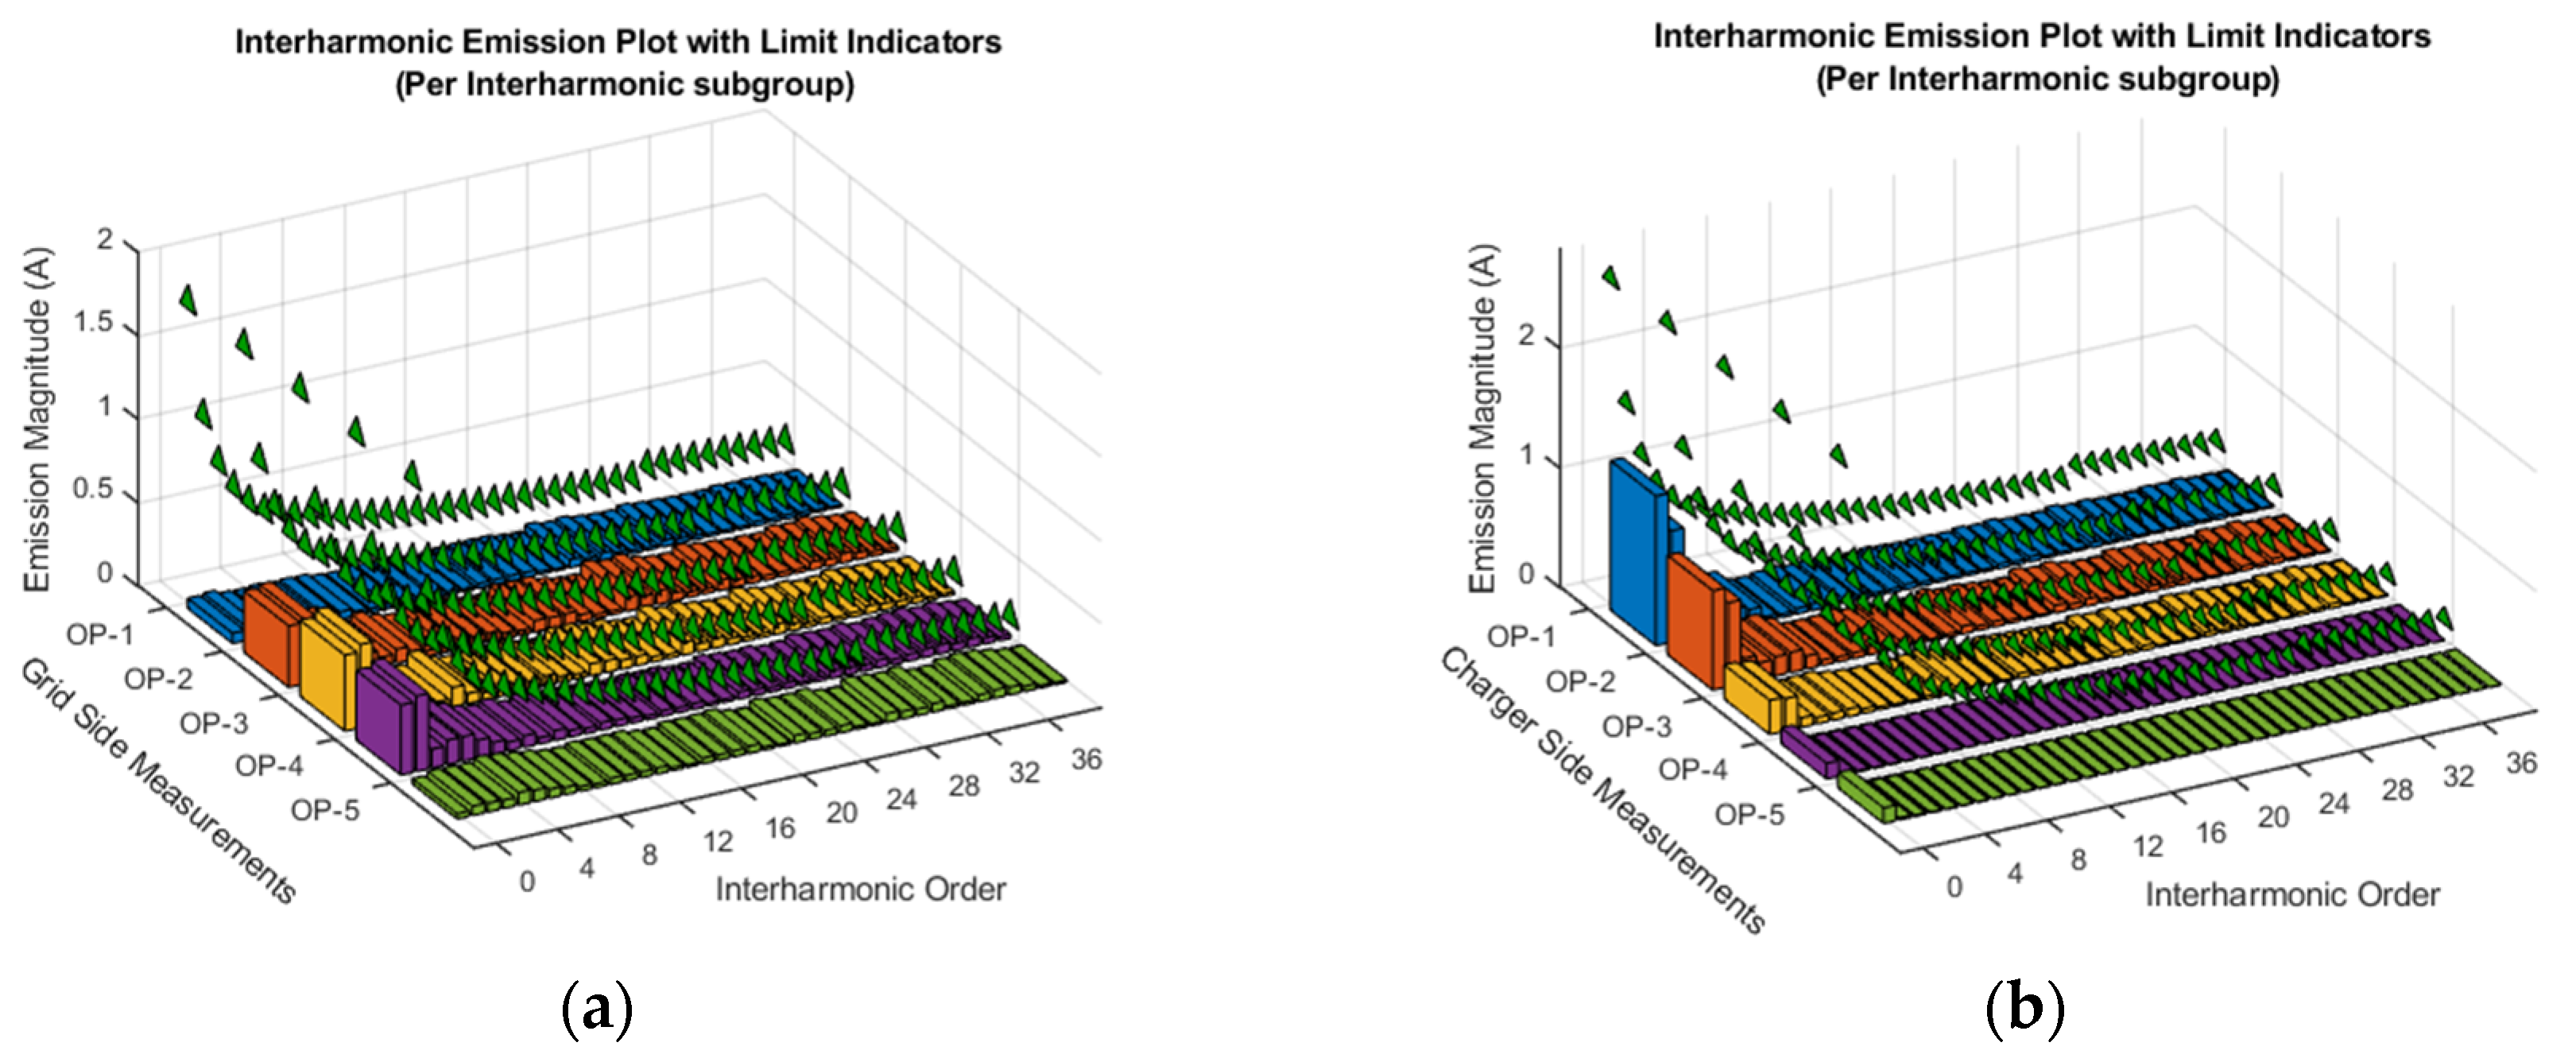
The interharmonic current emissions measured at the charger output and at the BESS input (LV grid side) are presented in
Figure 5. The highest emission levels are observed on the charger side during Operating Stage 1, particularly within the interharmonic subgroups 0 (5–40 Hz) and 1 (60–90 Hz). These elevated emissions are primarily attributed to the waveform distortion occurring during the initial phase of the charging process.
At the start of the charging sequence, the charger engages a soft-start mechanism comprising a pre-charge phase followed by a current ramp-up phase. According to IEC 61851-23 [
39], the current ramp rate on the output side of the charger must be the greater of 20 A/s or the maximum ramping capability of the charger. During this ramp-up, the charging current waveform often exhibits an asymmetry between the positive and negative half-cycles, as well as between consecutive cycles. This asymmetry results in the presence of DC components and elevated interharmonic emissions in the IH0 and IH1 subgroups. During a normal charging operation, the battery management system (BMS) of the electric vehicle (EV) dynamically communicates the required charging current to the charger based on either a constant current/constant voltage profile or protective constraints, such as thermal or over-voltage limits. The charger responds by modulating its output voltage to meet the requested current. These variations in output power manifest as fluctuations in the input AC current and input power, contributing further to interharmonic distortion, particularly evident in operating stages 2 and 3. The emissions observed at the charger input terminals propagate to the BESS input as interharmonic voltage components, representing a potential source of secondary interharmonic emissions during operating stages 2 and 3. In operating stage 4, the variation in input current is characterized by abrupt transitions, as illustrated in
Figure 4. The resulting DC and interharmonic components may contribute to the core saturation of the isolation transformer (see
Figure 3a), a phenomenon that is further examined in the subsequent section on harmonic emissions.
An additional potential source of emissions observed in the IH0 and IH1 subgroups may be related to sub-synchronous resonances caused by the interaction between the AC-side source inductance (including the transformer and grid impedance) and the DC-link capacitance of the power electronic converter. This phenomenon typically arises in systems using active front-end converters, such as those present in the BESS and charger module, primarily when operating under weak grid conditions or when the source impedance is high. The combination of an effective source inductance and large DC-link capacitance can form a resonant LC circuit at sub-synchronous frequencies (e.g., tens to hundreds of Hz), which may be excited by dynamic control loops or load transients. Control parameters such as the bandwidth and damping of the inner current control loop, the phase-locked loop (PLL) dynamics, and limited active damping may further contribute to these resonant behaviors. Such interactions are particularly relevant when both the charger and the BESS operate concurrently, as overlapping control actions can amplify the interharmonic content in the lower-frequency range. While such oscillations can pose a risk to grid stability, the absence of charging interruptions during the test campaign suggests that the dominant cause of the high emissions in these bands is the rapid variation in the fundamental current during charging transitions.
Finally, it should be noted that the current transformers (CTs) used in the measurement setup are designed for accurate operation above 5 Hz. The DC component is, hence, not reported.
4.3. Harmonics
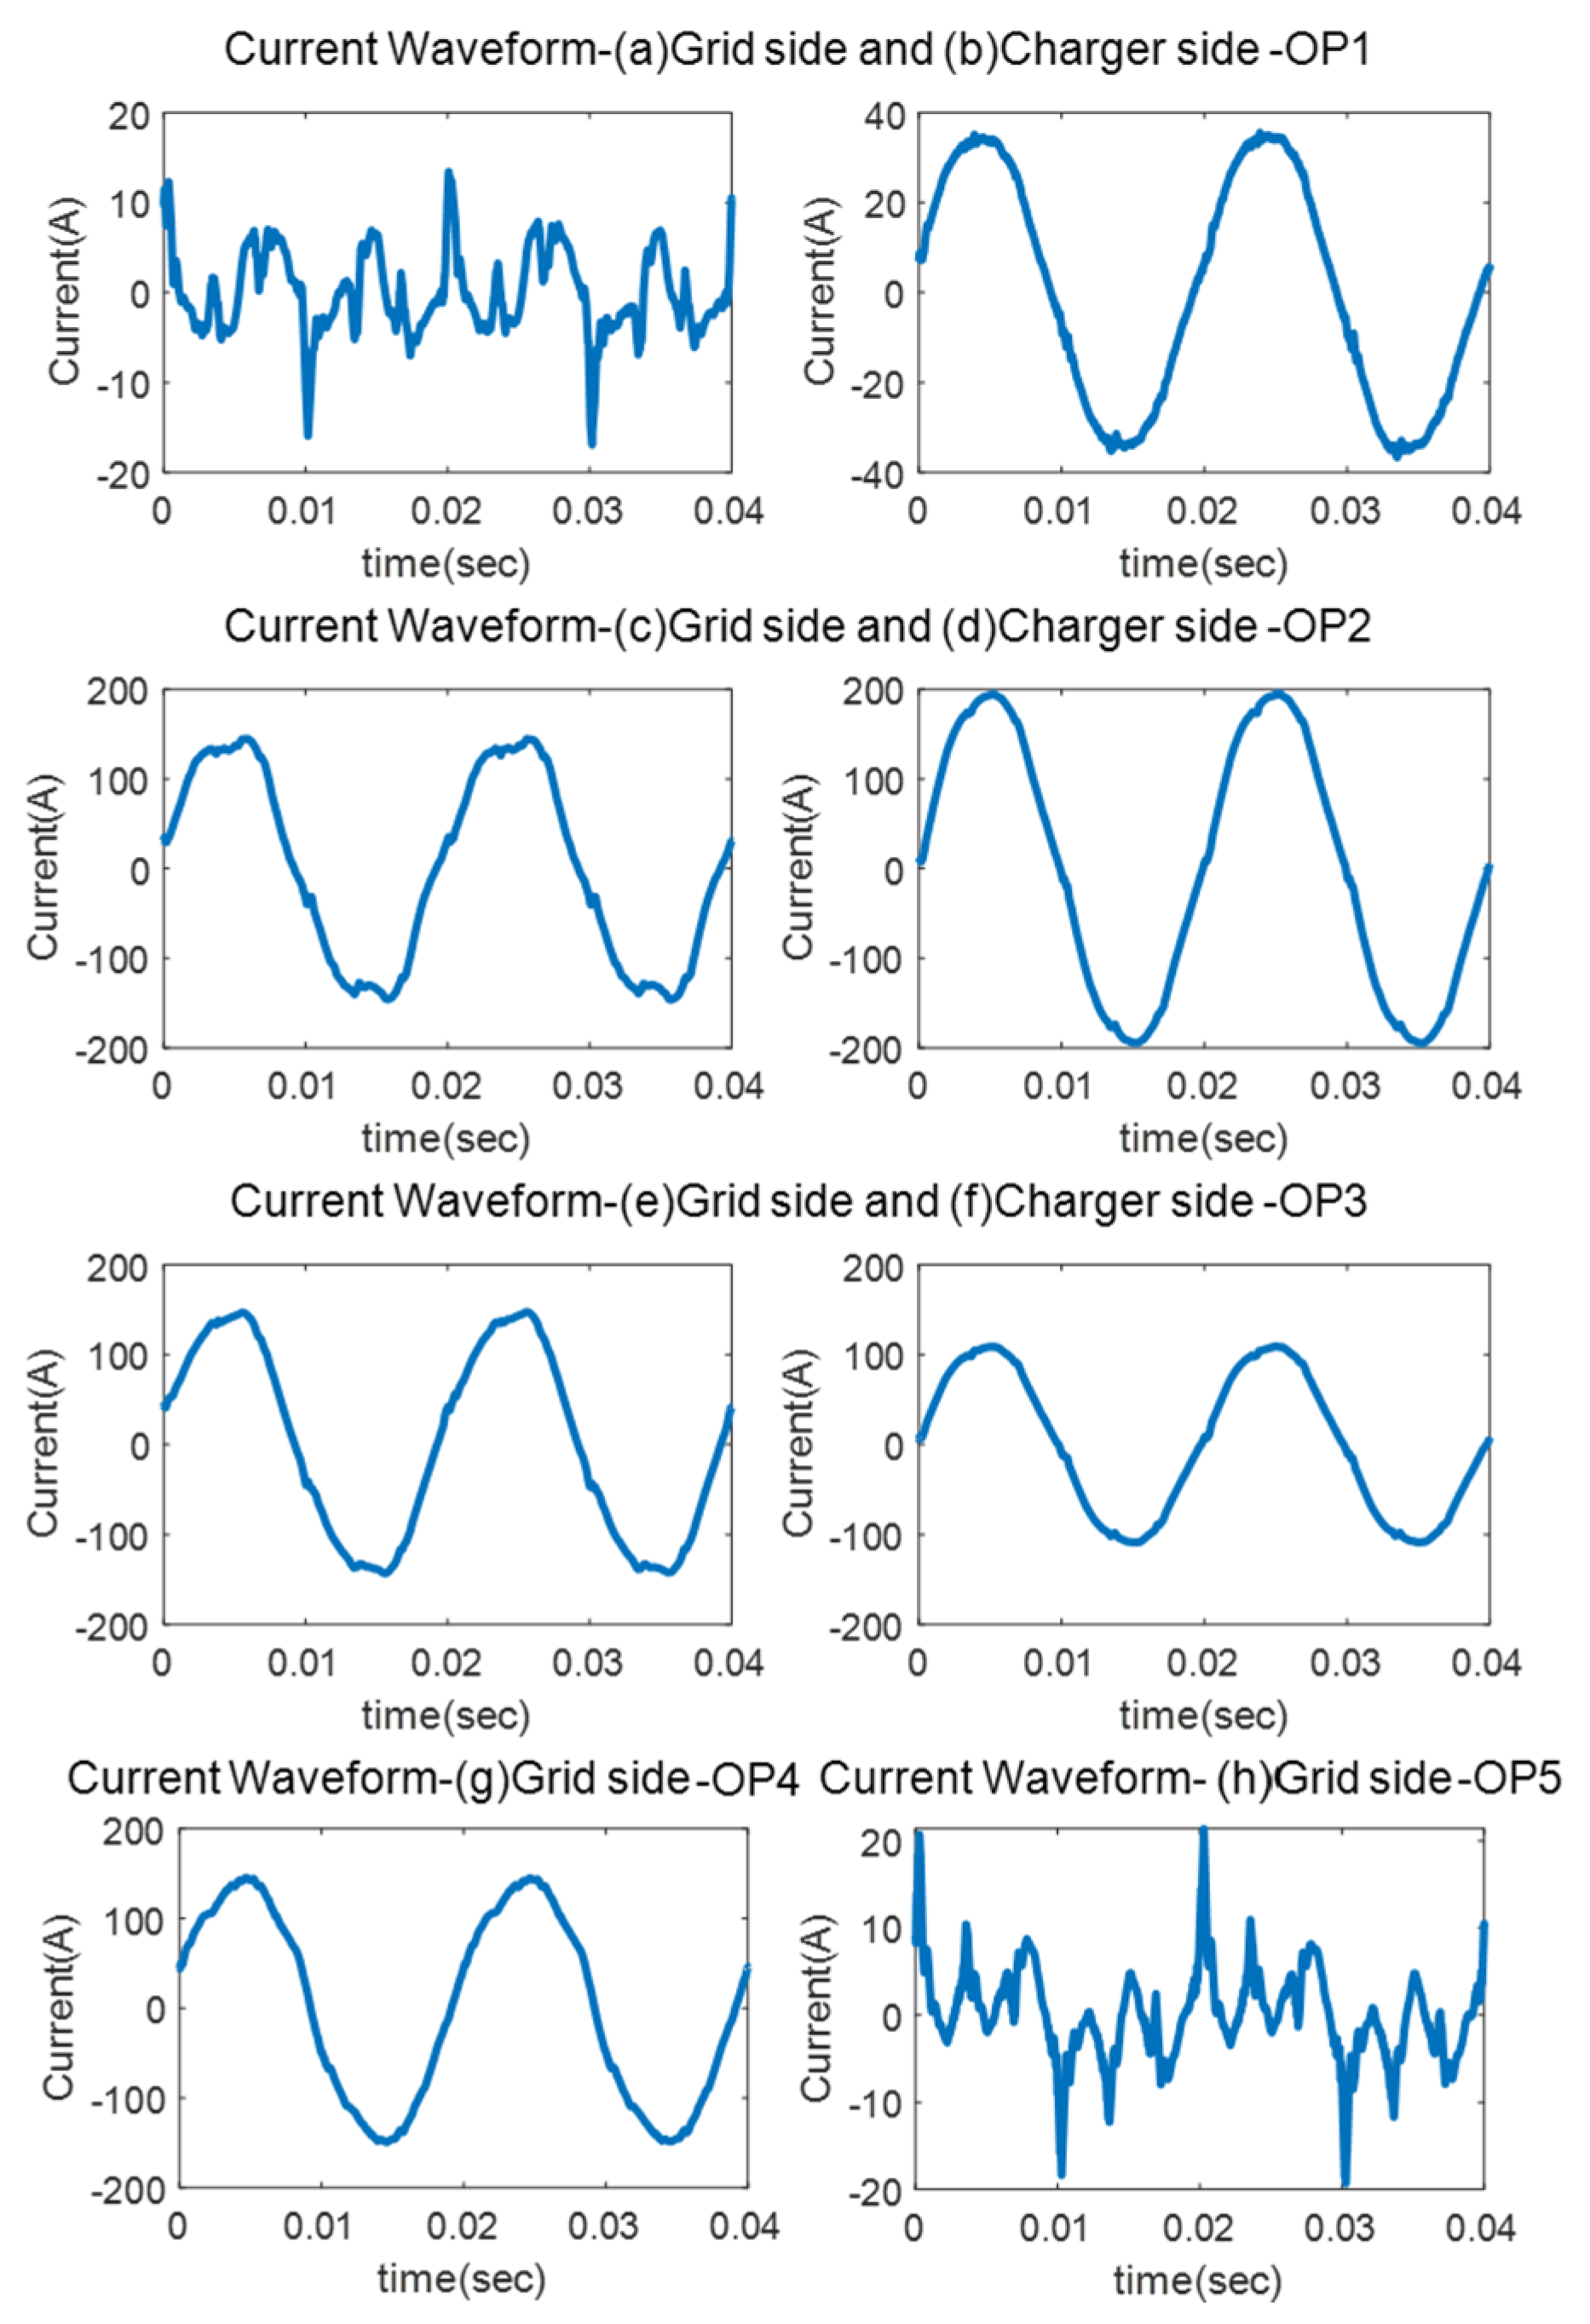
A representative current waveform over a 40 ms interval for each operating stage is presented in
Figure 6. The waveforms in
Figure 6a,h illustrate the no-load current drawn by the BESS module, comprising both the magnetizing current of the transformer and the current required by the BESS converter to support auxiliary systems. Distinct current spikes are observed at time instants 0, 0.01, 0.02, 0.03, and 0.04 s, coinciding with the zero-crossings of the voltage waveform. At these moments, the magnetic flux in the transformer core reaches its peak. As the core enters saturation, the magnetic permeability decreases sharply, significantly reducing the magnetizing inductance. The transformer consequently draws a disproportionately large magnetizing current to maintain the required magnetic flux under these conditions. This nonlinear behavior results in the presence of prominent odd harmonics in the current waveform, as evident in the harmonic spectrum shown in
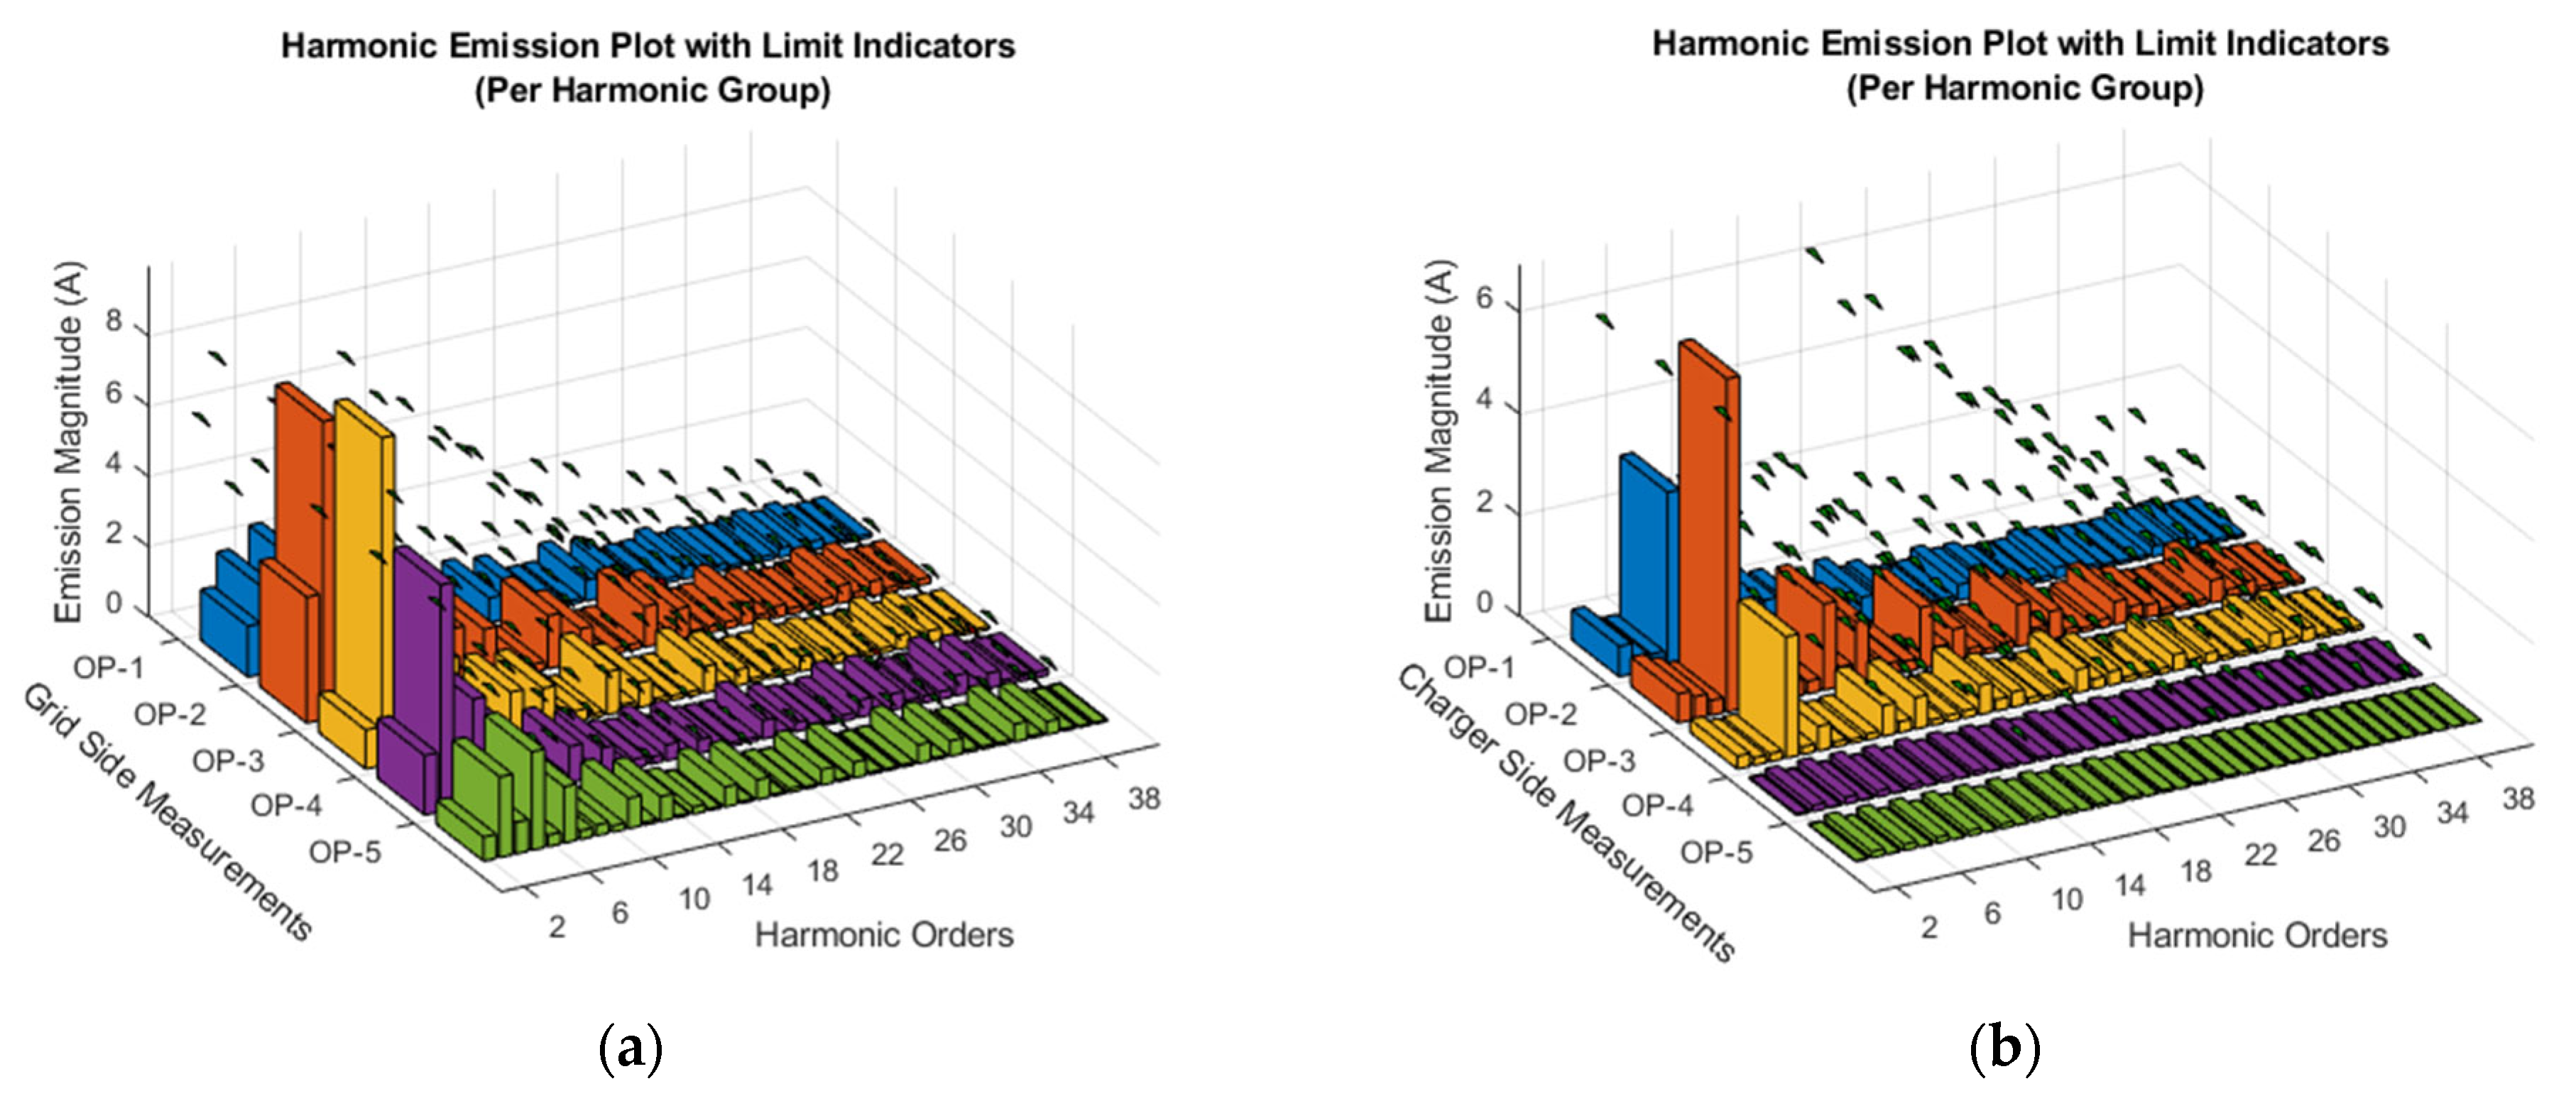
Figure 7a, which reflects the saturation-driven magnetization characteristics of the transformer core.
The current waveforms in
Figure 6c,e,g, corresponding to operating stages 2, 3, and 4, respectively, exhibit additional distortion. These include a leading current relative to the voltage waveform, observable distortion around the voltage zero-crossings, and a flat-topped current profile, particularly prominent in operating stages 2 and 3. This flat-topped shape is somewhat less pronounced in stage 4. The corresponding harmonic spectra in
Figure 7a shows elevated magnitudes of the 3rd, 5th, 7th, 11th, and 13th harmonic orders. Notably, the third harmonic exceeds the applicable emission limits during these operating stages.
The flat-topped waveform observed in stages 2 and 3 may be partially attributed to the voltage distortion induced by the operation of the Mode 4 charger, which is connected downstream of the BESS output. However, in operating stage 4, where the Mode 4 charger is not active, the third harmonic distortion remains significantly elevated. This suggests that the increased harmonic content may instead originate from the operation of a three-phase six-pulse converter in combination with multiple single-phase auxiliary modules associated with thermal management or HMI systems. Alternatively, the converter topology may consist of three single-phase modules operating in parallel on each phase.
On the charger side, as shown in
Figure 7b, the harmonic emissions are consistent with the expected behavior of a six-pulse converter, with the 5th, 7th, 11th, and 13th harmonics being dominant. No harmonic emission limits are exceeded in these cases. However, the relatively high amplitude of the second harmonic observed during operating stages 1 and 2 warrants further investigation, which is proposed as a topic for future research.
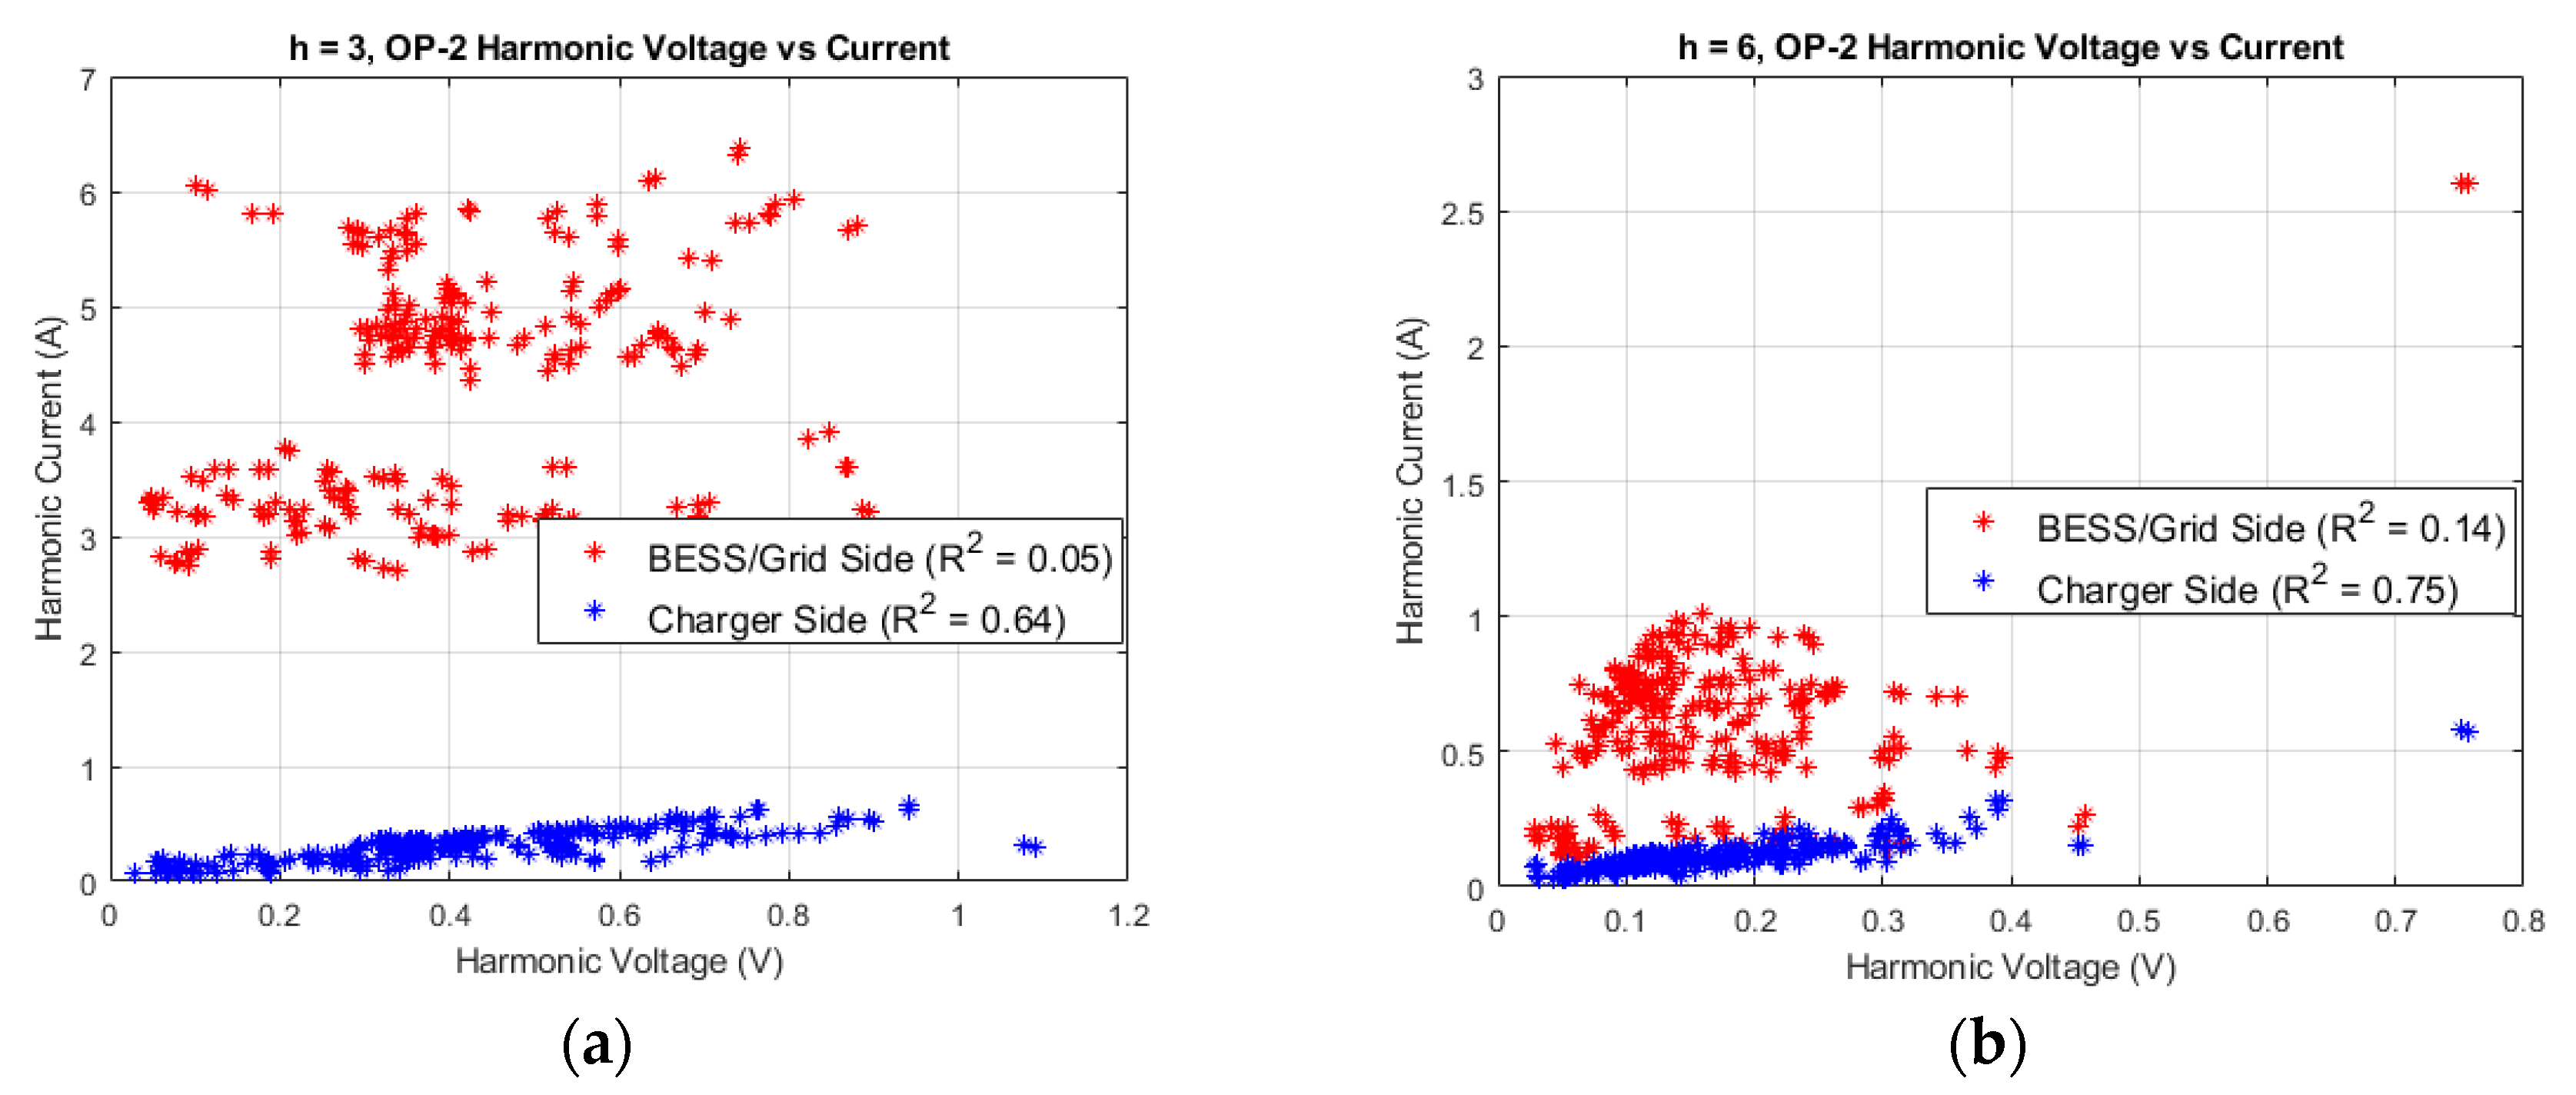
Figure 8 provides details for two representative cases during OP2: the third harmonic (triplen) and the sixth harmonic (triplen and even). For both orders, the BESS/grid side (red) exhibits substantially higher current magnitudes than the standalone charger side (blue). The correlation between the harmonic current and harmonic voltage, expressed as R
2 from a linear fit, provides insight into the emission origin: a high R
2 is indicative of a primary emission from the source, whereas a low R
2 suggests a secondary emission arising from the interaction with the network or other equipment [
43]. In
Figure 8a, the BESS/grid side shows a low correlation (R
2 = 0.05) for the third harmonic, consistent with a secondary emission caused by the interaction with the downstream charger via the zero-sequence path of the BESS input transformer. In
Figure 8b, the sixth harmonic also shows a low correlation on the BESS/grid side (R
2 = 0.14), suggesting that a primary emission from the BESS, driven by the half-cycle asymmetry described in
Section 4.1, is the main source, but with additional secondary contributions from the load interaction. Under a high load, the BESS transformer may also approach magnetic saturation; incipient saturation and any DC bias (sensor/controller offsets or residual flux) can further increase both the even-order content and triplen magnetizing current. These mechanisms explain the higher even and triplen levels on the BESS/grid side. The correlation analysis approach shown here can also provide insight into the interharmonic emissions discussed in the previous section (
Section 4.2), by distinguishing between whether they originate primarily from the BESS converter or from secondary interaction effects.
4.4. Supraharmonic Emissions
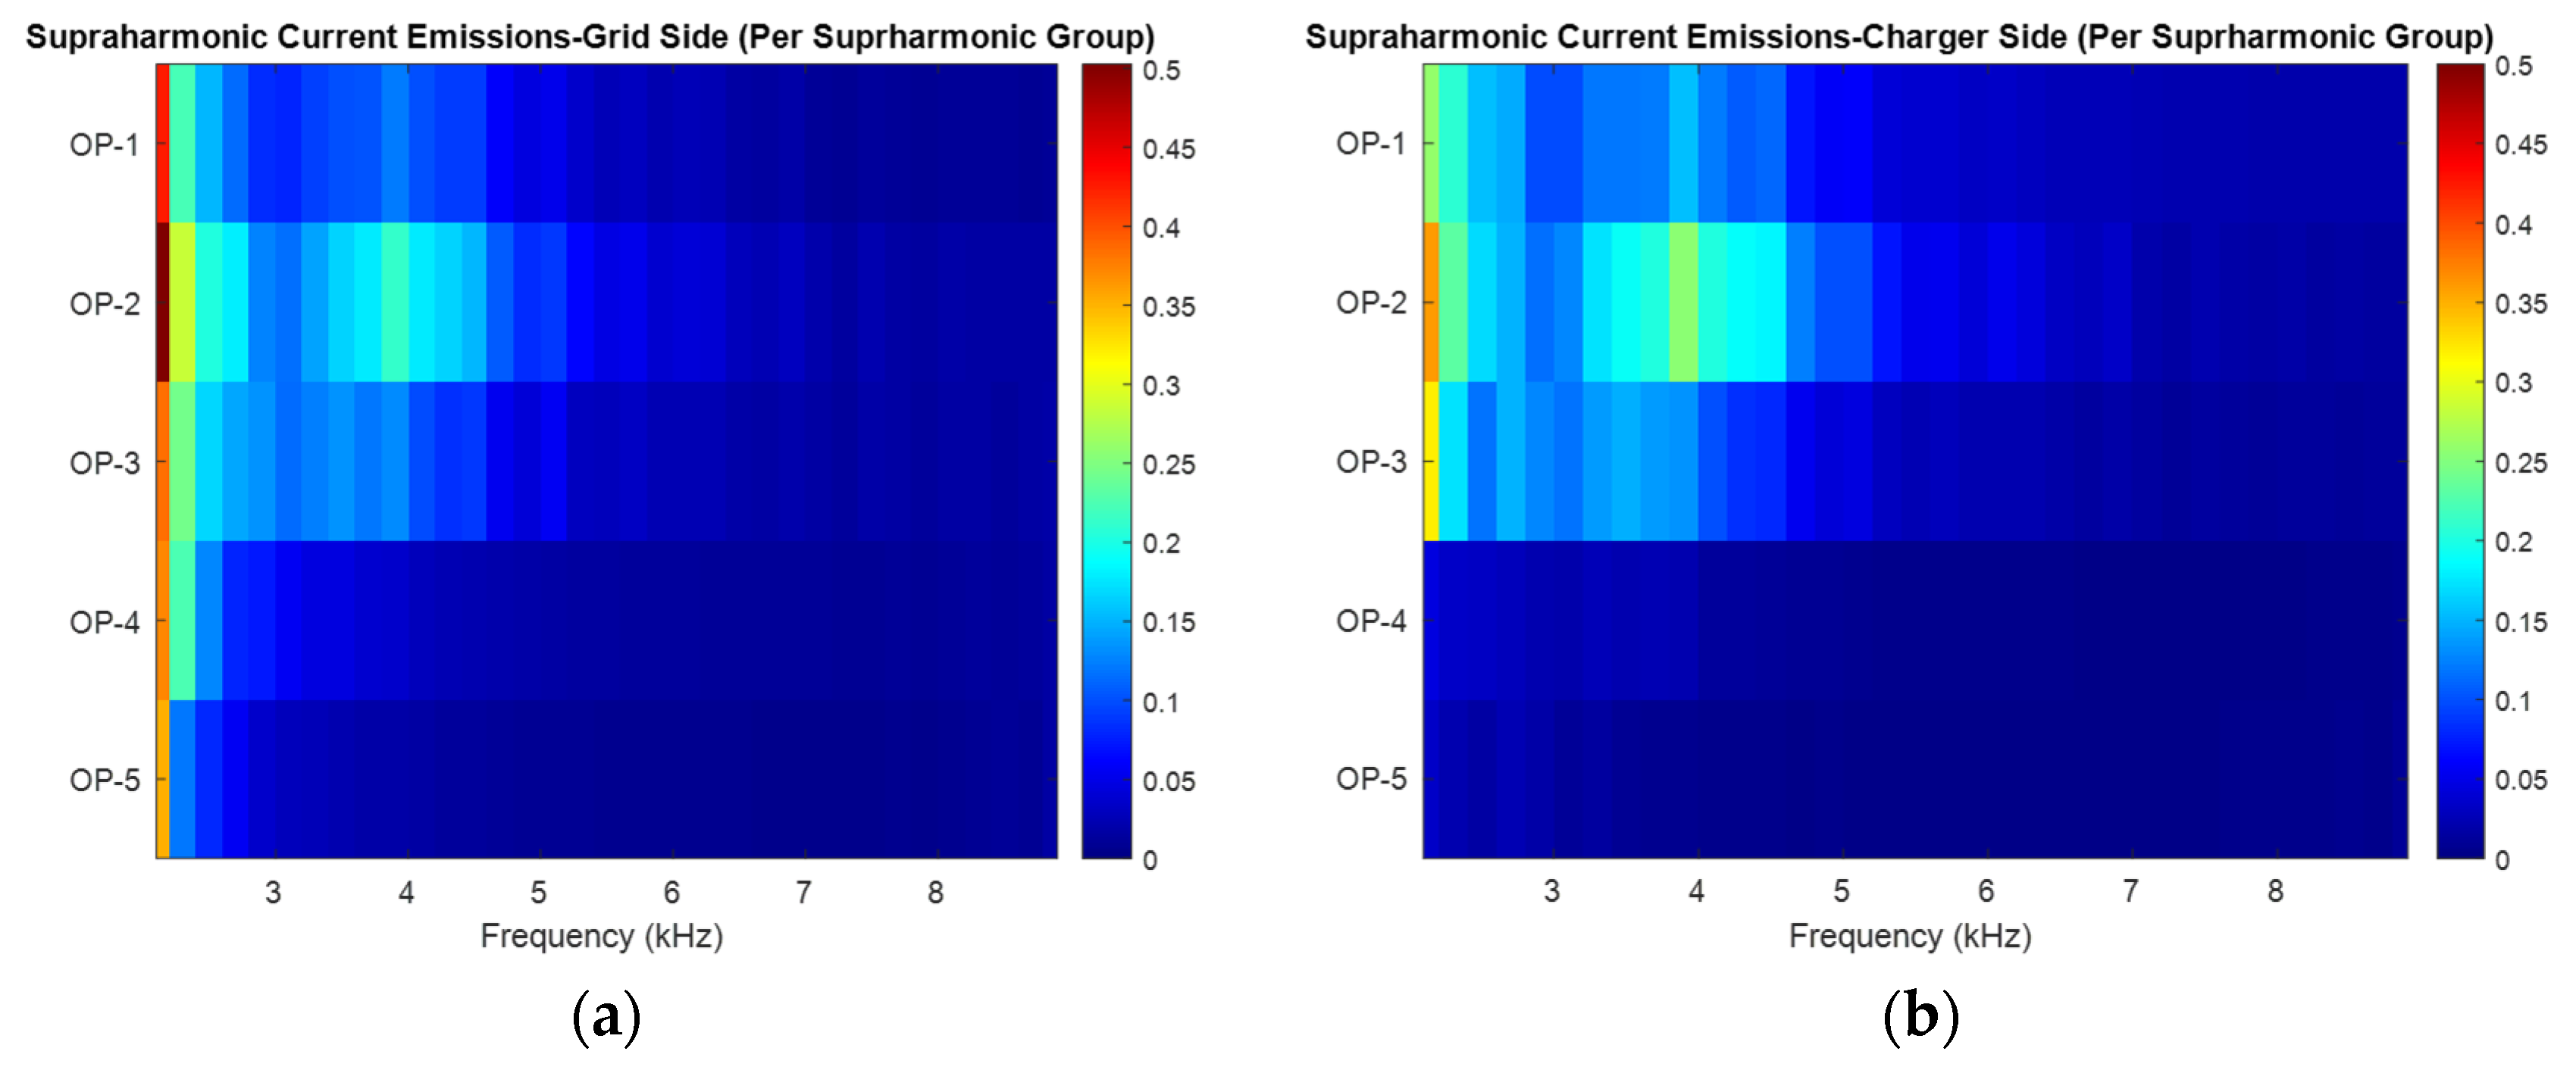
The RMS value of the supraharmonic current emissions from the BESS module side and the charger side in the frequency range 2–9 kHz is shown in
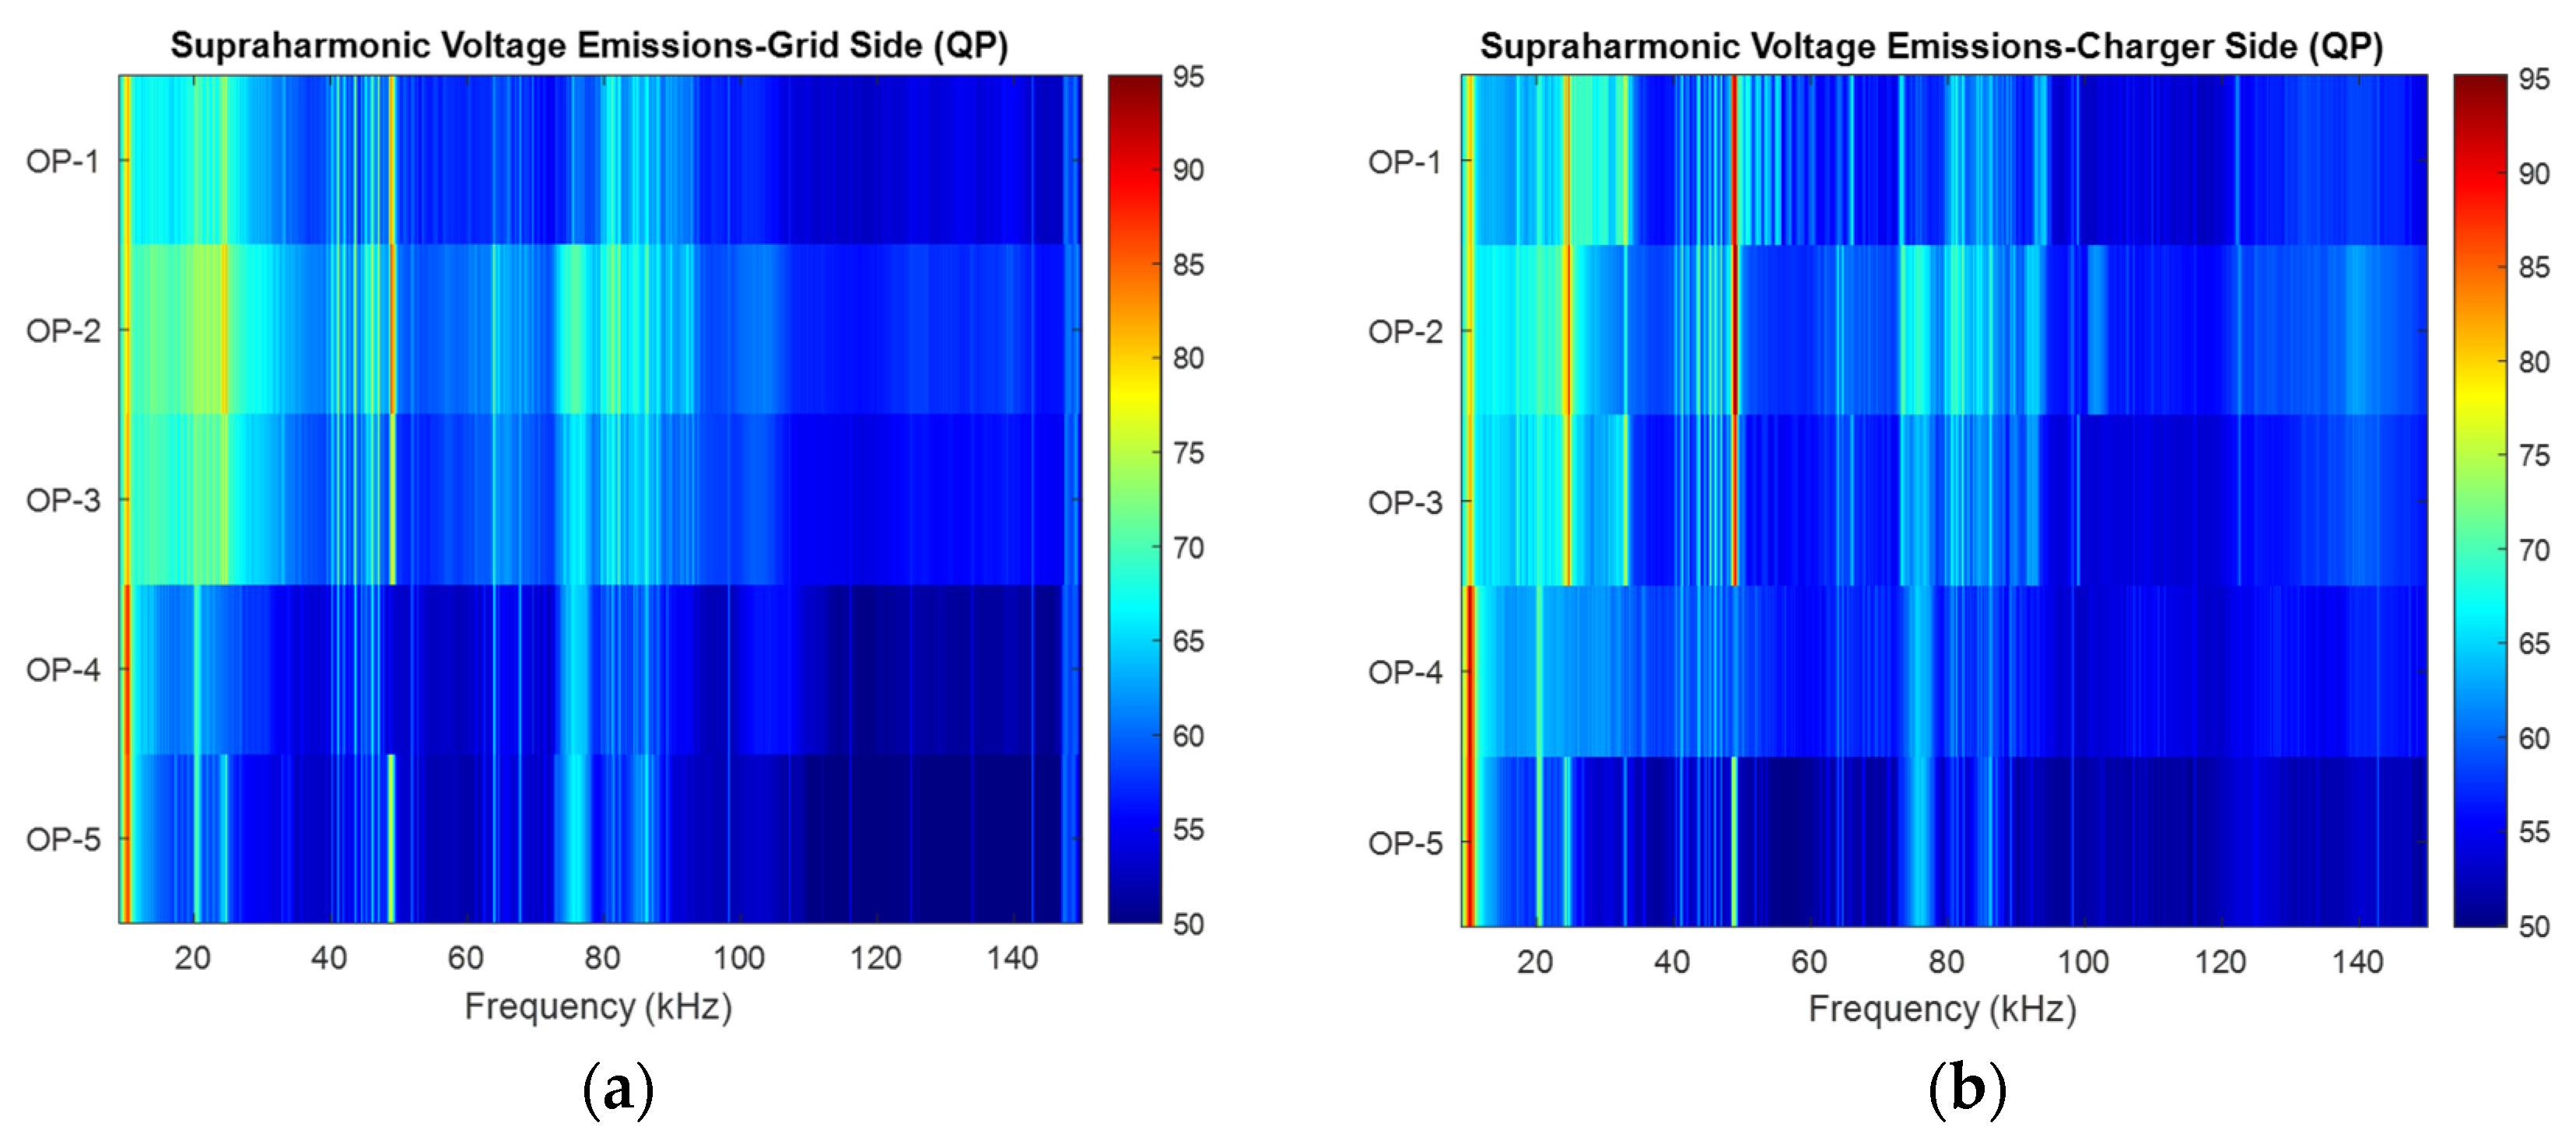
Figure 9. The quasi-peak values are compared in
Figure 10. The assessment in
Figure 10 is limited to the frequency range 9–50 kHz, considering the bandwidth of the current transformer on the charger side as discussed in
Section 2. As none of the supraharmonic voltage or current distortion limits identified in this paper are exceeded, the assessment is instead presented in the form of a spectral heatmap, where the color scale represents the intensity or magnitude of the emissions at each frequency.
A comparative assessment of operating stages 1, 2, and 3 in
Figure 9 reveals distinct emission components in the 3–5 kHz range. These emissions are significantly attenuated in stages 4 and 5, suggesting a strong correlation with active power conversion occurring during stages 1–3. As shown in
Figure 10, the switching frequency of the BESS converter is observed to be between 9.5 and 10.5 kHz, with a clear second harmonic component appearing around 20–21 kHz, a typical signature of switching behavior. Additionally, a pronounced emission peak at 24–25 kHz is observed during operating stages 1–3, but this peak diminishes significantly in stages 4 and 5, supporting its attribution to the Mode 4 EV charger, which is only active in the former stages. The 3–5 kHz emissions are characteristic of third-order intermodulation distortion, commonly generated in nonlinear systems, such as power electronic converters. Specifically, these emissions align with intermodulation products of the following form:
For instance, if f1 ≈ 10 kHz (BESS converter) and f2 ≈ 25 kHz (Mode 4 charger), a third-order intermodulation component 2f2 − f1 ≈ 40 kHz or 2f1 − f2 ≈ −5 kHz would be expected, with the negative frequency manifesting symmetrically as a 5 kHz spectral component. The observed distortion in the 3–5 kHz region likely results from such nonlinear mixing effects. These intermodulation products arise due to spectral interactions between switching frequencies and their harmonics, amplified by system nonlinearities such as pulse-width modulation (PWM), transient current ripple, or the operation of multiple converters in close proximity. The Mode 4 charger, for example, typically employs multiple high-power converter modules (up to six in parallel) that dynamically adjust their operation in response to the charging demands communicated by the EV’s battery management system (BMS). This dynamic behavior can give rise to time-varying spectral content and rich intermodulation effects, particularly under load transitions.
Table 4 enumerates the intermodulation products expected from combinations of the BESS and charger switching frequencies. Frequencies observed in the measured supraharmonic emission spectra are highlighted in bold.
For distortion in the 50–150 kHz range, the RMS values of the quasi-peak (QP) supraharmonic voltage emissions on the charger side and the BESS/grid side are presented in
Figure 11a and
Figure 11b, respectively. In addition to the intermodulation frequencies listed in
Table 2, another significant source of distortion is the presence of resonances in the frequency-dependent network impedance (FDNI). These resonances vary dynamically based on the system configuration. For example, the number of converters operating in parallel within the Mode 4 charger, determined by the EV’s charging current demand, as well as fluctuations in miscellaneous loads connected at the PCC (as illustrated in
Figure 1), can alter the FDNI and introduce resonances at different frequencies. These resonances amplify emissions at specific frequencies and contribute to the observed variability in supraharmonic distortion across operating stages. Notably, such resonance effects may help explain the differences observed in the 80–100 kHz range in the comparative spectra presented in
Figure 9,
Figure 10 and
Figure 11.
5. Comparison of Grid-Side Emission of Fast Charger and BESS-Integrated Fast Charger Module
For comparing the emissions from the grid-fed charger (Charger 2 in
Figure 1) and the BESS–fast charger combined module (Charger 3 in
Figure 1), the authors propose using the emission ratio as a metric. The emission ratio is defined as the percentage ratio of the maximum of the time-averaged harmonic currents across all three phases in the BESS module to that of the grid-fed charger:
where
is the time-mean of the harmonic current in phase ‘x’ of grid-fed charger and
is the time-mean of the harmonic current in phase x of BESS.
As discussed in
Section 2, the BESS operates in peak shaving mode, and the active power sourced from the grid is limited to 75 kW; thus, for a better comparative assessment, only the emissions of charger 2 when charging an EV with active power less than 75 kW are used for the assessment. The results of the analysis for interharmonic subgroups (0–39), harmonic orders (2–40), and suprharmonic groups (2.1–8.9) are presented in
Figure 12 in the form of heatmaps. The colors indicate the amplitude of the emissions ratio in each operating stage. The emissions ratio for a particular harmonic with a value greater than 100% indicates that the net emission from the BESS module is higher, while those that are dark represent an emission either comparable to or less than that of the BESS module. The assessment is further limited to operating stages 2–4, wherein the BESS is actively sourcing power from the grid.
The following conclusions are drawn from
Figure 12a:
Interharmonic emissions (Subgroups 29 and above): The BESS module exhibits higher interharmonic emissions than the grid-fed charger for subgroups 29 and above across all operating stages. The most pronounced relative increase in emission levels is observed in operating stage 4, where only the BESS module is active and charging the battery.
Interharmonic subgroups 5–29: Emissions from the BESS module are notably higher in operating stages 2 and 3, suggesting that the voltage distortion introduced by the downstream charger (Charger 3 in
Figure 1) contributes to elevated secondary emissions from the BESS system.
Figure 12b presents consistent findings for harmonic emissions:
Harmonic orders 31 and above: Across all operating stages, harmonic emissions from the BESS module are higher for orders above 31.
Intermediate harmonic orders (10–31): The highest BESS emissions occur in operating stage 2, coinciding with maximum downstream charger activity. This pattern indicates the presence of secondary emissions due to the interaction with the downstream load.
Low harmonic orders (2–10): Elevated emissions of the third harmonic and other even-order harmonics are observed, potentially indicating magnetic core saturation in the BESS transformer (as discussed in
Section 3).
Figure 12c presents results for the supraharmonic range (2–9 kHz):
For lower-frequency groups (2.0–2.6 kHz), the observed emission behavior bears some resemblance to that of conventional harmonics. This is consistent with the characteristics of higher harmonic orders approaching the 40th, which marks the lower boundary of this frequency range in a 50 Hz system. According to IEC 61000-2-2 [
25], the harmonic analysis typically extends up to the 50th order, further supporting this partial overlap.
The observed increase in current harmonics in the 31–50 range may be attributed to the resonance phenomena in the system impedance. While a parallel resonance typically amplifies the voltage distortion, it can also lead to increased current emissions if the converter or load responds to the elevated voltage harmonics. Alternatively, the increase in harmonic current may stem from a series resonance condition or a dip in network impedance at these frequencies.
Finally, the presence of a downstream charger, while not significantly impacting the peak load at the LV grid level, appears to influence the FDNI. This interaction likely contributes to the elevated supraharmonic emissions observed in operating stage 2, particularly in the 2–7 kHz range.
6. Impact on Harmonic Hosting Capacity
The harmonic hosting capacity, as defined in [
5,
6,
44], is a function of emissions from the converter, existing background voltage distortion, acceptable voltage distortion limits, and the frequency-dependent network impedance (FDNI). To assess the impact of the combined BESS and fast charging, a case study is presented. The measurements from the upstream power quality analyzer connected at the PCC are used for this assessment. For the measurement and installation setup shown in
Figure 1, the grid impedance (
includes contributions from the transformer leakage reactance and winding resistance, the impedance of the connecting cables, and the upstream medium-voltage (MV) network. The MV network primarily contributes inductive reactance due to distribution lines and additional source impedance. The grid impedance is computed by scaling the fundamental-frequency short-circuit impedance, as presented in
Section 2.1, up to 9 kHz. From 20 kHz to 150 kHz, the upstream transformer impedance is estimated based on measurements conducted on a different 800 kVA transformer. In the intermediate frequency range between 9 kHz and 20 kHz, the impedance is interpolated using linear regression.
The load impedance of miscellaneous loads (
) is stochastic and is assumed based on the load impedance model presented in [
45] and is scaled over the frequency range from 50 Hz to 150 kHz. The contribution from neighboring EV chargers is neglected. The contribution of the battery energy storage system (BESS) and Charger 3 (
in
Figure 1 is estimated by computing the average of the ratio of the cross-power spectral density (CPSD) of the input voltage to the CPSD of the input voltage and BESS module current of each phase and in each operating stage of the BESS module, over the frequency range of 50 Hz to 150 kHz [
46]. The total impedance looking into the distribution network from the PCC is computed over 10,000 iterations using Equation (3).
The range of variation in the frequency-dependent network impedance (FDNI), denoted as
, is presented in
Figure 13 for each operating stage. Both the 95th percentile and the median values of the FDNI are shown. Based on these observations, it is concluded that, while local resonance phenomena, arising from variations in the load impedance and resonances from the BESS impedance, contribute to the random nature of the FDNI, the presented results are restricted to the 2 kHz range, as the hosting capacity assessment in this paper is restricted to the harmonic frequency range of 50 Hz to 2 kHz.
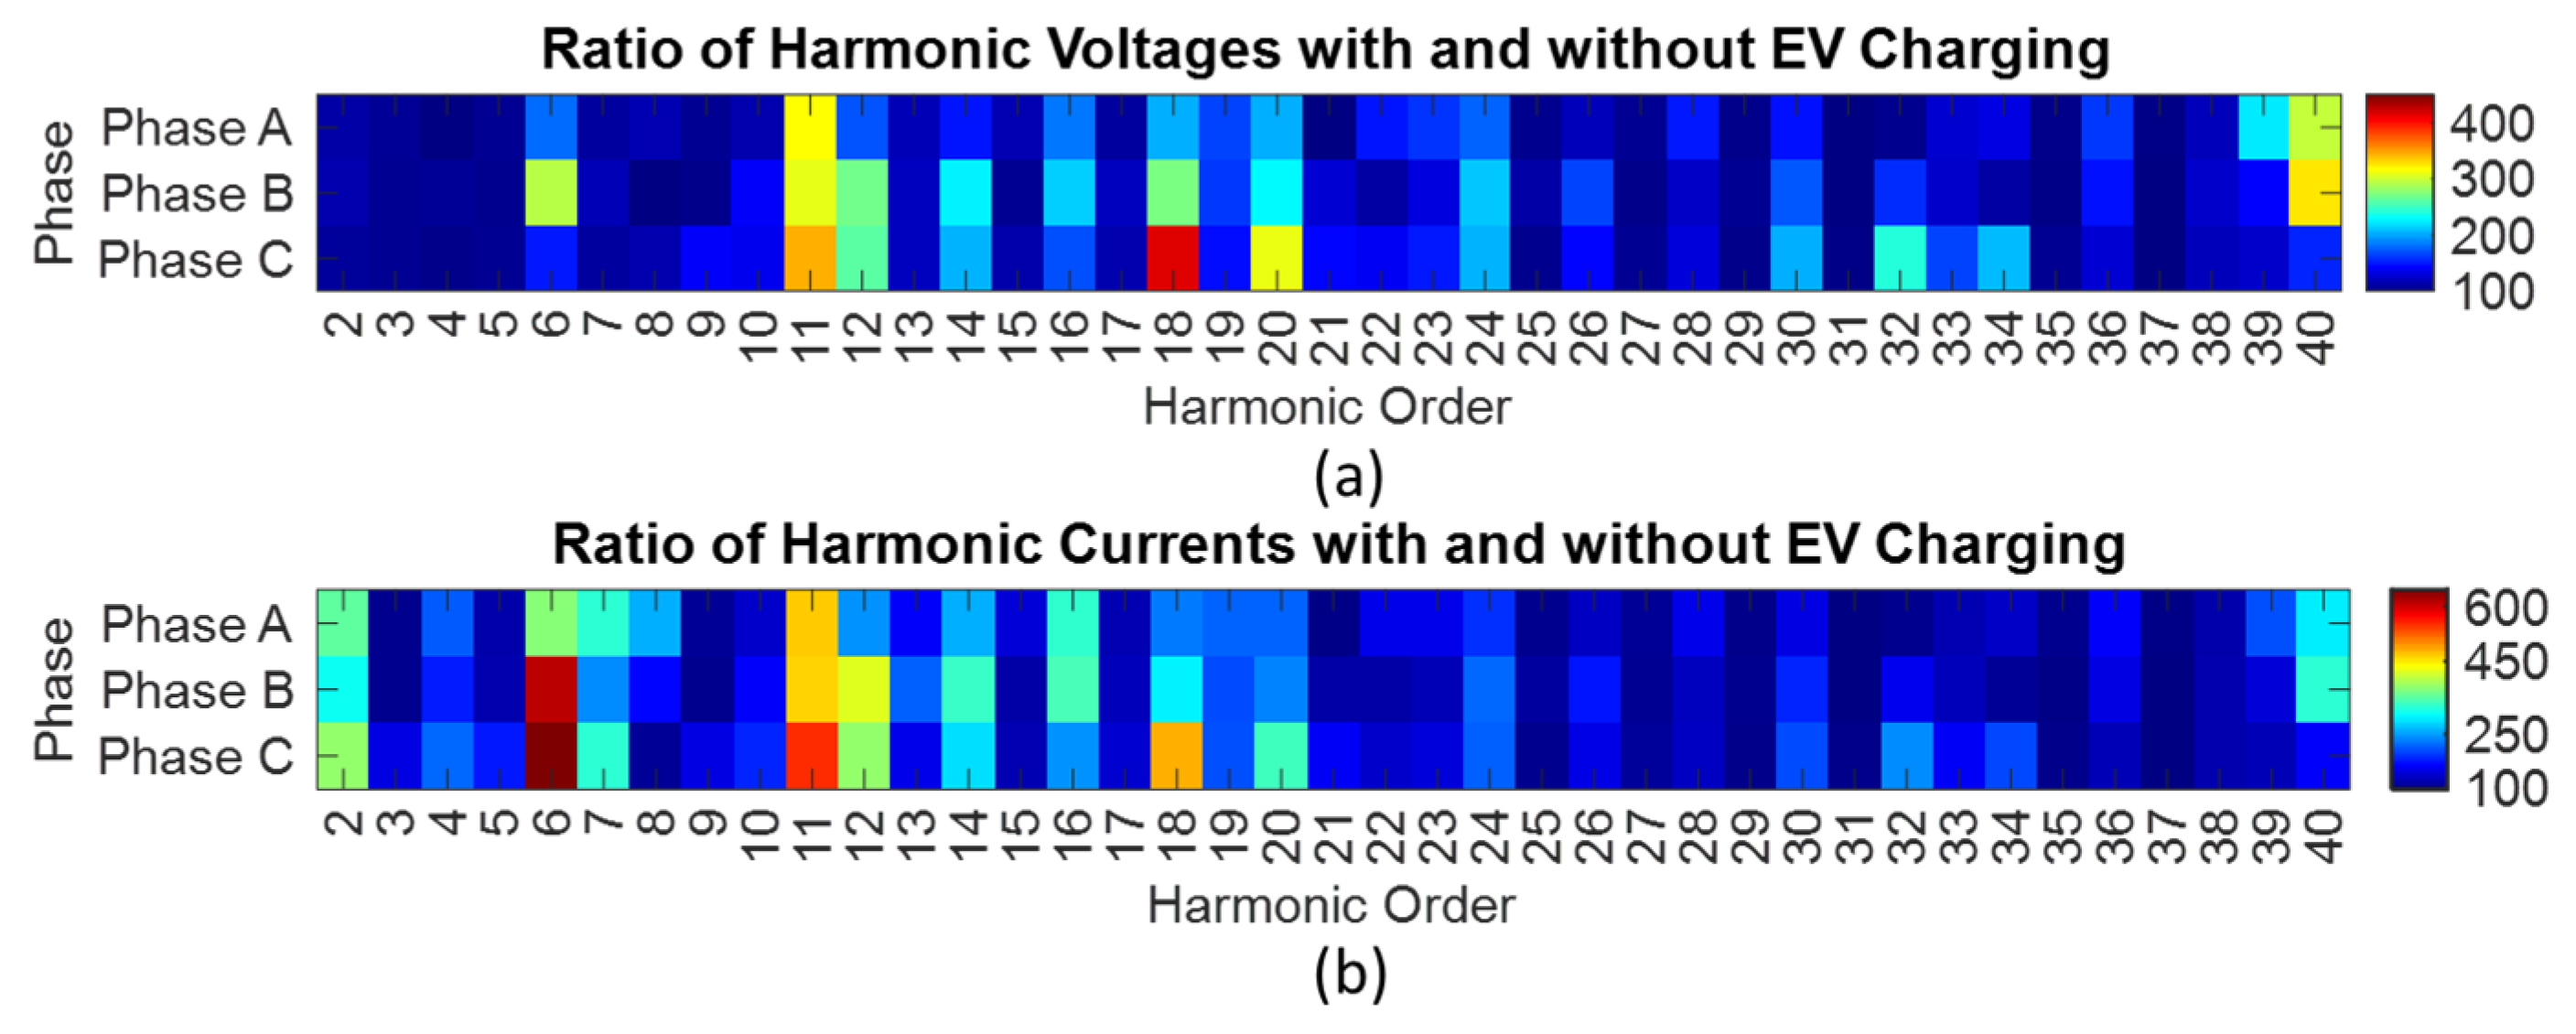
To assess the impact of EV chargers on the measured voltage and current distortion, the upstream measurements were binned into two categories: distortion levels (i) with EV chargers active, and (ii) without EV chargers. This classification was based on charger turn-on and turn-off times, obtained from the charger management and battery energy storage system (BESS) monitoring software provided by the respective manufacturers. To evaluate the impact of fast EV charging and BESS operation, the emission ratio described in Equation (2) is modified to compute the ratio of the 95th percentile of 10 min aggregated harmonic voltage values with and without the EV charger and BESS modules, for each phase. These results are presented in
Figure 14.
This paper focuses on harmonic voltages and currents; however, the same analysis was extended to interharmonic and supraharmonic emissions in line with the capabilities of the upstream power quality analyzer. The results in
Figure 13 indicate that the most significant impact of EV and BESS charging is observed in the even harmonics. Harmonics typically associated with the operation of six-pulse converters, namely, the 5th, 7th, 11th, 13th, and so on, also show elevated distortion levels. The most pronounced increase in harmonic current distortion occurs at the 7th and 11th harmonics. While the 11th harmonic voltage distortion also shows a significant increase, the 7th harmonic voltage distortion is less impacted, suggesting possible cancellation effects due to variations in the grid impedance and the phase angle of the 7th harmonic current.
The prevalence of the harmonic voltage and current emissions in each operating stage is quantified by computing the ratio of the vector sum to the arithmetic sum of the complex harmonic components over the observation window. The prevalence ratio varies across operating stages. Notably, the prevalence ratio of the 2nd harmonic remains consistently below 0.8 across all stages, which may explain the disparity in the impact of EV/BESS charging on harmonic current distortion versus voltage distortion. A further investigation into the changes in harmonic phase angles caused by variations in the active power levels of the downstream charger and BESS in each operating stage is proposed as a topic for future research. For the present harmonic hosting analysis, if ‘N’ combined BESS fast charger modules are operated simultaneously, the phase angle of each harmonic current at the PCC (comprising contributions from BESS charging and miscellaneous connected loads) is assumed to be uniformly distributed between −π and +π. The expected total harmonic current is given by Equation (4).
The total harmonic voltage distortion at the PCC is modeled as the sum of the distortion present without EV charging and the additional distortion caused by the EV/BESS harmonic currents and the currents of the miscellaneous loads passing through the frequency-dependent network impedance (FDNI), as described in Equation (5). Under the limiting condition where the total voltage distortion equals the threshold specified by the 10 min IEC 61000-2-2, the maximum number of chargers that can be connected without violating harmonic limits is computed using Equation (6).
For this calculation, the FDNI is assumed to be the average of the 95th percentile total impedance values for each operating mode, as presented in
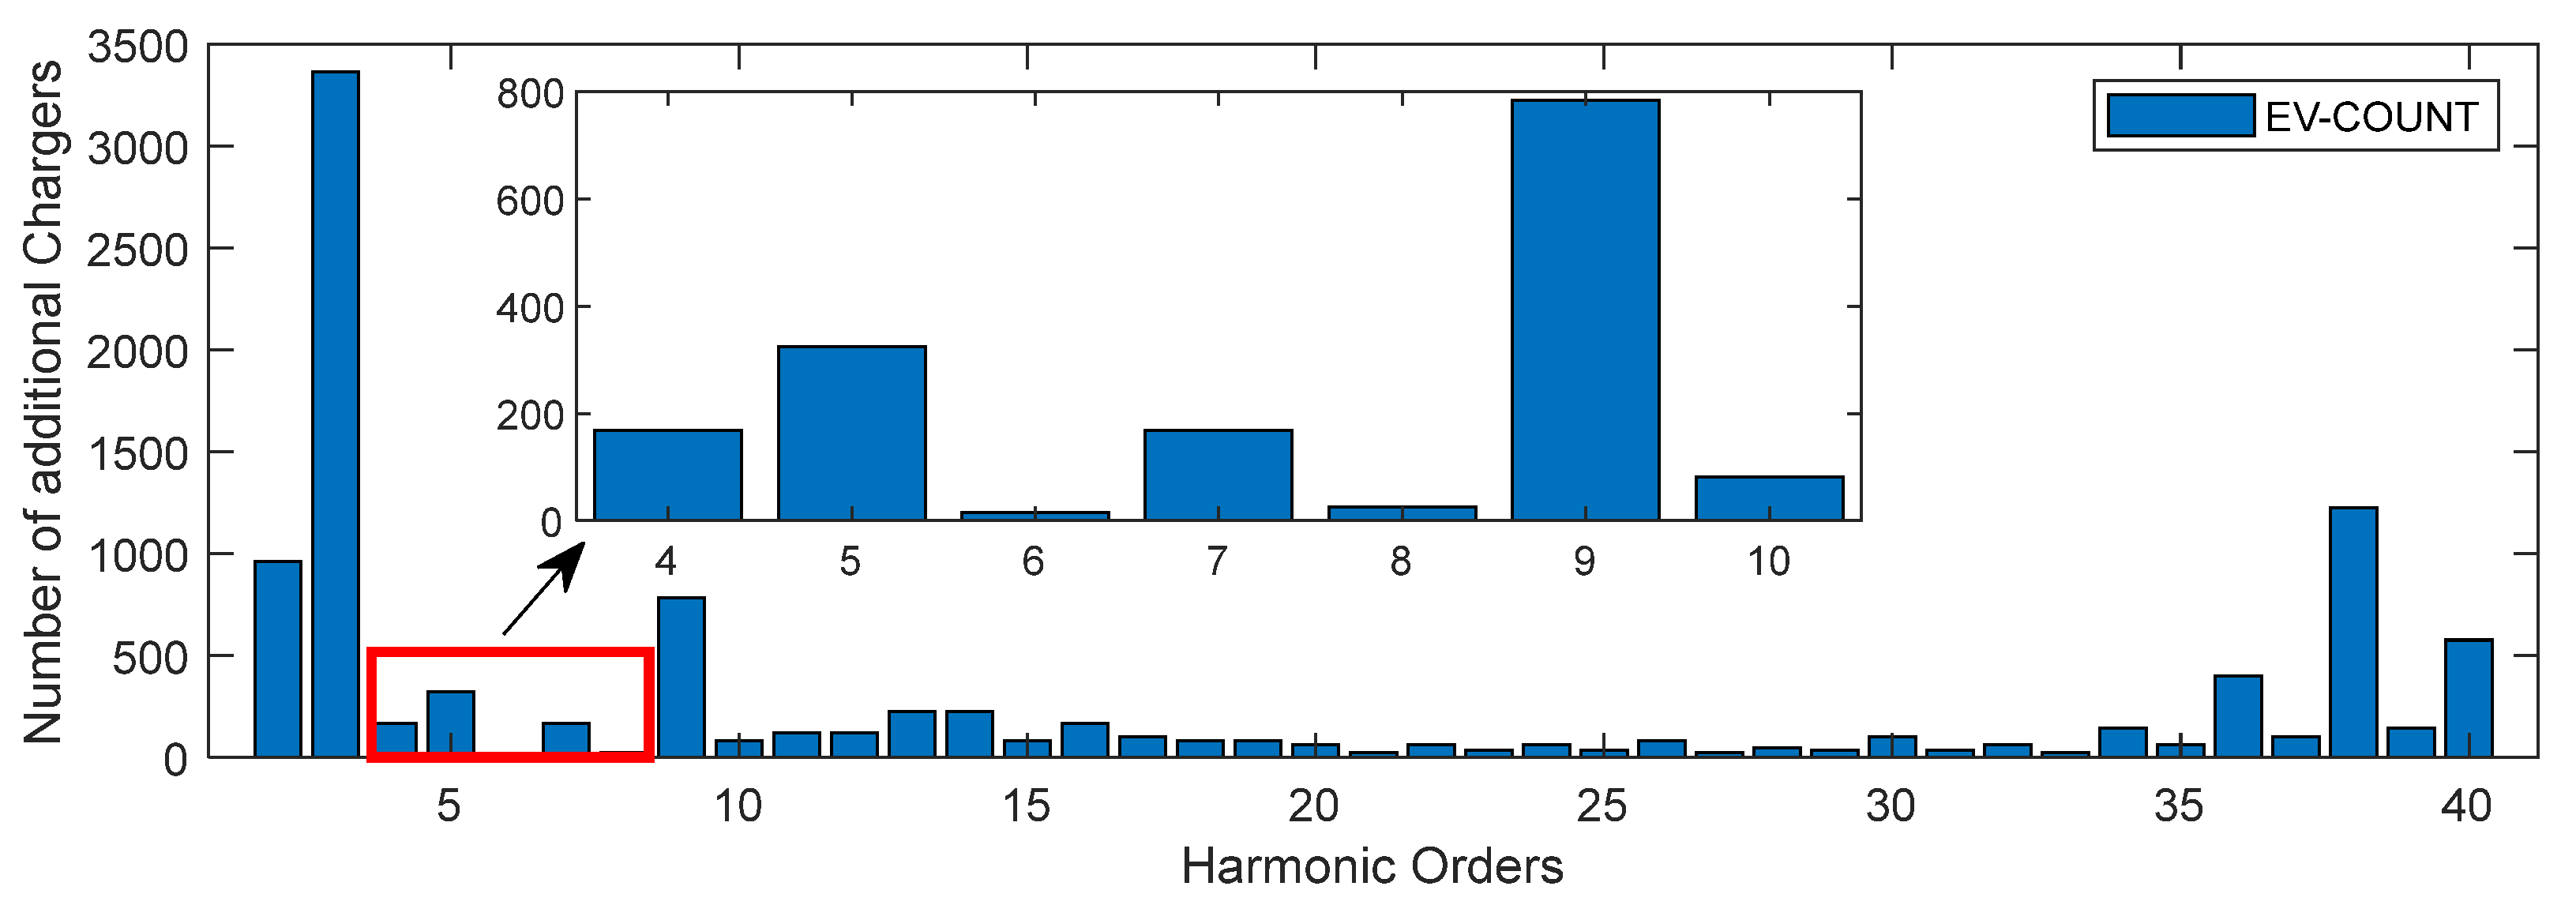
Figure 13. The resulting minimum number of combined BESS–charger modules that can be connected without exceeding the harmonic voltage limits is shown in
Figure 15. The harmonic hosting capacity is defined as the minimum number of allowable modules across all harmonic orders. For the given installation, the harmonic hosting capacity is identified as 16 at harmonic order 6, as shown in
Figure 15. Interestingly, the hosting capacity is determined by an even harmonic, which is typically less dominant in three-phase systems, highlighting a potential asymmetry or distortion source in the system. This count exceeds the number of modules allowed based on transformer loading. Assuming a transformer rating of 800 kVA and a per-module rating of 75 kVA, the maximum number of simultaneously operating BESS/charger combined modules based on transformer loading is 10. Thus, the harmonic hosting capacity exceeds the hosting capacity determined by transformer loading, assuming the simultaneous operation of all BESS/charger modules.
7. Discussion and Topics of Further Analysis
This paper analyzed the interharmonic, harmonic, and supraharmonic emissions generated by a battery energy storage system (BESS) charger module, categorized across five operating stages (OP1–OP5):
OP1 corresponds to a rectifier operation charging the BESS battery;
OP2 involves an inverter operation with variable output power from the BESS battery module while maintaining the grid input current constant;
OP3 represents a rectifier operation with variable input power while holding the grid input current constant;
OP4 is a rectifier operation with a fixed input grid current;
OP5 denotes a standby operation with negligible converter utilization.
Dynamic stages (OP2 and OP3) are characterized by large and frequent power variations due to the simultaneous operation of the BESS and downstream charger. In these stages, the DC-link voltage controller of the BESS AFE must respond to rapid ramp rates from the charger, while the faster current controller enforces grid current set-points. The mismatch in controller bandwidths introduces a half-cycle asymmetry (
Section 4.1), leading to elevated even-order harmonics up to the 40th order. Rapid modulation changes further generate interharmonics, while transformer zero-sequence paths promote secondary triplen harmonics.
The steady-state BESS-only operation (OP4) involves the BESS supplying the charger with minimal dynamic interaction. Here, the emissions primarily reflect the steady-state switching of the converter (primary emissions), with secondary emissions arising from the grid-induced voltage distortion. The harmonic levels are more stable, and the interharmonic content is lower than in OP2–OP3 due to the absence of fast load ramps.
The low-utilization stages (OP1 and OP5) are marked by minimal converter stress and an SoC-driven operation. These stages exhibit the lowest harmonic and interharmonic currents among the five modes, along with a reduced interaction between supraharmonic components from the downstream charger and those generated by the BESS.
Across all operating stages, the emission characteristics are governed by the interplay of control-loop dynamics (voltage and current controllers), transient load variations, and transformer behavior. Stages involving rapid power changes (OP2 and OP3) produce the most pronounced spectral distortions, while steady-state operation (OP1, OP4, and OP5) yields more predictable and lower emission levels.
This classification highlights the influence of BESS control strategies and operating modes on spectral behavior. Future work should refine the analysis by explicitly incorporating active power levels, state-of-charge (SoC) effects, and correlation-based methods to separate primary BESS emissions from secondary grid- and charger-induced distortions. The observed variability in the charging current demand, unbalanced phase loading, and asymmetrical injection across stages are further hypothesized to contribute to transformer saturation effects and warrant deeper investigation.
This study focuses on the use of the BESS in peak shaving mode to facilitate a comparative assessment of emission profiles under grid-power-limited conditions. It is acknowledged that BESS systems can support a broader range of grid services, including frequency regulation, voltage support, and harmonic compensation. These services, though outside the scope of this paper, merit further investigation in future work, particularly in the context of emission management and power quality enhancement.
The comparative analysis between emissions from the BESS module and the adjacent fast charger indicates that, while the BESS may contribute to reducing transformer loading, it could simultaneously introduce greater waveform distortion. Interestingly, in this case study, the emissions from the BESS module were found to be higher than those of a fast charger delivering comparable active power. However, broader comparison studies involving BESS systems from multiple manufacturers are necessary in order to generalize this observation.
The impact of EV charging on upstream voltage and current distortion at the point of common coupling (PCC) was also assessed. The results indicated that the most significant impact was observed in the even harmonics, although elevated levels of characteristic odd harmonics (e.g., 5th, 7th, and 11th) were also present. Among these, the 7th and 11th harmonic currents were particularly pronounced, while only the 11th harmonic voltage distortion showed significant elevation. The limited impact on the 7th harmonic voltage suggests the possibility of phase angle cancellation effects or changes in grid impedance. The prevalence of each harmonic emission was assessed using the ratio of the vector sum to the arithmetic sum of the complex harmonic components. This prevalence ratio varied by operating stage and harmonic order. For example, the second harmonic showed a consistently low prevalence ratio (below 0.8), which may explain the discrepancy in the observed distortion between the current and voltage. Future work will also explore changes in the harmonic phase angles with varying active power levels from the charger and BESS.
In the current analysis of the harmonic hosting capacity, it is assumed that, if
N combined BESS–fast charger modules operate simultaneously, the phase angles of their harmonic current components are uniformly distributed between −
π and +
π. The corresponding harmonic hosting capacity, defined as the minimum number of allowable charger modules across harmonic orders, is presented in
Figure 15. Notably, the sixth harmonic was the limiting factor, with a hosting capacity of sixteen due to the minimal headroom between the existing distortion and the allowable limit. The emission analysis covers 83 charging sessions spanning approximately 72.5 h, with a weekly occupancy ratio of around 42%. As EV charger deployments accelerate, this occupancy ratio is likely to increase. It would be of interest to extend the hosting capacity assessment to scenarios with a higher occupancy, which may place greater stress on grid harmonic limits.
Regarding the supraharmonic emission, the study observed intermodulation components and variable voltage distortion, which are linked to the load impedance and switching behavior of power converters. As shown in
Figure 16, the 11 kHz distortion component decreases upon EV charger activation, likely due to a reduction in effective load impedance and the localization of supraharmonic currents. However, converter switching may also introduce resonant behavior, leading to an elevated voltage distortion at other frequencies. Evidence of such resonances was observed in the measurements and may explain the presence of components outside the expected intermodulation frequency range. Further research is needed to better understand the influence of fast chargers and BESS modules on the FDNI and associated resonant conditions.
Finally, it is important to consider the measurement context. The data was collected in northern Sweden, a region with elevated geomagnetic activity. Geomagnetically induced currents (GICs) are known to generate even harmonics, and their potential influence on the measured emissions should not be overlooked. Future studies on GIC-related harmonics should carefully distinguish between naturally occurring even harmonics and those arising from EV-charging systems.
8. Conclusions
This paper presented a comprehensive measurement-based assessment of interharmonic, harmonic, and supraharmonic voltage and current emissions from a battery energy storage system (BESS) charger module, categorized across various operating stages. The results reveal that both the BESS operating stage and its interaction with downstream fast chargers have a significant influence on the emission characteristics.
Using a combination of the measured voltage and current spectra, emission ratios, prevalence analysis, and frequency-dependent network impedance (FDNI) modeling, the study quantified the harmonic hosting capacity of the installation. The even sixth harmonic emerged as the most restrictive factor, with a calculated minimum hosting capacity of 16 modules based on the measured 95th percentile impedance values, even under strong grid conditions (10 MVA short-circuit power). This is notable, as even harmonics are typically not dominant in balanced three-phase systems, highlighting the influence of asymmetrical loading, converter operation, and potential core saturation effects in transformers employed for BESS module isolation. The analysis of phase-angle diversity and occupancy ratios (recorded at 42% during the measurement campaign) revealed that both parameters have a significant impact on overall emission levels. Under a higher occupancy or synchronized operation, the harmonic hosting capacity could be reduced further, an area warranting additional investigation. It is also noted that secondary emissions during BESS-assisted EV charging contribute significantly to higher levels of harmonic emissions, underscoring the importance of considering both primary converter emissions and network-induced interactions in future standards and mitigation strategies.
Supraharmonic emissions were found to exhibit strong coupling with load impedance and converter switching behavior. For example, specific supraharmonic components (e.g., 11 kHz) were suppressed during downstream EV charger activation, indicating complex interactions between the converters and changes in grid impedance. This supports the need for refined time-varying models that can capture these dynamics, especially in scenarios involving multiple interacting converters or resonance-prone network segments.
It is, therefore, recommended that existing standards and planning limits should consider even harmonics more explicitly, especially in modern LV grids with asymmetrical and nonlinear loads. Finally, this study highlights that the emission behavior observed across the five operating stages—particularly the elevated even-order, triplen, and interharmonic content during the high-power ramp stages (OP 2 and OP 3)—is not fully addressed by the current standard framework (IEC 61851-21-2, IEC 61000-3-12, and IEC 61000-2-2). The existing test prescriptions at fixed load points (e.g., 20% and 80% rated power) would not capture the highest emission conditions recorded here, nor do the present limits explicitly cover interharmonic or supraharmonic currents in high-power BESS-assisted charging. These real-world deviations underline the need to expand the standards to include stage-specific testing, limits for interharmonics and supraharmonics, and provisions for multi-converter interaction effects in modern charging infrastructures.
Further, grid planners should incorporate phase-angle diversity, occupancy effects, and measured impedance profiles into the harmonic hosting capacity calculations rather than relying on idealized models.
The authors recommend the continuous monitoring of supraharmonic behavior, particularly in installations with BESS and EV chargers, to detect and manage resonance or emission clustering. Where possible, spread-spectrum modulation or staggered switching strategies should be explored in converter design to reduce cumulative emission peaks.
Additional studies under full utilization scenarios, across different BESS technologies, and with active power modulation will help generalize these findings and support robust emission management in evolving distribution networks.
