1. Introduction
Providing sustainable and adequate transportation solutions is one of the most pressing challenges of today. To reduce pollution emissions and to increase the sustainability of the transportation system, the European Union encourages its member states to introduce zero-emission vehicles wherever possible, including public transport. The latest report by the European Environment Agency, “Sustainability of Europe’s mobility systems”, highlighted that the transport sector remains a major source of pollution. It also stresses the need to substantially invest in innovative solutions, which could cause a shift to more sustainable modes of transport.
Providing adequate solutions is challenging in all settings, but designing an appropriate transport system in a rural area remains a substantial challenge, especially when it comes to public transport. Rural areas are faced with a certain paradox—its citizens have the need for mobility equally as citizens in urban areas, but the demand in some rural areas is so low that public transport services are complicated to provide, especially financially. This leads to transport poverty in such areas, with a United Kingdom (UK) study showing that transport poverty is significantly more prevalent in rural areas, which also leads to an increase in household transport costs [
1]. Another study confirms that rural areas are at a significantly higher risk of transport poverty [
2].
To reduce the issue of transport poverty and poor public transport accessibility, an adequate public transport system needs to be developed. A Swedish study has shown that citizens in rural areas are eager to use such services but are usually unable to, due to the very common poor design of public transport services [
3]. Additionally, an adequately designed public transport system holds many benefits, such as stimulating rural development, stopping or decreasing the depopulation of rural areas, having a positive impact on rural tourism, and preventing social exclusion [
4].
Public transport solutions in rural areas range from regular bus or train services to demand-responsive transit (DRT) and ride-pooling. Various approaches are suitable for various areas, and an adequate analysis must be done to determine which type of service is most appropriate for a specific area.
A positive example of an adequate public transport system in a rural area can be found in the Weinland region in Switzerland. The system consists of bus and train services which operate at a frequency of one or two departures per hour. Despite the rural setting and potential car dependency in such areas, the public transport system has a mode share of 21.7% work trips. In comparison, an area with a similar population density in the UK has a public transport mode share of 8.1% of work trips. One of the reasons for the success of this system lies in the fact that services are frequent and adequately coordinated between modes [
5].
An example of a rural public transport system can be found in Lincolnshire in the UK. A DRT system operates in the rural parts of Lincolnshire, providing services in two ways. One way involves semi-flexible buses that operate between core centers and serve main stops, as well as other stops on request. The other type of service is an area-based service which operates fully flexibly within the service area and is also integrated with “Interconnect”, a frequent conventional interurban bus service that connects the area to the rest of the county and also outside of the county [
6]. Other experiments and simulations show that a system that combines DRT services, which serve as feeder services to conventional buses and trains, can prove to be successful [
7].
However, these services need to be considered not only from the operational aspect but also from the financial aspect. Although providing plenty of services to all possible destinations would practically eliminate transport poverty, financial constraints exist in terms of the unprofitable nature of such services.
A generalized cost-benefit analysis conducted in the United States has shown that the benefits of introducing public transport in rural areas outweigh the costs. The benefits include increased mobility and safety, as well as decreased air pollution. The total benefits per trip include USD 14.65, while the total expenditures per trip equal USD 12.65 [
8].
Other studies regarding cost-benefit analysis of rural areas show that investing in rural public transport increases mobility, which usually leads to increased economic activity, leading to a positive cost/benefit ratio. All studies described in this paragraph were conducted in the United States. A study conducted by Skolnik and Schreiner has seen a benefit/cost ratio of 9.7 to 1 [
9], while two studies done by Southworth have shown that this ratio is greater than 1.0, but that it varies significantly between different rural systems [
8,
10]. Peng and Nelson have shown that the economic impact of introducing public transport in rural areas is large and positive and that the fiscal revenue impact is greater than 1.0 [
11]. Burkhardt has shown that returns of investments in public transport range from 1.67 to 1 to 4.22 to 1 [
12], while Godavarthy et al. have calculated a 1.93 benefit–cost ratio for an optimally designed rural public transport system [
13]. A study done by HDR Decision Economics has shown that every dollar spent on rural public transport in South Dakota has generated USD 1.9 in economic activity [
14]. Studies done by HLB Decision Economics have found a return on investment of 6 to 1, while Cronin et al. have shown that every dollar invested in transportation-disadvantaged programs in Florida generates benefits of USD 8.35 [
15,
16,
17]. Another United States study has shown that the average benefit/cost ratio of public transport services on the national level for rural areas is 1.12 [
18]. Similar benefit–cost ratios were observed for public transport projects in general, with values of 1.2 or higher being observed in multiple studies not related specifically to rural public transport [
19,
20,
21].
When it comes to the type of fuel used, various practices exist. A report done by the British Confederation of Passenger Transport highlights the importance of introducing zero-emission vehicles to public transport. However, it also stresses the potential challenges faced by operators, which also include the high initial costs, as well as infrastructural challenges such as the inadequate charging infrastructure [
22].
One European study highlights multiple examples of electric bus services throughout Europe. It shows that electric bus services are suitable for rural areas with different terrain types. However, topography and climate conditions severely affect the range of vehicles. This is present both in extremely low- and high-temperature conditions. Additionally, services that run through hilly terrain suffer from higher battery consumption [
23].
Even though electric buses cause less air and noise pollution, the initial investment in such vehicles makes it questionable if such a purchase is adequate. Additionally, despite the lack of direct emissions, the number of indirect emissions depends on the source of electricity, while the disposal of batteries also poses a significant issue. One study has examined the most suitable options for public transport services in small- and medium-sized communities and has confirmed the previous statement. The study concludes that electric buses are an environmentally friendly solution that has several advantages, including low noise and zero direct emissions. However, these benefits need to be weighed against the fact that such buses require a significantly higher initial investment compared to diesel, compressed natural gas (CNG), and hybrid buses. Additionally, the indirect emissions of electric buses depend on energy sources, which is another important consideration when evaluating the potential benefits of such vehicles [
24].
Another study has shown that the long-term cost benefits of battery-electric buses are significant when compared to diesel and CNG buses, even under varying economic conditions. The study claims that battery-electric buses have lower operating and maintenance costs and that this offsets the higher initial investment in such vehicles [
25]. However, it must be noted that this is not valid for all operating environments. In some environments, the low number of passengers and kilometers cannot justify the higher initial investment.
As previously mentioned, providing adequate public transport in rural areas is of great importance. Croatian cities and villages face transport poverty for a variety of reasons, causing a lack of mobility in some areas. One such area with no public transport options available is the City of Jastrebarsko. This city is located around 30 km from the capital, Zagreb, and has a population of around five thousand citizens, with another ten thousand residing throughout the rest of the municipality. The population density in the city itself is 270 inhabitants per km2, while in the wider area, the population density is 64 inhabitants per km2. Jastrebarsko heavily relies on Zagreb, with many daily commuters to the capital. The city is connected to Zagreb via one highway and multiple state, county, and local roads, as well as by train and bus services. Jastrebarsko lies on the Zagreb–Karlovac railway, which is an important railway section in Croatia and is planned to be reconstructed for higher-speed services of up to 160 km/h. Public transport services connecting these two cities run frequently, with more than 15 train departures and more than 30 bus departures daily. Travel time is around 40 min.
2. Materials and Methods
The aim of the research is to understand which types of buses are most suitable for the service in Jastrebarsko and the surrounding rural areas. Detailed data on the planned public transport system, such as number of lines, itineraries, timetables, and potential number of users, are based on an existing project for introducing public transport in the City of Jastrebarsko. After analyzing these existing data, it was possible to conduct a cost-benefit analysis and compare diesel and electric bus fleets. The following section presents an overview of the most important transport and technical characteristics of the planned public transport system, based on data derived from the expert project for introducing public transport in the area of Jastrebarsko.
Within the project, an analysis of the existing supply was conducted, as well as a poll of the population of Jastrebarsko. The answers were then used to create an estimate of public transport demand. The results are described in the following paragraphs. Despite this not being the key element of this research, this information is given to provide a clearer picture of the system itself.
Around 1.900 passengers would use the system in peak hours. The spatial distribution of these passengers was used to help form public transport lines. Outside the peak hours, the system would be used by around 1.300 passengers.
The design of the system was based on a detailed current state and demand analysis, which was the foundation for a detailed analysis of potential routes according to existing demand. The final routes of the system were designed to create optimal connections with surrounding settlements and within Jastrebarsko itself.
Table 1 shows all relevant operating data regarding the system. The toponyms in brackets are the termini of each line.
The suggested system has one intermodal station: Jastrebarsko Railway Station. This location connects the new system with the local and national railway system, as well as with regional and intercity buses. The new bus system features six lines connecting Jastrebarsko with nearby settlements. Minibuses operate on five out of six lines, while on one line, a regular bus is used. Two more lines exist, one that connects Jastrebarsko Railway Station with the industrial zone, and a circular line operating within Jastrebarsko. All lines terminate at Jastrebarsko Railway Station. Most of the lines are line-based, but with deviations. The Industrial Zone Line integrates Jastrebarsko with the industrial zone, while the on-demand lines are based on sectors and areas where they operate.
The number of departures on working days varies between 11 for lines connecting Jastrebarsko to nearby settlements to 31 departures for the circular line. One vehicle per line is sufficient for all operations. On-demand services are planned in some parts of Jastrebarsko.
Within this paper, two scenarios were developed for comparison of different types of buses that could be used for the City of Jastrebarsko. One scenario involves diesel buses compliant with the Euro VI D emissions standard (Scenario 1), and the other one involves electric buses (Scenario 2). The electric buses involved are minibuses Karsan Jest Electric with an 88 kWh battery and a range of 190 km. Additionally, 8-m buses are involved with a 235 kWh battery and a range of 220 km.
The evaluation of the scenarios is based on the results of a cost-benefit analysis (CBA) in accordance with the methodology of the European Commission. In this process, both a financial and an economic cost-benefit analysis were carried out.
The following paragraphs describe the methodology used for the financial cost-benefit analysis.
A financial cost-benefit analysis was conducted. The analysis was conducted using the Discounted Cash Flow (DCF) method, which implies the following:
Only actual cash inflows and outflows are considered;
An appropriate financial discount rate (FDR) is used to calculate the present value of future cash flows;
Cash flow forecasting must cover a planning period appropriate to the economic lifespan of the project;
Since the project is expected to generate certain revenues, the analysis includes calculations of the net present value of the investment of the national capital (Financial Net Present Value on Capital—FNPV(C) and Financial Net Present Value on Investment—FNPV(I)), in order to determine financial indicators regardless of the source of financing.
As part of the financial cost-benefit analysis, the following indicators were calculated:
Financial Net Present Value—FNPV;
Financial Internal Rate of Return—FRR;
Benefit–Cost Ratio—B/C Ratio.
The Financial Net Present Value (FNPV) represents the difference between the present value of a project’s revenues and its costs, indicating whether the project is financially profitable. A positive FNPV suggests that returns exceed costs. The Financial Internal Rate of Return (FRR) is the discount rate at which the FNPV equals zero and reflects the project’s expected return. If this rate is higher than the cost of capital, the investment is considered financially attractive. Meanwhile, the Benefit–Cost Ratio (B/C Ratio) compares the present value of benefits to costs. A ratio greater than 1 means the project’s benefits outweigh its costs.
The reference period used in the research is 25 years, according to recommendations provided by the European Union [
26]. The discount rate used was 4.0%. It was presumed that the system would be entirely operated by an external operator and not by the City of Jastrebarsko.
When it comes to costs considered in the research, the following costs are taken into account:
Investment costs—buses, bus stops, termini, dispatch center, chargers for Scenario 2;
Operating costs—technical inspection, insurance, wages, fuel/electricity consumption, administrative costs, ticket issuance costs;
Maintenance costs—regular and unforeseen maintenance;
Unforeseen costs.
Operating revenue refers to revenue from selling tickets. Most users are expected to have monthly tickets, with a cost of EUR 20. A single ticket is planned to cost EUR 0.93. The share of passengers with monthly tickets is expected to be around 90%.
The following paragraphs describe the methodology used for the economic analysis of costs and benefits.
An economic analysis of costs and benefits was conducted to evaluate the contribution of the project to the economy and to the improvement of the quality of life of the city and its surrounding areas. Social benefits must be quantified to adequately present the project’s contribution to the improved quality of life. Such public investments do not have financial profitability as a goal, but rather social benefits, as is the case with many transportation-related projects.
Since the economic return on investment is based on economic prices, the following adjustments were made to determine the indicators of the project’s economic performance:
Fiscal correction—elimination of indirect taxes;
Adjustment of the market to economic prices—calculation of Standard Conversion Factors (SCF);
Monetization of indirect costs and benefits.
As part of the economic cost-benefit analysis, the following indicators were calculated:
The Economic Net Present Value (ENPV) measures the overall value a project brings to society by comparing the present value of all economic benefits to the present value of economic costs, including externalities. A positive ENPV indicates that the project adds value from a broader economic perspective. The Economic Internal Rate of Return (ERR) is the discount rate at which the ENPV becomes zero and reflects the project’s economic efficiency. If the ERR is higher than the social discount rate, the project is considered economically justified. The Benefit–Cost Ratio (B/C Ratio) in this context is the ratio of the present value of economic benefits to economic costs, with a value above 1 signifying that the project’s benefits to society outweigh its costs.
The discount rate, which was used for the economic analysis, was 5.0%. Conversion factors are used to transform market prices into accounting units, thereby taking into account not only financial costs and benefits but also social costs and benefits. To ensure more objective results, a conversion factor of 1:1 was used for costs, meaning that the same costs as in the financial analysis were applied.
The social benefits of the system are as follows:
Reduced air pollution costs;
Reduced climate change costs;
Reduced noise emission costs;
Reduced well-to-tank (WTT) emission costs;
Reduced traffic accident costs;
Reduced vehicle operating costs;
Economic development (newly employed people);
Increased travel time costs.
The following paragraphs explain the methodology used to calculate these costs. Since a transport model for the area does not exist, a European Commission rulebook was used for the purposes of air pollution and climate change analysis, as well as for the monetization of environmental losses [
27].
The average annual amount of air pollutant emissions and noise was calculated using the defined bus routes and the number of daily departures. Using this method, the number of annual vehicle-kilometers was calculated. After this calculation, the number of kilometers that the potential public transport users would need to cross for their trips if they were using a passenger car was calculated. It was presumed that the average car occupancy is 1.3 and that users of monthly tickets would make two trips per day on working days throughout the year, with an average of 25 vacation days subtracted, resulting in a total of 225 working days per year. For users with single tickets, it was assumed that users of the fixed-route service would make two trips per week throughout the year, while users of the on-demand service would make four trips per week throughout the year.
Air pollution was calculated using an estimate of the number of tons saved according to the methodology of the mentioned rulebook, which is based on the NEEDS European research project. For each type of pollutant, the number of saved tons was calculated, and the amount of EUR saved per ton was calculated. The methodology incorporates PM10, PM2.5, NOx, NH3, SO2, CO and CO2 emissions. When it comes to noise pollution, it was calculated as savings per vehicle-kilometer. The amount of savings depends on the number of citizens exposed to noise higher than 50 dB. The well-to-tank (WTT) emission cost was calculated by subtracting the annual WTT emission cost of public transport from that of private cars, and the emissions were calculated on the basis of the rulebook and the number of passenger-kilometers of cars and public transport. The WTT values for cars and public transport vehicles were provided in the mentioned rulebook.
When it comes to road safety, global research data shows that bus passengers are at a ten times lower risk of road fatalities compared to passengers in cars [
28]. The same European Commission rulebook was used to calculate the exact amount of social costs associated with road safety.
The reduced operating costs refer to the expenses that potential public transport users would incur if they were to make the same trips by car instead of using public transport, as previously mentioned. It is also important to note that the portion of users who would reduce the number of private vehicles per household was not included in the social cost, which would further increase the social benefit due to reduced use of private vehicles.
Implementing public transport in Jastrebarsko would certainly lead to increased economic activity, which can lead to new workplaces being opened, while also making education and health facilities more accessible. The number of social activities can also increase due to enhanced accessibility. Since there is currently no adequate data available to calculate such indicators, the only data used are the newly created jobs related to the operation of the bus services.
When it comes to increased travel time, travel data was used to compare the average travel speed of passenger cars and public transport in the area. This data was used to calculate the number of passenger-hours lost due to the lower speed of buses. These passenger-hours were multiplied by the average net hourly wage in Croatia for the year in which the research was conducted. The result represents the additional travel time costs incurred by passengers when using public transport instead of private cars.
Other social benefits also exist, but it was not possible to quantify them due to a lack of data or due to methodological constraints. Such benefits include increased access to healthcare, increased employment due to increased accessibility to workplaces, increased social activities, decreased road maintenance due to the reduction of vehicle-kilometers as well as other benefits, such as slowing down depopulation, decreased pollution due to less circular drivers done while looking for a parking place, better land use achieved through decentralization, lower relocation costs, reduced environmental and groundwater pollution costs, improved quality of life for the elderly resulting from the reduced emigration of the younger population from rural areas, and fewer closures of family-run businesses in rural areas due to reduced depopulation.
The following paragraphs describe the methodology used for risk analysis.
A risk analysis was also conducted. The analysis includes a sensitivity analysis, qualitative risk analysis, and probabilistic risk analysis. Potential risks and critical risks were determined for the project. In addition to risk identification, the probability of each risk occurring and its severity were determined, based on which risk response measures and monitoring methods were defined.
The sensitivity analysis identified the risks that have a negative impact on the financial and economic viability of the public transport project in the area of the City of Jastrebarsko, as well as the magnitude of their impact.
As previously mentioned, the potential number of passengers who would use the system was estimated using a very conservative approach. Although a higher number of passengers than predicted is possible, there is also a significant risk that the predicted number could fall short of expectations. Therefore, a qualitative risk analysis of the project was conducted in accordance with European Union guidelines.
To obtain more objective results, all input variables used in the economic analysis were included as critical risks for the purposes of the probabilistic risk analysis. The probabilistic risk analysis was carried out solely for the economic cost-benefit analysis. To model the probability of the project’s justification, a dynamic simulation of changes in all critical risks was performed using their respective probability distributions. This simulation included 20,000 iterations across ten simulations with random repetition, based on a random number generator following the Monte Carlo method.
3. Results
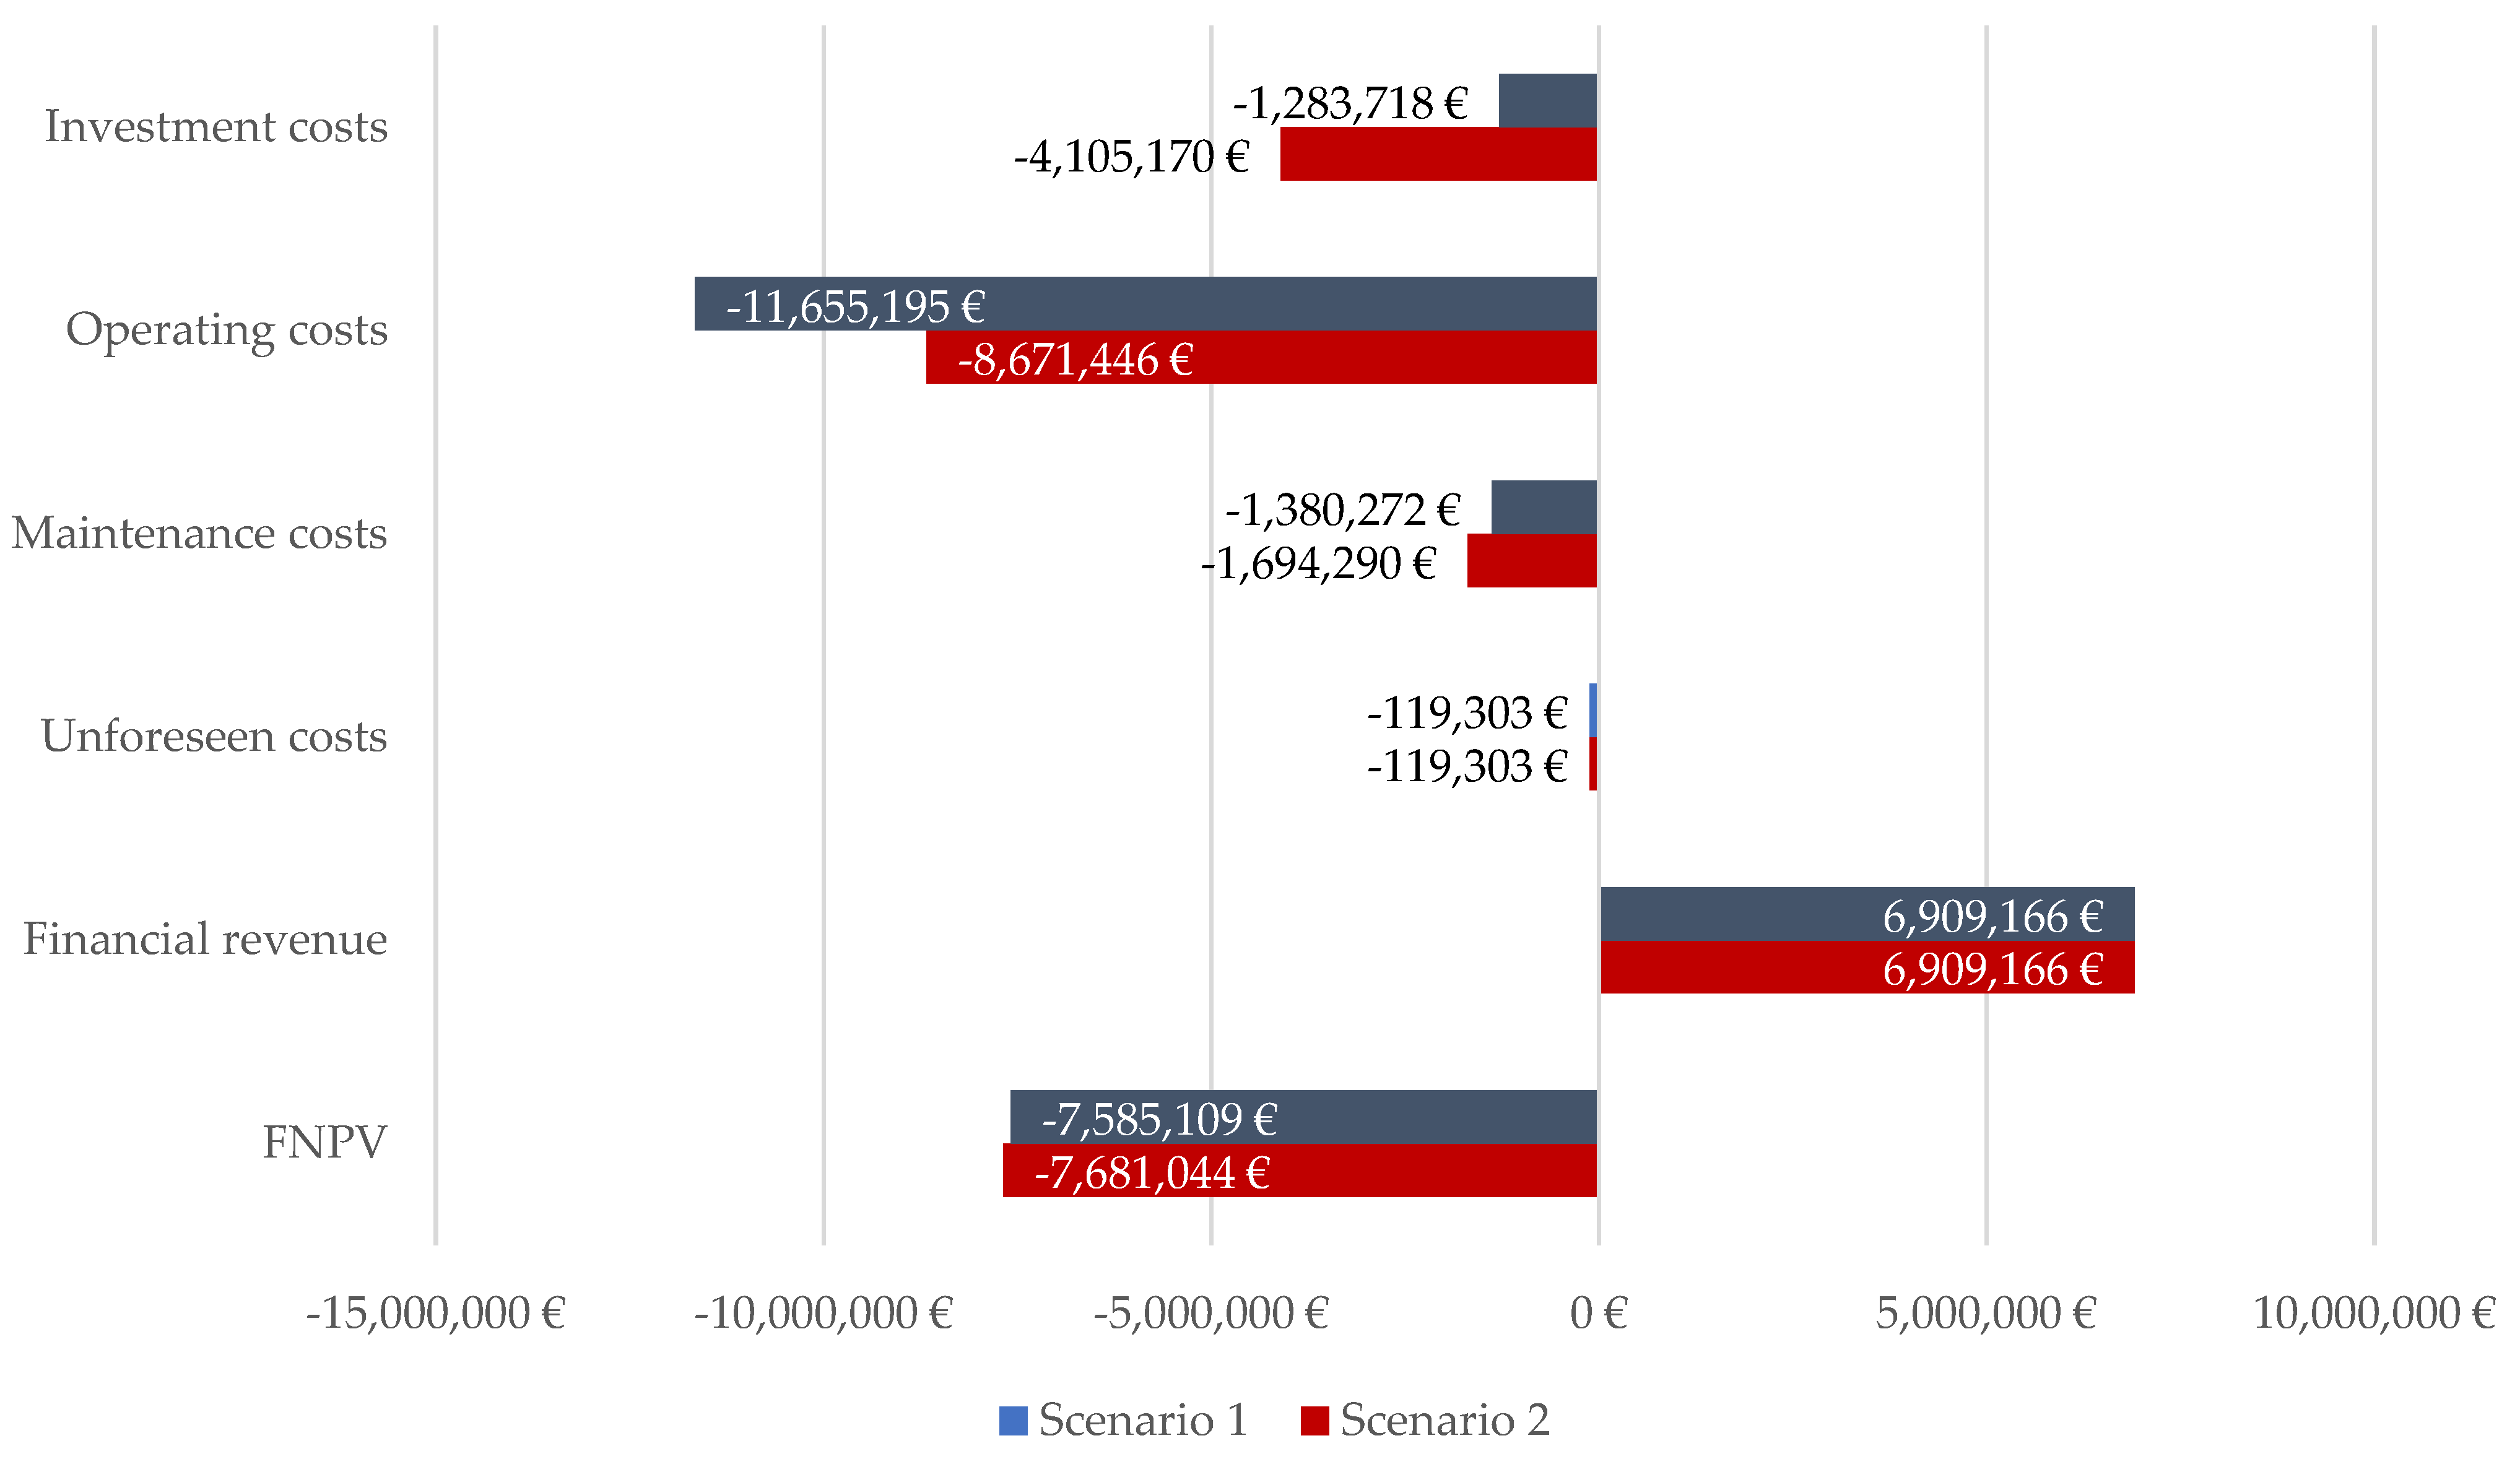
3.1. Results of the Financial Cost-Benefit Analysis
The results of the financial cost-benefit analysis show similar results for both scenarios, which are presented in
Table 2. Scenario 1 involves diesel buses, while Scenario 2 involves electric buses.
Figure 1 is also included for additional clarity and qualitative interpretation.
The net present value of investment costs of diesel buses is significantly lower than that of electric buses. When it comes to the price of vehicles, the minibus cost was around EUR 94 thousand for Scenario 1 and EUR 260 thousand for Scenario 2. For buses, the cost in Scenario 1 was EUR 250 thousand, and in Scenario 2, it was around EUR 325 thousand. When it comes to van-type vehicles, the cost in Scenario 1 was EUR 33 thousand, and in Scenario 2, it was around EUR 51 thousand.
The net present value of the initial investment in Scenario 2 is 3.2 times higher than in Scenario 1. The biggest share of the costs is associated with the procurement of buses in both scenarios. However, the substantially higher costs of electric buses and their required infrastructure increase the price by a significant margin. Due to the complex topography of the area, battery consumption is elevated. As not all vehicles can be charged at the garage, the deployment of charging infrastructure at multiple termini is also necessary. Consequently, charging infrastructure is needed at multiple termini as well as at the garage. The second-highest cost is related to the construction of bus stops, while the construction of a terminal also has a relatively significant share of the total costs. The procurement of electric buses would cost EUR 2.3 million, while diesel buses would cost around EUR 1 million. When it comes to battery lifetime, it was estimated that, according to the models of the vehicles and the topographic and atmospheric conditions in Jastrebarsko, the lifespan of the batteries is 7 years. Additionally, the high cost of the batteries implies that it might be more feasible to also replace the buses themselves when the batteries are no longer usable.
On the other hand, when it comes to the net present value of operating costs, it is 34% higher in Scenario 1. This is mostly due to the high fuel consumption of diesel buses—diesel buses have a consumption cost of EUR 237 thousand, while electric buses have a consumption cost of EUR 45 thousand.
Operating costs consist of technical inspections (regular and unforeseen), which have a cost of EUR 1764 for Scenario 1 and EUR 2520 for Scenario 2. They also consist of mandatory vehicle insurance, which is more expensive for Scenario 2, costing EUR 8318, while for Scenario 1, it costs EUR 6849. Comprehensive insurance costs, which are also included in operating costs, equal EUR 9146 for Scenario 1 and EUR 15,915 for Scenario 2. Gross salary costs for drivers are also a part of the operating costs and are the same for both scenarios at EUR 336 thousand. Additional support staff costs include EUR 80 thousand as part of operating costs. Also, average specific fuel consumption is included in the operating costs, being EUR 237 thousand in Scenario 1 and EUR 45 thousand in Scenario 2. Other operating costs are the same for both scenarios: administrative costs (EUR 3511), cost of a dispatcher per vehicle (EUR 32,043), and ticket issuance costs (EUR 10,280). The operating costs are given as annual values.
Table 3 shows the average consumption costs for both scenarios for each line, as well as the number of kilometers driven annually on these lines. The reference value used for estimating consumption costs was EUR 0.07 per kilometer for minibuses and EUR 0.12 per kilometer for regular buses. The price of electricity in Croatia at the time of analysis was around EUR 0.13 per kW, while the consumption levels of minibuses and buses were EUR 0.55 and 0.88 kW per kilometer, respectively. The consumption of diesel vans was set at 15 L per 100 km, while for minibuses, the consumption was set at 30 L per 100 km. The consumption of buses was set at 40 L per 100 km. This is a pessimistic estimate that is also based on complex topographical conditions. The price of diesel at the time was EUR 1.33 per liter.
It can be observed that the consumption costs of diesel buses are substantially higher. Additionally, it is worth noting that driver costs are the component with the highest share among operating costs.
The net present value of maintenance costs is 23% higher for electric buses, and it consists of regular and unforeseen maintenance. As part of unforeseen maintenance, battery system replacements are planned for all vehicles in Scenario 2: in the seventh year for the first fleet and the nineteenth year for the second fleet. This intervention increases maintenance costs over the 25-year analysis period. When it comes to the net present value of other unforeseen costs, it is identical for both scenarios.
When it comes to the net present value of the operating revenue, the total expected revenue in the analyzed period is EUR 6,109,166. Most of the revenue is earned from the lines connecting Jastrebarsko to surrounding settlements, while the city line also generates significant revenue. Most of the revenue is generated from the monthly tickets. Around 96% of users of suburban lines are monthly ticket holders, while this share on the city line is around 95%. The on-demand service has no monthly ticket holders, since such an option does not exist.
The net present value of the total costs of the system is 0.7% higher for electric buses. The net present value of the financial revenue is identical in both scenarios, while the FNPV net cash flow is lower by 1.3% in the scenario with electric buses. Due to all negative net cash flow values, the Financial Internal Rate of Return on Capital FRR(C) was not calculated for both scenarios due to negative cash flows. The B/C ratio for Scenario 1 is 0.48, while for Scenario 2, it equals 0.47.
The constant presence of negative net cash flow in both scenarios, and consequently negative cumulative net cash flow, also indicates that the project is neither financially viable nor financially sustainable—that is, the revenues are not sufficient to cover operating and maintenance costs. Accordingly, it can be concluded that it is not necessary to calculate the return on national capital, FNPV (K), and FRR (K) for both scenarios. Furthermore, to ensure the operating functionality of the project, the Project Implementer—in this case, the City of Jastrebarsko—will need to ensure the project’s sustainability by covering the funding shortfall.
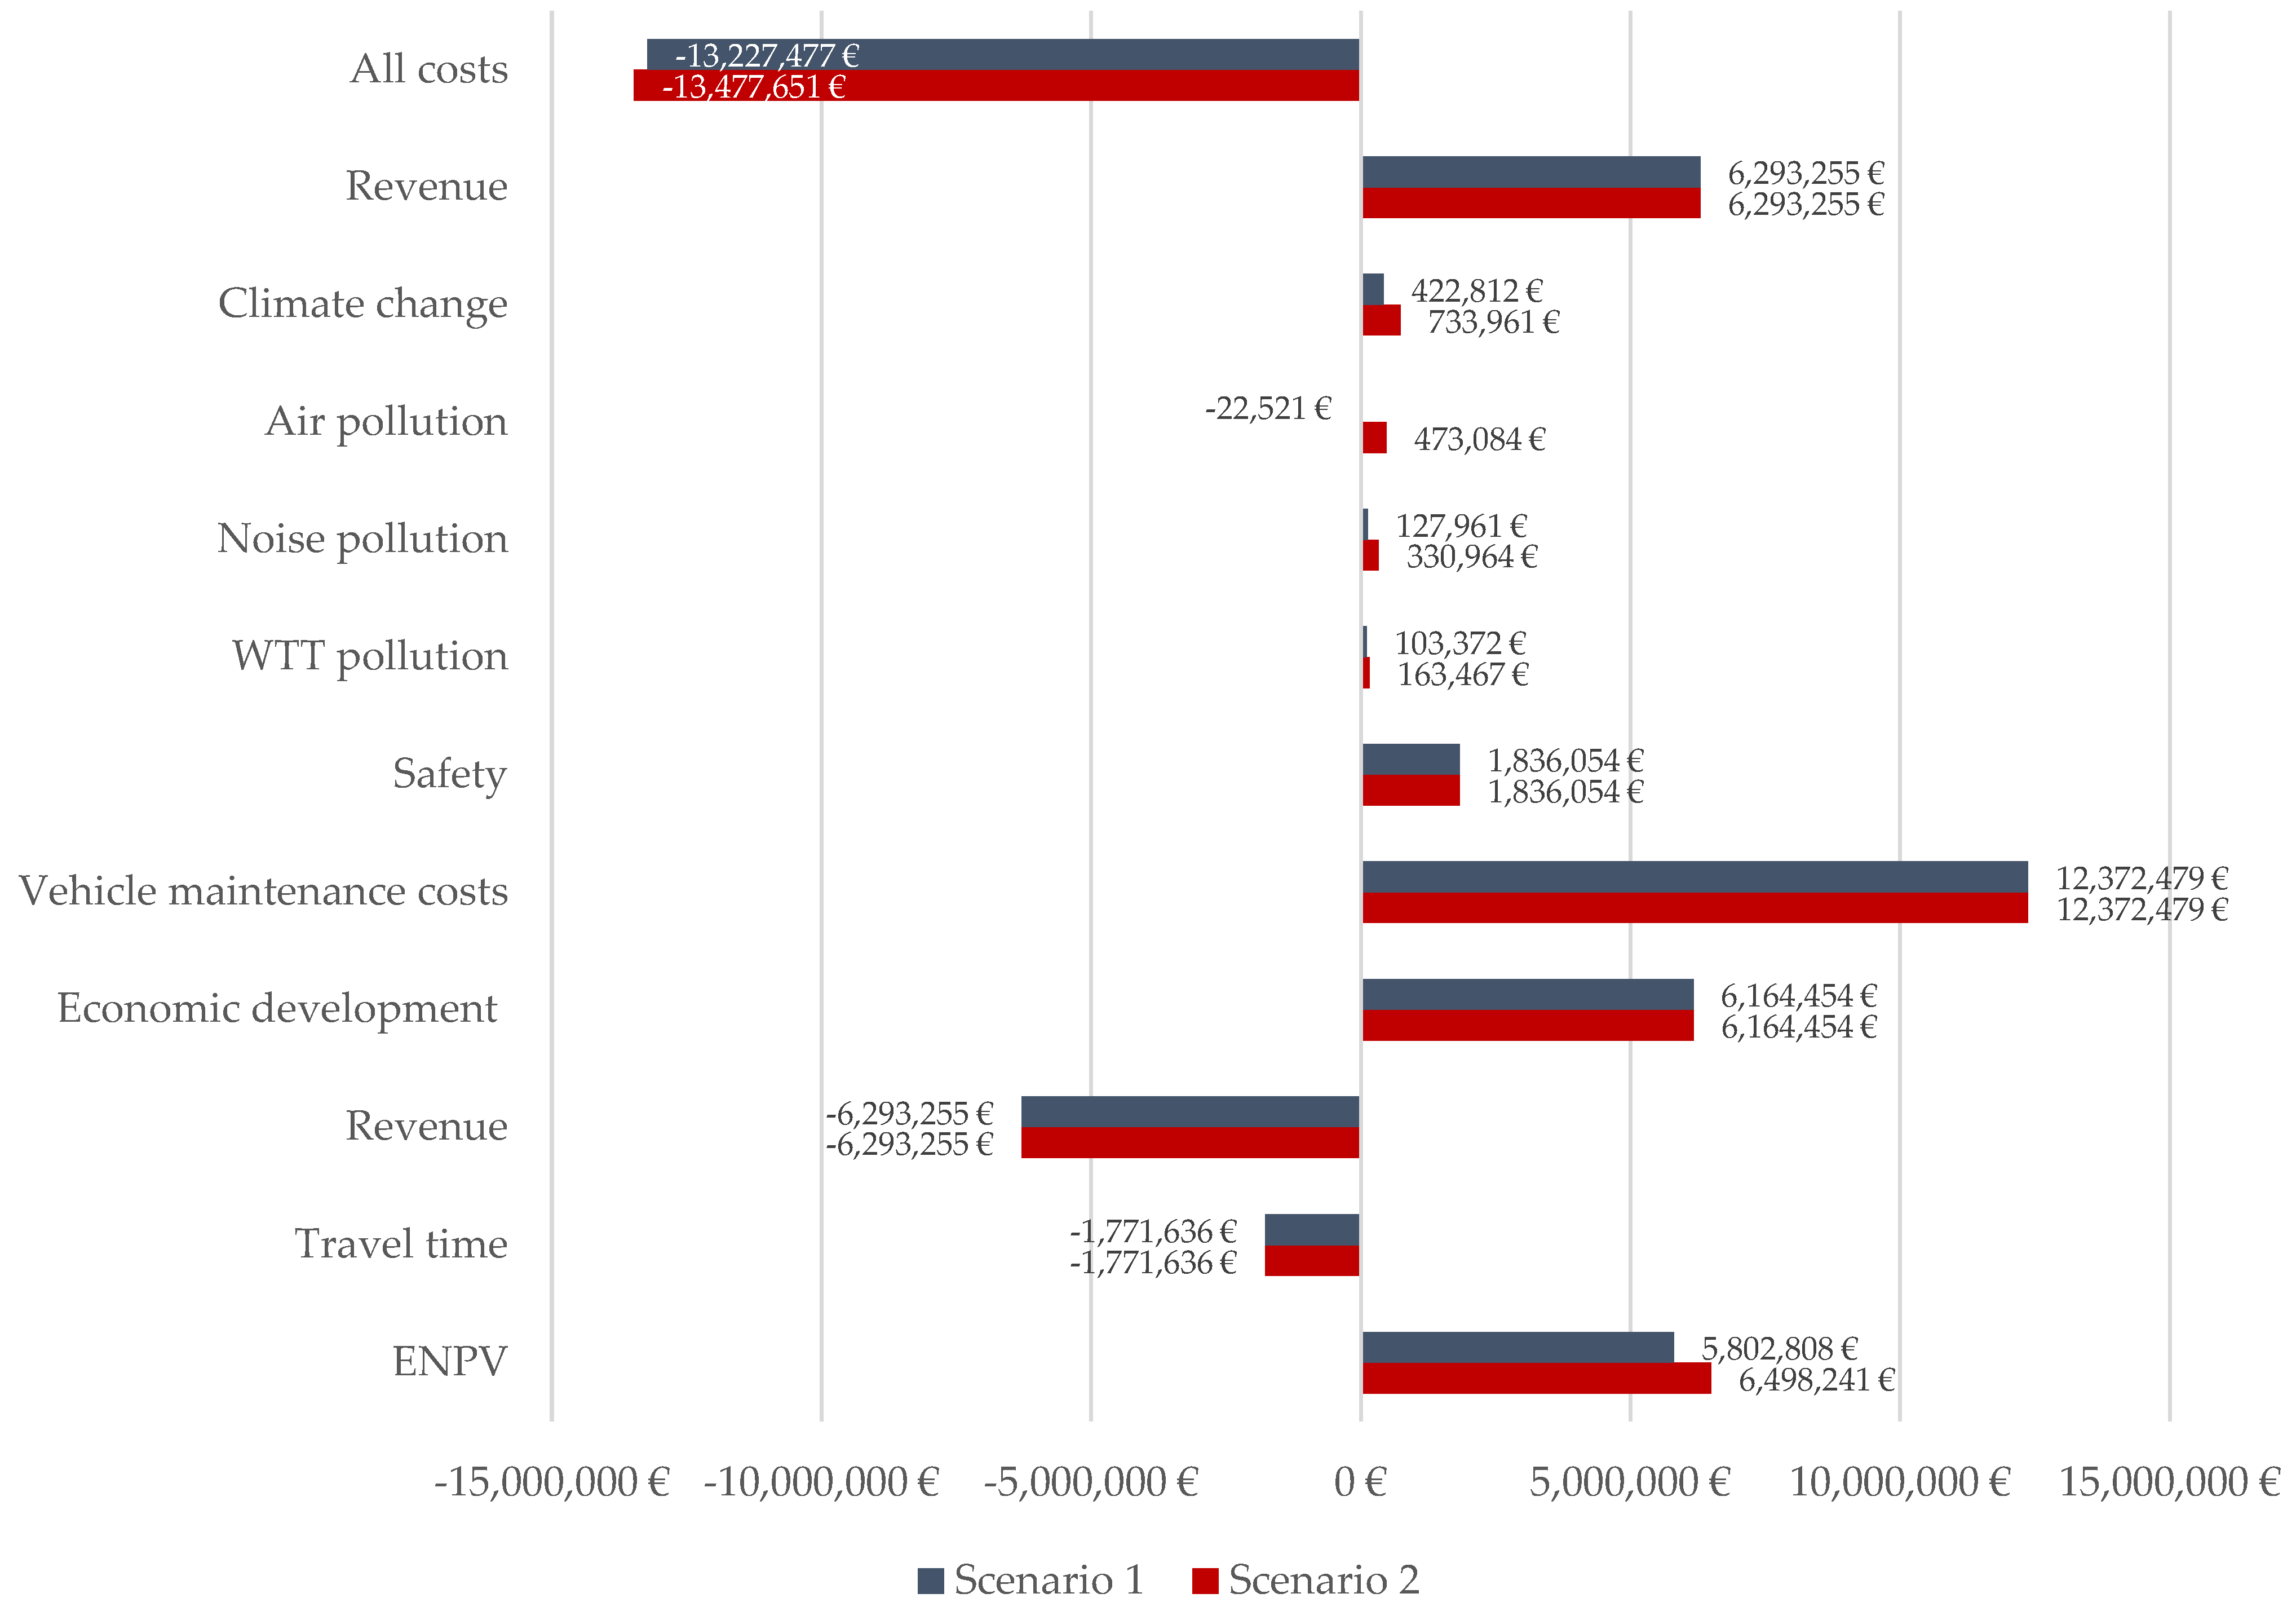
3.2. Results of the Economic Cost-Benefit Analysis
The results of the economic cost-benefit analysis show similar results for both scenarios, which are presented in
Table 4.
Figure 2 is also included for additional clarity and qualitative interpretation.
The net present value of social benefits was calculated using the methodology that was explained in the previous chapter. The results have shown that the public transport system results in a total of 607,573 km, while if the public transport users used passenger cars instead, it would result in a total of 2,631,114 km. These data were used to calculate the net present value of the social benefits of the system, which is equal to a total of EUR 12,737,031 for Scenario 1 and EUR 13,682,638 for Scenario 2.
The net present value of climate change benefits is 74% higher in Scenario 2. The benefits of reduced air pollution exist in Scenario 2, while in Scenario 1, air pollution is increased rather than decreased. Given the underutilization of public transport vehicles, a minibus or bus carrying these passengers would result in higher per-passenger air pollution emissions compared to the scenario where each passenger traveled individually by car.
The net present value of noise pollution benefits is 2.6 times higher in Scenario 2, while the WTT emission benefits are 58% higher in Scenario 2. These costs were calculated by subtracting the WTT emission cost of public transport from that of passenger cars, according to the previously mentioned European Commission rulebook on external costs in transport.
When it comes to the net present value of road safety benefits, the previously mentioned methodology has shown that the total benefit of introducing the public transport system equals EUR 1,836,054 for both scenarios. The net present value of the operating benefits of using public transport instead of passenger cars is EUR 12,372,479 for both scenarios. The aforementioned net present value of the benefit to the economy in terms of new workplaces equals EUR 6,164,454. This benefit is also equal for both scenarios. On the other hand, the time losses of using public transport instead of passenger cars generate a net present value cost of EUR −1,771,636, with a total of 22,507 passenger-hours lost annually. This benefit is also equal for both scenarios.
When it comes to the results of the economic cost-benefit analysis, the ENPV amounts to EUR 5,802,808 and EUR 6,774,494, respectively. The B/C ratio is 1.84 for Scenario 1 and 1.90 for Scenario 2, indicating that the project is economically viable and beneficial to society in both scenarios. The difference between B/C ratios is only 3%. This is due to the fact that the number of vehicle-kilometers and passengers is low. The ERR is 87.79% and 32.86%, respectively.
The total economic benefit (undiscounted) that the project will generate by the end of the planning period exceeds EUR 12.7 million in Scenario 1 and EUR 13.6 million in Scenario 2. Net cash flow shows positive values throughout all years of operation, except in the year of investment, in both scenarios.
The cumulative net cash flow becomes positive from the second year in Scenario 1 and from the fourth year in Scenario 2, indicating that the project is expected to achieve economic viability in the second year of the operating period for diesel buses or in the fourth year for electric buses.
The results obtained from the analysis align with good international practices.
3.3. Results of the Risk Analysis
The results of the sensitivity analysis indicate that the greatest influence on the financial viability of the project comes from the project’s operating costs, where a one percent increase in operating costs in Scenario 2 leads to a decrease in the Financial Net Present Value (FNPV) of approximately 1.13%. The next critical risk factor is revenue, where a one percent decrease in revenue reduces the FNPV by approximately one percent.
When it comes to the economic viability of the project, the most critical factor carrying the highest risk is the social benefit arising from reduced vehicle maintenance costs. A one percent change in this risk results in a change in the Economic Net Present Value (ENPV) of approximately two percent in Scenario 2. Based on the level of risk, the next most significant factor is the project’s operating cost, where a one percent change causes a change in ENPV of approximately 1.2%.
The qualitative risk analysis has shown that the highest risk is that national and local funds for co-funding will be lacking. Risks labeled as high are also a potential lack of European Union funds and other funds, a lack of competent staff, a lack of human resources, and less demand than forecasted. The only risk that is labeled as low is the risk of higher operating and maintenance costs. Mitigation measures for all risks have been defined.
The probability modeling conducted revealed that the B/C ratio is greater than or equal to one in over 95% cases in Scenario 1 and in over 99% of cases in Scenario 2.
Based on these results, it can be concluded that there is a low probability of negative ENPV values occurring, meaning that the likelihood of the project being economically unjustified is minimal for both scenarios. These results are valid for both scenarios, and similar trends and patterns can be observed for the risk analysis in general.
4. Discussion
This research highlights the crucial importance of providing public transport services in rural areas, especially for vulnerable groups such as the young and the elderly, who often do not have access to private vehicles due to financial constraints. In such environments, a reliable and accessible public transport system becomes not only a tool for improving mobility but also a key instrument for achieving social justice by guaranteeing the right to mobility for all citizens, regardless of their income, age, or place of residence. Ensuring access to education, healthcare, employment, and social activities has a direct and profound impact on the quality of life and the vitality of rural communities.
The economic cost-benefit analysis conducted in this research confirms that, even when subsidies are necessary, the introduction of rural public transport services is socially and economically justified. The benefits substantially outweigh the costs, reinforcing the view that rural public transport plays a fundamental role in promoting sustainable mobility—mobility that is environmentally responsible, socially inclusive, and economically viable. Such results can aid policymakers and planners in other regions to perform adequate calculations and understand whether one potential public transport system can have similar economic indicators. This methodological framework can be suitable for justifying investments in socially beneficial systems in other rural areas.
The results obtained align with previous research, which implies that rural public transport projects have a benefit/cost ratio higher than 1. This is in line with studies done by Skolnik and Schreiner, Southworth, and Peng and Nelson. The benefit/cost ratio of the system in Jastrebarsko is in the ratio range found by Burkhardt, which is between 1.67 and 4.22. The benefit/cost ratio of the bus system in Jastrebarsko can also be compared to the ratio found in one United States study, in which a ratio of 1.12 for rural areas has been calculated. These results can be seen as adequate and consistent with previous research. The studies that show the return on investment of similar systems have similar results to the results for Jastrebarsko, since the Jastrebarsko system also has a positive return on investment when viewed from the economic perspective.
The success of such a system would have to be benchmarked upon its implementation, after which its indicators can be compared to successful existing systems, such as the one in the Weinland region in Switzerland and the one in Lincolnshire in the UK. Additionally, the results of this research also support the strategic goals of the European Union related to decarbonization, regional equity, and accessibility. A public transport system, such as the proposed one, also helps reduce the issue of transport poverty, which is omnipresent in many environments, where public transport operators are decreasing their frequency due to low demand.
However, to adequately measure the effectiveness of the system, other indicators and benefits need to be adequately measured as well. Some of these indicators and benefits could not be measured for Jastrebarsko due to methodological constraints and limitations. A lack of a transport model makes it difficult to make a more accurate demand forecast, but also a more accurate estimate of the reduction of emissions and other social benefits. Other relevant data for other indicators was also not available, such as estimating the increase in social activities, lower relocation costs, better land use achieved through decentralization, etc. These indicators are significant in rural contexts, and access to data for obtaining these indicators would provide a better understanding of the additional social benefits of the system. The risk analysis has shown a high risk of providing incorrect information regarding the estimated number of passengers using the system. The methodology used in the research highly depends on surveys and forecasts, which could be improved through a transport model and more detailed data acquisition.
When comparing diesel and electric bus scenarios, the results show that under current conditions, diesel buses achieve a significantly higher economic rate of return (ERR) than electric buses. In rural areas like Jastrebarsko, the advantages commonly associated with electric vehicles—such as lower operating and maintenance costs—are less evident. The combination of high initial investment costs for electric buses and charging infrastructure, low passenger numbers, and relatively short annual mileages prevents the expected operational savings from being fully realized. Consequently, electric vehicles in such contexts lose part of their expected advantage, which must be considered when planning rural decarbonization strategies.
This is also supported by a study by Falcao et al. [
29], who found that the economic profitability of electric buses can be negative due to their high upfront costs. Similarly, Giordano et al. [
30] emphasize that the successful deployment of electric buses often relies on substantial public subsidies. This raises the question of whether such high levels of funding are necessary in all regions, particularly when comparable outcomes, albeit on a smaller scale, can be achieved with diesel buses. Opting for diesel solutions can benefit both public funders and municipalities, as they are less costly to subsidize and easier to procure. Moreover, Tong et al. [
31] note that diesel buses may offer certain advantages in specific contexts, further supporting the case for a more flexible, need-based approach to public transport investment.
Nonetheless, this situation must not be interpreted as advocating for the long-term maintenance of diesel technology. Instead, it emphasizes the necessity for a gradual, context-sensitive approach to rural decarbonization. It is important that European Union and national policies are adapted to the realities of rural areas. If current rigid funding mechanisms continue to mandate the exclusive use of zero-emission vehicles without addressing the specific challenges of rural operations, there is a substantial risk that rural areas will either lose essential transport services altogether or will fail to achieve decarbonization targets in a socially equitable way. Policies must recognize that sustainable rural mobility requires both environmental responsibility and the safeguarding of basic accessibility rights. Additionally, future research should explore the equilibrium point at which modern diesel buses, equipped with newer, cleaner engine technologies, may be more suitable for certain areas than electric alternatives. This is particularly important in regions where full electrification is not yet feasible, as diesel buses still represent a significant improvement over having no public transport at all. Identifying this balance can help tailor solutions to local needs while ensuring progress toward more sustainable mobility.
Another key finding of the research is the sensitivity of rural public transport systems to the quality and frequency of service. If financial constraints lead to a reduction in fixed, scheduled services and an increased reliance on demand-responsive transport concepts, there is a serious risk of deteriorating service quality. Demand-responsive services, while flexible in theory, often cannot adequately support complex travel needs such as commuting combined with errands or school, followed by extracurricular activities. Reduced predictability and availability can discourage usage, leading to a decline in the number of users, further threatening the economic sustainability of the service and perpetuating car dependency. Therefore, wherever possible, maintaining regular, scheduled services should remain a priority in rural transport planning.
Additionally, stakeholders and local authorities should promote public transport through complementary measures, particularly in rural areas where public transport cannot compete with passenger cars in terms of service quality. For instance, implementing a sustainable parking policy could encourage users to shift to public transport, while travel cost reimbursements could be restricted to public transport tickets.
In the broader context of rural decarbonization, achieving sustainable mobility while guaranteeing social justice requires an integrated approach. Tailored funding models, investment in appropriate infrastructure, support for technological innovation, and preservation of service quality are essential components. Only by reconciling environmental goals with the real mobility needs of rural populations can the transition to zero-emission public transport truly succeed in all parts of society.
This research thus positions rural public transport not only as an environmental initiative but as a fundamental instrument of rural development, social inclusion, and sustainable regional growth.
5. Conclusions
The cost-benefit analysis conducted in this research underlines the crucial role of public transport in rural settings, particularly for vulnerable groups who lack access to private transportation. Even though financial viability is not achieved, the strong economic viability, demonstrated through high economic net present value (ENPV) and favorable benefit–cost ratios of 1.90 and 1.84, respectively, confirms that such services deliver essential societal value.
Rural public transport services are not merely a technical or economic issue; they are a fundamental pillar of social justice and the realization of the right to mobility. Without adequate mobility options, rural citizens risk exclusion from vital services and opportunities, contributing to social and economic marginalization and undermining the cohesion objectives of national and European policies.
While diesel buses currently offer a better economic return in low-demand rural contexts, the long-term vision should remain focused on enabling a transition to zero-emission transport solutions. However, the challenges faced by electric buses in rural areas, particularly high initial investment costs and low utilization rates, demonstrate the need for targeted and comprehensive support. This support should go beyond incentives for vehicle procurement and also address the infrastructural and operational barriers specific to rural environments. This is especially significant in areas where full electrification is not yet practical, as modern diesel buses still offer a substantial improvement compared to the absence of any public transport. Striking this balance can enable more context-appropriate solutions while still advancing toward sustainable mobility goals.
European Union and national policies should evolve to reflect the realities of rural mobility. Facilitating rural decarbonization requires financial mechanisms for subsidizing not only vehicle purchases but also the deployment of decentralized charging infrastructure. Additionally, it is essential to support the development of technologies suited to rural conditions and to ensure sufficient operational flexibility to maintain service quality. Making electric mobility truly accessible and effective for rural communities is key to achieving both environmental goals and social equity.
Additionally, maintaining regular and reliable scheduled services is critical for the usability and attractiveness of public transport. Excessive reliance on demand-responsive models can undermine the functionality of rural public transport systems by failing to meet the full spectrum of mobility needs, especially for complex trip chains involving work, education, and leisure.
To adequately quantify the impact of rural public transport systems, some indicators that the authors had no access to need to be measured. The limitations of the research include the lack of a transport model and the lack of a more accurate estimate of the reduction of emissions and other social benefits. Other relevant data for other indicators was also not available, such as estimating the increase in social activities, lower relocation costs, and better land use achieved through decentralization. These indicators are very important for rural contexts, and access to data, which is important for obtaining these indicators, would provide a better understanding of the additional social benefits of the system.
The authors of the paper suggest that future researchers develop transport models for their study areas whenever possible, since it provides more key information for calculating the potential impact and benefits of rural public transport systems. Additionally, an impact study should be conducted for this system once it starts operating, as well as for other similar systems. This is significant for tracking real-world outcomes, such as ridership, emissions reduction, social inclusion, employment, etc. Previous research shows that different propulsion systems are suitable for different local contexts, also in terms of geography, topography, and climate conditions. Therefore, a cost-benefit comparison of various technologies should be conducted for every rural public transport system. The authors also point out that most successful systems are those that are also adequately integrated with other existing transport systems. Additionally, the authors suggest conducting more research in the field of different pricing strategies and their potential impact on ridership, system attractiveness, and other indicators. It would also be beneficial to explore multi-criteria decision analysis (MDCA) methods, which would incorporate stakeholder preferences, political acceptability of projects, and equity concerns. Additionally, the key issue of battery recycling needs to be further explored and incorporated into financial and economic analysis, as well as into MDCAs.
By addressing these challenges through flexible, context-sensitive policies, rural areas can be integrated into the broader goals of sustainable mobility and climate neutrality without compromising accessibility or quality of life. Supporting sustainable, zero-emission transport in rural areas is not only essential for achieving environmental targets but is also fundamental to ensuring social equity, promoting regional development, and safeguarding the right to mobility for all citizens. It is important to note that these findings are specific to rural contexts, and each area must be evaluated according to its own local conditions.
This research contributes to the wider discourse on rural decarbonization, sustainable mobility, and social justice, providing evidence-based recommendations for creating inclusive transport policies that reflect the diversity of rural contexts across Europe.


