Abstract
This study presents the total cost of ownership (TCO) of battery electric buses across Europe (the EU27 + UK + Türkiye). A comprehensive review of the assumptions and data used for the TCO calculation of buses in the literature is provided, along with calculations of the different bus TCO excluding labor costs, across these countries. The calculated TCO is compared with diesel costs in each country to identify the countries in which bus electrification is financially most competitive. The study reveals that the financial case for bus electrification is strongest in Finland, France, Belgium and Greece (TCOs around €750k to €850k and high diesel costs in the range of €1.70 per liter) and is weakest in Malta, Bulgaria and Cyprus. These results are expected to be of interest for operators, academics, policy makers, and financial investors in bus electrification.
Keywords:
eBus; electric bus; electric vehicle; EV; heavy duty vehicle; total cost of ownership; TCO; zero emission bus 1. Introduction
The transport sector contributes to around a quarter of energy-related greenhouse gas emissions globally [1]. Within transportation in Europe, road transport contributes around 70% of emissions, of which heavy duty vehicles (comprising trucks, buses and commercial vehicles over 3.5t Gross Vehicle Weight), despite forming only 2% of the road vehicle fleet [2], are responsible for around 25% of greenhouse gas emissions [3]. Buses represent a publicly owned, highly visible, urban, and essential share of the heavy duty vehicle fleet. In Europe, 89% of buses run on diesel [2]. In addition to greenhouse gas emissions, these buses also contribute to urban air pollution.
Buses are leading the transition to electrification in the heavy duty vehicle sector, with some countries in Europe having electrified over 10% of registered buses. However, it is clear that the major transition to electric drive, both in Europe and globally, lies ahead. Major challenges for bus electrification around the world have been found to include (1) necessity of changes to bus operation and scheduling, (2) planning and ownership of charging infrastructure, (3) cost uncertainties, (4) necessity of involving new stakeholders, and (5) lack of knowledge about the electric bus paradigm [4]. We aim in this paper to mainly address the uncertainty of cost.
The cost structures between diesel and electric buses are different. In general, battery electric buses have higher purchase costs but are less expensive to operate than their diesel counterparts. The comparison of costs of differing powertrains therefore requires a life-cycle or total cost of ownership (TCO) approach rather than a simple comparison of purchase or operational costs. Here we consider the TCO to estimate the costs incurred by a bus operator over the vehicle lifetime.
Lajunen and Lipman [5] investigated the life-cycle costs of city buses with different powertrains under operating conditions in Finland and California, USA in 2016. Battery electric buses were found to be around 1.2 to 1.5 times more expensive than diesel in both locations over the 12 year period of analysis. In 2018, Potkány et al. [6] compared life-cycle cost structures of electric and diesel buses in Slovakia. The life-cycle costs of electric buses (around €700k) were found to be higher than those of diesel buses (around €575k), with electric buses presenting a lower cost alternative only after around 17 years of operation.
O’Donovan et al. [7] made an extensive global review of electric bus models, costs, business models and charging configurations in 2018. Conditions for reaching TCO parity of electric buses with diesel in terms of battery size, annual kilometers driven and electricity and diesel price range are provided, with forecasts for future TCO development for various buses.
Meishner and Sauer [8] made an estimation of the TCO of actual buses operated in four European cities in 2020 as part of the European Eliptic project, and also included trolley buses in the comparison. Both electric buses with depot charging and trolley buses are found to have lower TCO per passenger-km than diesel buses under certain conditions. Kim et al. [9] compared the TCO of battery electric buses with diesel and hydrogen fuel cell buses for specific routes in the city of Offenburg in Germany in 2021. Both depot charging and pantograph charging are considered for battery electric buses. They are found to be more expensive than diesel in TCO per kilometer of operation in 2020, but lower when the transition is made in 2030, primarily due to expected fall in battery prices and expected increase in diesel costs.
Triatmojo et al. [10] evaluated the factors affecting the TCO of electric buses to support Transjakarta, the bus operator in Jakarta, Indonesia, in 2023. In addition to extensive documentation of costs, the study highlights the necessity of increasing the contract duration to bring the TCO of battery electric buses below that of diesel buses.
Jagiełło et al. [11] analyzed 451 tenders for city buses in Poland, which were used to procure 3898 buses across the country, including diesel, battery electric and other fuel types. The article highlights the need for reformulation of public procurement from focusing on initial cost to TCO to better compare different powertrains in the tendering process.
In 2024, Boratyńska-Karpiej et al. [12] analyzed data from 30 Polish cities for the year 2023, including labor costs. For the 14 year timeframe considered, the TCOs of battery electric buses (€2.55 million per bus for plug-in and €2.89 million per bus for pantograph) are found to be slightly lower than that of diesel (€2.92 million).
Razy-Yanuv and Meron [13] analyzed the life-cycle costs of various buses including battery electric, CNG, diesel Euro 6, and diesel-hybrid to decide the best option for the transition of existing diesel Euro 5 diesel buses in Israel. CNG, at €1.40/vehicle-km, is found to be comparable with the existing diesel Euro 5, while diesel Euro 6 (€1.61/vehicle-km), hybrid (€1.60/vehicle-km) and battery electric (€1.65/vehicle-km) are found to have higher TCO.
A key challenge in the literature on bus TCOs is the wide divergence of input parameters, methods, and assumptions. This makes the results non-comparable across studies and geographies. In this study, we aim to remedy this by applying standard assumptions and a range of parameters to provide comparable results for the calculation of battery electric bus TCO across the countries of Europe.
We present a comprehensive overview of recent costs of bus procurement and operation, including the costs of charging infrastructure (including project costs and civil works), electricity, maintenance, repair, inflation, financing, battery replacement, and battery salvage. The total cost of ownership (TCO) framework is applied to calculate the range of costs associated with ownership and operation of electric buses for most countries in Europe (EU27 + UK + Türkiye). The TCO of electric bus operation is also compared with diesel costs to compare the financial competitiveness of battery electric buses with diesel operation in each country.
2. Methods and Data
The total cost of ownership (TCO), the framework used in this study, provides a comprehensive overview of costs over the vehicles or fleets’ operational life. It is a robust method for evaluation over vehicles with different initial, operational and maintenance costs, and is therefore well-suited for the comparison of alternative powertrains over longer terms. The wide prevalence of diesel buses, which are most common across Europe, leads to the need for comparison of alternative powertrains with diesel. The total cost of ownership approach enables such a comparison in a comprehensive way and is therefore used here.
The necessity of the TCO approach is clear from two examples. First, Jagiełło et al. [11], upon analysis of 451 Polish bus tenders, found that the purchase price of buses was the factor with the highest weight (around 60%) within the tender’s selection criteria. Revealingly, the weights for purchase prices in tenders for diesel and electric buses were nearly the same. The same study reported that in Poland, the cost structures of electric and diesel buses are quite different. On average, while initial costs comprise about 49% of the TCO for electric buses, they comprise only about 26% of the TCO for diesel buses. On the other hand, energy (electricity) for electric buses constitutes 16.5% of the TCO on average in comparison with energy (diesel) costs of 53% on average for diesel buses. The high weight of initial purchase costs in decision-making is likely to result in structural preference for diesel buses over electric buses, ignoring the substantial differences in operational costs over the vehicle lifetime between the different powertrains. This difference would be considered in TCO-based analysis, leading to better-informed selection criteria in bus tendering.
Second, in the investigation of the barriers to the introduction of electric buses in England and Sweden, uncertainty around the TCO was cited as a key barrier in case studies in York, England and Gothenburg, Sweden [4]. Both England and Sweden are among the wealthier European economies, and are frontrunners in Europe in the electrification of buses. In total, 9.5% of buses in the UK and 8.5% of the buses in Sweden are fully electric (in the EU, only the Netherlands with 17.7%, Ireland with 13.5%, Luxembourg with 14.7% and Denmark with 10.8% are ahead of England and Sweden in terms of share of electrified buses) [2]. Bus operators here, with experience of electrification at the national level, find TCO estimation of electric buses challenging. It is to be expected that for bus operators in the more price-sensitive economies of Europe, with less experience in electrification, uncertainty around the TCO of electric buses is likely to be a greater barrier to adoption.
2.1. Defining the Total Cost of Ownership
The total cost of ownership (TCO), sometimes known as lifetime cost or life-cycle cost (LCC), is broadly defined as ‘the cost of an asset throughout its life cycle, from acquisition through operation to disposal, while fulfilling the performance requirements’ [14]. It is commonly applied to vehicles and fleets, but has many wider applications across buildings, consumer goods and other assets.
In this study, we use a more specific definition, suitable for vehicles and fleets, where ‘the Total Cost of Ownership (TCO) provides an estimate of the comprehensive costs incurred by a vehicle or fleet owner over the expected vehicle lifetime’ [15]. Ownership refers here primarily to bus procurement and operation—and the costs of ownership are therefore the costs for bus procurement and operation by the organization responsible for these activities.
2.2. Scope of the Study and Boundaries
The scope of vehicle TCO studies depends on both the purpose of the analysis and the user of the vehicle. For example, analyses that focus on a single user of a vehicle from the point of purchase to point of sale may consider a fraction of the vehicle life cycle. TCOs for non-commercial vehicles can safely neglect labor costs, while studies for fleet managers must generally include costs of labor including wages and benefits. The main objectives of this study are the following:
- To give an overview of the TCO of electric buses across the countries of Europe;
- To identify the most important parameters affecting the TCO of electric buses;
- To provide guiding estimates for the financing of electric bus procurement.
As such, our study considers the following within its scope:
- Vehicle cost: This includes the cost of the initial purchase of the vehicle, from which the vehicle’s residual value at the end of the analysis time-frame is deducted. We assume the vehicle to be drivable and in good condition at the end of the analysis horizon and thus implicitly assume maintenance and repairs. We also assume a depreciation of the vehicle value over this horizon.
- Financing costs: Financing costs are associated with the payment of interest beyond the retail price of the vehicle.
- Charging costs: Costs of charging cover the cost of charging infrastructure as well as the costs of electricity. Electricity costs are proportional to bus driven distance, route characteristics, vehicle efficiency, ancillary loads (like heating and cooling), and the electricity unit price. In some cases, electricity costs may vary over the course of the day or year, leading to the timing of charging rather than the scale of energy used for charging to also influence the charging costs.
- Maintenance and repair costs: These costs cover scheduled vehicle servicing (maintenance) and unscheduled vehicle servicing (repair).
We do not consider fees such as vehicle registration, parking, tolls, etc. Although labor is an important and essential cost associated with bus operation in any commercial setting, labor costs are considered out of scope in this study. They are unlikely to change when compared with the labor costs associated with operating diesel vehicles in the long term. Some studies report as a difference between diesel and electric buses the ‘labor cost of charging’. This covers the costs associated with the time spent by the driver or other personnel on ensuring vehicles are adequately charged. We do not consider these costs here, and expect that as operators become more familiar with electric buses, these costs will reduce. Insurance costs covering both liability, and extra-ordinary replacement and repair are not considered. Further, we do not consider external costs (positive or negative) to society or the environment, such as access to public transport, urban congestion, air pollution, noise pollution, and so on.
2.3. Calculation of the TCO
Based on Burnham et al. [15], the TCO of buses in this study are calculated as in Equation (1):
where N is the total length of the analysis window in years,
- i is the year of the cash flow,
- d is the discount rate accounting for opportunity cost in %, and
- is the cash flow in the year in real inflation adjusted Euros (€).
2.4. Analysis Time-Frame and Vehicle Lifetime
The timeframe of analysis of buses as well as other heavy duty vehicles is typically 10 to 15 years [12,15,16]. The technical lifetime of buses is typically longer, ranging from 10 to 20 years [9,17,18]. During the vehicle lifetime, there may be multiple users of the bus, for each of which the analysis timeframe is shorter—limited to their individual duration of ownership.
Around 80 to 90% of European buses are used for their entire operational life and then scrapped. The fraction of buses used in a second life in a different location is relatively small—at around 10 to 20%. This is mainly due to competitive tendering regimes in the wealthier European countries, which result in buses being sold after 7 to 10 years [17]. Earlier studies on TCO of electric buses consider a variety of values for their timeframe of analyses, as shown in Table 1. These values range from 10 to 15 years.

Table 1.
Timeframe of analysis in TCO studies on electric buses.
Similarly, the contract durations for electric buses are shown in Table 2, sourced from Triatmojo et al. [10]. Internationally, electric bus contract durations are frequently longer than those for diesel buses. The low operational cost of electric drive pays off the high initial investment over periods of over 7 years. With the current prices and technology, the payback period is longer than for diesel buses.
Table 2.
Contract durations for electric buses compared with diesel buses around the world (source: Triatmojo et al. [10]).
Internationally, a frequent choice for electric bus contract duration is in the range of 15 years. This is also suggested by some best practice guidelines [10]. However, European legislation for tendering restricts maximum duration of contracts to 10 years [19]. To take advantage of longer lifetimes with lower operational costs, and correspondingly lower TCO, some countries work around this. As an example, in the Netherlands, where around 18% of buses were battery electric in 2023 [2], there is an option for operators to extend the contract by 5 years at the end of the initial 10 year contract [20].
For this reason, the default timeframe of analysis is 15 years in this study. We consider the bus to be used for its entire operational life with remanufacture/retrofit for mobility, repurpose for another application, or recycling of the battery rather than re-use at the end of the first life. We explicitly consider a second life of the battery, since 15 years from now, we expect a mature market for second-life batteries to exist. Second-life sale values of batteries are then expected to have a favorable influence on the TCO.
2.5. Purchase Costs of Electric Buses and Charging Infrastructure
For the purchase costs of charging and charging infrastructure, we conducted a brief survey of current literature and utilized the authors’ expertise in bus tendering operations. An overview of costs for bus and charger types is provided in Table 3 and Table 4. For the purposes of this study, we consider standard 12 m city buses.
Table 3.
Overview of battery electric bus costs.
The battery capacities we consider in this study for 12 m buses are in the range of 260 kWh as the lower bound and 422 kWh as the upper bound. Battery capacity is correlated with purchase price, since batteries comprise a large fraction of the total manufacturing costs of battery electric buses. Battery capacity is also correlated with vehicle range and kilometers driven, since larger battery vehicles are typically chosen for longer routes and heavy operation.
It should be noted that the battery capacities in recent 12 m bus models from several manufacturers like IVECO (up to 486 kWh) [23], BYD (up to 500 kWh) [24] and Ebusco (up to 500 kWh) [25] exceed the values presented here. However, we expect costs to align with winning tenders even with increased battery capacities. Also to be noted is the fact that with the new powertrain architecture and lightweighting of chassis, the same battery capacity could provide significantly higher range in the future.
Table 4.
Overview of charger costs for battery electric buses.
Table 4.
Overview of charger costs for battery electric buses.
| Charger Type | Purchase Cost (€) | Project Costs (€) | Civil Works (€) | Opex (€/Year) | Source |
|---|---|---|---|---|---|
| AC 11 kW | 1800 | 370 | 90 | 90 | Tettero et al. [26] |
| AC 22 kW | 2100 | 370 | 105 | 434 | Tettero et al. [26] |
| DC 50 * kW | 17,500 | 1600 | 7000 | 1745 | Tettero et al. [26] |
| DC 150 kW | 52,500 | 4200 | 21,000 | 4895 | Tettero et al. [26] |
| DC 350 kW | 122,500 | 4200 | 49,000 | 11,195 | Tettero et al. [26] |
| Pantograph charging (300 to 450 kW) | 457,000 | 58,500 | 5000 | Kim et al. [9] | |
* Value used in this study, resulting in depot charging durations of between 5 and 9 h.
For the chosen battery capacities, we consider 50 kW charging as most appropriate since the charging rate would result in an overnight depot charging duration of 5 to 9 h, considered typical for European bus schedules.
We do not expect hardware costs to vary widely across Europe though there might be some differences. Such an assumption, based on the free transport of goods within the EU internal market, is also taken in other studies [27,28]. However, we do expect unit costs to change with the lot size, i.e., the number of buses purchased. Further, we also expect differences in the cost of civil works, primarily associated with the differing labor costs across Europe. As such, these figures should be taken to be indicative.
2.6. Energy Requirements for Electric Buses
In real operation, the energy use of buses depends on time-variant factors like temperature, passenger loading, air drag, route topography, and driving style [29], but here we consider only long term averages. An overview of the estimates of annual electricity consumption per bus in the recent literature is shown in Table 5.
Table 5.
Overview of annual energy use and distance driven for battery electric buses.
A wide range of annual kilometers traveled as well as annual electricity consumed is seen in the literature. At the lower end is around 30,000 annual km used, reported by O’Donovan et al. [7] to describe the representative annual distance traveled by a bus in a small city. However, as other studies point out, 30,000 annual km is very low, leading to high cost per driven km and also higher costs per km for other expenses which are not linked with mileage, such as technical inspections. So we consider 40,000 km to be the lower bound, as shown in [12,13], and 80,000 to be the upper bound, as in [7,12]. This corresponds to an annual electricity consumption ranging between 64 and 104 MWh per bus.
2.7. Cost of Electricity
We use the electricity prices for industrial customers in Europe who consume between 2000 MWh and 20,000 MWh annually. Based on annual electricity use of 64 to 104 MWh per bus, this would be a customer with between around 30 and 200 buses. These values were sourced from Eurostat and the UK government. From Eurostat, customers consuming between 2000 MWh and 20,000 MWh annually (Eurostat band: ID) were considered [35]. From the UK government, non-domestic customers consuming between 2000 MWh and 19,999 MWh annually (UK band: Medium) were considered [36]. An exchange rate of £1 = €1.19 was used.The values used in this study include the taxes and VAT for each country, as shown in Figure 1 and Table 6.
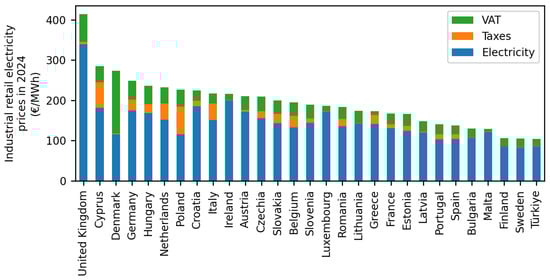
Figure 1.
Electricity prices for industrial customers (2000 MWh and 20,000 MWh annual consumption) in Europe in 2024.
Table 6.
Statistical summary of electricity prices for industrial customers (2000 MWh and 20,000 MWh annual consumption) in Europe in 2024.
2.8. Inflation, Discount Rates, Vehicle Depreciation, Battery Replacement and Salvage Value
The electricity prices for industrial customers consuming between 2000 MWh and 20,000 MWh annually increased by 2% per year in the decade prior to the Russia-Ukraine war, increasing from 96 €/MWh (without tax and VAT) to 124 €/MWh [37]. While prices since 2022 have increased as a consequence of the war, we consider the 2% rate for electricity inflation going forward in this study with reference to the base year of 2024. No price shocks were explicitly modeled.
We use discount rates published by the European Commission and the Central Bank of the Republic of Türkiye [38,39] to cover all the countries considered in this study.
We consider the battery replacement time to be 7.5 years, around half the operational lifetime of the vehicle. This reflects the more recent studies in the literature based on experiences of bus operators [10,12] as seen in Table 7.
Table 7.
Overview of years of operation before battery replacement.
At the end-of-life of the vehicle, we consider that batteries will have a second life for repurposing or remanufacturing before final disposal in line with the European Battery Directive [40]. We use battery price forecasts from the UK’s Advanced Propulsion Centre. On comparison of several battery price forecasts from Ricardo, IHS Next Generation Battery Technologies and Market Trends, Bloomberg NEF, IHS and Cairn, the price forecasts from the UK’s Advanced Propulsion Centre (APC) were found to be closest to actual battery pack prices for the recent years from 2021 to 2023; for this reason, we chose to apply the APC forecast for this study [41]. For the salvage value, we apply the model developed by Neubauer and Pesaran [42] as shown in Equation (2):
where is the salvage value of the battery pack,
- is the refurbishment cost factor of 15%,
- is the used product discount factor of 15%,
- is the battery health factor, beginning with 0% in the first year and increasing by 3% per year,
- is the cost per usable kWh of battery pack capacity for a new battery in the year the pack is salvaged, sourced from Greenwood [41], and
- is the ratio of the retail price to manufacturing cost, taken as 1.5 retail price equivalent.
2.9. Debt Financing and Interest Repayment
Given the high initial capital costs of electric buses, debt is becoming an important source of financing for electrification of bus fleets in Europe and globally. Globally, a large number of financial instruments exist for the electrification of bus fleets at preferential rates [43]. Private financial platforms have also increasingly become available, packaging financing with procurement, operations, maintenance and analytics as part of integrated offerings.
In Europe there are several financing options at the EU [44] as well as at the national levels [45]. Recent examples are the loans provided by the European Investment Bank (EIB) for the electrification of the bus fleets in Rotterdam in the Netherlands [46] and Valencia in Spain [47] for the purchase of hundreds of electric buses and associated charging infrastructure. While financing options vary significantly across regions, we do not consider regional variations here. Instead, as in Burnham et al. [15], we consider standard financing conditions of 5 years of loan duration, 12% down payment, and 6% rate of interest.
3. Results and Discussion
Our analysis reveals several interesting results related to the total cost of ownership of buses in Europe, the cost differences across countries, and the financial case for electrification in different European countries.
3.1. Total Cost of Ownership of Electric Buses in Europe
The parameters varied between the lower bounding and upper bounding costs are provided in Table 8. The parameters varied by country are the electricity prices and discount rates, with all other parameters held constant.
Table 8.
Parameters varied across lower and upper bounds.
The TCO for each country was calculated as a cash flow curve over the timeframe of analysis and then discounted to the Net Present Value in the first year for comparison purposes. In this form, the total cost of ownership of a 12 m bus including the 50 kW charging infrastructure in each European country is shown in Figure 2.
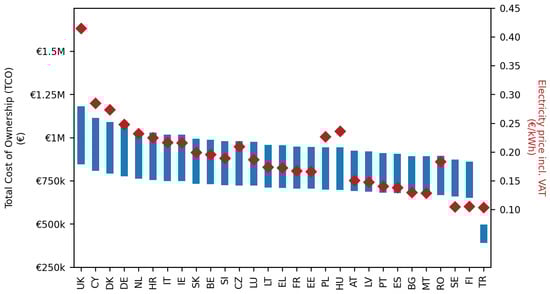
Figure 2.
Net Present Value of the total cost of ownership of a single 12 m battery electric bus including 50 kW charging infrastructure across the countries of Europe.
The Net Present Values of the TCO in the different countries are shown in descending order. The TCO is the highest in the UK and lowest in Türkiye. The electricity costs for industrial customers in 2024 are also shown in red per country.
In general, the TCO, as expected, shows a strong correlation with the cost of electricity. The calculated values are seen to be sensitive to the discount rate, as discussed by Razy-Yanuv and Meron [13]. The influence of the discount factor plays a significant role in a few special cases. In the UK, the higher discount rate (6.35%) in comparison with most European countries negates to some extent the consequences of extremely high electricity prices. A similar effect is seen in Türkiye, which has significantly lower TCO than Sweden and Finland, despite having similar electricity prices. Czechia, Poland, Hungary and Romania also benefit from higher discount rates, in each case negating the effects of higher electricity prices.
The bounding range of TCOs is also sensitive to the costs of electricity. Given the difference in annual driven distance (and battery capacity) between the upper and lower bounding cases, the range of TCOs is larger in Denmark, Cyprus and the UK than in Romania, Sweden, Finland and Türkiye. The upper bounds of bus TCO in the countries with lowest TCOs are comparable with the lower bounds of bus TCO of the countries with the highest TCOs.
3.2. Sensitivity of TCO per km of Operation
The TCO results when calculated per km of operation are sensitive to various input parameters. Figure 3 shows this sensitivity per country to 20% variation in the electricity costs, discount rates and contract duration. While the electricity costs and discount rate are specific to each country, vehicle lifetime is varied for all countries from 12 years (left) to 18 years (right). TCO/km increases with increasing electricity prices but decreases with increasing discount rate and shorter contract duration.
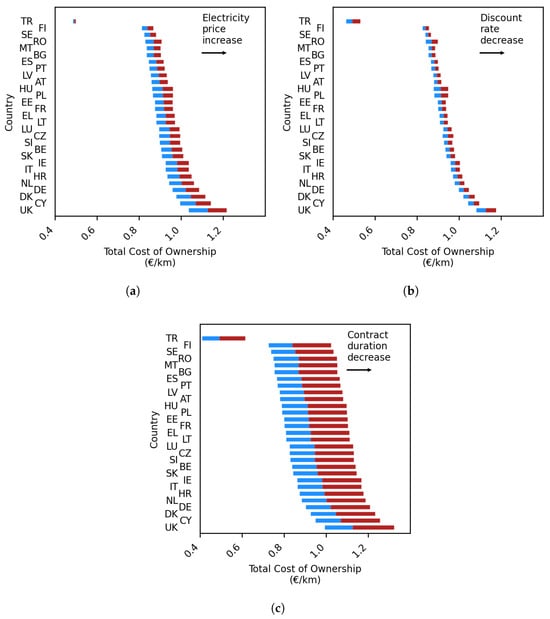
Figure 3.
Sensitivity of TCO/km results to 20% variation in: (a) electricity prices (range varies per country, TCO/km increases with increasing electricity cost) (b) discount rates (range varies per country, TCO/km reduces with increasing discount rate) and (c) contract durations (12 to 18 years across all countries, TCO/km reduces with increasing lifetime).
The sensitivity analysis reveals several interesting results. Firstly, the parameter to which the TCO/km is most sensitive is the duration of the contract. This sensitivity is not symmetric—decreasing the contract duration has a larger effect on increasing the TCO/km than an equivalent extension. Thus, while contract extension has a large influence on lowering the TCO/km, there are also diminishing returns.
Secondly, of the three parameters considered here, the TCO/km is least sensitive to variation in the discount rate. However, unlike with contract duration, the sensitivity to discount rates varies across different countries. Clearly, countries with a higher discount rate are subject to a proportionally higher change in the input parameter. It should be noted that higher discount rates generally represent a higher valuation of future costs and revenues in the near term compared to those in the long term and are thus a reflection of the uncertainty of the future [48]. It may be argued that countries with higher discount rates are also likely to experience more economic volatility, which could result in proportionally larger variation in discount rates in the future, due to which we have used this approach. Based on this, Türkiye, the UK, Romania, Hungary and Poland are more sensitive to discount rate changes than other countries in Europe.
Thirdly, the TCO/km shows intermediate sensitivity to electricity price variations. The 20% changes in electricity price aim to encompass the diversity of projections of future electricity prices seen in literature, for example in Liebensteiner et al. [49]. However, 20% does not cover extreme price shocks, as witnessed in 2022 due to the Russia-Ukraine war. In case of such price shocks, the TCO/km could change further. It is to be noted however, that electricity is sourced from diverse generation technologies including renewable sources and therefore is less subject to energy spikes that typically affect fossil fuel production and supply chains. As noted in [50], a future European grid with larger share of renewable generation will be insured from price shocks of this nature.
The TCO/km is also sensitive to other parameters not individually explored here, such as annual distance driven by the vehicle, battery capacity and battery prices, kWh/km factors and interest rates in financing. The annual distance driven by the vehicle is correlated with battery capacity. Typically, buses with larger batteries and range are procured for missions where they are required to drive longer distances. These batteries, as a result of larger batteries, have higher purchase costs. Since they are heavier, they also consume more energy per driven kilometer. Driving distance, as a parameter, can therefore not easily be isolated. For this reason, we have considered these factors to vary together and used bounding ranges rather than single factor ceteris paribus sensitivity analysis. Financing interest rates are highly dependent on project and operator credit ratings, and have been left out of scope of our analysis.
3.3. Risks and Uncertainties in Bus TCO Calculations
Several risks associated with the estimation of the TCO are not quantifiable. These risks affect various stages of the process of electrification. Risks at the construction phase include non-availability of land for depot expansion in dense urban areas, extended delays in securing grid connections and delay in financing. At the operational level risks are incorrect matching of buses with routes, under-or-oversizing of battery capacities in buses, under-or-oversizing of charging infrastructure and scarcity of bus drivers. At the end-of-life, battery oversupplies, shortage of recycling capacity, logistic bottlenecks for second life battery transportation and concerns about safe storage of batteries are all legitimate risks to the existence and operation of a secondhand battery market as envisioned in this study. At every stage, there is the risk that lack of human resource capacity to adjust to the new paradigm of electric bus operations leads to sub-optimal outcomes.
Added to these are also uncertainties related to the future prices of electricity, future developments in battery technology and future cost reductions in battery prices.
3.4. Comparison with Diesel
Although the comparison of TCOs across the different countries of Europe describe the relative costs per country, they do not provide insight into the comparison of the TCO of electric buses to alternative powertrains within each country. This comparison is particularly important to assess the financial competiveness of battery electric buses with both the status quo as well as with other alternative powertrains. The status quo power source for buses in Europe is predominantly diesel, which powers 89.2% of buses on European roads [2]. The major other power sources at the European level, aside from battery electric (2.5%), include petrol (0.4%), plug-in hybrid (0.5%), hybrid-electric (2.2%) and natural gas (4.2%). Other powertrains like liquefied petroleum gas (LPG) and Fuel Cell Electric Vehicles (FCEV) also exist in the operational fleet, though in very low numbers. While the share of bus electrification is higher in individual countries (over 10% in Denmark, Ireland, Luxembourg and the Netherlands), the main power source that electrification of buses aims to, and is expected to replace is diesel.
In Figure 4, we compared the average TCO per country in Europe with the mean price of diesel (€/liter) in 2024. Diesel prices were sourced from the European Commission [51] for the EU, from the UK Government [52] for the UK (conversion rate £1 = 1.19) and from fuelo.net [53] for Türkiye (conversion rate 1 TRY = €0.027). All values are the “pump prices” i.e., they reflect the cost seen by the customer including taxes and VAT.
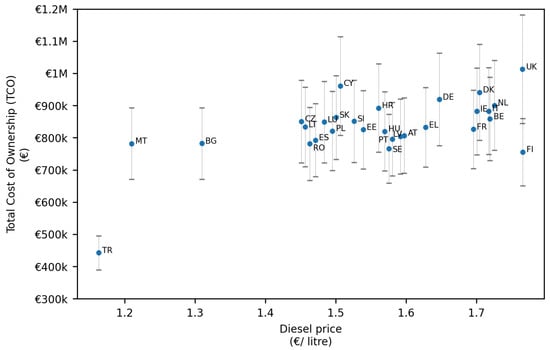
Figure 4.
Net Present Value of the total cost of ownership of a single 12 m battery electric bus compared with diesel unit price across the countries of Europe.
The results show a clustering of most European values, where the TCO lies in the range of €750k to €950k and diesel prices in the range of €1.45 to €1.75 per liter. A few outliers are clearly visible. The UK, with both high TCO and high diesel costs, best exemplifies the case where both existing bus operation as well as electrification are expensive. In contrast, Finland and to a lesser extent Belgium, France, and Greece, with lower bus TCO and among the highest costs of diesel, are likely to have financially favorable cases for electrification. At the other end, Türkiye displays low costs for both diesel as well as electrification. In such a case, although electrification is more economically viable than in other countries, it may not necessarily be economically competitive with respect to the diesel status quo.
Malta and Bulgaria show a case where diesel is inexpensive while the electric bus TCO is similar to many other European countries. In Cyprus, the TCO of electric buses is among the highest in Europe, while diesel is similarly priced to other European countries. Both these cases suggest that there may not be a strong financial case for bus electrification in these countries.
A limitation of this analysis is that we compare the TCO of electric buses with diesel costs rather than the TCO of diesel buses. However, calculating the TCO of diesel buses is less straightforward since a large share of the assets (the operating bus fleet) has been purchased previously and have depreciated in value. Our purpose is not to compare the costs of running buses on electricity and diesel on a one-to-one basis (as has been done previously in [5,9,12,13]) but rather to identify the European countries presenting the most favorable conditions for bus electrification. We expect the current analysis to be sufficient for this.
3.5. Limitations of This Work
A clear limitation of this work is that we do not present a complete picture of the business case for electric buses. Several factors that significantly affect the business case of electrification are country- and sometimes site-specific, such as national subsidies, labor cost and additional cost of training drivers, availability and cost of grid capacity, land cost and availability for depot expansion, and the revenues from public bus operation. However, we expect the analysis to provide a broad overview of the fundamental costs of bus procurement and operation across the countries analyzed.
There are a wide range of subsidies and supporting policies in Europe. These vary from country to country and sometimes also at the sub-national level, as in Germany. These subsidies change continuously in response to market conditions. The wide range of subsidies, non-standard application at the national level, and changeable nature of subsidies are the reasons why subsidies have been left out of the scope of this study.
On the broader question of inclusion of labor costs, the bus TCO literature is split, in that O’Donovan et al. [7], Triatmojo et al. [10] include labor costs, while Lajunen and Lipman [5], Potkány et al. [6], Razy-Yanuv and Meron [13] do not. We take the latter approach. As discussed in Meishner and Sauer [8], the wage differences across European cities are large and do not enable easy comparison. Since our focus is on the vehicle technology rather than the labor, we omit labor costs, which nevertheless form a significant share of the actual costs of bus operation.
Another limitation is that the study looks at the historic rather than projected data of the future. An example of the consequences of this is seen in the recent change in the biofuels mandate in Sweden. As part of this change, the obligation to blend biofuels in diesel was reduced from 30.5% to 6% (to be later increased to 10% in 2025) [54]. This change is expected to lower the costs of diesel, thus reducing the comparative financial attractiveness of bus electrification. Similar unpredictable but impactful policy shifts affecting both the TCO of electric buses and diesel prices have not been considered here. Similarly, changes in the discount rate of the member states, to which the TCO is highly sensitive, have also not been considered. Though the future is uncertain, we expect that the economic fundamentals used in the calculations here to present a reasonably accurate overview of the current status, and a valid starting position from where to watch for future trends.
3.6. Directions for Future Research
We recommend that future studies focus on addressing the limitations of this work:
- Assessing the different subsidy schemes in the different European countries and regions to provide more accurate TCO calculation for specific locations.
- Including grid capacity/connection costs, which are very location dependent, even within countries.
- Conducting a more extensive sensitivity analysis on the cost drivers aside from electricity cost, discount rate and contract duration that we have considered here. Scenario analysis of future electricity costs would be particularly valuable.
- Consider en route charging with pantograph or trolleybus configurations to consider a wider range of technical choices for bus transport systems.
4. Conclusions
In this study, we present the total cost of ownership (TCO) of battery electric buses across Europe (the EU27 + UK + Türkiye). We present a comprehensive review of the assumptions and data used for the TCO calculation of electric buses in literature and show how the TCO changes across Europe, from the UK, where the TCO is the highest, to Türkiye, where it is the lowest. The sensitivity of the TCO per km of operation per country to electricity prices, discount rates and contract durations is quantified, and major risks to TCO calculation are discussed at length.
We also compare the calculated TCO for electric buses with diesel prices in each country to identify where the financial case for electrification is most competitive relative to diesel, which powers around 90% of European buses. We identify countries where the financial case for bus electrification seems strongest (Finland, France, Belgium, and Greece) and the countries where it seems the weakest (Malta, Bulgaria, and Cyprus). We discuss the limitations of this work, mainly (1) the incomplete assessment of actual costs at the local level owing to the lack of consideration of factors like subsidies and availability/cost of grid connections, and (2) the lack of future cost projections.
The study is expected to be of interest for operators, academics, policy makers, and financial investors in bus electrification.
Author Contributions
Conceptualization, methodology, formal analysis, writing—original draft preparation: R.G.; data collection: R.G. and D.v.R., writing—review and editing: D.v.R. and S.v.B. All authors have read and agreed to the published version of the manuscript.
Funding
This research was funded by the European Horizon project, eBRT2030 (https://ebrt2030.eu/) under project number 101095882.
Data Availability Statement
The original contributions presented in this study are included in the article. Further inquiries can be directed to the corresponding author.
Conflicts of Interest
The authors declare no conflicts of interest.
Abbreviations
The following abbreviations are used in this manuscript:
| AC | Alternating Current |
| ACEA | European Automobile Manufacturers’ Association |
| CNG | Compressed Natural Gas |
| DC | Direct Current |
| GBP | Great Britain Pound |
| GVW | Gross Vehicle Weight |
| LCC | Life-Cycle Cost |
| LPG | Liquefied Petroleum Gas |
| EU | European Union |
| TCO | Total Cost of Ownership |
| TRY | Turkish Lira |
| UK | United Kingdom |
| USA | United States of America |
| VAT | Value Added Tax |
References
- Transport. Climate Change 2022—Mitigation of Climate Change, 1st ed.; Intergovernmental Panel on Climate Change (IPCC), Ed.; Cambridge University Press: Cambridge, UK, 2023; pp. 1049–1160. [Google Scholar] [CrossRef]
- ACEA. Vehicles on European Roads; Technical Report; ACEA: Brussels, Belgium, 2025. [Google Scholar]
- European Environment Agency. Reducing Greenhouse Gas Emissions from Heavy-Duty Vehicles in Europe; Publications Office: Luxembourg, 2022. [Google Scholar]
- Aldenius, M.; Mullen, C.; Pettersson-Löfstedt, F. Electric buses in England and Sweden—Overcoming barriers to introduction. Transp. Res. Part Transp. Environ. 2022, 104, 103204. [Google Scholar] [CrossRef]
- Lajunen, A.; Lipman, T. Lifecycle cost assessment and carbon dioxide emissions of diesel, natural gas, hybrid electric, fuel cell hybrid and electric transit buses. Energy 2016, 106, 329–342. [Google Scholar] [CrossRef]
- Potkány, M.; Hlatká, M.; Debnár, M.; Hanzl, J. Comparison of the Lifecycle Cost Structure of Electric and Diesel Buses. Naše More 2018, 65, 270–275. [Google Scholar] [CrossRef]
- O’Donovan, A.; Firth, J.; McKerracher, C. Electric Buses in Cities: Driving Towards Cleaner Air and Lower CO2; Technical Report; Bloomberg New Energy Finance: London, UK, 2018. [Google Scholar]
- Meishner, F.; Sauer, D.U. Technical and economic comparison of different electric bus concepts based on actual demonstrations in European cities. IET Electr. Syst. Transp. 2020, 10, 144–153. [Google Scholar] [CrossRef]
- Kim, H.; Hartmann, N.; Zeller, M.; Luise, R.; Soylu, T. Comparative TCO Analysis of Battery Electric and Hydrogen Fuel Cell Buses for Public Transport System in Small to Midsize Cities. Energies 2021, 14, 4384. [Google Scholar] [CrossRef]
- Triatmojo, A.; Safrudin, A.; Francisco, P.; Mega, K.; Ray, M. Evaluation of Factors That Affect Total Cost of Ownership in Support of Transjakarta’s Electric Bus Adoption Plans; Technical Report; International Council on Clean Transportation (ICCT): Washington, DC, USA, 2023. [Google Scholar]
- Jagiełło, A.; Wołek, M.; Bizon, W. Comparison of Tender Criteria for Electric and Diesel Buses in Poland—Has the Ongoing Revolution in Urban Transport Been Overlooked? Energies 2023, 16, 4280. [Google Scholar] [CrossRef]
- Boratyńska-Karpiej, E.; Giziński, D.; Kiwiel, A.; Lorczyk, M.; Engel, P. Analysis of the Impact of Changing Propulsion Systems in Urban Transport Buses Based on EU-Funded Projects; Technical Report; Centre for EU Transport Projects: Warsaw, Poland, 2024. [Google Scholar]
- Razy-Yanuv, E.; Meron, N. Early transition to cleaner bus fleets: Benefits, costs, and policy evaluation of alternatives from a life cycle perspective. Clean. Environ. Syst. 2024, 12, 100172. [Google Scholar] [CrossRef]
- Dodd, N.; Donatello, S.; Cordella, M. Level(s) Indicator 6.1: Life Cycle Costs User Manual: Introductory Briefing, Instructions and Guidance; Technical Report; European Commission Joint Research Centre (JRC): Seville, Spain, 2021. [Google Scholar]
- Burnham, A.; Gohlke, D.; Rush, L.; Stephens, T.; Zhou, Y.; Delucchi, M.; Birky, A.; Hunter, C.; Lin, Z.; Ou, S.; et al. Comprehensive Total Cost of Ownership Quantification for Vehicles with Different Size Classes and Powertrains; Technical Report ANL/ESD-21/4; Argonne National Laboratory: Lemont, IL, USA, 2021. [Google Scholar] [CrossRef]
- Haddad, M.; Mansour, C. Techno-Economic Assessment of Alternative-Fuel Bus Technologies Under Real Driving Conditions in a Developing Country Context. World Electr. Veh. J. 2025, 16, 337. [Google Scholar] [CrossRef]
- UITP. A Study on the Second Hand City Bus Market in Europe; Technical Report; International Association of Public Transport (UITP) and European Investment Bank (EIB): Brussels, Belgium, 2021. [Google Scholar]
- Serrato, D.A.; Tibaquirá, J.E.; López, J.C.; Castillo, J.C.; Giraldo, M.; Quirama, L.F. Evaluating electric vehicle and emission standards improvement in a Latin American city. Green Energy Intell. Transp. 2025, 100284. [Google Scholar] [CrossRef]
- European Parliament. Regulation (EC) No 1370/2007 of the European Parliament and of the Council of 23 October 2007 on Public Passenger Transport Services by Rail and by Road and Repealing Council Regulations (EEC) Nos 1191/69 and 1107/70. 2017. Available online: https://eur-lex.europa.eu/legal-content/EN/TXT/PDF/?uri=CELEX:02007R1370-20171224 (accessed on 27 May 2025).
- CROW. Staat van Het Openbaar Vervoer 2023; Technical Report; CROW: Ede, The Netherlands, 2024. [Google Scholar]
- Sustainable Bus. BYD Has Been Awarded Over 140 e-Buses in Naples (with Iveco Winning 46 Units). 2023. Available online: https://www.sustainable-bus.com/news/anm-naples-tender-electric-buses-iveco-byd/ (accessed on 6 February 2025).
- AutoBus Web. Gara elettrici ANM Napoli: Due lotti deserti, a Iveco il terzo. BYD fa il pieno. 2023. Available online: https://www.autobusweb.com/gara-elettrici-anm-napoli-primi-due-lotti-deserti-a-iveco-il-terzo-byd-fa-il-pieno/ (accessed on 6 February 2025).
- IVECO. Streetway 12 m City Bus Low Floor-Full Electric; IVECO: Turin, Italy, 2023. [Google Scholar]
- BYD Europe. The All-New BYD eBUS B12; BYD Europe: Schiedam, The Netherlands, 2024. [Google Scholar]
- Ebusco. Ebusco 3.0 Specsheet; Ebusco: Deurne, The Netherlands, 2023. [Google Scholar]
- Tettero, W.; Verdegaal, B.; van Zante, A.; Idema, H.J. Kosten Laadinfrastructuur Logistiek Laden op Privaat Terrein; Technical Report; Nationale Agenda Laadinfrastructuur (NAL): Utrecht, The Netherlands, 2022. [Google Scholar]
- Lanz, L.; Noll, B.; Schmidt, T.S.; Steffen, B. Comparing the levelized cost of electric vehicle charging options in Europe. Nat. Commun. 2022, 13, 5277. [Google Scholar] [CrossRef] [PubMed]
- Tsiropoulos, I.; Siskos, P.; Capros, P. The cost of recharging infrastructure for electric vehicles in the EU in a climate neutrality context: Factors influencing investments in 2030 and 2050. Appl. Energy 2022, 322, 119446. [Google Scholar] [CrossRef]
- Wang, S.; Lu, C.; Liu, C.; Zhou, Y.; Bi, J.; Zhao, X. Understanding the Energy Consumption of Battery Electric Buses in Urban Public Transport Systems. Sustainability 2020, 12, 10007. [Google Scholar] [CrossRef]
- Federal Ministry for the Environment, Nature Conservation, Nuclear Safety and Consumer Protection, Germany. Bekanntmachung des Schätzwertes der Anrechenbaren Energetischen Menge Elektrischen Stroms für Ein Reines Batterieelektrofahrzeug Gemäß § 7 Absatz 3 der Verordnung zur Festlegung Weiterer Bestimmungen zur Treibhausgasminderung bei Kraftstoffen. 2021. Available online: https://www.bundesanzeiger.de/pub/publication/M1YgTca0pbD7vs1VeaM/content/M1YgTca0pbD7vs1VeaM/BAnz%20AT%2016.12.2021%20B3.pdf?inline (accessed on 27 May 2025).
- Federal Ministry for the Environment, Nature Conservation, Nuclear Safety and Consumer Protection, Germany. Bekanntmachung der Schätzwerte der Anrechenbaren Energetischen Menge Elektrischen Stroms für Ein Reines Batterieelektrofahrzeug Gemäß § 7 Absatz 3 der Verordnung zur Festlegung Weiterer Bestimmungen zur Treibhausgasminderung bei Kraftstoffenbanz. 2023. Available online: https://www.umweltbundesamt.de/sites/default/files/medien/366/dokumente/banz_at_28.08.2023_b2.pdf (accessed on 27 May 2025).
- Eudy, L.; Prohaska, R.; Kelly, K.; Post, M. Foothill Transit Battery Electric Bus Demonstration Results; Technical Report NREL/TP-5400-65274; National Renewable Energy Laboratory: Golden, CO, USA, 2016. [Google Scholar] [CrossRef]
- Aamodt, A.; Cory, K.; Coney, K. Electrifying Transit: A Guidebook for Implementing Battery Electric Buses; Technical Report NREL/TP-7A40-76932; Argonne National Laboratory: Lemont, IL, USA, 2021. [Google Scholar] [CrossRef]
- SOR. SOR NS 12 Electric Bus Spec Sheet. 2019. Available online: https://www.sor.cz/wp-content/uploads/2019/11/NS_12_electric_ANG_NEW_LoRes_23.10.2019.pdf (accessed on 27 May 2025).
- Eurostat. Electricity Prices for Non-Household Consumers—bi-Annual Data (from 2007 Onwards). 2025. Available online: https://ec.europa.eu/eurostat/databrowser/product/page/NRG_PC_205 (accessed on 6 February 2025).
- UK Government. Gas and Electricity Prices in the Non-Domestic Sector; UK Government: London, UK, 2025. [Google Scholar]
- Smith, M.; Jagtenberg, H.; Lam, L.; Torres, P.; Gorner, M.; Ansarin, M.; van Nuffel, L. Study on Energy Prices and Costs: Evaluating Impacts on Households and Industry: 2023 Edition; Publications Office of the Euroepan Union: Luxembourg, 2024. [Google Scholar]
- European Commission. Reference and Discount Rates—European Commission; European Commission: Brussels, Belgium, 2024. [Google Scholar]
- Central Bank of the Republic of Türkiye. TCMB—Rediscount and Advance Interest Rates; Central Bank of the Republic of Türkiye: Ankara, Türkiye, 2025. [Google Scholar]
- European Parliament. Regulation (EU) 2023/1542 of the European Parliament and of the Council of 12 July 2023 Concerning Batteries and Waste Batteries, Amending Directive 2008/98/EC and Regulation (EU) 2019/1020 and Repealing Directive 2006/66/EC. 2023. Available online: https://eur-lex.europa.eu/legal-content/EN/TXT/PDF/?uri=CELEX:32023R1542 (accessed on 6 February 2025).
- Greenwood, D. Electrical Energy Storage Roadmap 2020; Technical Report; Advanced Propulsion Centre UK: Warwick, UK, 2021. [Google Scholar]
- Neubauer, J.; Pesaran, A. NREL’s PHEV/EV Li-ion Battery Secondary-Use Project. In Proceedings of the Advanced Automotive Batteries Conference, Orlando, FL, USA, 17–21 May 2010. [Google Scholar]
- Moon-Miklaucic, C.; Maassen, A.; Li, X.; Castellanos, S. Financing Electric and Hybrid-Electric Buses: 10 Questions City Decision-Makers Should Ask; Technical Report; World Resources Institute (WRI): Washington, DC, USA, 2019. [Google Scholar]
- UITP. EU Funding Opportunities for Local PUBLIC Transport; UITP: Brussels, Belgium, 2025. [Google Scholar]
- UITP. National (Non-EU) Financial Schemes for Clean Bus Fleet Renewals 2021; UITP: Brussels, Belgium, 2021. [Google Scholar]
- European Investment Bank (EIB). European Support for Electric Buses in Rotterdam Public Transport; European Investment Bank (EIB): Luxembourg, 2019. [Google Scholar]
- European Investment Bank (EIB). Spain: EIB and EMT Valencia Sign €69 Million Loan to Grow Zero-Emissions Urban Bus Fleet; European Investment Bank (EIB): Luxembourg, 2024. [Google Scholar]
- Clacher, I.; Duboisée de Ricquebourg, A.; Freeman, M.C.; Keating, C. The Theory and Practice of Discounting in Financial Reporting Under IFRS; EFRAG: Brussels, Belgium, 2022. [Google Scholar]
- Liebensteiner, M.; Ocker, F.; Abuzayed, A. High electricity price despite expansion in renewables: How market trends shape Germany’s power market in the coming years. Energy Policy 2025, 198, 114448. [Google Scholar] [CrossRef]
- Navia Simon, D.; Diaz Anadon, L. Power price stability and the insurance value of renewable technologies. Nat. Energy 2025, 10, 329–341. [Google Scholar] [CrossRef]
- European Commission. Weekly Oil Bulletin; European Commission: Brussels, Belgium, 2025. [Google Scholar]
- UK Government. Weekly Road Fuel Prices; UK Government: London, UK, 2025. [Google Scholar]
- fuelo.net. Current Fuel Prices in Turkey. 2025. Available online: https://tr.fuelo.net (accessed on 30 May 2025).
- European Parliament. Sweden’s Climate Action Strategy; Technical Report; European Parliament: Strasbourg, France, 2024. [Google Scholar]


Disclaimer/Publisher’s Note: The statements, opinions and data contained in all publications are solely those of the individual author(s) and contributor(s) and not of MDPI and/or the editor(s). MDPI and/or the editor(s) disclaim responsibility for any injury to people or property resulting from any ideas, methods, instructions or products referred to in the content. |
© 2025 by the authors. Published by MDPI on behalf of the World Electric Vehicle Association. Licensee MDPI, Basel, Switzerland. This article is an open access article distributed under the terms and conditions of the Creative Commons Attribution (CC BY) license (https://creativecommons.org/licenses/by/4.0/).