
Balancing Profitability and Sustainability in Electric Vehicles Insurance: Underwriting Strategies for Affordable and Premium Models


Abstract
1. Introduction
1.1. Problem Statement
1.2. Research Incentives and Motivation
- Regulatory and Industry Pressure: The insurance industry is increasingly required to disclose Scope 3 emissions under PCAF guidelines, forcing insurers to integrate carbon metrics into underwriting [3].
- Risk Management Optimization: With EV adoption growing, insurers must refine risk models to differentiate between low-risk, high-efficiency EVs and high-risk, high-carbon-emission EVs [7].
- Sustainability Commitments: Insurers such as Swiss Re and Allianz have pledged to achieve net-zero emissions in their portfolios, highlighting the need for underwriting policies that incentivize low-carbon EV usage [8].
1.3. Research Purpose and Objectives
- To identify key underwriting risk factors for EVs, including accident risk, repair costs, battery safety, and driver behavior.
- To assess the impact of PCAF implementation on EV underwriting, particularly regarding energy efficiency and electricity grid carbon intensity.
- To develop an insurance pricing model that integrates traditional risk assessment with carbon attribution methodologies, optimizing for both underwriting profitability and alignment with climate disclosure standards such as PCAF.
- To conduct a sensitivity analysis on underwriting strategies, evaluating how premium adjustments vary under different accident risk, repair cost, and carbon pricing scenarios.
2. Literature Review
2.1. Factors Employed in Underwriting EV Insurance: A Categorized Approach
2.1.1. Vehicle-Related Factors
2.1.2. Driver-Related Factors
2.1.3. Environment-Related Factors
2.2. Key Factors Influencing EV Insurance Underwriting
2.3. Insurance Cost Differentials Between Electric and Internal Combustion Engine Vehicles
2.4. The Relationship Between Higher-Priced EVs, Higher Energy Efficiency, and Lower Accident Risk
2.5. Underwriting Strategies for Affordable and Premium EVs
2.6. No Insurance Company in the World Considers Indirect Carbon Emission as a Factor in Insurance Underwriting for EVs
2.7. The Impact of GHG Protocol, Scope 3 Emissions, and PCAF on EV Insurance: Balancing Premium Income and Carbon Credit Costs
2.8. Comparison of Existing Models and Originality of Proposed Framework
2.9. Summary of the Literature Review
- EVs produce zero direct emissions but have significant indirect carbon footprints from electricity generation and battery manufacturing.
- Insurance companies do not currently account for indirect emissions in EV pricing, focusing instead on repair costs, battery risks, and driver behavior.
- Higher-priced EVs are generally more energy-efficient, safer, and lower-risk, leading to differentiated underwriting strategies for premium and affordable EVs.
- PCAF provides a carbon accounting framework, but most insurers have yet to integrate emissions tracking into their pricing models.
- Regulatory pressures may force insurers to disclose and manage carbon liabilities, potentially increasing underwriting costs for high-emission portfolios.
- As sustainability and carbon accountability continue to shape financial markets, insurers may need to reevaluate traditional underwriting models to align with future regulatory and environmental expectations.
3. Methodology
3.1. Scenario Analysis in the Insurance Industry
3.2. Sensitivity Analysis of Premiums
3.3. Climate Risk Assessment and Scenario Analysis
3.4. Operational Risk and Scenario Analysis
3.4.1. Identifying Sensitivity Variables
3.4.2. Mapping Pricing Factors to the Risk Categories
3.4.3. Determining Sensitivity Scenarios
3.4.4. Defining Key Scenarios
3.4.5. Assigning Weights to Each Factor
4. The Results of Sensitivity Analysis After Conduct Rounds of MDS
4.1. Expert Panel Composition
4.2. Five-Round Modified Delphi Process
4.2.1. Literature-Based Framework
4.2.2. The 1st MDS: Expert Validation
4.2.3. Analysis and Feedback
4.2.4. The 2nd MDS: Consensus Refinement
4.3. Computing Impact in Risk Categories
5. Sensitivity Analysis of Insurance Premiums for Electric Vehicles: Key Insights
5.1. Key Insights from Sensitivity Analysis
5.2. Premium EVs (L1 and M2) Exhibit Lower Risk and Stable Premiums
5.3. Budget EVs (H1 and M1) Face Greater Financial and Risk Exposure
6. Recommendations for Insurers
6.1. Prioritize Premium EVs (L1 and M2) for Stability and Risk Optimization
6.2. Selective Underwriting for Budget EVs (H1 and M1)
6.2.1. When to Underwrite Budget EVs (H1 and M1)
6.2.2. When to Avoid Budget EVs (H1 and M1)
6.3. Alternative Approach: Incentive-Based Underwriting
6.3.1. Incentive Mechanisms for Budget EV Insurance (H1 and M1)
6.3.2. Incentive Mechanisms for Premium EV Insurance (L1 and M2)
6.4. Final Verdict: Premium EVs (L1 and M2) Are the Optimal Choice for Profitability and Sustainability
- Prioritize premium EVs for their stable risk profile and lower carbon liabilities, ensuring predictable and profitable underwriting.
- Adopt data-driven underwriting for budget EVs, integrating risk-based pricing and carbon-conscious policies to optimize financial sustainability.
- Leverage PCAF-aligned pricing strategies, ensuring that carbon attribution is fully embedded into underwriting models, allowing insurers to balance risk, compliance, and climate impact.
- Incentivize sustainable driving behaviors through telematics, green repairs, and clean-energy charging discounts, fostering long-term policyholder engagement and retention.
7. Conclusions and Future Research Suggestions
7.1. Conclusions
7.2. Future Research Suggestions
Author Contributions
Funding
Institutional Review Board Statement
Informed Consent Statement
Data Availability Statement
Conflicts of Interest
References
- Lutsey, N.; Nicholas, M. Update on Electric Vehicle Costs in the United States Through 2030; Working Paper 2019-06; The International Council on Clean Transportation (ICCT): Washington, DC, USA, 2019. [Google Scholar]
- McDonnell, K.; Sheehan, B.; Murphy, F.; Guillen, M. Are Electric Vehicles Riskier? A comparative study of driving behaviour and insurance claims for internal combustion engine, hybrid and electric vehicles. Accid. Anal. Prev. 2024, 207, 107761. [Google Scholar] [CrossRef]
- Warmerdam, W.; Kaynar, E. Dutch Financial Sector Financed Emissions—Financed Emissions from Corporate Finance Portfolios; Profundo: Amsterdam, The Netherlands, 2022. [Google Scholar]
- Wu, G.; Inderwildi, O.R.; King, D.A. Electric vehicles: Performance, life cycle, and sustainability considerations. Renew. Sust. Energ. Rev. 2020, 132, 109841. [Google Scholar]
- Weiss, M.; Winbush, T.; Newman, A.; Helmers, E. Energy consumption of electric vehicles in Europe. Sustainability 2024, 16, 7529. [Google Scholar] [CrossRef]
- Hasan, S.; Simsekoglu, Ö. The role of psychological factors on vehicle kilometer travelled (VKT) for battery electric vehicle (BEV) users. Res. Transp. Econ. 2020, 82, 100880. [Google Scholar] [CrossRef]
- Wang, L. Opportunities and Challenges in the Chinese Electric Vehicle Market: Insights for (Re) Insurers; Cologne University: Cologne, Germany, 2024. [Google Scholar]
- LaMonaca, S.; Matsuo, T.; Mitchell, J. Charting the Course to Climate-Aligned Finance, Five Barriers to Alignment and How a Sectoral Approach Can Help. Available online: https://rmi.org/insight/navigating-five-barriers-to-climate-aligned-finance/ (accessed on 3 March 2025).
- JKJ Insurance Brokerage. Why Electric Vehicle Insurance Costs More: Key Factors and How to Save. Available online: https://jkj.com/blog/why-electric-vehicle-insurance-costs-more-key-factors-and-how-to-save (accessed on 2 March 2025).
- AMT Insurance Solutions. EV Insurance Providers Adapt to Changing Market Conditions. Available online: https://amtinsurancesolutions.com (accessed on 5 March 2025).
- Swiss Re. Insuring Electric Vehicles: Adapting Underwriting Strategies. Available online: https://www.swissre.com/institute/research/sigma-research/Economic-Insights/insuring-electric-vehicles.html (accessed on 11 March 2025).
- Sharma, I.; Bansal, P.; Dua, R. Breaking down barriers: Emerging issues on the pathway to full-scale electrification of the light-duty vehicle sector. Energy 2025, 326, 136230. [Google Scholar] [CrossRef]
- PCAF. The Global GHG Accounting and Reporting Standard for the Financial Industry. Available online: https://carbonaccountingfinancials.com (accessed on 8 April 2025).
- Castillo-Calderón, J.; Cordero-Moreno, D.A.; Larrodé Pellicer, E. A model-driven approach for estimating the energy performance of an electric vehicle used as a taxi. Energies 2024, 17, 6053. [Google Scholar] [CrossRef]
- Wang, H.; Mieth, R.; Konstantinou, J. Advancements in EV Battery Management Systems and Fire Risk Reduction. J. Automot. Eng. 2019, 35, 210–225. [Google Scholar]
- International Energy Agency (IEA). The Role of Electric Vehicles in Decarbonizing Transport. Available online: https://www.iea.org (accessed on 2 March 2025).
- U.S. Department of Energy. Electric Vehicles and Emissions Reduction. Available online: https://www.energy.gov (accessed on 20 March 2025).
- International Council on Clean Transportation (ICCT). Effects of Battery Manufacturing on EV Lifecycle Emissions. Available online: https://theicct.org (accessed on 2 March 2025).
- CarbonBrief. Factcheck: How Electric Vehicles Help to Tackle Climate Change. Available online: https://www.carbonbrief.org (accessed on 2 March 2025).
- Klopott, M.; Urbanyi-Popiolek, I. The insurance business perspective on the risk of transporting electric vehicles by sea. Eur. Res. Stud. 2024, 27, 910–928. [Google Scholar] [CrossRef]
- Yearick, K.; Herman, P.; Zavon, D. Electric vehicle car-sharing insurance: Risk factors vs. carbon considerations. J. Transp. Econ. 2023, 16, 31–49. [Google Scholar]
- Bhide, S.; Sengupta, A. Net-Zero commitments in the insurance sector: Are underwriting practices evolving? Clim. Risk. Insur. 2024, 11, 88–107. [Google Scholar]
- Ayodele, O.; Mustapa, S. Sustainability and risk management in the insurance sector: A review of carbon considerations. J. Risk. Insur. 2020, 87, 215–232. [Google Scholar]
- Siragusa, C.; Tumino, A.; Mangiaracina, R.; Perego, A. Electric vehicles performing last-mile delivery in B2C e-Commerce: An economic and environmental assessment. Int. J. Sustain. Transp. 2022, 16, 22–33. [Google Scholar] [CrossRef]
- Jin, L.; Searle, S.; Lutsey, N. Evaluation of State-Level US Electric Vehicle Incentives; White Paper; The International Council on Clean Transportation (ICCT): Washington, DC, USA, 2014. [Google Scholar]
- Ayetor, G.K.; Opoku, R.; Sekyere, C.K.K. The Cost of a Transition to Electric Vehicles in Africa: A Case Study of Ghana. Case Stud. Transp. Pol. 2022, 12, 356–368. [Google Scholar] [CrossRef]
- Haddadian, G.; Khodayar, M.; Shahidehpour, M. Accelerating the Global Adoption of Electric Vehicles: Barriers and Drivers. Electr. J. 2015, 28, 23–36. [Google Scholar] [CrossRef]
- Greenhouse Gas Protocol Standard. The Greenhouse Gas Protocol. 2011. Available online: http://www.ghgprotocol.org/standards (accessed on 2 March 2025).
- Task Force on Climate-related Financial Disclosures (TCFD). Recommendations of the Task Force on Climate-Related Financial Disclosures, Final Report. 2017. Available online: https://www.fsb-tcfd.org (accessed on 11 March 2025).
- Verra. Verified Carbon Standard (VCS) Program. Available online: https://verra.org (accessed on 11 April 2025).
- International Financial Reporting Standards (IFRS). IFRS S2 Climate-Related Disclosures. Available online: https://www.ifrs.org/issued-standards/ifrs-sustainability-standards-navigator/ifrs-s2-climate-related-disclosures/ (accessed on 8 April 2025).
- Rickayzen, B.D. A sensitivity analysis of the premiums for a permanent health insurance (PHI) model. J. Actuar. Pract. 2001, 9, 189–227. [Google Scholar]
- The Geneva Association. Climate Change Risk Assessment for the Insurance Industry. Available online: https://www.genevaassociation.org/publication/climate-change-and-environment/climate-change-risk-assessment-insurance-industry (accessed on 11 March 2025).
- Vyskočil, M. Scenario analysis approach for operational risk in insurance companies. Acta VŠFS-Ekon. Stud. Anal. 2020, 14, 153–165. [Google Scholar] [CrossRef]
- Asian Development Bank. Electric Vehicles and Battery Safety: Technical and Policy Considerations; Asian Development Bank: Manila, Philippines, 2011; Available online: https://www.adb.org (accessed on 5 March 2025).
- Mooren, L.; Shuey, R. Systems thinking in road safety management. J. Road Saf. 2024, 32, 63–73. [Google Scholar] [CrossRef]
- Swiss Re. Assessing automotive safety: The Role of ADAS and Crash-Test Ratings in Insurance Models; Swiss Re: Zurich, Switzerland, 2023; Available online: https://www.swissre.com (accessed on 11 March 2025).
- National Association of Mutual Insurance Companies (NAMIC). Trends in Electric Vehicle Insurance and Risk Assessment. Available online: https://www.namic.org (accessed on 5 March 2025).
- Haghani, M.; Coughlan, M.; Crabb, B.; Dierickx, A.; Feliciani, C.; van Gelder, R. Contemporary Challenges in Crowd Safety Research and Practice, and a Roadmap for the Future: The Swiss Cheese Model of Crowd Safety and the Need for a Vision Zero Target. 8 May 2023. Available online: https://ssrn.com/abstract=4440639 (accessed on 5 March 2025).
- Asian Development Bank. The Effects of Cold Weather on EV Performance and Insurance Claims. ADB Energy Studies. Available online: https://www.adb.org/what-we-do/topics/energy (accessed on 5 March 2025).
- Mo, L.; Zhai, Y.; Lu, X. Establishing a low-carbon technology finance mechanism: Asian Development Bank experiences on climate technology finance center. In The Impact of the Paris Agreement on Low-Carbon Technologies; Springer Nature: Singapore, 2017; pp. 537–565. [Google Scholar]
- The Times. Why EV Drivers Are More Likely to Crash but Less Likely to Get Hurt; The Times: London, UK, 2025; Available online: https://www.thetimes.co.uk/article/why-ev-drivers-are-more-likely-to-crash-but-less-likely-to-get-hurt-9svqdrcj8 (accessed on 11 March 2025).
- Jagani, S.; Marsillac, E.; Hong, P. The electric vehicle supply chain ecosystem: Changing roles of automotive suppliers. Sustainability 2024, 16, 1570. [Google Scholar] [CrossRef]
- Polarium. Battery Management Systems and Fire Risk Mitigation: A Data-Driven Approach. Available online: https://www.polarium.com (accessed on 5 March 2025).
- Consumer Reports. Electric Vehicle Repair Costs and Safety Innovations: 2024 Industry Insights. Available online: https://www.consumerreports.org (accessed on 5 March 2025).
- Powell, B.; Johnson, C. Impact of Electric Vehicle Charging Station Reliability, Resilience, and Location on Electric Vehicle Adoption; Technical Report; National Renewable Energy Laboratory: Denver, CO, USA, 2024.
- Alqahtani, H.; Kumar, G. Cybersecurity in Electric and Flying Vehicles: Threats, Challenges, AI Solutions & Future Directions. Available online: https://dl.acm.org/doi/abs/10.1145/3697830 (accessed on 7 March 2025).
- UN Net-Zero AO Alliance. Tackling Hidden Emissions for a Net-Zero Transition; United Nations Environment Programme Finance Initiative: Geneva, Switzerland, 2024. [Google Scholar]
- National Association of Mutual Insurance Companies (NAMIC). High-Voltage Systems and Battery Fire Risks in EV Insurance Modeling. Available online: https://www.namic.org/media-publications/ (accessed on 5 March 2025).
- Feldberg, A. Electric Vehicle Repair Costs 50% More Than ICE Models; Bodyshop Magazine: Hertfordshire, UK, 2024; Available online: https://www.bodyshopmag.com/2024/news/electric-vehicle-repair-costs-50-more-than-ice-models/ (accessed on 5 February 2025).
- McCarty, D.; Kim, H.W. Risky behaviors and road safety: An exploration of age and gender influences on road accident rates. PLoS ONE 2024, 19, e029666. [Google Scholar] [CrossRef]
- Actuarial Post. Instant Torque in EVs and Accident Rates: An Insurance Perspective; Actuarial Post: Tonbridge, UK, 2024; Available online: https://www.actuarialpost.co.uk/ (accessed on 10 March 2025).
- Reuters. EV Connectivity, Cybersecurity Vulnerabilities, and Emerging Threats. Reuters Technology. Available online: https://www.reuters.com/technology/ (accessed on 10 March 2025).
- Hasson, F.; Keeney, S.; McKenna, H. Research guidelines for the Delphi survey technique. J. Adv. Nurs. 2000, 32, 1008–1015. [Google Scholar] [CrossRef]
- Skulmoski, G.J.; Hartman, F.T.; Krahn, J. The Delphi method for graduate research. J. Inf. Technol. Educ. Res. 2007, 6, 1–21. [Google Scholar] [CrossRef]
- Okoli, C.; Pawlowski, S.D. The Delphi method as a research tool: An example, design considerations and applications. Inf. Manag. 2004, 42, 15–29. [Google Scholar] [CrossRef]
- Hallowell, M.R.; Gambatese, J.A. Qualitative research: Application of the Delphi method to CEM research. J. Constr. Eng. Manag. 2010, 136, 99–107. [Google Scholar] [CrossRef]


| Model Type | Key Characteristics | Limitations | Carbon Attribution |
|---|---|---|---|
| Traditional Risk-Based Insurance Model | Uses actuarial data: driver age, location, vehicle type, accident/repair history | Ignores carbon emissions and environmental sustainability | No |
| Usage-Based Insurance (UBI) Model | Incorporates telematics data: mileage, speed, braking behavior | Focuses only on behavior, lacks environmental or lifecycle emissions consideration | No |
| ESG/Climate-Investment Frameworks | Emphasizes carbon exposure in investment portfolios (e.g., TCFD, EU Taxonomy) | Not designed for insurance product pricing or underwriting of individual assets | Partial (at portfolio) |
| Proposed Model (This Study) | Integrates accident, repair, and battery risks with carbon pricing under PCAF | Requires expert input and data calibration | Yes (policy-level) |
| Feature | Low-Risk, Low-Carbon (L1) | Medium-Risk, Low-Carbon (M1) | Medium-Risk, High-Carbon (M2) | High-Risk, High-Carbon (H1) |
|---|---|---|---|---|
| Energy Efficiency (km/kWh) | >12 km/kWh | 10–12 km/kWh | 8–10 km/kWh | <8 km/kWh |
| Safety Features | Advanced ADAS, crash-avoidance systems | Partial ADAS, moderate crash ratings | Advanced ADAS but higher structural risk | Lacking ADAS, low crash-test ratings |
| Battery Safety | Advanced BMS, active thermal control | Basic BMS with moderate stability | Safe batteries but high thermal exposure | Low-cost batteries with fire risk |
| Repair Costs | High unit cost but lower loss frequency | Moderate repair cost and parts availability | High parts cost and complex repair procedures | High repair cost + high total-loss frequency |
| Charging Source | Low-carbon grid (hydro, nuclear, solar mix) | Moderate carbon grid (partially fossil-based) | Fossil-heavy grid, occasional low-carbon charging | Fossil-heavy, coal-based electricity mix |
| Driver Profile | Older, risk-averse, experienced drivers | Mixed profiles, moderate claim rates | Older drivers with moderate mileage | Younger, aggressive or inexperienced drivers |
| Typical Segment | Premium EVs with strong sustainability branding | Budget EVs with good efficiency and safety mix | Premium EVs in fossil-fuel regions | Budget EVs in high-risk or low-efficiency groups |
| Factors | Definitions | References |
|---|---|---|
| Battery Safety | Fire risk and battery failure probability | [35] |
| Repair Costs | Battery replacement and labor costs | [36] |
| Safety Features | Effectiveness of ADAS and crash-test ratings | [37] |
| Driver Profile | Accident frequency based on demographic shifts | [38] |
| Acceleration Risks | Loss-of-control incidents due to torque instability | [39] |
| Climate Performance | Range efficiency and thermal management | [40] |
| Cyber Risks | Vulnerability to hacking and system breaches | [41] |
| PCAF Carbon Impact | Emissions footprint based on energy efficiency and electricity grid mix | [41] |
| Pricing Factor | Low-Risk, Low-Carbon (L1) | Medium-Risk, Low-Carbon (M1) | Medium-Risk, High-Carbon (M2) | High-Risk, High-Carbon (H1) |
|---|---|---|---|---|
| Battery Safety | Low risk (advanced BMS, better thermal control). | Medium risk (basic BMS, moderate protection). | Low risk (good battery, but high-carbon charging). | High risk (low-cost materials, higher fire hazard). |
| Repair Costs | High repair cost, but lower loss likelihood. | Moderate repair cost, some repairability concerns. | High repair cost due to expensive components. | High repair cost and high likelihood of total loss. |
| Safety Features | Advanced ADAS, strong structural integrity. | Some ADAS features, moderate crash-test rating. | Advanced safety but high repair costs. | Few safety features, higher accident risk. |
| Driver Profile | Older, risk-averse drivers. | Mixed driver profile (some risk-taking behaviors). | Older drivers but moderate accident risk. | Younger, high-risk drivers. |
| Acceleration Risks | Controlled torque, stability control prevents loss of control. | Some acceleration risks but with moderate safety tech. | High torque but controlled by stability systems. | Higher likelihood of accidents due to poor handling. |
| Climate Performance | Strong battery thermal management, minimal weather impact. | Moderate impact in extreme climates. | Good battery management but affected by high-carbon energy use. | High efficiency loss in extreme weather. |
| Cyber Risks | High-end encryption, low hacking risk. | Moderate security protections. | High connectivity, moderate cyber risks. | Poor cybersecurity, vulnerable to hacking. |
| PCAF Carbon Impact | Low-carbon impact (efficient EV, clean energy source). | Low-carbon impact (high efficiency, good energy mix). | High-carbon impact (low efficiency, fossil grid charging). | High-carbon impact (low efficiency, fossil-fuel grid reliance). |
| Factor | Variation (%) | Reasoning |
|---|---|---|
| Battery Safety | ±20% | Battery risks fluctuate based on materials, BMS efficiency, and degradation rate. Historical data suggests that improvements in BMS reduce fire risks by about 20% on average [44]. |
| Repair Costs | ±20% | Repair costs vary depending on battery replacement rates and labor costs. A 20% shift accounts for repair network availability and new technologies reducing cost inefficiencies [45]. |
| Safety Features | ±20% | Advanced Driver Assistance Systems (ADAS) typically reduce accident risks by 20%, hence a ±20% variation in risk assessment [45]. |
| Driver Profile | ±20% | Insurance risk models estimate that accident frequency can fluctuate by up to 20% based on demographic shifts [45]. |
| Acceleration Risks | ±20% | EV torque characteristics impact accident rates. Studies show that vehicles with better traction control reduce loss-of-control incidents by around 20% [45]. |
| Climate Performance | ±30% | Extreme weather affects battery efficiency significantly, with studies showing efficiency losses up to 30% in cold temperatures [46]. |
| Cyber Risks | ±30% | Cybersecurity vulnerabilities change rapidly due to emerging threats. A ±30% variation is justified based on historical cyber risk fluctuations in connected vehicles [47]. |
| PCAF Carbon Impact | ±30% | Carbon intensity of electricity grids varies significantly by region, and pricing mechanisms under PCAF may fluctuate carbon penalties by 30% [48]. |
| Scenario | Battery Safety | Repair Costs | Safety Features | Driver Profile | Acceleration Risks | Climate Performance | Cyber Risks | PCAF Carbon Impact |
|---|---|---|---|---|---|---|---|---|
| Best Case | −20% | −20% | +20% | −20% | −20% | +30% | −30% | −30% |
| Base Case | 0% | 0% | 0% | 0% | 0% | 0% | 0% | 0% |
| High-Carbon | 0% | 0% | 0% | 0% | 0% | 0% | 0% | +30% |
| Worst Case | +20% | +20% | −20% | +20% | +20% | −30% | +30% | +30% |
| Factor | Weight (%) | Why This Weight? | Citation |
|---|---|---|---|
| Battery Safety | 15% | High-voltage systems and battery fire risks significantly impact claims and repairability. | [49] |
| Repair Costs | 15% | EV repairs (especially battery replacements) are costlier than those for ICE vehicles. | [50] |
| Safety Features | 10% | ADAS reduces accident rates, but not all EVs have comprehensive safety features. | [51] |
| Driver Profile | 15% | Demographic and behavioral factors influence accident frequency significantly. | [42] |
| Acceleration Risks | 10% | Instant torque in EVs leads to higher accident rates, particularly in high-performance models. | [52] |
| Climate Performance | 10% | Cold weather reduces range and increases assistance claims, but it is not the dominant risk factor. | [40] |
| Cyber Risks | 10% | EV connectivity creates cybersecurity vulnerabilities but remains an emerging concern. | [53] |
| PCAF Carbon Impact | 15% | Carbon pricing models affect premium costs and regulatory compliance. | [13] |
| Risk Factor | Agreement (1st MDS) | Final Agreement (2nd MDS) | Key Expert Comments |
|---|---|---|---|
| Battery Safety | 4/5 (80%) | 5/5 (100%) | Risks include thermal runaway, degradation, and fire hazards. |
| Repair Costs | 5/5 (100%) | 5/5 (100%) | EV repairs involve high costs due to battery replacement and limited repair options. |
| Safety Features | 3/5 (60%) | 4/5 (80%) | Initially debated, accepted after clarifying software-related failures. |
| Driver Profile | 2/5 (40%) | 3/5 (60%) | No consensus—experts disagreed on whether EV drivers exhibit unique risk behaviors. |
| Acceleration Risks | 4/5 (80%) | 5/5 (100%) | Experts agreed that EV acceleration capabilities increase crash risk. |
| Climate Performance | 3/5 (60%) | 5/5 (100%) | Cold weather affects battery efficiency, impacting driving range. |
| Cyber Risks | 5/5 (100%) | 5/5 (100%) | EVs face hacking risks, software failures, and firmware exploits. |
| PCAF Carbon Impact | 2/5 (40%) | 3/5 (60%) | Revised to explicitly account for unavoidable carbon credit costs. |
| Kendall’s W = 0.67 (Moderate agreement) | Kendall’s W = 0.82 (Strong agreement) |
| Risk Factor | Proposed Range | Final Agreed Range | Consensus Achieved? | Expert Rationale |
|---|---|---|---|---|
| Battery Safety | ±20% | ±15% to ±25% | Yes | Reflects different battery chemistries and degradation rates. |
| Repair Costs | ±20% | ±15% | Yes | EVs have highly variable repair costs due to supply chain constraints. |
| Safety Features | ±20% | ±10% to ±20% | Yes | Autonomous systems reduce crash frequency but increase repair costs. |
| Driver Profile | ±20% | No Consensus | No | Experts disagreed on the impact of driver demographics. |
| Acceleration Risks | ±20% | ±15% to ±25% | Yes | High-performance EVs, such as Tesla Plaid, pose greater accident risks. |
| Climate Performance | ±30% | No Change | Yes | Extreme temperatures can significantly reduce EV battery efficiency. |
| Cyber Risks | ±30% | No Change | Yes | Growing risk of EV hacking, ransomware, and system failures. |
| PCAF Carbon Impact | ±30% | +30% in High-Carbon Scenario | Yes | Regulatory carbon credit costs confirmed as a direct financial burden. |
| Kendall’s W = 0.79 (Strong agreement) |
| Scenario | Expert Agreement (The 1st MDS) | Consensus Achieved? | Expert Feedback |
|---|---|---|---|
| Best Case Scenario (Battery Safety +20%, Repair Costs −20%, Climate Performance +30%, Cyber Risks −30%, PCAF Carbon Impact −30%) | 3/5 | No | Some experts suggested refining variation ranges. |
| Base Case Scenario (No Adjustments—Control Benchmark) | 5/5 | Yes | No modifications needed. |
| High-Carbon Scenario (PCAF Carbon Impact +30%, Carbon Pricing Mechanisms Introduced) | 2/5 | No | Experts debated if carbon pricing should be factored as direct insurance cost. |
| Worst Case Scenario (Safety Features −20%, Cyber Risks +30%, PCAF Carbon Impact +30%, Climate Performance −30%) | 3/5 | No | Experts suggested increasing variation range in cyber risks and carbon impact. |
| Round 1: Kendall’s W = 0.55 (Moderate agreement) | |||
| Scenario | Revised Variation Ranges | Expert Agreement (Round 2) | Consensus Achieved? |
|---|---|---|---|
| Best Case Scenario | Battery Safety +20%, Repair Costs −20%, Climate Performance +30%, Cyber Risks −30%, PCAF Carbon Impact −30% | 4/5 | Yes |
| Base Case Scenario | No Adjustments | 5/5 | Yes |
| High-Carbon Scenario | Explicit 30% increase in PCAF Carbon Impact due to unavoidable carbon credit costs | 4/5 | No |
| Worst Case Scenario | Safety Features −20%, Cyber Risks +30%, PCAF Carbon Impact +30%, Climate Performance −30% | 4/5 | Yes |
| Kendall’s W = 0.72 (Stronger agreement after scenario refinements) | |||
| Scenario | Final Expert Agreement (Round 3) | Consensus Achieved? |
|---|---|---|
| Best Case Scenario (Battery Safety +20%, Repair Costs −20%, Climate Performance +30%, Cyber Risks −30%, PCAF Carbon Impact −30%) | 5/5 | Yes |
| Base Case Scenario (No Adjustments—Control Benchmark) | 5/5 | Yes |
| High-Carbon Scenario (Mandatory Carbon Credit Purchases, 30% Increase in PCAF Carbon Impact, Regulatory Compliance Costs) | 5/5 | Yes |
| Worst Case Scenario (Safety Features −20%, Cyber Risks +30%, PCAF Carbon Impact +30%, Climate Performance −30%) | 5/5 | Yes |
| Kendall’s W = 0.92 (Strong consensus across all scenarios) | ||
| Risk Factor | Proposed Weight (%) | Expert Agreement (Round 1) | Consensus Achieved? | Expert Feedback |
|---|---|---|---|---|
| Battery Safety | 15% | 4/5 | No | Some suggested increasing weight due to battery fire risk. |
| Repair Costs | 15% | 5/5 | Yes | Experts agreed on cost impact. |
| Safety Features | 10% | 3/5 | No | Some suggested reducing to 5%. |
| Driver Profile | 15% | 3/5 | No | Some suggested reducing to 10%. |
| Acceleration Risks | 10% | 4/5 | No | Some suggested increasing to 15%. |
| Climate Performance | 10% | 4/5 | No | Some suggested reducing to 5%. |
| Cyber Risks | 10% | 3/5 | No | Some suggested increasing due to rising cyber threats. |
| PCAF Carbon Impact | 15% | 3/5 | No | Some suggested increasing to 20% due to expected carbon pricing policies. |
| Kendall’s W = 0.67 (Moderate) | ||||
| Risk Factor | Revised Weight (%) | Expert Agreement (Round 2) | Consensus Achieved? |
|---|---|---|---|
| Battery Safety | 20% | 4/5 | Yes |
| Repair Costs | 15% | 5/5 | Yes |
| Safety Features | 5% | 4/5 | Yes |
| Driver Profile | 10% | 4/5 | Yes |
| Acceleration Risks | 15% | 4/5 | Yes |
| Climate Performance | 5% | 4/5 | Yes |
| Cyber Risks | 15% | 4/5 | Yes |
| PCAF Carbon Impact | 20% | 4/5 | No |
| Kendall’s W = 0.79 (Strong agreement) | |||
| Risk Factor | Final Weight (%) | Expert Agreement (Round 3) | Consensus Achieved? |
|---|---|---|---|
| Battery Safety | 20% | 5/5 | Yes |
| Repair Costs | 15% | 5/5 | Yes |
| Safety Features | 5% | 5/5 | Yes |
| Driver Profile | 10% | 5/5 | Yes |
| Acceleration Risks | 15% | 5/5 | Yes |
| Climate Performance | 5% | 5/5 | Yes |
| Cyber Risks | 15% | 5/5 | Yes |
| PCAF Carbon Impact | 20% | 5/5 | Yes |
| Kendall’s W = 0.82 (Strong agreement) | |||
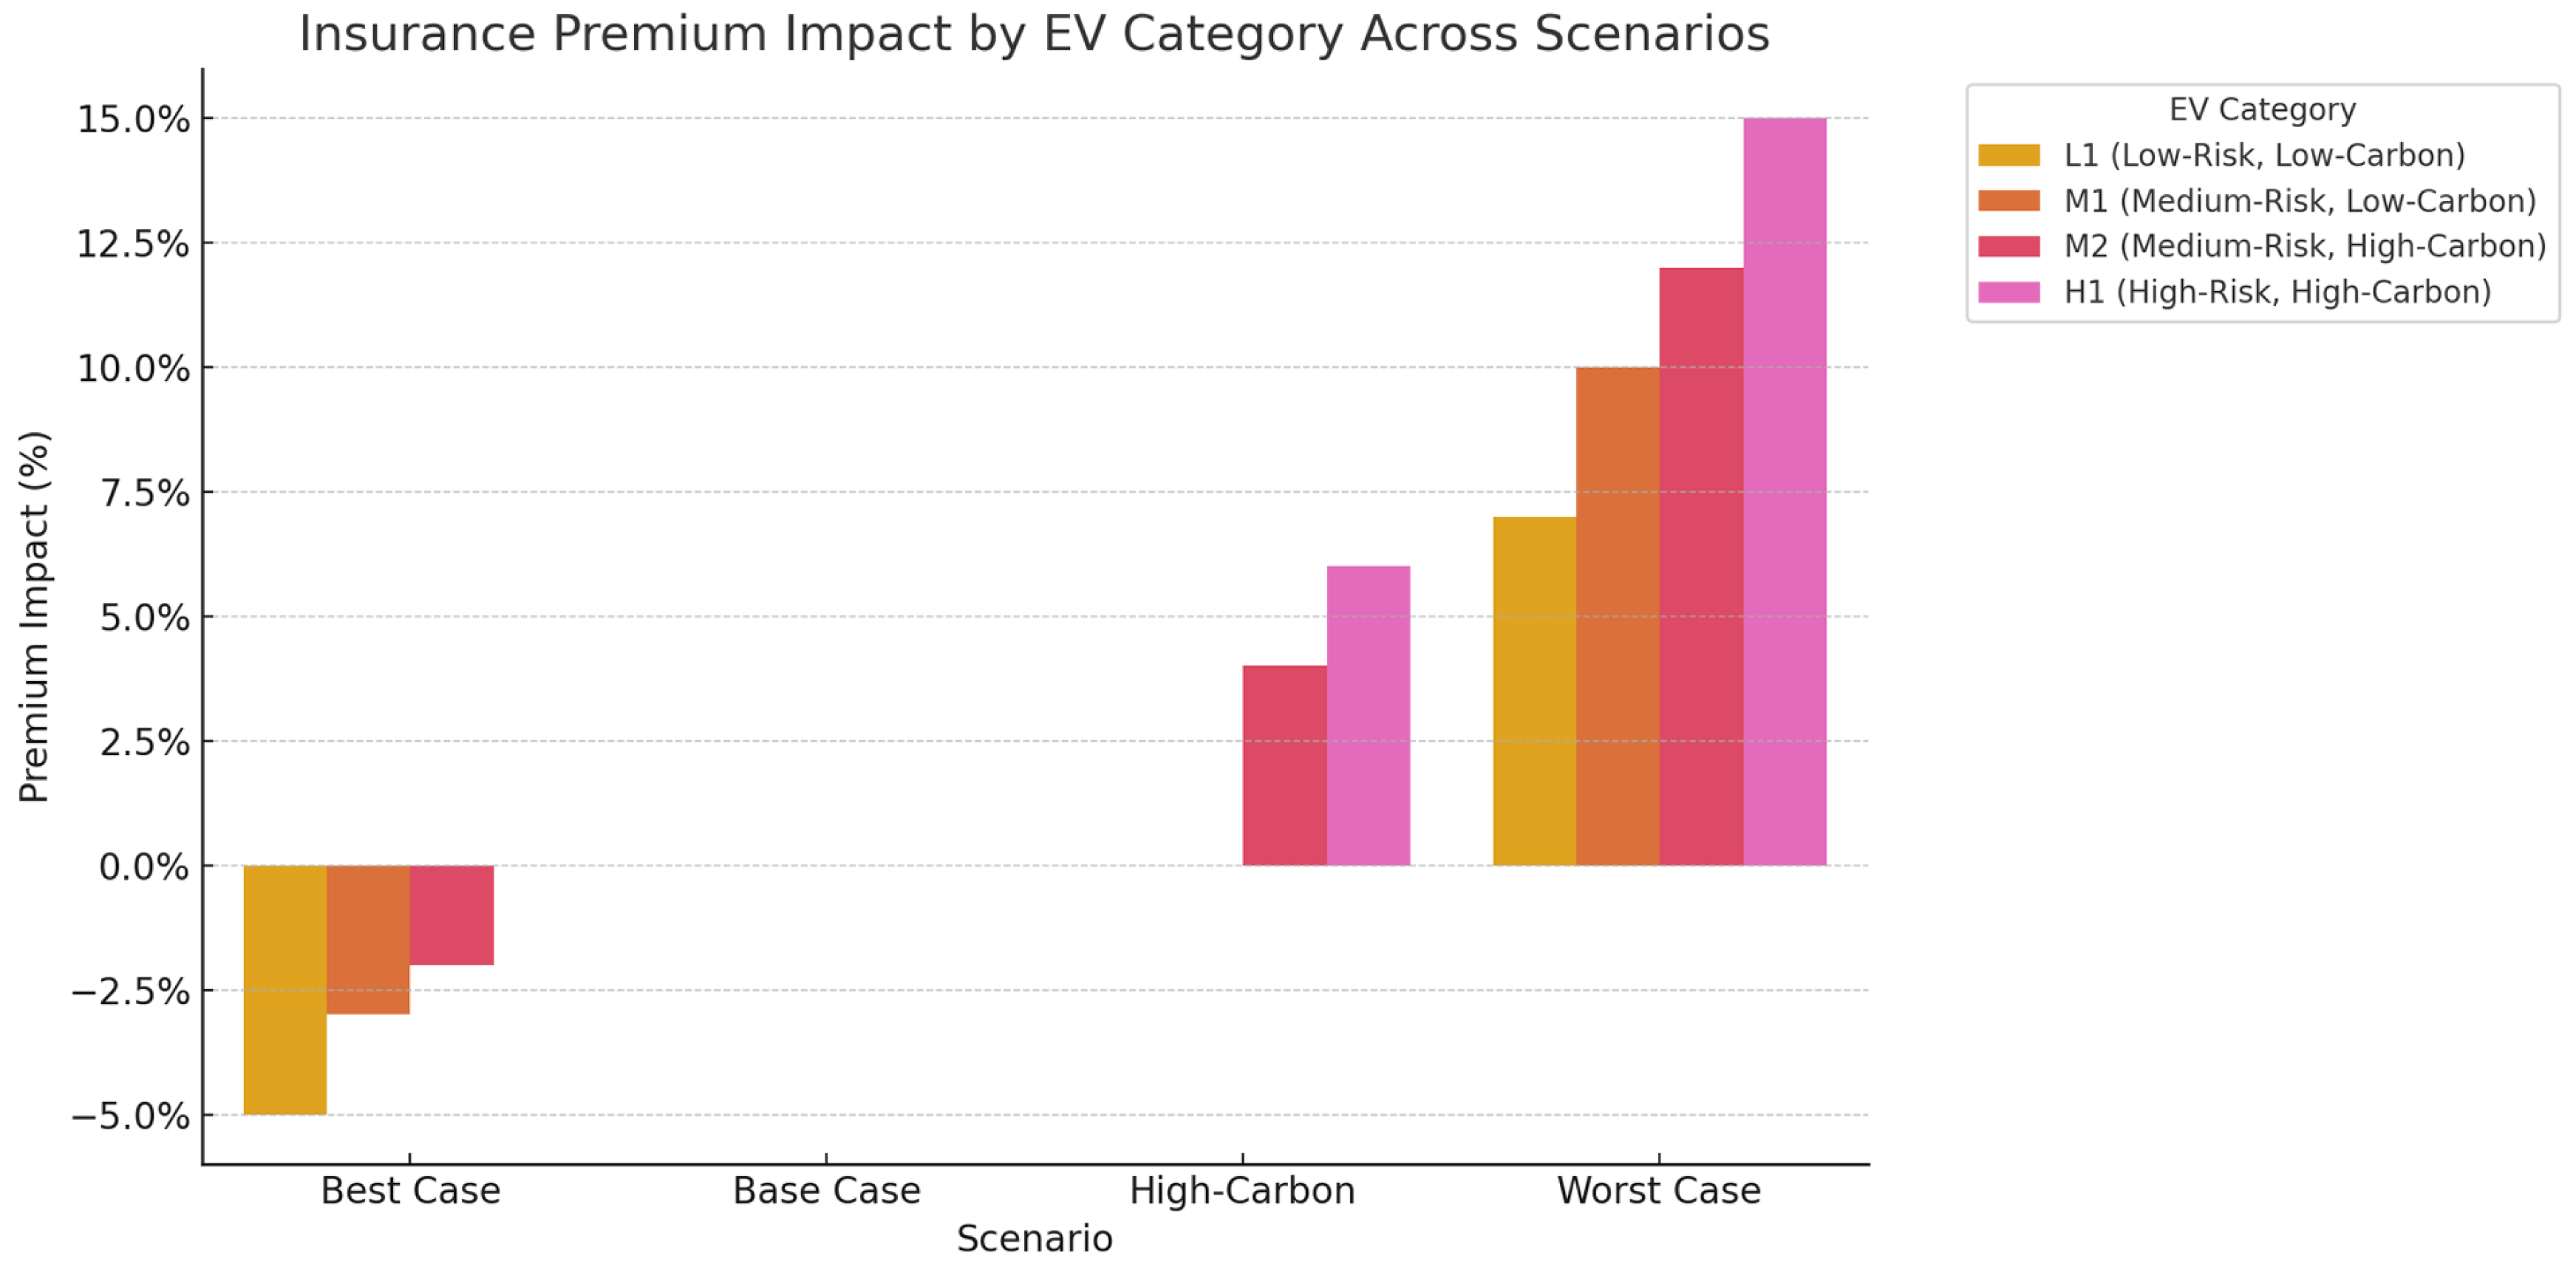
| Scenario | L1 (Low-Risk, Low-Carbon) | M1 (Medium-Risk, Low-Carbon) | M2 (Medium-Risk, High-Carbon) | H1 (High-Risk, High-Carbon) |
|---|---|---|---|---|
| Best Case | (−3.0% − 3.0% − 1.0% − 2.0% − 2.0% + 3.0% − 3.0% − 4.5%) = −5% | −3% | −2% | No significant change |
| Base Case | No change | No change | No change | No change |
| High-Carbon | No change | No change | (+4.5% from PCAF impact) = +4% | (+6.0% from PCAF impact) = +6% |
| Worst Case | +7% | +10% | +12% | +15% |
Disclaimer/Publisher’s Note: The statements, opinions and data contained in all publications are solely those of the individual author(s) and contributor(s) and not of MDPI and/or the editor(s). MDPI and/or the editor(s) disclaim responsibility for any injury to people or property resulting from any ideas, methods, instructions or products referred to in the content. |
© 2025 by the authors. Published by MDPI on behalf of the World Electric Vehicle Association. Licensee MDPI, Basel, Switzerland. This article is an open access article distributed under the terms and conditions of the Creative Commons Attribution (CC BY) license (https://creativecommons.org/licenses/by/4.0/).
Share and Cite
Lin, X.; Chen, F.; Zhuang, H.; Lee, C.-Y.; Fan, C.-K. Balancing Profitability and Sustainability in Electric Vehicles Insurance: Underwriting Strategies for Affordable and Premium Models. World Electr. Veh. J. 2025, 16, 430. https://doi.org/10.3390/wevj16080430
Lin X, Chen F, Zhuang H, Lee C-Y, Fan C-K. Balancing Profitability and Sustainability in Electric Vehicles Insurance: Underwriting Strategies for Affordable and Premium Models. World Electric Vehicle Journal. 2025; 16(8):430. https://doi.org/10.3390/wevj16080430
Chicago/Turabian StyleLin, Xiaodan, Fenqiang Chen, Haigang Zhuang, Chen-Ying Lee, and Chiang-Ku Fan. 2025. "Balancing Profitability and Sustainability in Electric Vehicles Insurance: Underwriting Strategies for Affordable and Premium Models" World Electric Vehicle Journal 16, no. 8: 430. https://doi.org/10.3390/wevj16080430
APA StyleLin, X., Chen, F., Zhuang, H., Lee, C.-Y., & Fan, C.-K. (2025). Balancing Profitability and Sustainability in Electric Vehicles Insurance: Underwriting Strategies for Affordable and Premium Models. World Electric Vehicle Journal, 16(8), 430. https://doi.org/10.3390/wevj16080430