Abstract
The improvement of environmental conditions has become a priority for governments and legislators. New electrified mobility systems are increasingly present in our environment, as they enable the reduction of polluting emissions. Electric vehicles (EVs) are one of the fastest-growing alternatives to date, with exponential growth expected over the next few years. In this article, the various charging modes for EVs are explored, and the risks associated with charging technologies are analysed, particularly for charging systems in high-power DC with Lithium battery energy storage, given their long market deployment and characteristic behaviour. In particular, the Arc Flash (AF) risk present in high-power DC chargers will be studied, involving numerous simulations of the charging process. Subsequently, the Incident Energy (IE) analysis is carried out at different specific points of a commercial high-power ‘Mode 4’ charger. For this purpose, different analysis methods of recognised prestige, such as Doan, Paukert, or Stokes and Oppenlander, are applied, using the latest version of the ETAP® simulation tool version 22.5.0. This study focuses on quantifying the potential severity (consequences) of an AF event, assuming its occurrence, rather than performing a probabilistic risk assessment according to standard methodologies. The primary objective of this research is to comprehensively quantify the potential consequences for workers involved in the operation, maintenance, repair, and execution of tasks related to EV charging systems. This analysis makes it possible to provide safe working conditions and to choose the appropriate and necessary personal protective equipment (PPE) for each type of operation. It is essential to develop this novel process to quantify the consequences of AF and to protect the end users of EV charging systems.
1. Introduction
Vehicles with internal combustion engines are responsible for between 19% [1] and 55.2% [2] of global greenhouse gas emissions [3]. This range may vary depending on the scope of the emissions considered, the life cycle associated with the carbon footprint, the type of vehicle considered, or the calculation methodology applied. Electric vehicles (EVs) are one of the most established alternatives among all energy-sustainable mobility systems. Renewable hydrogen fuel cell cars are another low environmental impact option, although their technology is currently subject to high acquisition costs, low fuel cell energy efficiency, and serious difficulties in making hydrogen charging available in safe locations.
According to the International Energy Agency, by 2030, more than 15 million EVs are expected, including 100% battery electric cars (BEVs) as well as plug-in hybrid (PHEV) models. By 2050, according to the most optimistic forecasts, up to 627 million EVs could be in use globally. These projections are estimates based on current automotive market conditions and are subject to variation depending on factors such as government policies, technological developments, and fluctuations in energy prices.
Today’s EVs offer advantages such as low maintenance and running costs, optimised energy efficiency [4,5], high ride comfort, advanced active safety features, and state-of-the-art driver assistance systems [6]. Add to this an increasingly affordable purchase price, increased range [7], regenerative braking energy harvesting and recovery [8], and zero emissions during use, and the uptake of EV-based mobility is unrivalled.
However, there are several technological challenges that society must prepare for in the medium term. These challenges include grid management of the expected energy demand [9], which is of particular concern when high-power charging is performed by thousands of vehicles simultaneously [10]. This is very common at peak hours on major state highways and in specific shared-use charging areas [11].
Mathematical models are now available that consider mass EV charging supported by solar photovoltaic energy resources [12,13], including the use of photovoltaic roofs [14]. In these models, the effect of solar irradiance and temperature has been found to affect the stability of the power generation system [15], as well as the charging systems themselves.
Demand management, grid optimisation, and the implementation of flexibility systems can help solve the problems of dimensioning and stability of electricity distribution grids [16]. The implementation of Smart Grids [17] also allows the optimisation of charging processes, with particular interest when electricity demand [18] exceeds available resources during certain time slots. The exchange of information between EVs and Smart Grids is constantly evolving, especially regarding V2G (Vehicle-to-Grid), V2H (Vehicle-to-Home), or V2V (Vehicle-to-Vehicle) systems. Charging stations using event-based communication share information about the charging processes to occur, while optimisation agents can prepare optimal energy use strategies [19].
The integration of battery-supported charging systems enhances energy management by facilitating both low-power grid connections and high-power EV energy delivery. There are currently scientific studies that model and simulate the management of many EVs during their charging process, with the influence of energy storage on electricity grids [20,21]. None of these studies focuses on the Arc Flash (AF) risks posed by the charger/battery combination.
All the charging systems referred to in this article are conductive energy systems based on the IEC 61851-1 standard [22], ignoring other options that are not well established in the sector, such as wireless charging [23] or pantograph charging [24] for EVs.
The named charging modes 1, 2, and 3 (slow or semi-fast charging) make it possible to charge EVs in AC, with relatively low power ratings, typically less than 43 kW. These three charging modes are intended for charging at home or in car parks, where EVs are to be parked for several hours or days.
On the other hand, the named charging Mode 4 (fast charging) allows DC charging with power ratings that can even exceed 400 kW, which makes it possible to charge an electric car in a very short time, even less than 30 min. This mode is most suitable for long-distance travel, as it facilitates brief stops during journeys. This fast charging requires a connection to the distribution network with a higher capacity, with the dangers that this entails [25].
In any case, all the charging modes described above provide electric power to EVs and therefore present risks to people interacting with them. The primary hazards associated with charging infrastructures include the following:
- Danger of fire.
- Danger of impact.
- Danger of overvoltage.
- Danger of electrocution.
- Danger of Arc Flash burns.
According to Eastwood et al. [26], there is one death for every ten recorded cases with electricity-related hazards. This implies a ratio thirty times higher than for other general safety hazards. As a result, the proportion of deaths from burns and electric shocks is much higher than that from all other non-electrical hazards [27]. In the USA alone, the Occupational Safety and Health Administration (OSHA) estimates that between 5 and 10 serious AF accidents occur every day. These accidents result, among others, in burns, serious injuries, or even death. On average, fatalities due to the presence of electrical energy accounted for approximately 7.9% of all fatalities in engineering and construction workplaces between 2011 and 2017. The burden goes beyond monetary cost, lost wages, medical expenses, disability, or reduced quality of life. Table 1 lists the main characteristics of the accidents studied to date due to AF [28].

Table 1.
Classification of major accidents by AF.
According to these damages, projects related to smaller budgets in commercial installations and new projects are those with the highest probability of accidents. Most AF accidents are suffered by specialised professions, such as electricians, and require hospitalisation in most cases analysed. EV charging systems meet all the points mentioned above.
The AF phenomenon is one of the most dangerous hazards that can occur in the electrical sector [29], even leading to the death of those who suffer from it. AF can be defined as a type of electrical discharge that occurs when there is an electrical potential difference between two conductive elements separated by an insulating medium (usually air). This electric potential difference is so great that the dielectric strength of the insulator is overcome, and the insulator is ionised, becoming conductive [30].
This phenomenon stands out due to its temporal persistence, as well as the high temperature and luminosity it exhibits. Its occurrence requires an intense electric field between two conductive masses to overcome the dielectric strength of the insulator, which can be oil, sulphur hexafluoride (SF6), or air itself.
The electric field leads to the acceleration of free electrons in the medium, which subsequently collide with gas molecules, initiating an electron and ion avalanche. This event causes ionisation of the medium, creating a plasma channel through which intense electric current flows.
Once the arc fault (AF) is established, the high temperature it generates causes the emission of light and the melting and vaporisation of the electrode material, leading to the reinforcement of the arc’s conductivity. If not properly controlled, the energy released during this phenomenon can damage equipment and property, jeopardising the stability of the electrical system and the safety of individuals.
To prevent this, several extinction methods exist, such as magnetic blowout, gas and oil jet cooling, or arc elongation, which can lead to the reduction and minimisation of its detrimental effects.
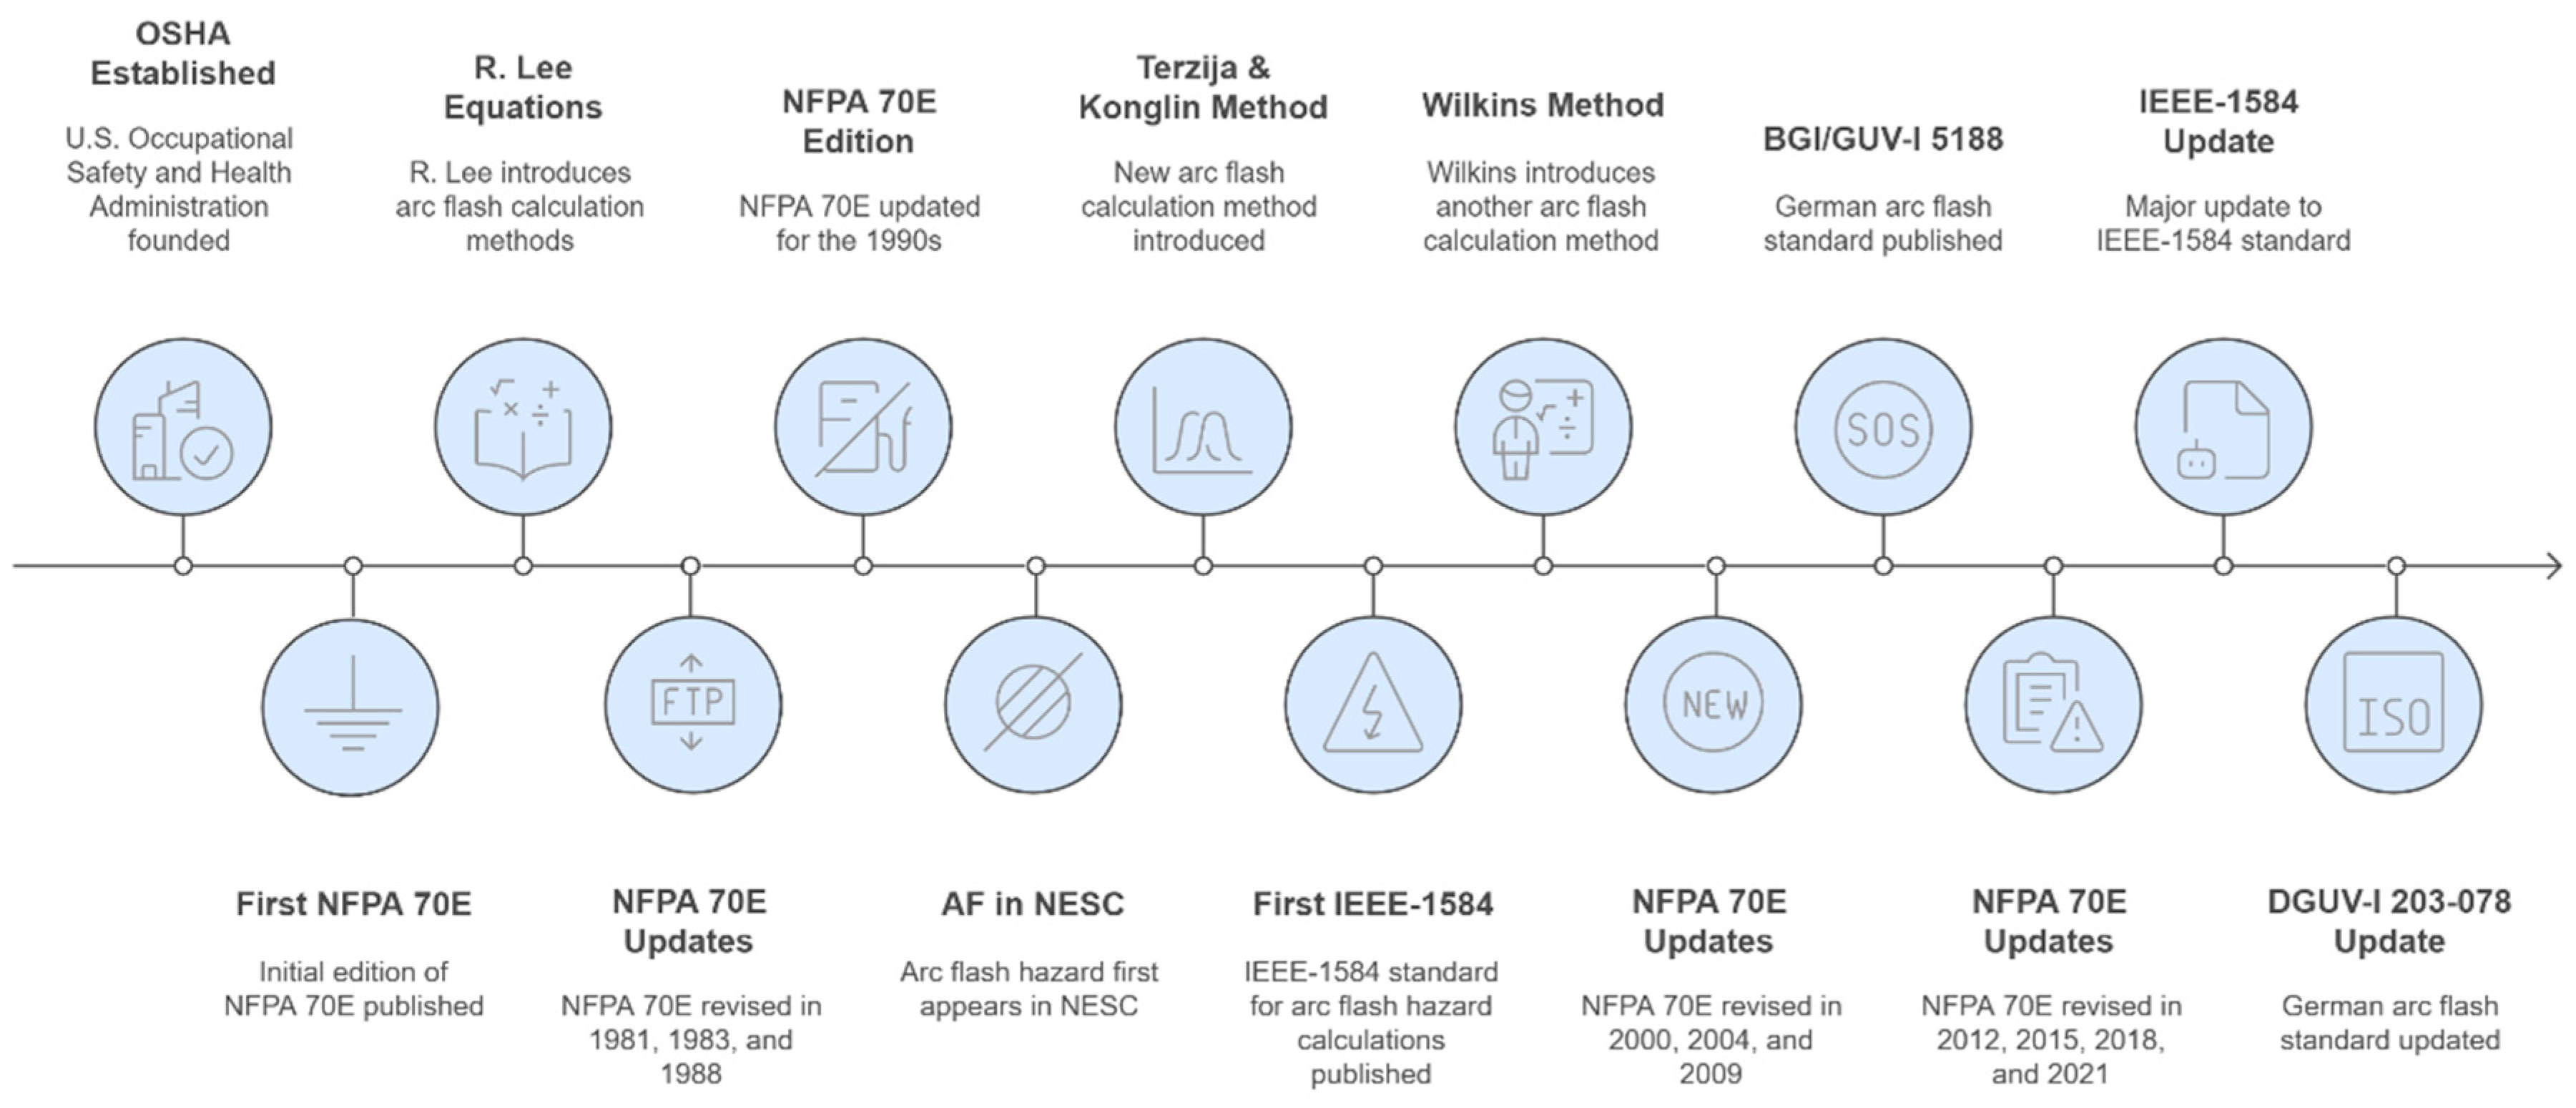
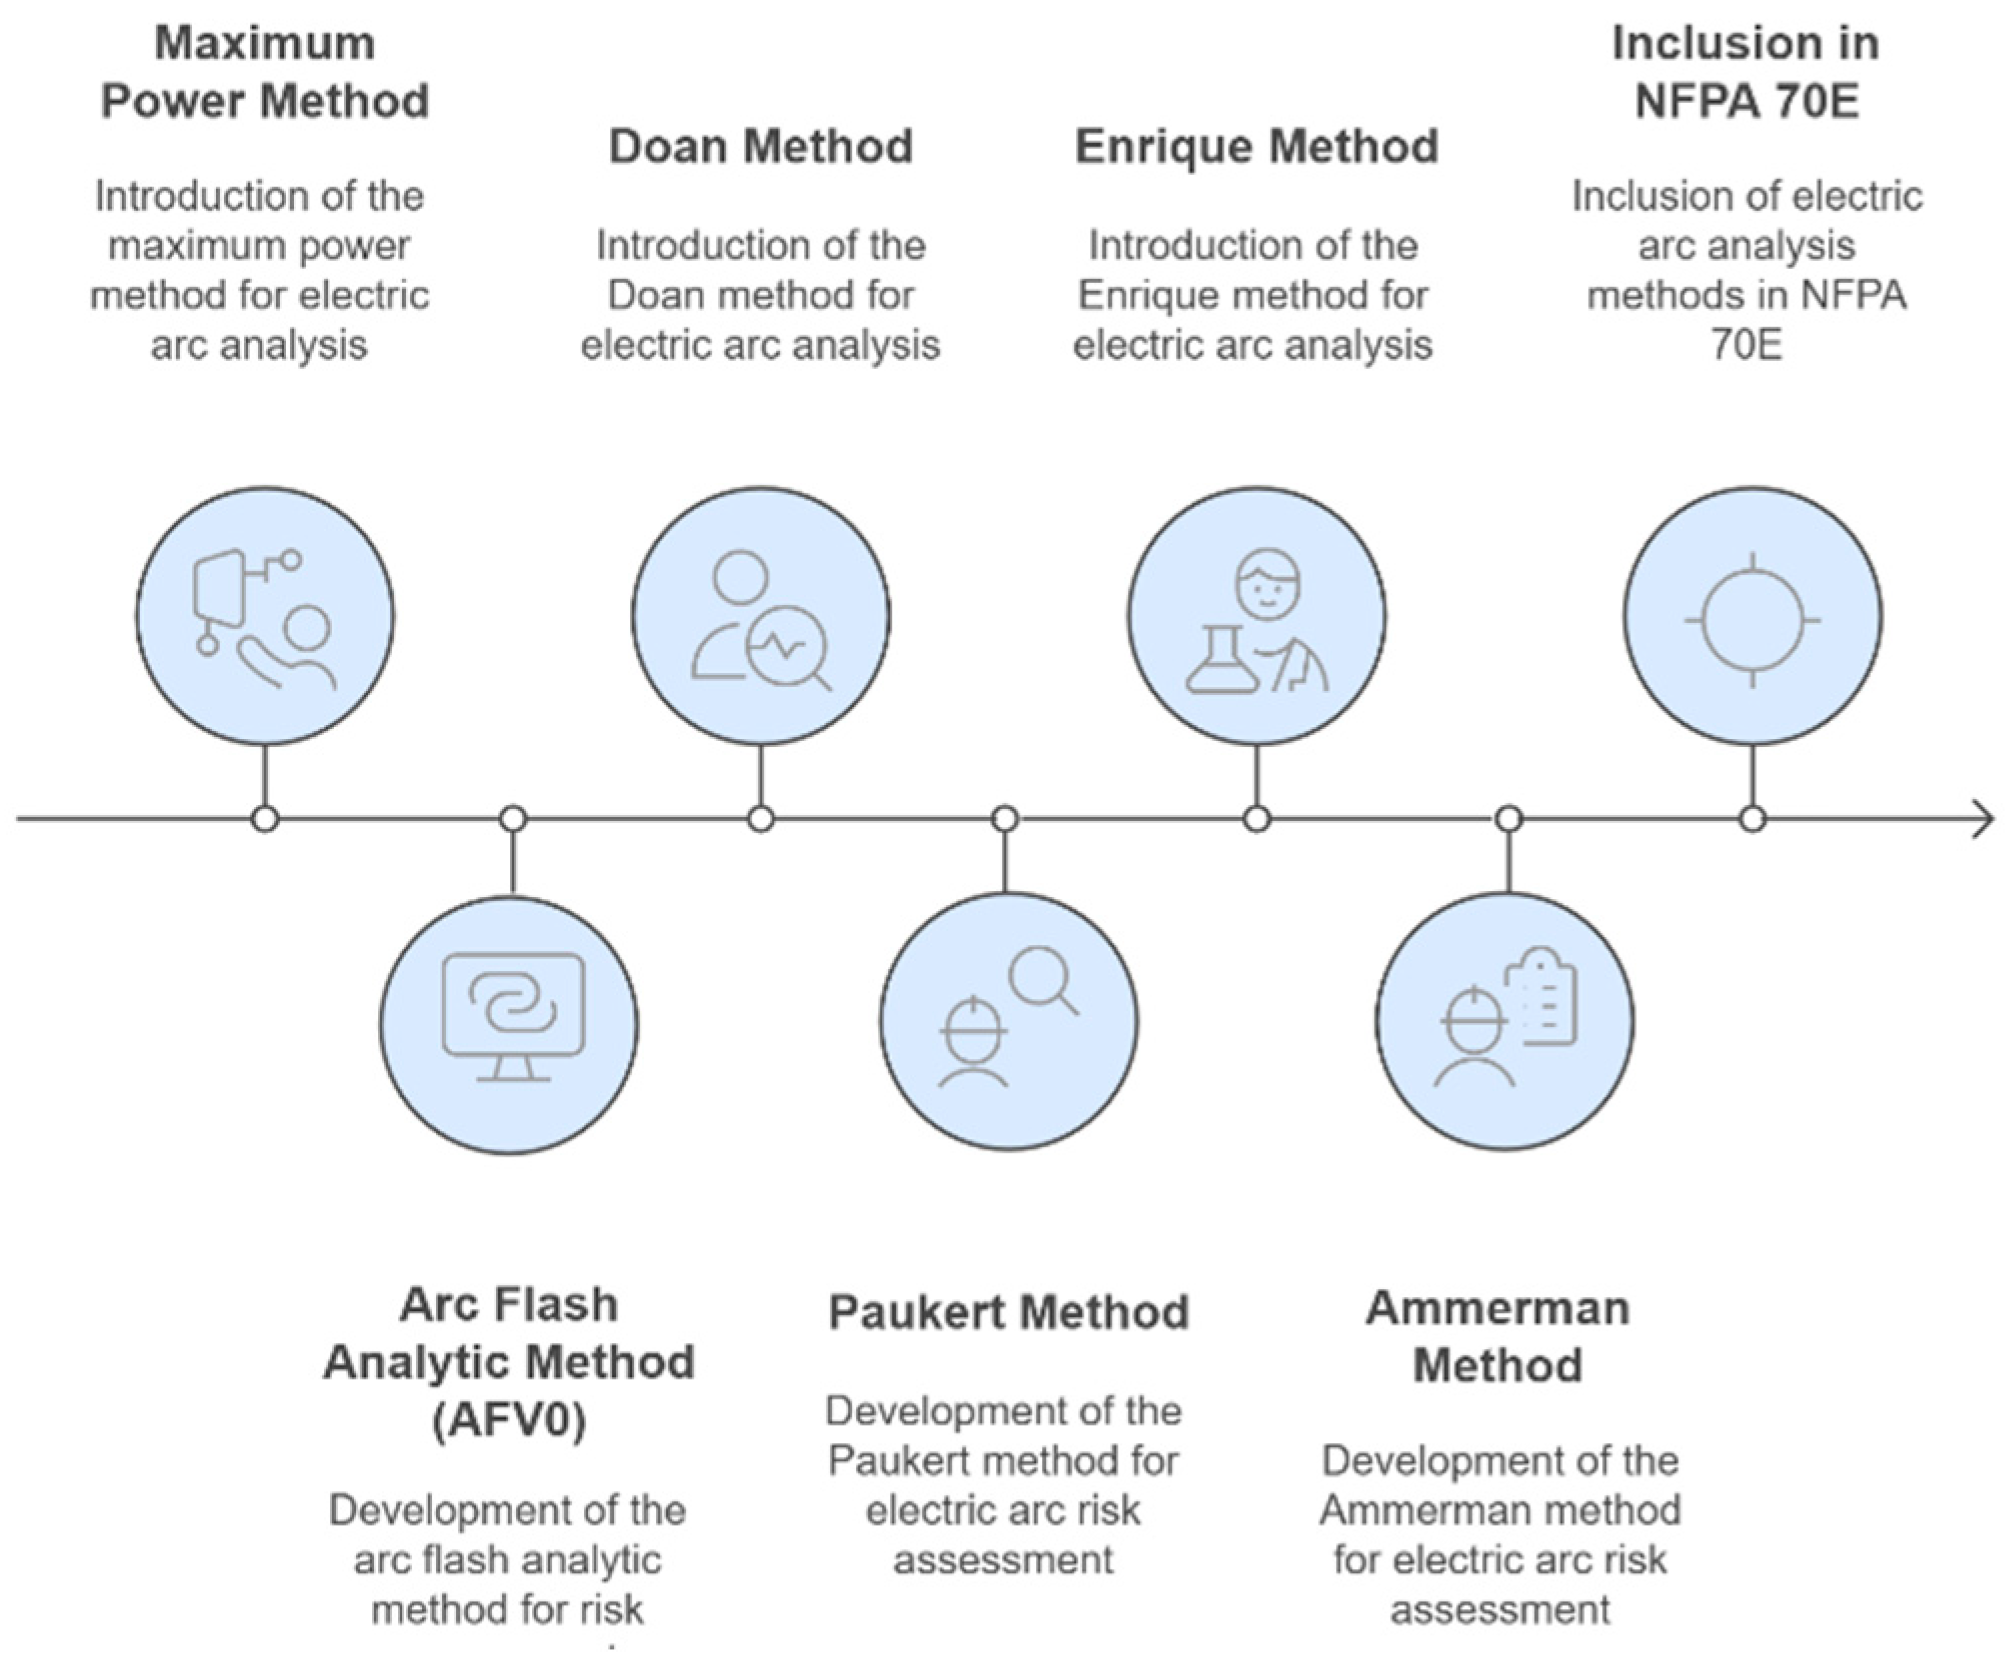
Since the 1970s, studies have been conducted that have contributed to the development of calculation methods related to the various parameters that condition the appearance of this phenomenon, as well as to the development of regulations and guidelines, which have progressively evolved to the present day. A graphical representation of this evolution can be observed in Figure 1 and Figure 2.
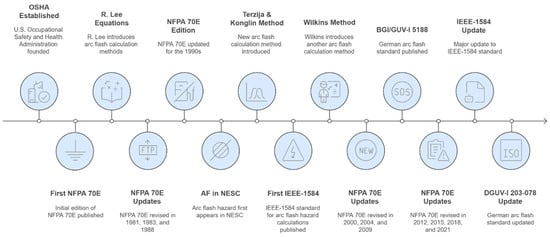
Figure 1.
Timeline of the evolution of regulations and calculation methods for Arc Flash in alternating current.
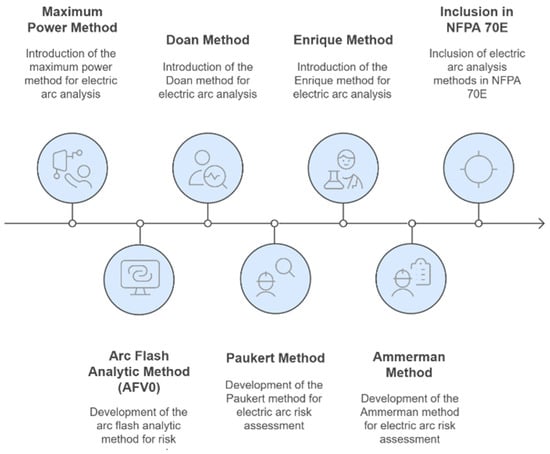
Figure 2.
Timeline of the evolution of regulations and calculation methods for Arc Flash in direct current.
Throughout the development of this research, we focus on this risk of AF, which has been little studied for EV charging systems. We analyse in detail the risk of burns due to AF [31] in a high-power charging system, which also has a backup battery with more than 200 kWh of energy equipped with thermoplastic materials [32], making it possible to charge several EVs in just a few minutes.
To achieve this objective, several indicators have been developed, which are particularly relevant when working in proximity to the charging systems mentioned above. The indicators that we will define for our research are those indicated below:
- Location of the points of maximum danger in the charging system.
- Selection of the best calculation methods for the analysis of the AF in DC systems with batteries.
- Calculation of the maximum IE values at each of the maximum risk points in the charging system.
- Comparison of the IE values according to the selected analytical methods.
- Proposal of personal protective equipment (PPE) to carry out maintenance work under maximum safety conditions.
- Analysis of the danger for EV users when they are in the vicinity of the maximum risk points of the charging systems.
2. Methodology
2.1. AF During Electric Car Charging
Research on the study of the AF phenomenon is extensive. Many of these studies are led by prestigious organisations such as the Institute of Electrical and Electronics Engineers (IEEE), the National Fire Protection Association (NFPA), or the Electric Power Research Institute (EPRI). These organisations have published a series of standards, such as NFPA 70E [33] or IEEE 1584 [34], which provide various analysis and calculation methodologies effective for determining the energy released during incidents of these characteristics, assessing the risk present in installations, and prescribing the PPE necessary to ensure worker safety. This is a type of electrical hazard associated with any type of energised installation and, therefore, also present in EV charging systems. During this process, there is a substantial increase in the temperature of both the materials and the environment surrounding the AF itself.
Temperatures of thousands of degrees Celsius can be reached, as well as high noise levels and dangerous emissions of ultraviolet, infrared, and visible light radiation, which can lead to permanent hearing and vision loss. High temperatures can cause fires if flammable material is present in the surroundings [35].
Very high thermal values (cal/cm2) can be generated during AF. These values can cause severe burns on the workers who install, operate, repair, or maintain these types of chargers, or even on the users who use these energised systems. Depending on the severity of the AF, an explosive force known as an ‘arc blast’ can also occur. This is due to the rapid expansion of air, which dissipates a force that can exceed 100 kPa. This arc blast can cause the propulsion of molten metal, equipment parts, and other debris at speeds of up to 300 m/s [36].
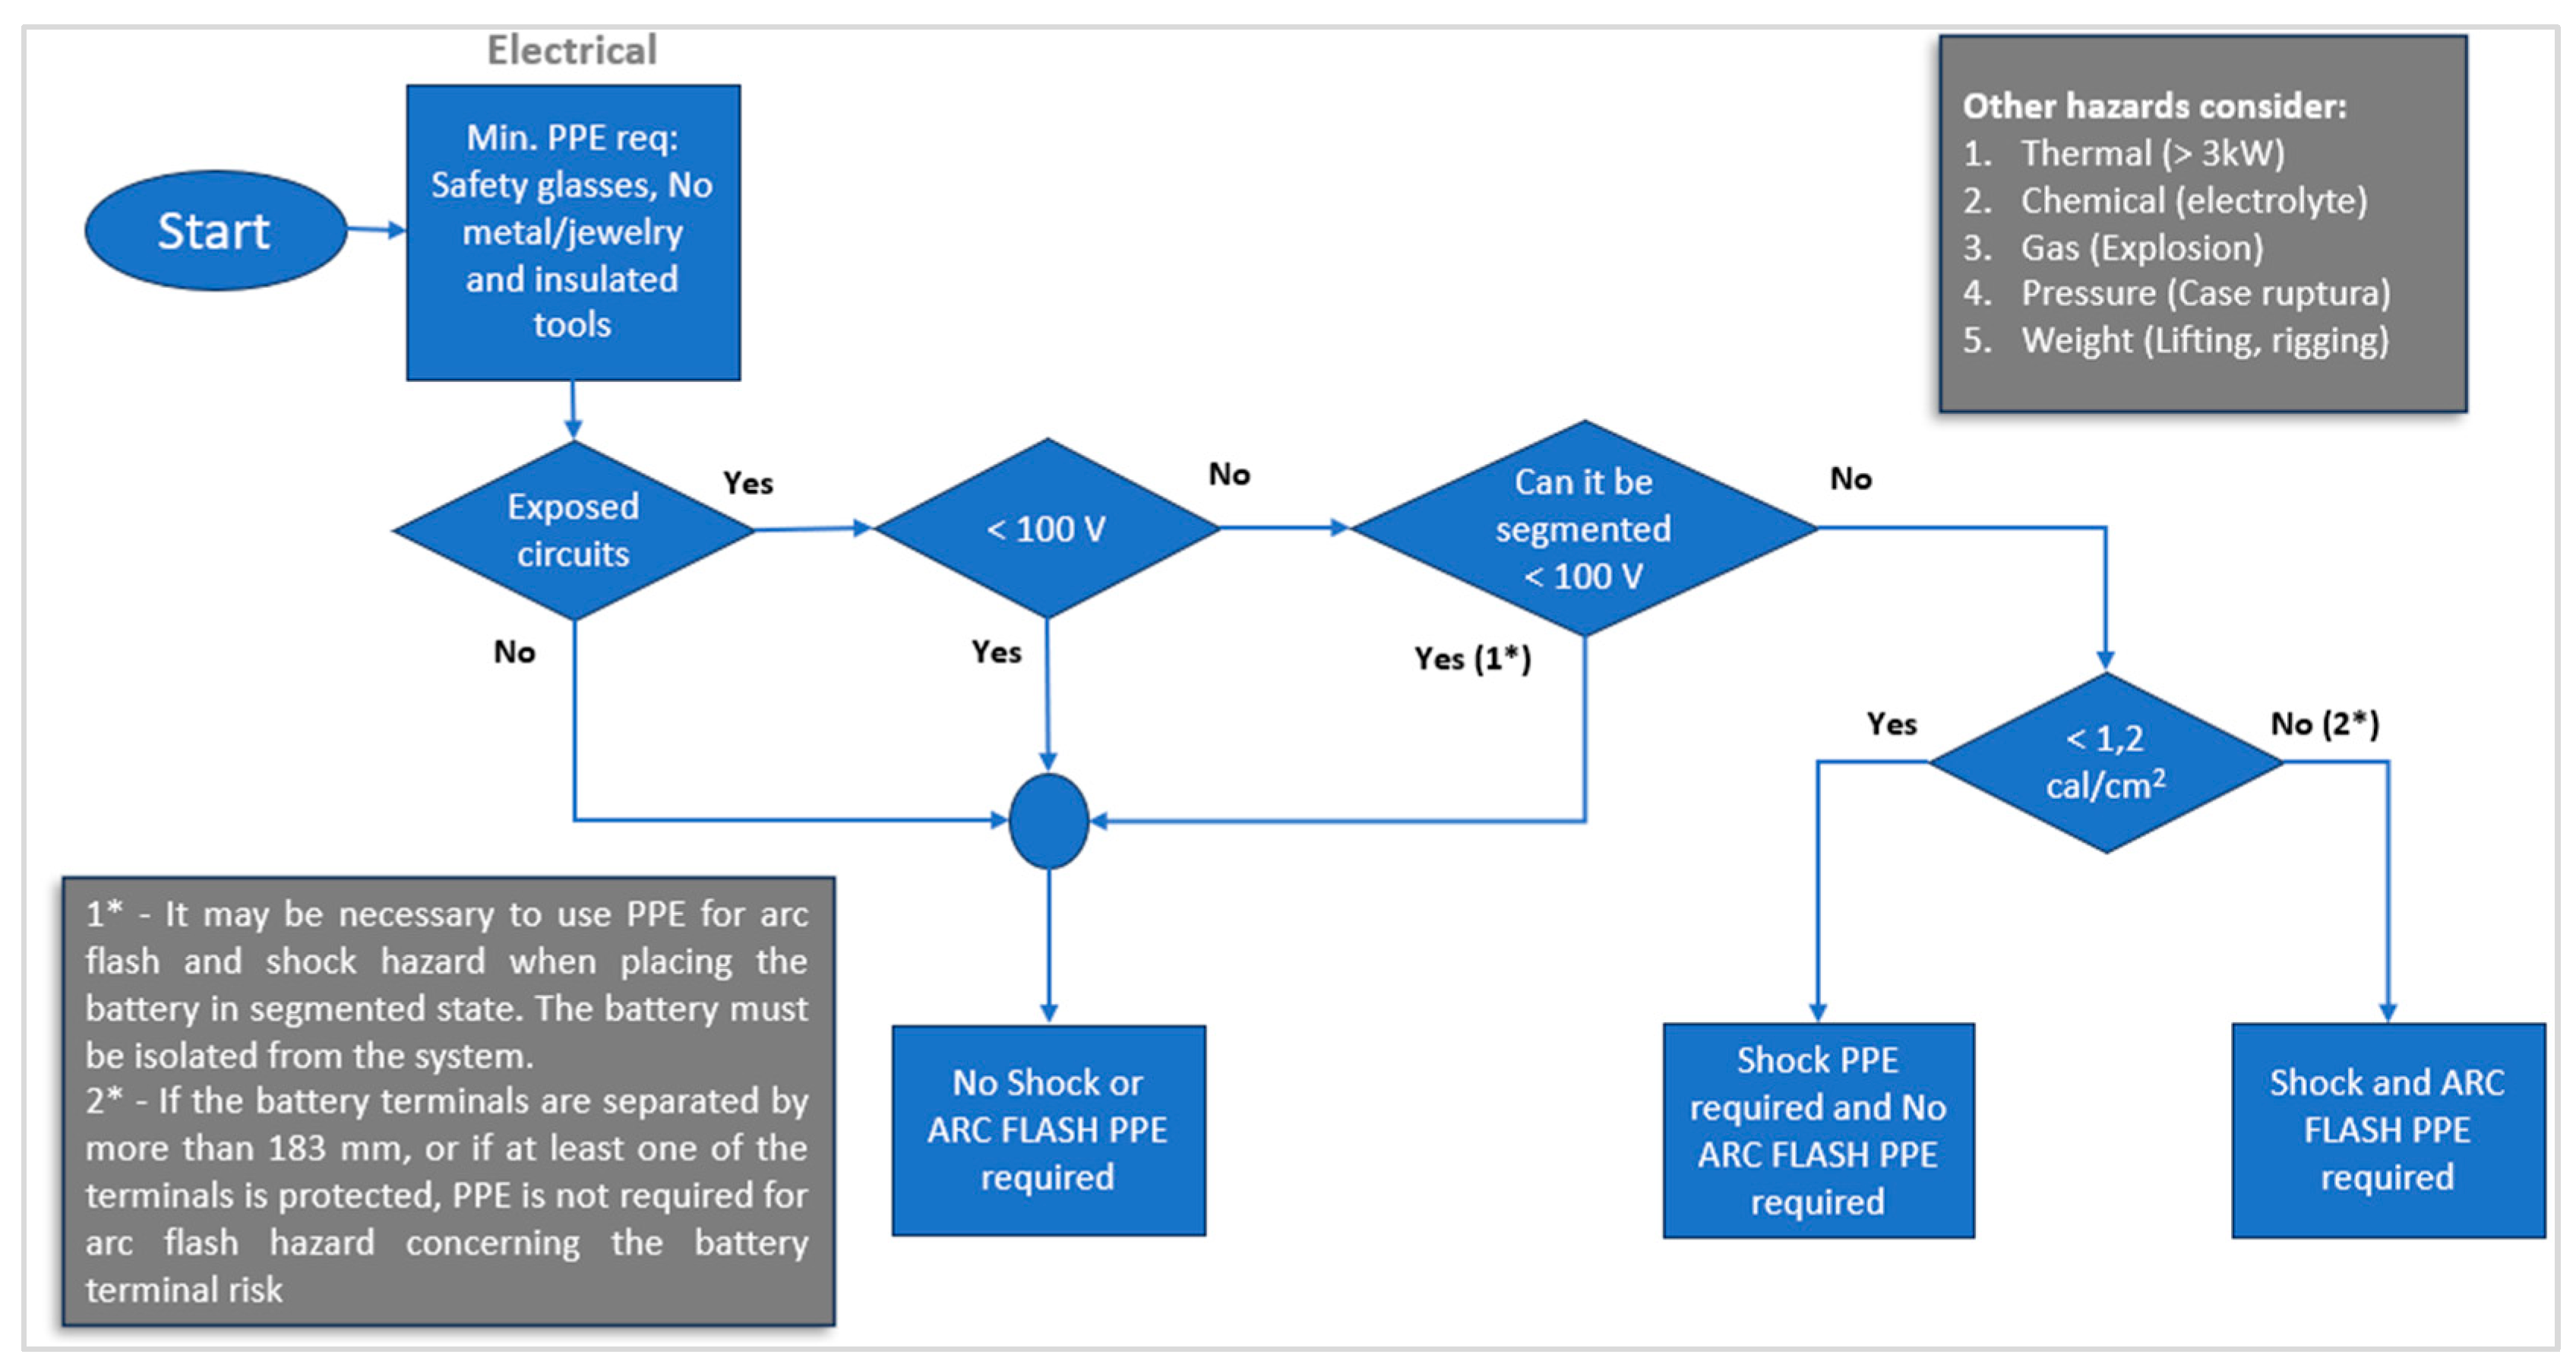
This electrical risk analysis in EV charging systems, and more specifically, the AF consequences, is especially dangerous when high-power DC batteries are used [37]. The NFPA 70E standard indicates how to carry out the risk assessment in battery systems. As shown in Figure 3, when circuits are exposed to voltages above 100 V and an Incident Energy (IE) exceeding 1.2 cal/cm2, workers must be adequately protected against electrical contact and also against the risk of AF.

Figure 3.
Flow chart for AF risk evaluation in batteries.
The danger is particularly high if it occurs in the vicinity of EVs. It is therefore important to know in detail the IE that can occur in a charging system of this type and thus protect all those who handle the charger as technicians or standard users.
2.2. Calculation of IE in Energy Storage Systems
Energy storage systems typically have two distinct stages. On the one side, these systems are connected to a standard AC grid, which facilitates the energy flow to the battery. After rectifying the sine wave, the AC is converted into DC for subsequent storage in the batteries.
As the two types of current mentioned above are present in battery storage systems, there is a double risk from the AF point of view.
In the following, the AF risks on the AC side and the DC side are assessed separately, with emphasis on the different methodologies that exist to assess them.
For the AC part, the IEEE 1584 standard was developed by the IEEE and first published in 2002. It is based on the results obtained from statistical analysis after more than 1800 tests carried out in different laboratories over the years.
It is currently the most recognised and internationally used method for AC systems within its scope of application. With the publication of the latest version in November 2018, the method has been completely updated, both the equations themselves and the methodology for calculating the IE and the Arc Flash Boundary (AFB). Although improvements have been made and a more robust and accurate calculation has been obtained, there are certain intrinsic limitations to this method, as described below.
- Rated voltages between 0.208 and 14.3 kV.
- Frequencies of 50 or 60 Hz.
- Short-circuit currents from 700 A to 106 kA for voltages between 208 and 600 V.
- Short-circuit currents from 200 A to 65 kA for voltages between 601 and 14,300 V.
- Working distances greater than or equal to 305 mm.
- Equipment enclosures with a maximum height and width of 1244.6 mm.
- Separation between conductors from 6.35 to 76.2 mm for voltages between 208 and 600 V.
- Separation between conductors from 19.05 to 254 mm for voltages between 601 and 14,300 V.
To apply this method to AC systems, it is necessary to follow the steps described in Figure 4.
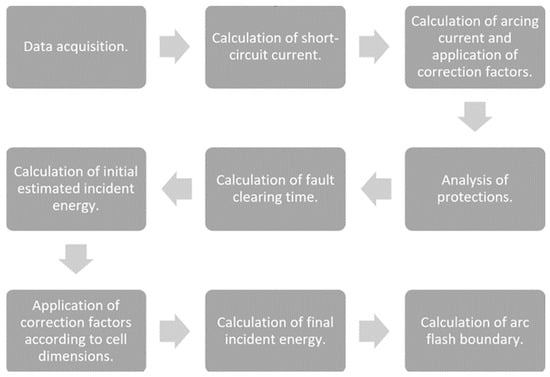
Figure 4.
Representation of the process for calculating the IE according to IE calculation of arc flash boundary IEEE 1584 [34].
However, these standards do not provide a solution for our electric vehicle charging system with energy storage. Other specific methods are required for direct current analysis. There are three main analytical methods for calculating IE in DC that are well developed and recognised:
- Doan (also known as the ‘maximum power’ method) [38].
- Stokes and Oppenlander [39].
- Paukert [40].
These three methods offer advantages and limitations that must be considered in the context of the application of this study. Each of these methods has a very particular approach and characteristics, which are discussed below. The Doan method [38], also known as the ‘maximum power’ method, is characterised by its simplicity of calculation and its conservatism in providing results based on the arc current (Iarc). This approach, defined in annex D.5.1 of NFPA 70E, assumes the maximum power transfers to the arc as a linear source. It occurs when the arc voltage drops to 50% of the supply voltage. Although limited to voltages up to 1 kV, this method is particularly easy to apply.
It has been observed that this method tends to be overly conservative, so it may overestimate the arc current (Iarc) compared to real situations, which may reflect excessive results and high PPE costs. This method is defined by Equations (1)–(4):
where
Ibf: DC short-circuit current (A).
Iarc: DC arcing current (A).
Rarc: Arc resistance (ohms).
Vsource: DC voltage at the point of the fault (V).
tarc: Fault clearance time (s).
D: Working distance (45.7 cm according to section D.3.1 of NFPA 70E 2018).
IEopen: Incident energy with air electrodes (cal/cm2).
IEbox: Incident energy with electrodes under enclosure (cal/cm2).
The Stokes and Oppenlander approach [39] introduces a more complex model, which considers the non-linear arc resistance based on a given impedance. This method, developed from extensive studies of vertical and horizontal electric arcs between electrodes in open air, involves iteration to find solutions and requires the spacing between electrodes to be less than 1 cm. Although it offers the ability to predict whether the arc is sustained under specific conditions, its practical application may be limited. This is due to the complexity of the iterations required and the impossibility of finding solutions if the Iarc falls below a transition point, which can result in a loss of accuracy in the calculations and uncertainty in the assessment of the AF risk. This method is defined by the following equations:
where
It: Transition current (A).
Iarc: DC arc current (A).
Varc: DC voltage at the point of the fault (V).
Zg: Gap between conductors (mm).
Rarc: Arc resistance (ohms).
D: Working distance (45.7 cm according to section D.3.1 of NFPA 70E 2018).
tarc: Fault clearance time (s).
k: Empirical constant used to adjust the Stokes and Oppenlander equations for fault current, exposure time, and other factors that influence the severity of the AF (k = 0.127 for low-voltage electric panels).
a: Empirical parameter that depends on the characteristics of the equipment and the environment in which the AF occurs. It is related to the distance from the arc to the person or equipment to be protected (a = 100 mm for low-voltage electric panels).
Earc: Energy produced during the arc (kWh).
IEs: Surface energy at working distance (cal/cm2).
IEi: Incident calorific energy (cal/cm2).
The method proposed by Paukert [40] also considers the non-linearity of the arc and offers higher accuracy in energy calculation, especially for currents above 100 A. This method is based on data collected from arc tests performed in various configurations and conditions. This has made it possible to formulate equations that consider the variation in arc resistance as a function of electrode spacing (Zg). Although it offers higher accuracy compared to other methods, it also requires iterative solutions and has limitations in terms of applicability, especially for inter-electrode distances greater than 200 mm and currents greater than 100 kA. This method is defined by the following equations:
where
Iarc: DC arc current (A).
Varc: DC voltage at the point of the fault (V).
Rarc: Arc resistance (ohms).
tarc: Fault clearance time (s).
k: Empirical constant used to adjust the Stokes and Oppenlander equations for fault current, exposure time, and other factors that influence the severity of the AF (k = 0.127 for low-voltage electric panels).
a: Empirical parameter that depends on the characteristics of the equipment and the environment in which the AF occurs. It is related to the distance from the arc to the person or equipment to be protected (a = 100 mm for low-voltage electric panels).
Earc: Energy produced during the arc (kWh).
IEs: Surface energy at working distance (cal/cm2).
IEi: Incident calorific energy (cal/cm2).
As already indicated, for the correct application of this method, it is necessary to solve the above Equations (11) to (13) by iterations. The first step is to know the electrode separation Zg (mm) and to apply an estimation within a pre-established range. Subsequently, the values of Varc and Rarc can be calculated, as shown in Table 2.
Table 2.
Varc and Rarc values as a function of electrode separation for the Paukert method.
The choice between these methods depends on the specific characteristics of the system, the availability of data, and the need for accuracy in the arc flash IE calculation. Each method has its advantages and disadvantages, and it is important to analyse these considerations when selecting the most appropriate approach for a particular electrical safety application.
For systems with voltages above 1 kV and more than 100 kA, the previously proposed methods are not able to determine a solution to the problem posed, as far as the precise calculation of the IE is concerned. There are regression analysis models and mathematical modelling methodology [41] that analyse this specific situation.
For the case study of this work, no system voltages higher than 1 kV are expected during the DC electric car charging process. Short-circuit currents are also expected not to exceed 100 kA in case of a fault. Therefore, the mentioned methods can be used to solve our model. A comparison of the three methods described above is carried out later. In EV charging systems with batteries, any of the circumstances applicable to these methods can occur, as it is presented below.
2.3. Possibility of Occurrence of AF
The risk of an arc defect is composed of:
- The probability of an accident occurring in which injuries or dangerous health risks to workers are produced, due to a WA (Work Accident).
- The severity or seriousness of the injuries caused by this phenomenon.
The assessment of this risk consists of a general process in which both aspects, probability and severity, are estimated. The NFPA 70E standard has compiled in Table 130.5(C) different tasks that are very common when performing work in electrical installations of any type. For each of these tasks, it is established whether a WA is likely to occur or not. Table 3 includes the main tasks that apply to our EV charging system with lithium battery storage.
Table 3.
Tasks, operations, or manoeuvres with a probability of Work Accident (WA) (Source: NFPA 70E. Table 130.5(C)).
If the occurrence of AF, specific and additional protective measures must be selected and implemented following the risk control hierarchy detailed in section 110.1(H) of NFPA 70E. These measures include, among others, conducting a detailed incident energy analysis and the proper use of mandatory PPE.
3. Modelling of Charging Systems with Storage
3.1. Mode 4 DC Charging System
EV chargers with energy storage have been an innovation in the field of sustainable mobility. This type of device offers a key advantage for Charge Point Operators (CPOs), as they do not require a high-capacity grid connection. For example, with a connection of just 30 kW, it is possible to charge vehicles with more than 200 kW.
This is achieved through the simultaneous use of energy from the electrical grid and the energy stored in the lithium battery integrated into the charger itself. However, chargers with batteries also have some disadvantages:
- A high acquisition and installation cost,
- Fire danger,
- Risk to users interacting with these chargers.
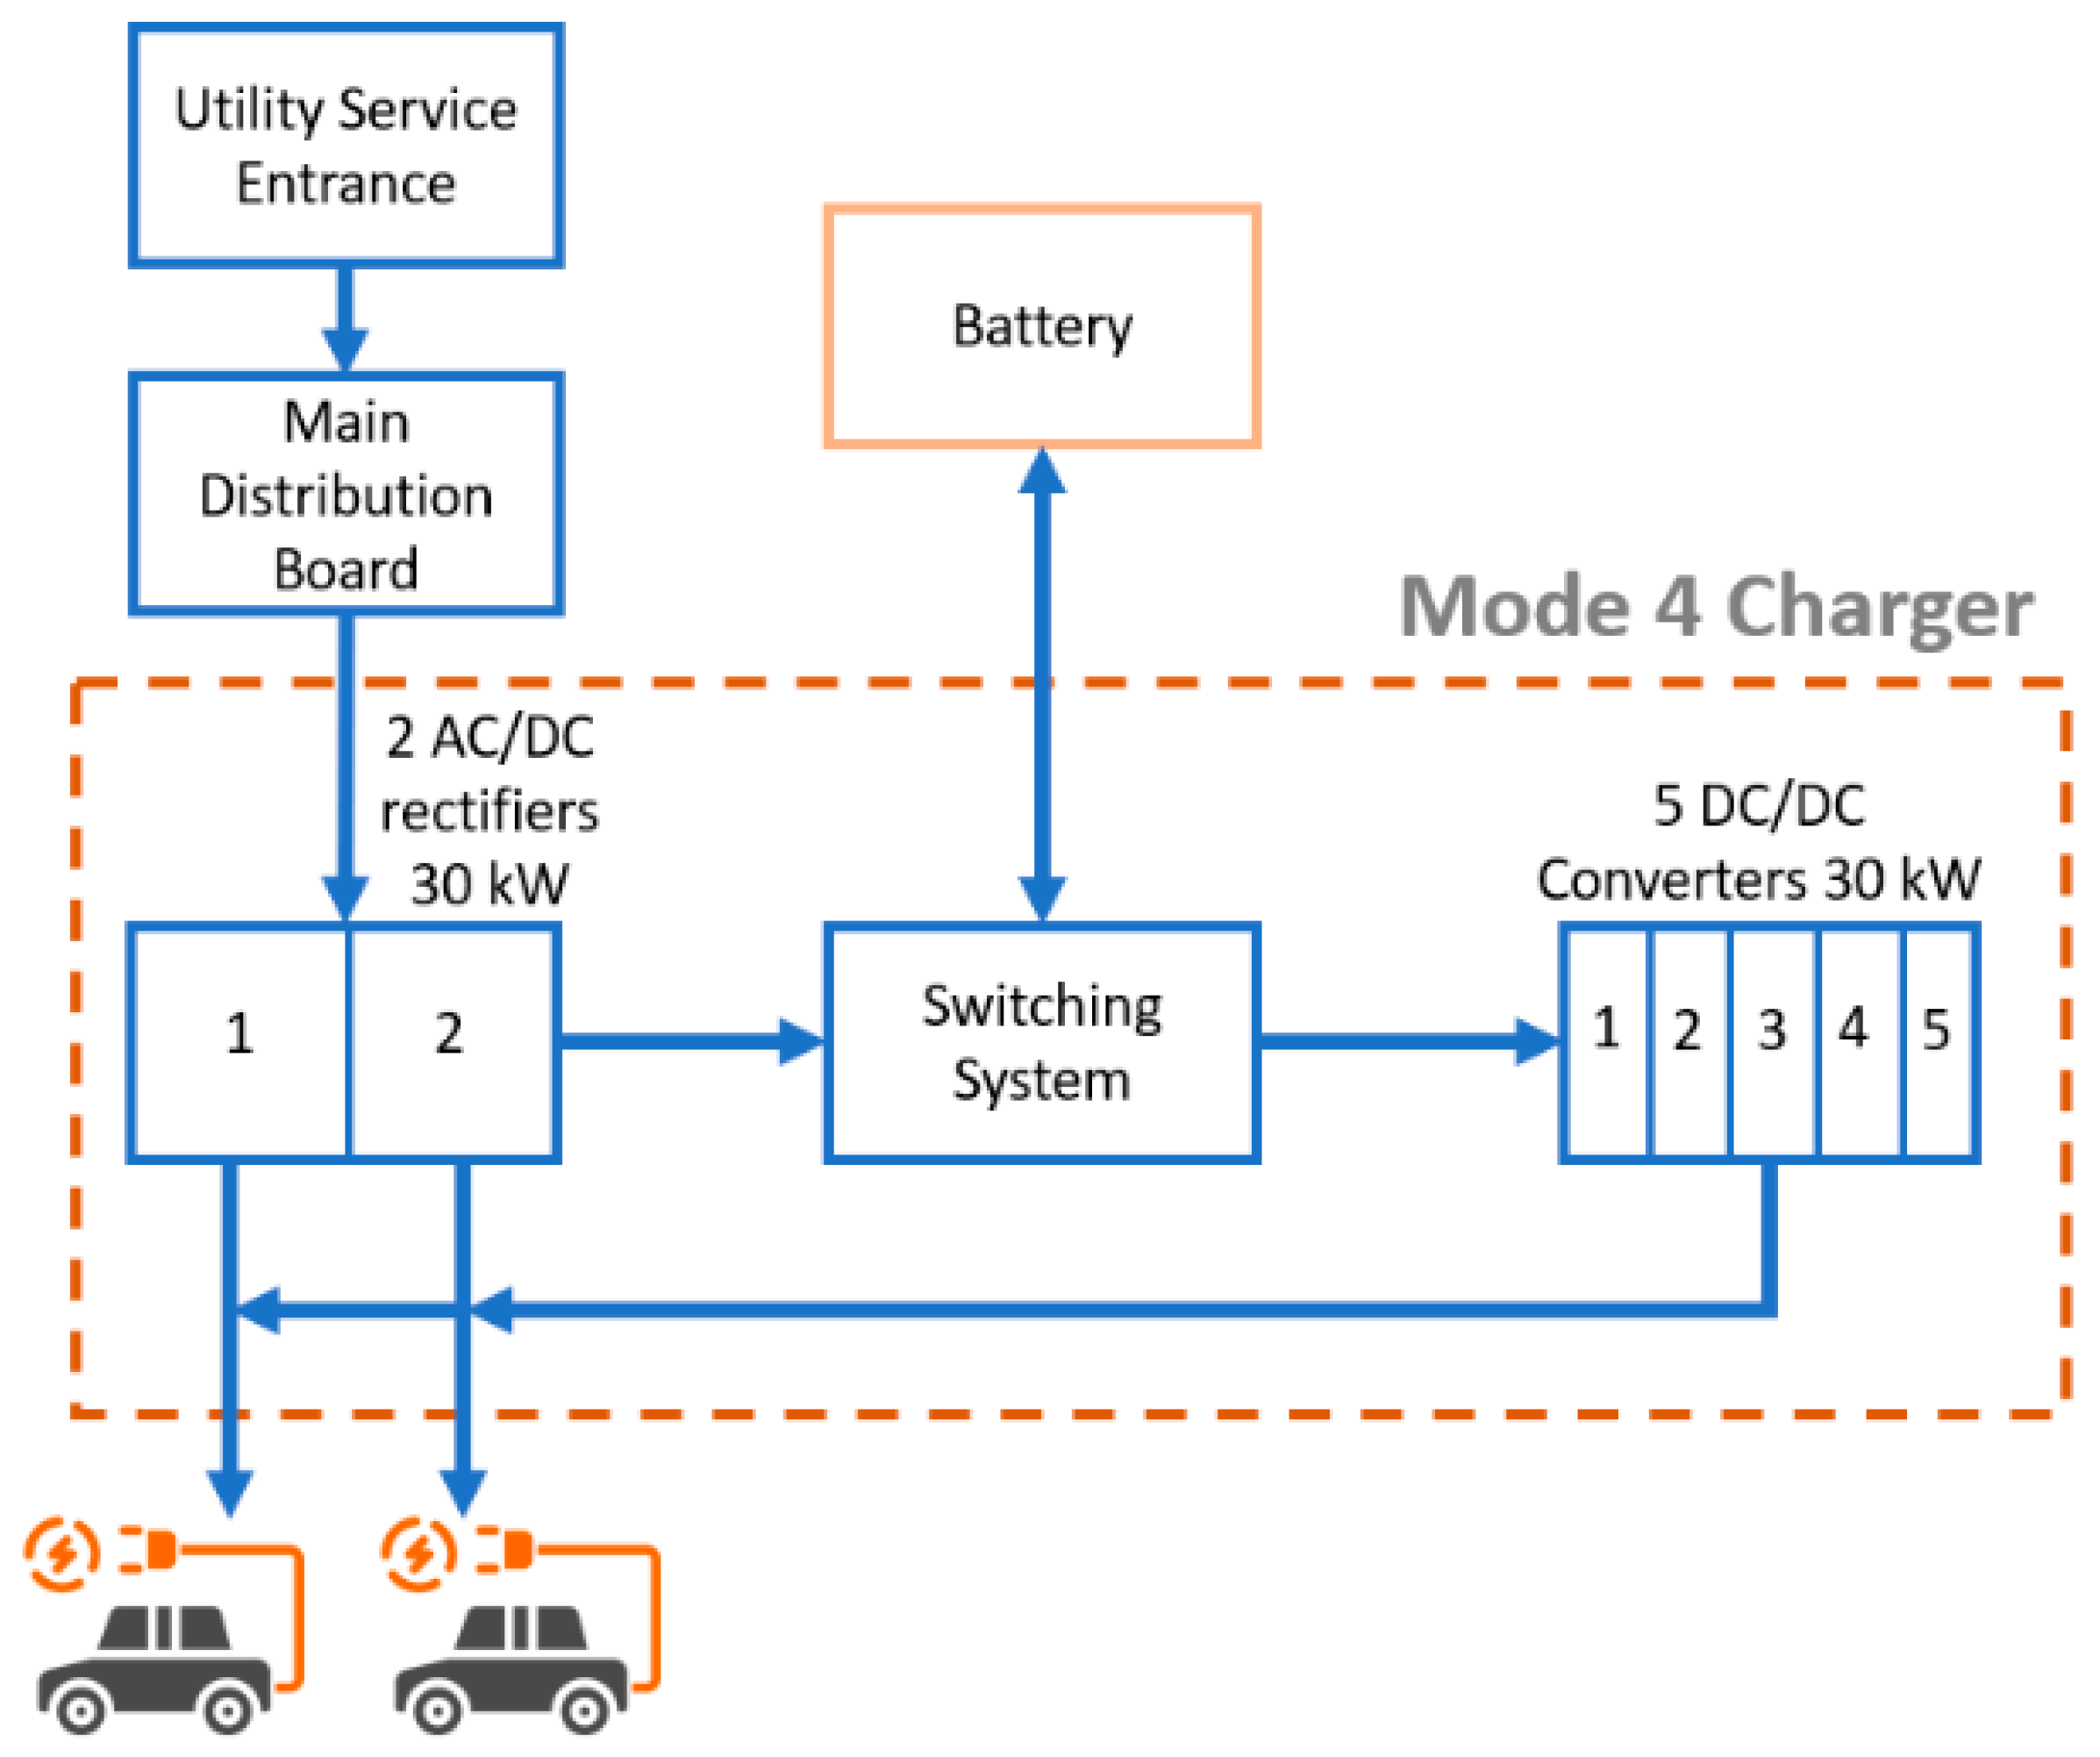
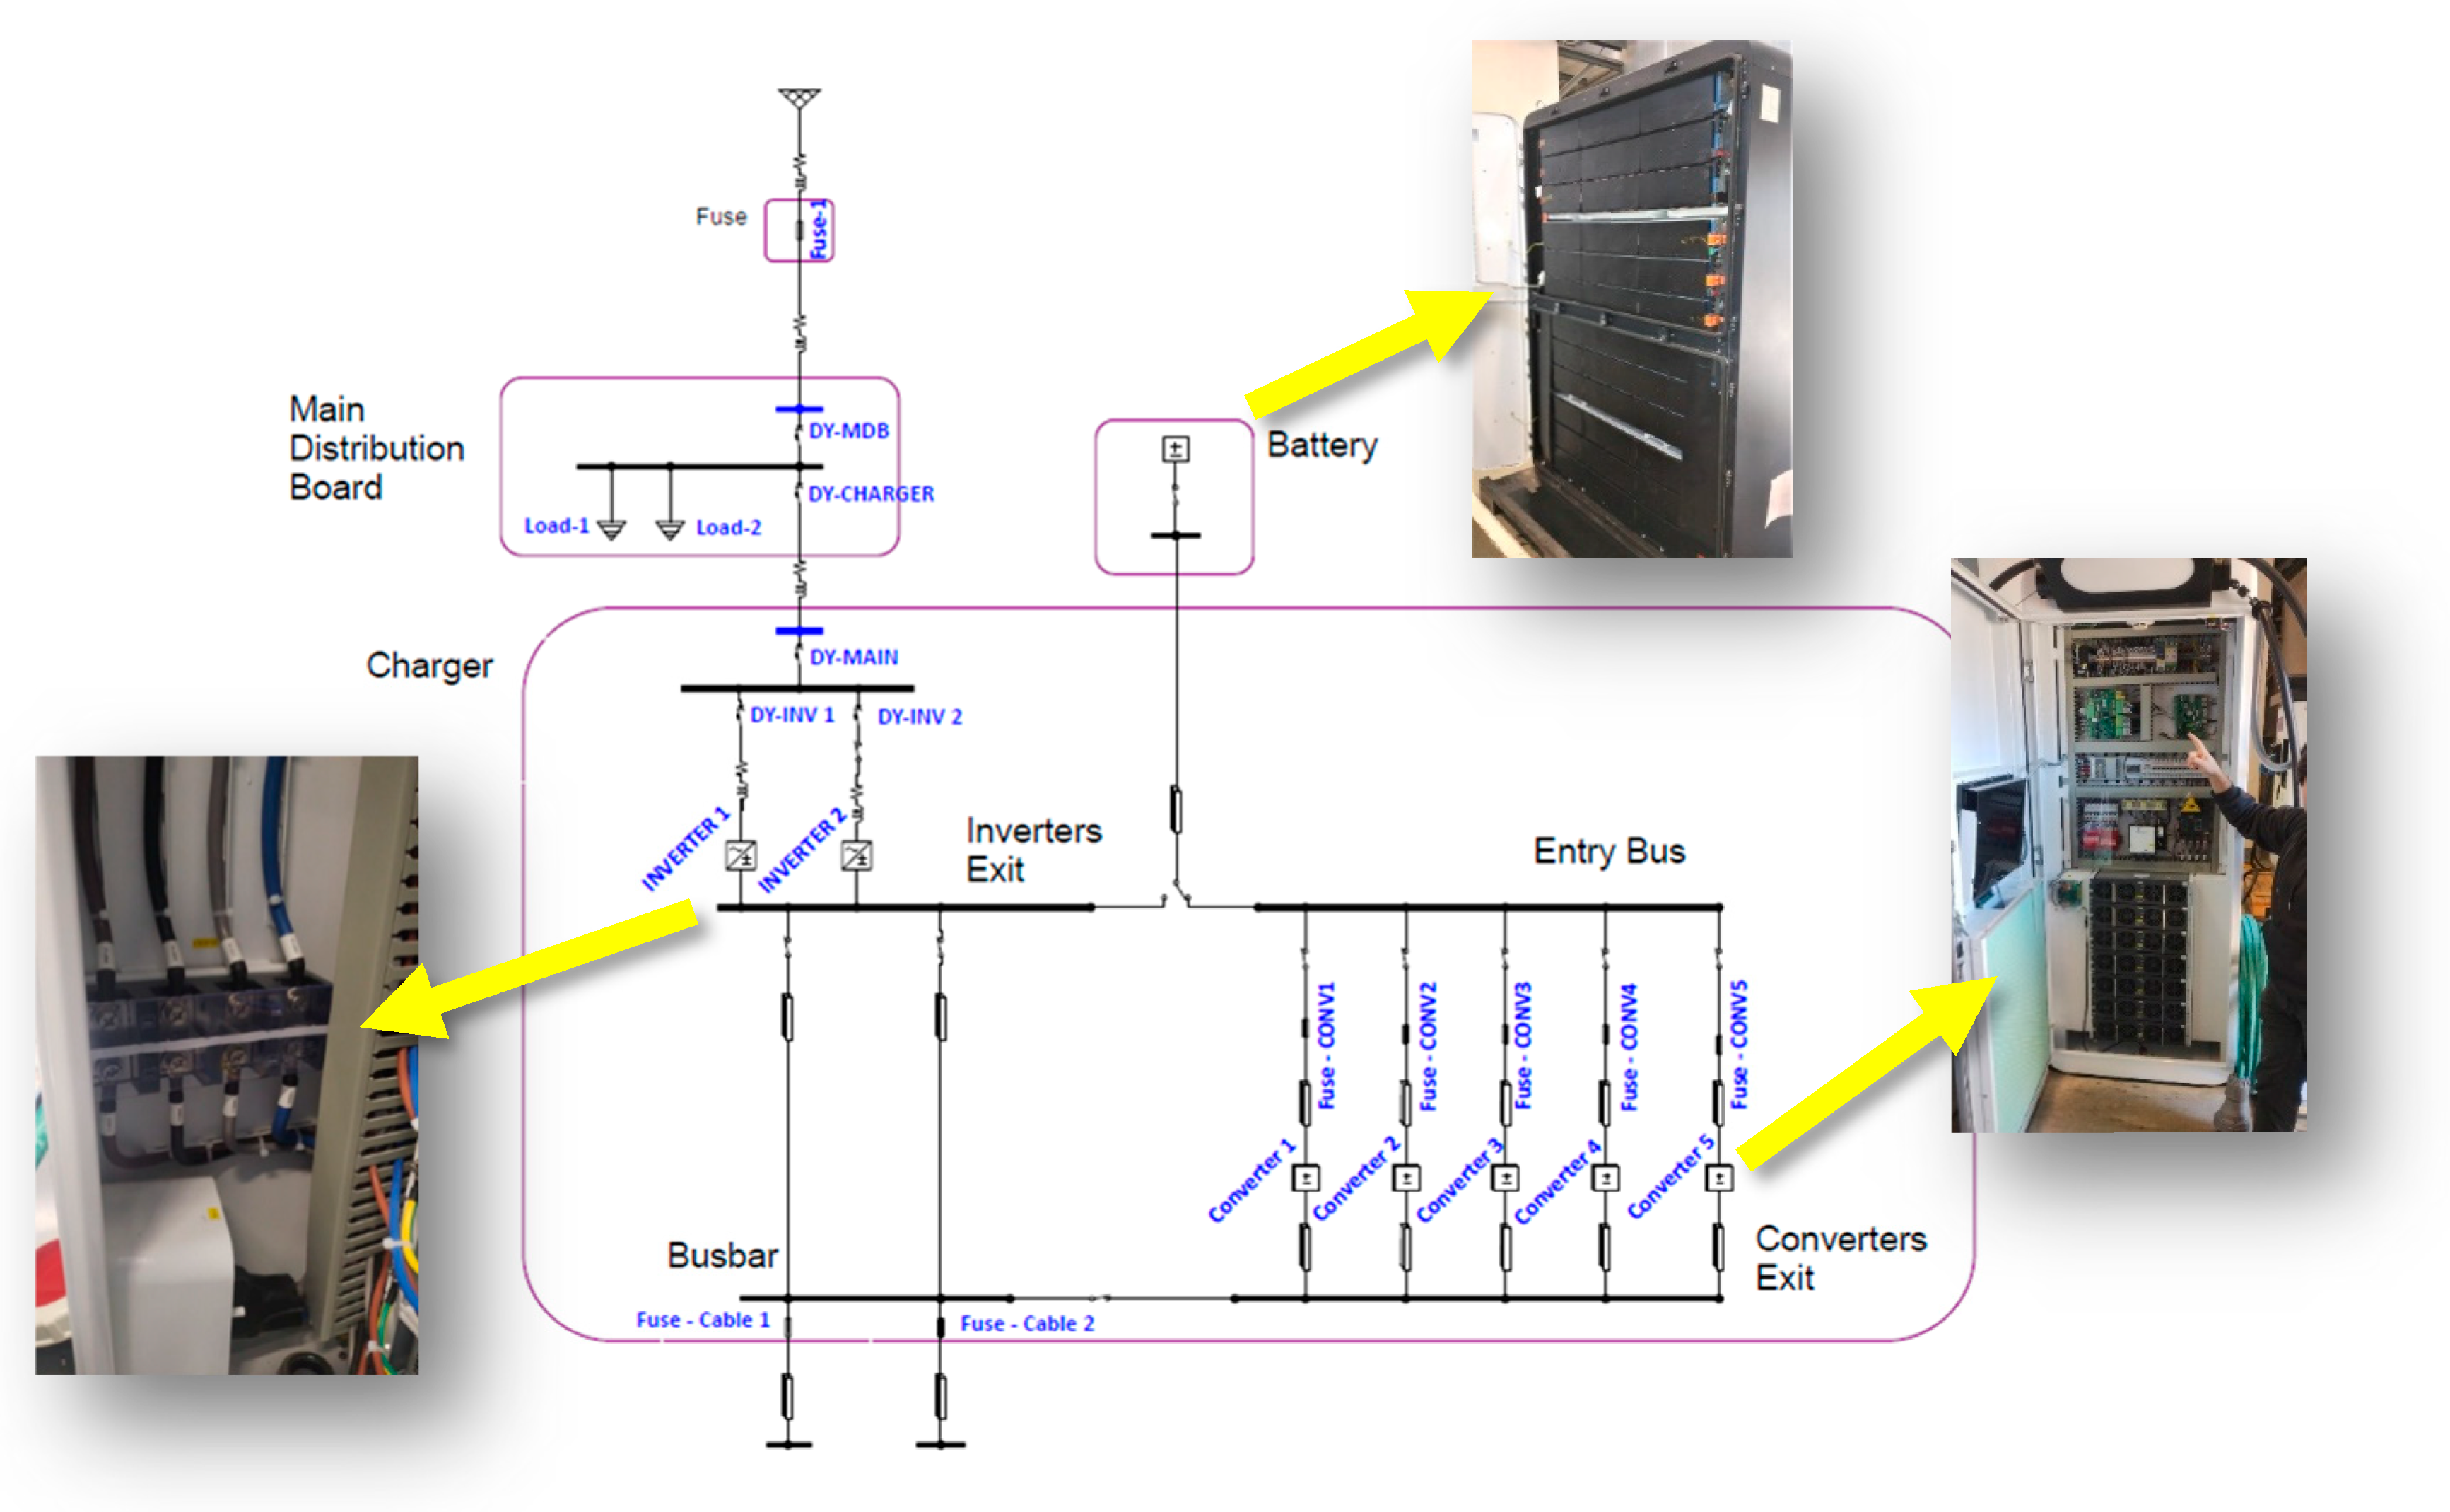
Uncertainty for workers who install, repair, operate, or maintain these charging systems. Due to their high energy capacity, the IE that may occur in these chargers can easily exceed the recommended limit values specified by the NFPA 70E (1.2 cal/cm2). Like any other EV charger, chargers with batteries require a series of electrical protections and interconnections between the different components that make up the system. Figure 5 represents the modelled system, which allows for the simultaneous charging of up to two EVs. This figure identifies critical components, such as the grid connection, the powerful 233 kWh battery, rectifiers and converters, as well as their interconnections, essential to locating the potential danger points where an AF could originate. The system has the following devices:
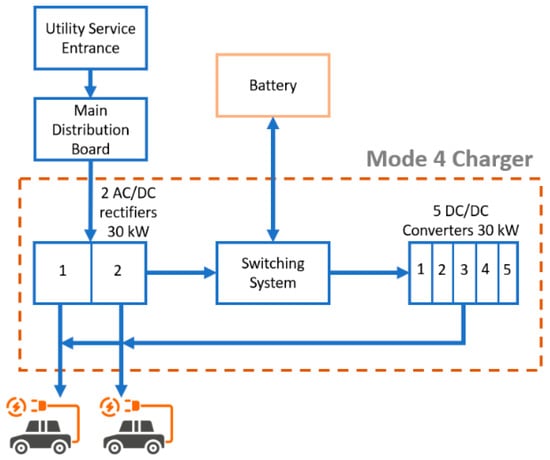
Figure 5.
Representation of the Mode 4 DC charging system with batteries.
- An electrical panel for connection to the electrical grid.
- A 233 kWh capacity battery.
- A switching device for charging and discharging the battery.
- Two 30 kW AC/DC rectifiers.
- Five 30 kW DC/DC converters.
3.2. States During the EV Charging Processes
For the research, a commercial charging system from the manufacturer Xcharge has been considered, and its key characteristics are shown below. Table 4 lists the parameters that could influence the system modelling, as well as its subsequent simulation.
Table 4.
Main characteristics of the Net Zero 210 charging system.
High-power DC chargers (Mode 4 according to IEC 61851-1 [19]) require a series of states to carry out the EV charging process under maximum safety conditions for the user, as well as for the EV and its battery.
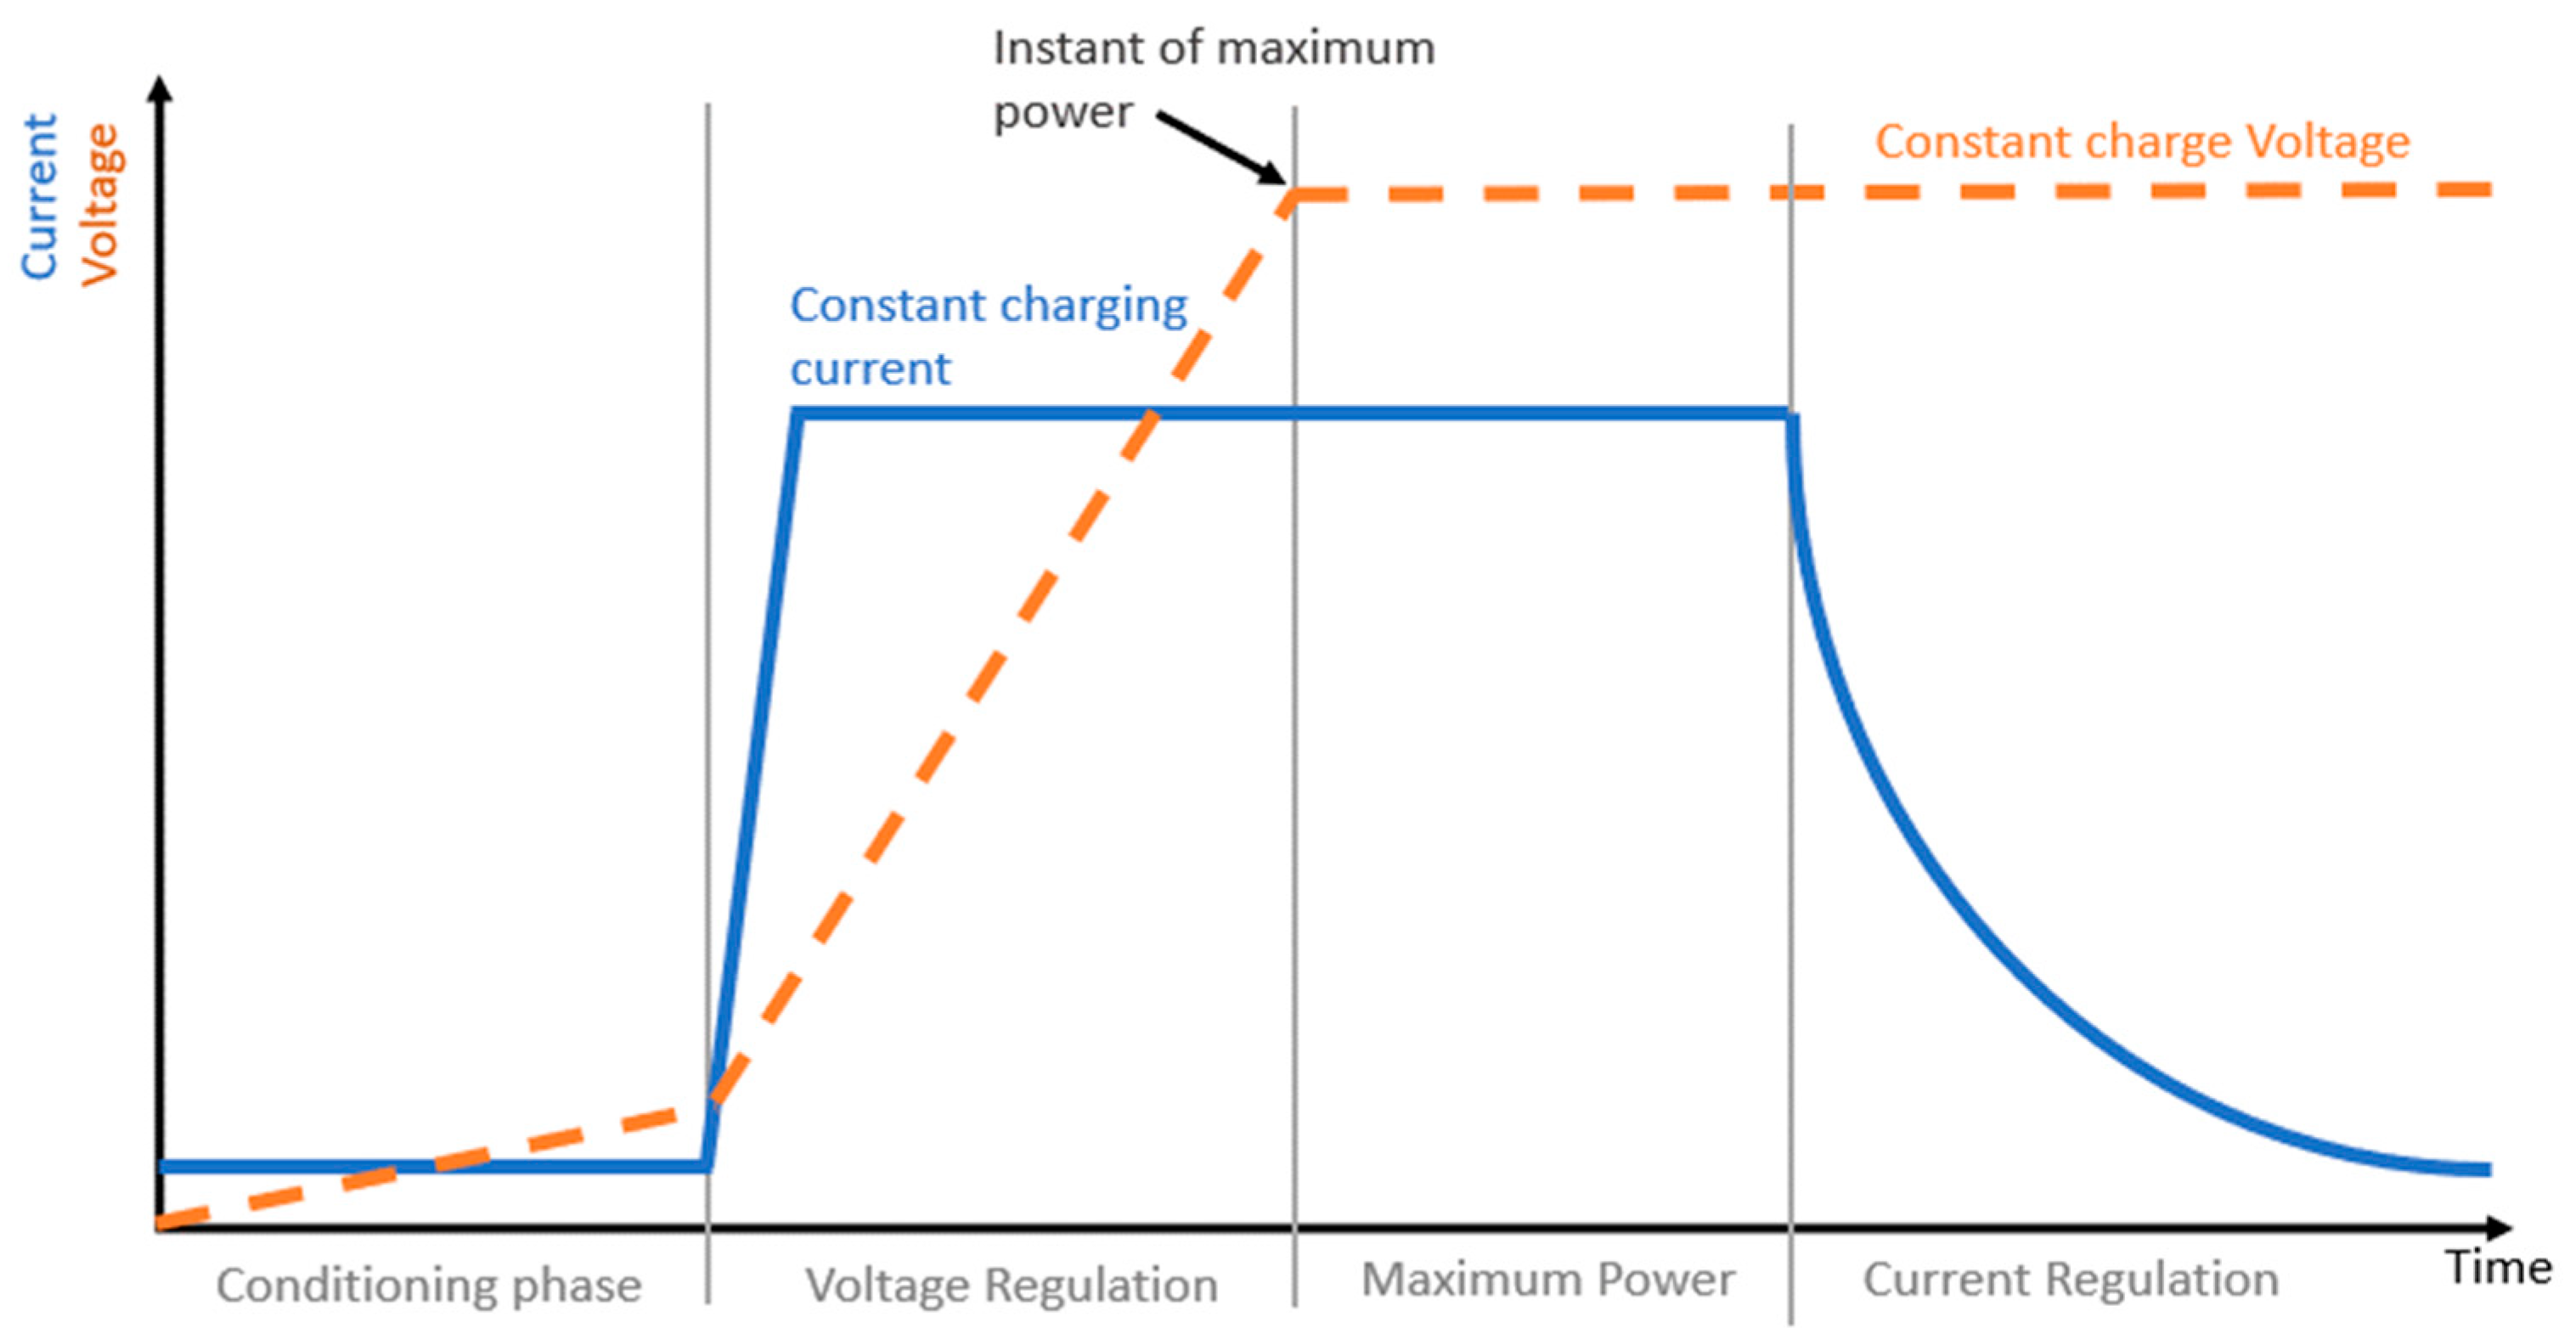
Once the EV has been connected to the charging system through the approved connector (CCS1, CCS2, NACS, etc.), and the system has been activated through the payment gateway (if applicable), the charging states that an electric vehicle goes through, as represented in Figure 6 and described below.
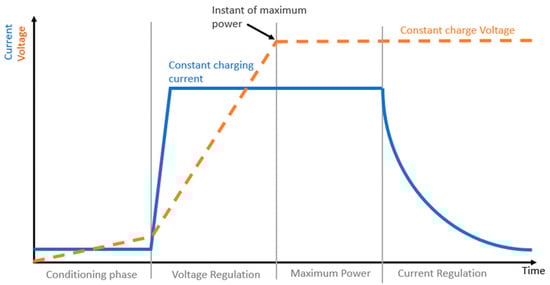
Figure 6.
Typical voltage–current curve during the EV charging process.
- Conditioning phase: In this initial state, the EV demands some energy from the charging system to condition the batteries to their optimal temperature before starting to deliver energy to the battery and doing so in the shortest time possible.
- Voltage regulation: In this phase, the charger supplies a constant current to the EV and a variable voltage. After a rapid increase, the current remains at its maximum level according to the vehicle manufacturers and battery specifications. During this phase, DC flows into the EV’s battery and gradually increases the stored energy, thanks to the progressive increase in voltage. The duration of this phase depends on the initial state of charge of the battery, the vehicle’s maximum charging capacity, and the specifications of the charger itself.
- Maximum power: During these minutes, the charging system delivers the maximum power to the vehicle. It is in this state that the charger provides most of the electrical energy to the vehicle. The BMS (Battery Management System) continuously monitors the charging process and determines when to begin reducing the power from the charger to the vehicle.
- Current regulation: Once the battery reaches a certain charge level, typically around 80% as specified by most manufacturers, the charger switches to the constant voltage phase. In this phase, the charger maintains a constant voltage while the current decreases rapidly. The voltage value is adjusted to prevent the battery from overcharging and to allow the current to gradually decrease as the battery approaches its maximum capacity. This phase allows for a slower and more controlled charge, protecting the battery’s lifespan and ensuring maximum safety during this charging state.
Throughout these four phases, the vehicle’s battery management system continuously monitors the temperature and status of each battery cell to ensure that the charging process is safe and efficient. Once the battery is fully charged or the preset charging limit is reached, the process automatically stops to avoid any dangers.
3.3. System Simulation
For the simulation of our charger model with an energy storage system, the ETAP® simulation tool version 22.5.0 has been used. This software allows an analytical solution to problems posed for several reasons:
- It allows the creation of detailed and accurate models of electrical systems, using closed expressions (equations) of known mathematical functions.
- It incorporates advanced algorithms and calculation methods to perform various simulations, such as load flow, short circuit, transient stability, harmonic analysis, and protection coordination, among others.
- This software does not just simulate. It also analyses the results. It provides detailed reports, graphs, and visualisations that allow engineers to understand system performance, identify potential problems, and evaluate different solutions.
- Thanks to this tool, which has been in development for over 40 years, experimental measurements in the real world are avoided, reducing the risk involved in performing and controlling electric arcs generated in real installations.
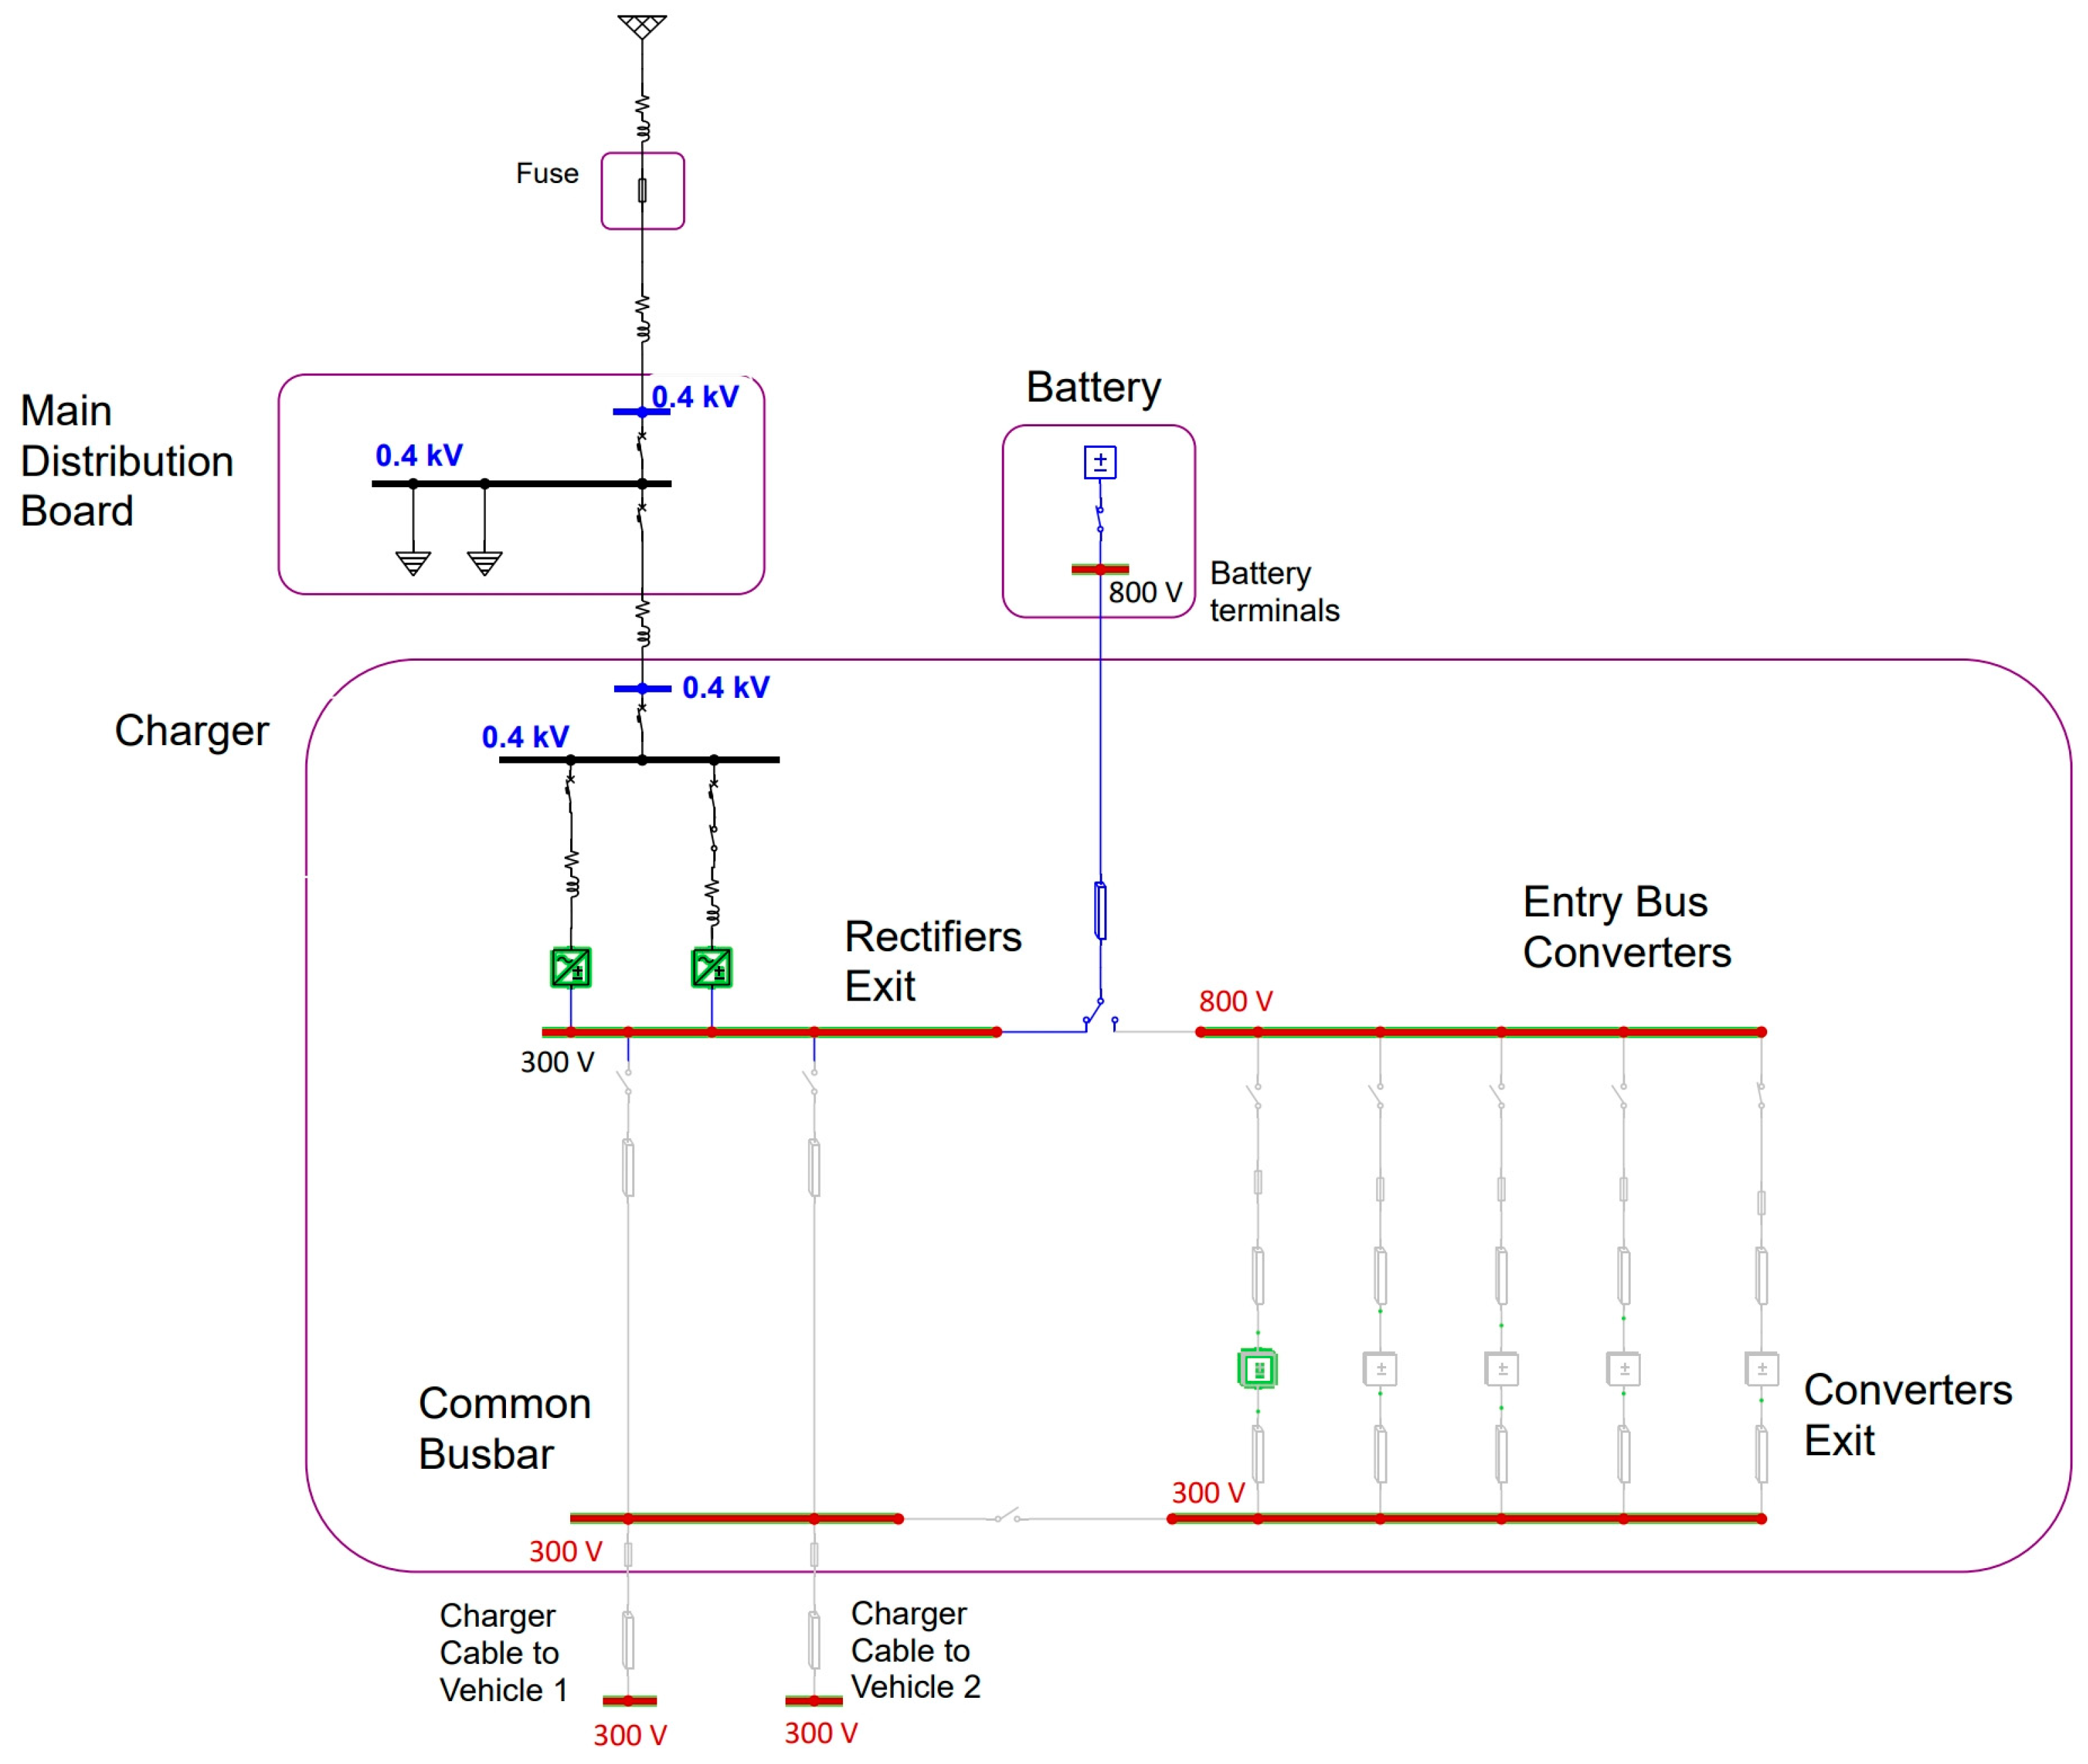
This process has improved operational efficiency and decision-making by optimising resources and facilitating the automation of calculation processes. A precise calculation of the IE has been achieved for both AC systems (IEEE 1584 method [30]) and DC systems (Doan, Paukert, or Stokes and Oppenlander). Figure 7 shows the modelled system in the simulation tool, as well as the actual image of the main components that make it up.
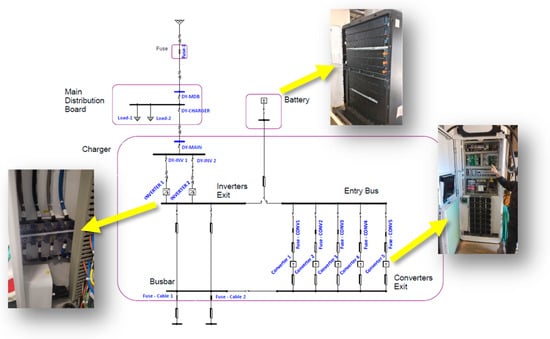
Figure 7.
Representation of the schematic of the charger model with a battery.
During the simulation, a series of assumptions were considered before calculating the IE. The states already described above, plus a specific state of charge for the battery attached to the charger, have been considered. The preconditioning state of the vehicle battery has not been considered, as it is a very low energy state, which does not danger to workers or EV users.
Thus, the assumptions for the operating states of the system are described below:
- Four stages (working status 1 to 4) have been established until the maximum power state of the charger is reached. These well-differentiated stages have been established according to the number of rectifiers and/or converters working at each moment.
- During the constant voltage state, six stages have been considered (working status 5 to 10), which correspond to the different intermediate steps between the period of maximum power and the disconnection of the charging system. In these stages, converters and rectifiers are disconnected as the current demand decreases.
- A final state called Battery Charge (working status 11) has also been simulated, where the system only charges its battery without charging any EVs. Figure 8 shows this mode of operation of the system:
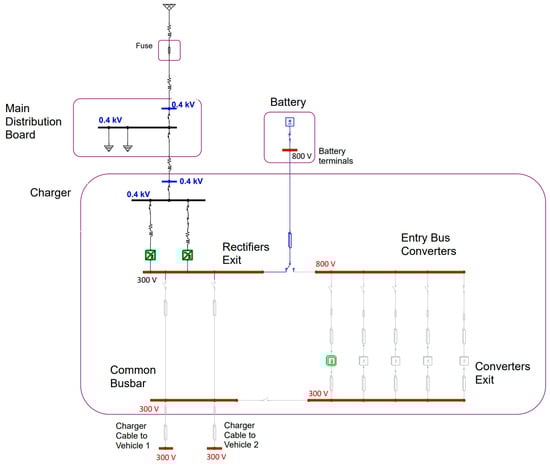 Figure 8. State in which the system’s battery is being charged.
Table 5 shows the components that operate in each of these stages (working status) of the modelled system. This consideration is necessary to identify which components are energised at each step.
Table 5.
Summary of the stages of the model reloading process.
3.4. Protections of the Charging System
As already mentioned, during the development of the different DC calculation methods (Doan, Paukert, or Stokes and Oppenlander), one of the variables that most influences the IE value is the opening time of the protections in the event of a fault (tarc). This time is determined by the protections that make up the system, mainly circuit breakers and/or fuses.
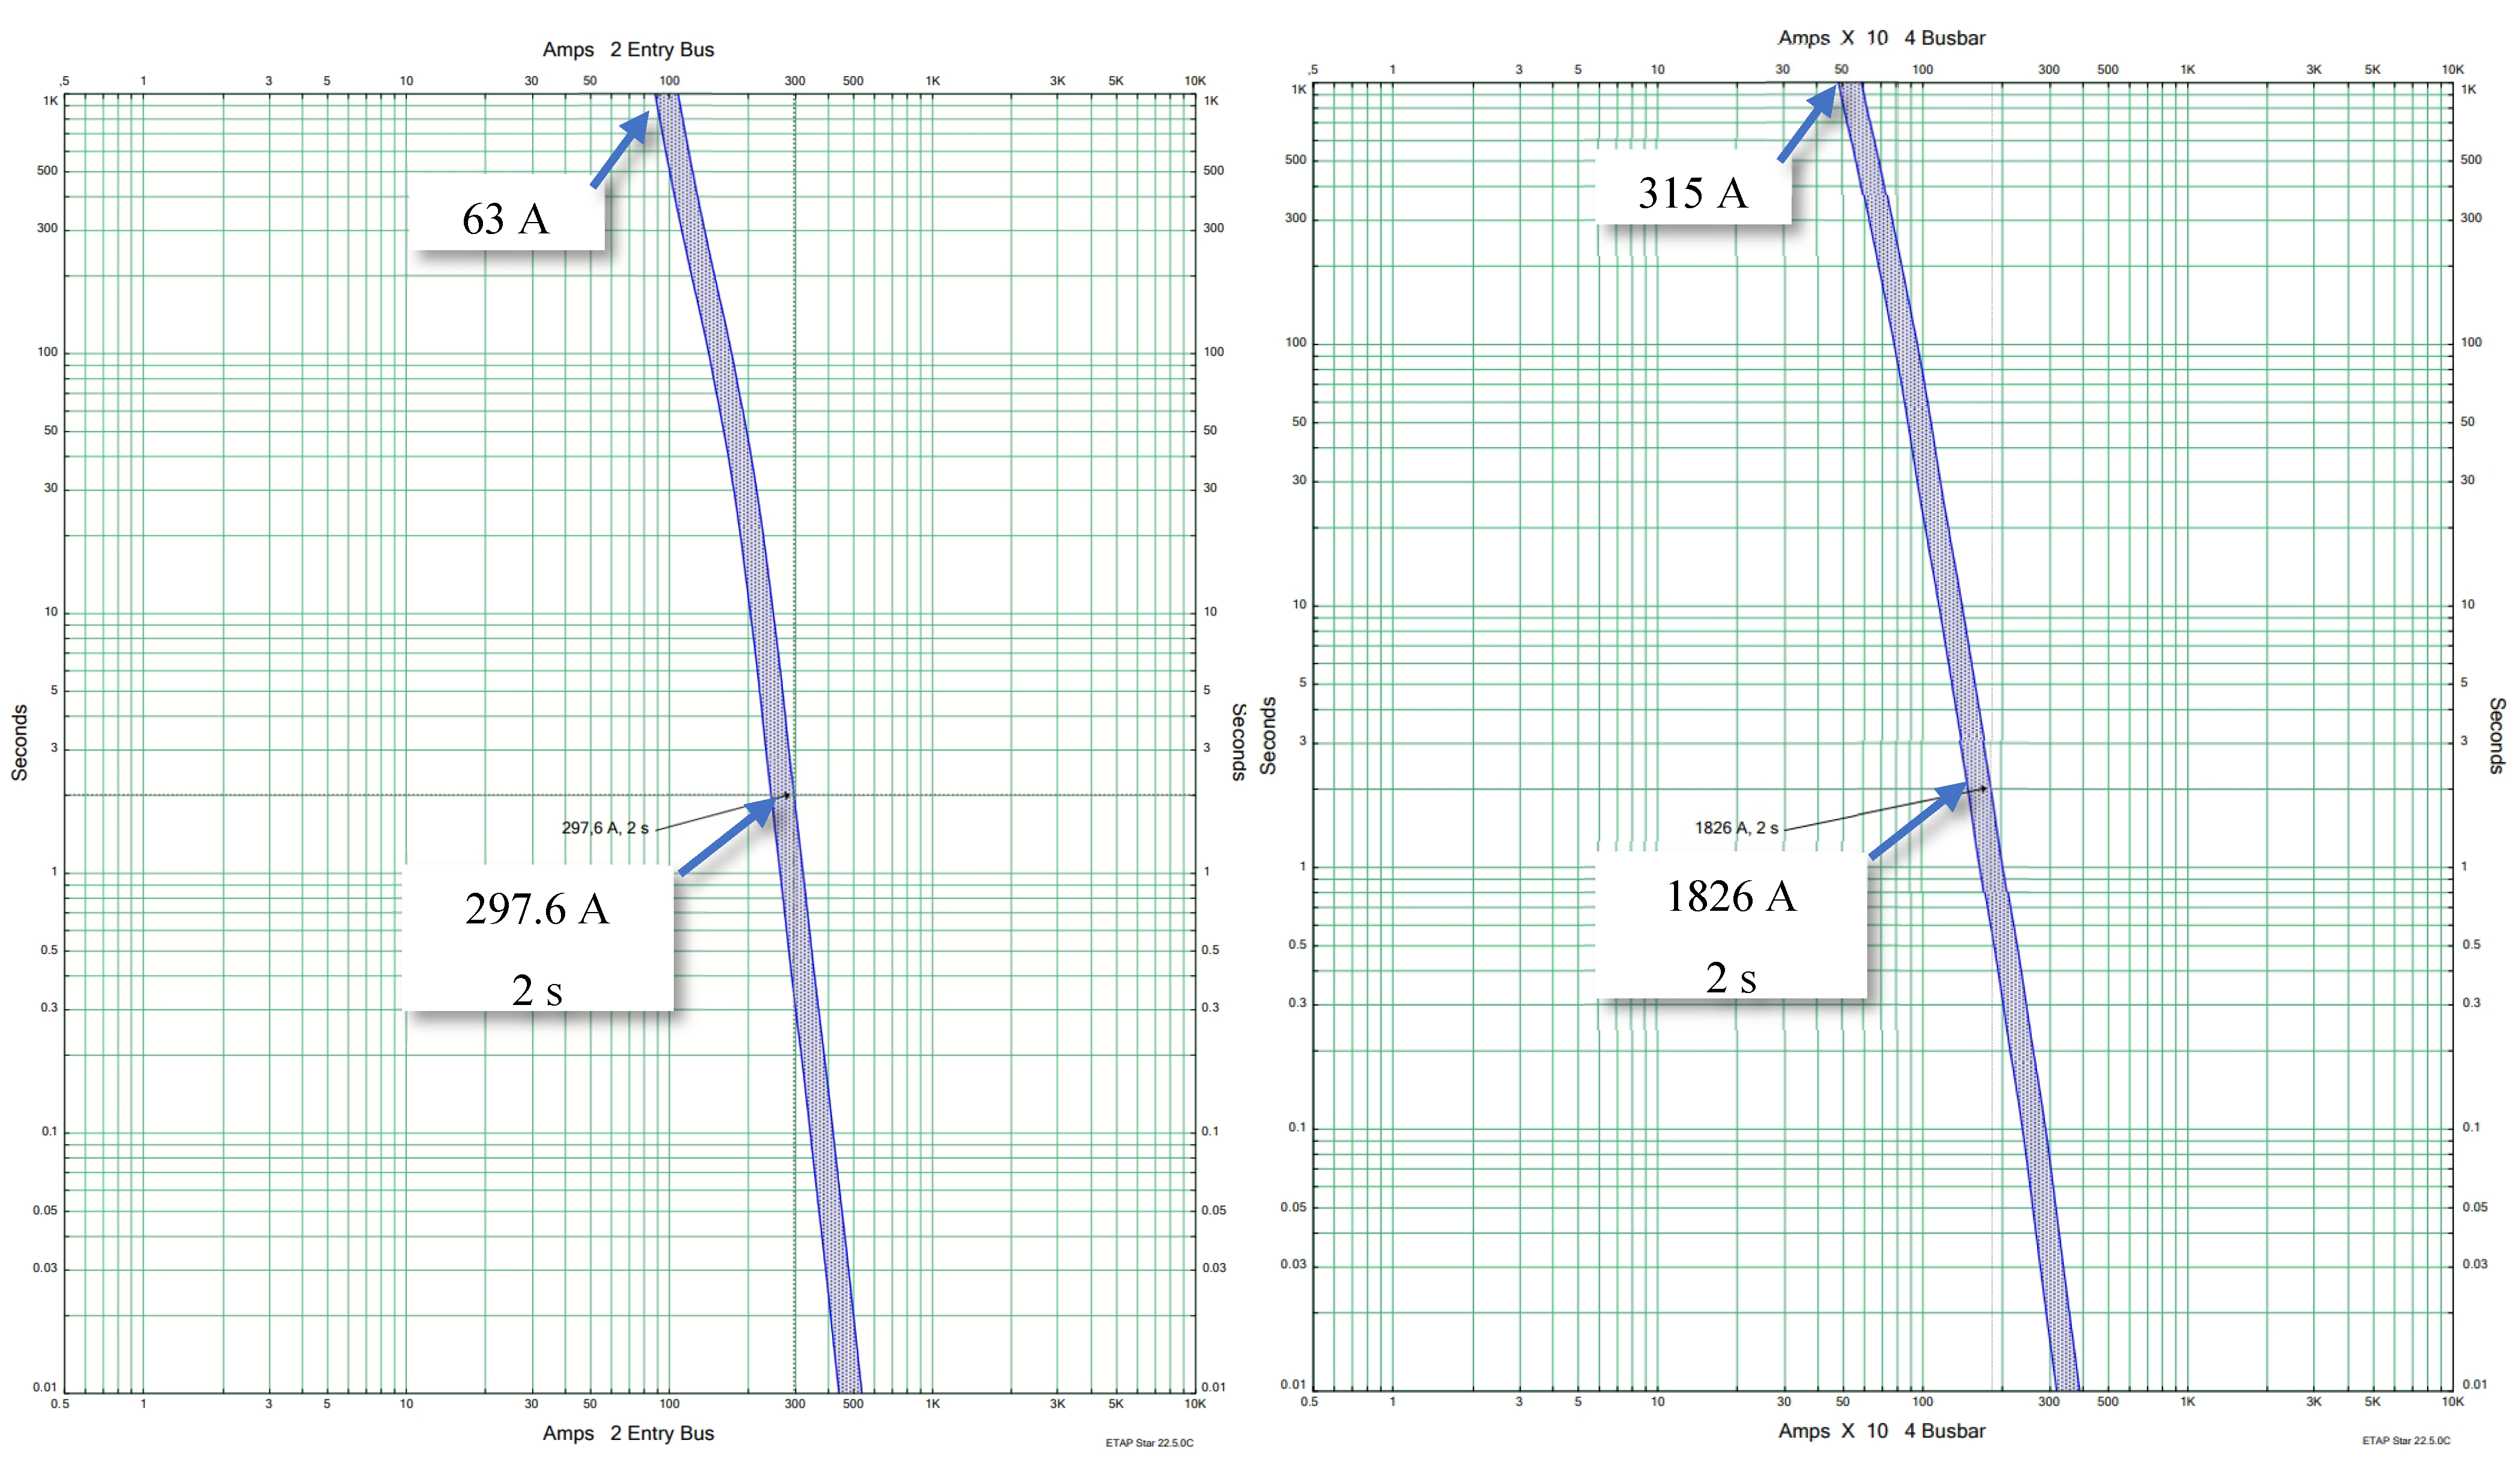
The simulated system has different electrical protections that directly determine the calories per square centimetre that can affect people in the vicinity of the charging system. Specifically, the charger has multiple protections, including DC fuses in the supply lines to the converters (63 A, 1000 V) and the output cables connected to the electric vehicle (315 A, 1000 V). As the simulated system is a commercial product, it was not considered appropriate to modify or adapt the internal protections of the system. Figure 9 shows the characteristic curves of the mentioned fuses.
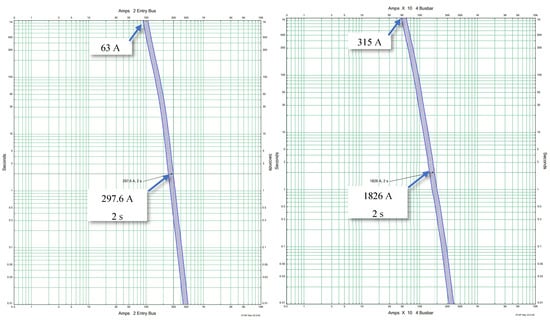
Figure 9.
Characteristic curves of the protection fuses of the charging system.
3.5. Levels of Risk for Workers
It is necessary to establish the risk levels to be applied to our simulated model. NFPA 70E [33] provides guidelines on electrical safety in the workplace [42] and establishes procedures and requirements to protect workers from electrical hazards, such as AF. One of the key concepts in this standard is incident heat energy levels. These levels determine the amount of energy that can reach a surface (cal/cm2), such as the skin of an electrical charger user or worker, in the event of an AF. Tables 130.7 (C)(15) (a), (b), and (c) of NFPA 70E [33] structure different hazard levels based on approximate values of voltage and short-circuit current. These tables also define the category of PPE to be worn by operators interacting with the energised system. This method is known in the literature as the ‘table method’.
For the analysed model, approximations that do not improve the result are not considered. In this case, the ‘incident energy analysis methods’ consider two distinct levels of risk in Table 6, which contains 130.5(G) of NFPA 70E requirements.
Table 6.
Risk levels and related PPE.
Exposure to an energy of 1.2 cal/cm2 is sufficient to cause a second-degree burn on unprotected skin. Therefore, from this level onwards, it is mandatory to wear appropriate clothing and PPE against the AF risk, as shown in Table 6.
3.6. IE Calculation Points in the Modelled System
Busbars are conductive elements that carry significant currents within an electrical system, such as a high-power EV charger. Determining the exact location of busbars allows accurate calculation of the IE that could be released in the event of an AF system failure. By identifying busbars where higher IE can be calculated, protective measures such as physical barriers, rapid shutdown systems, and other engineering controls can be implemented to minimise damage in the event of an AF. This not only protects exposed personnel but also equipment and components, reducing associated costs for repairs and replacements. Accurate identification of busbars and associated incident energy also allows for better targeting of maintenance routines. It is therefore important to select rigorously the busbars that may present a real hazard in the model in use.
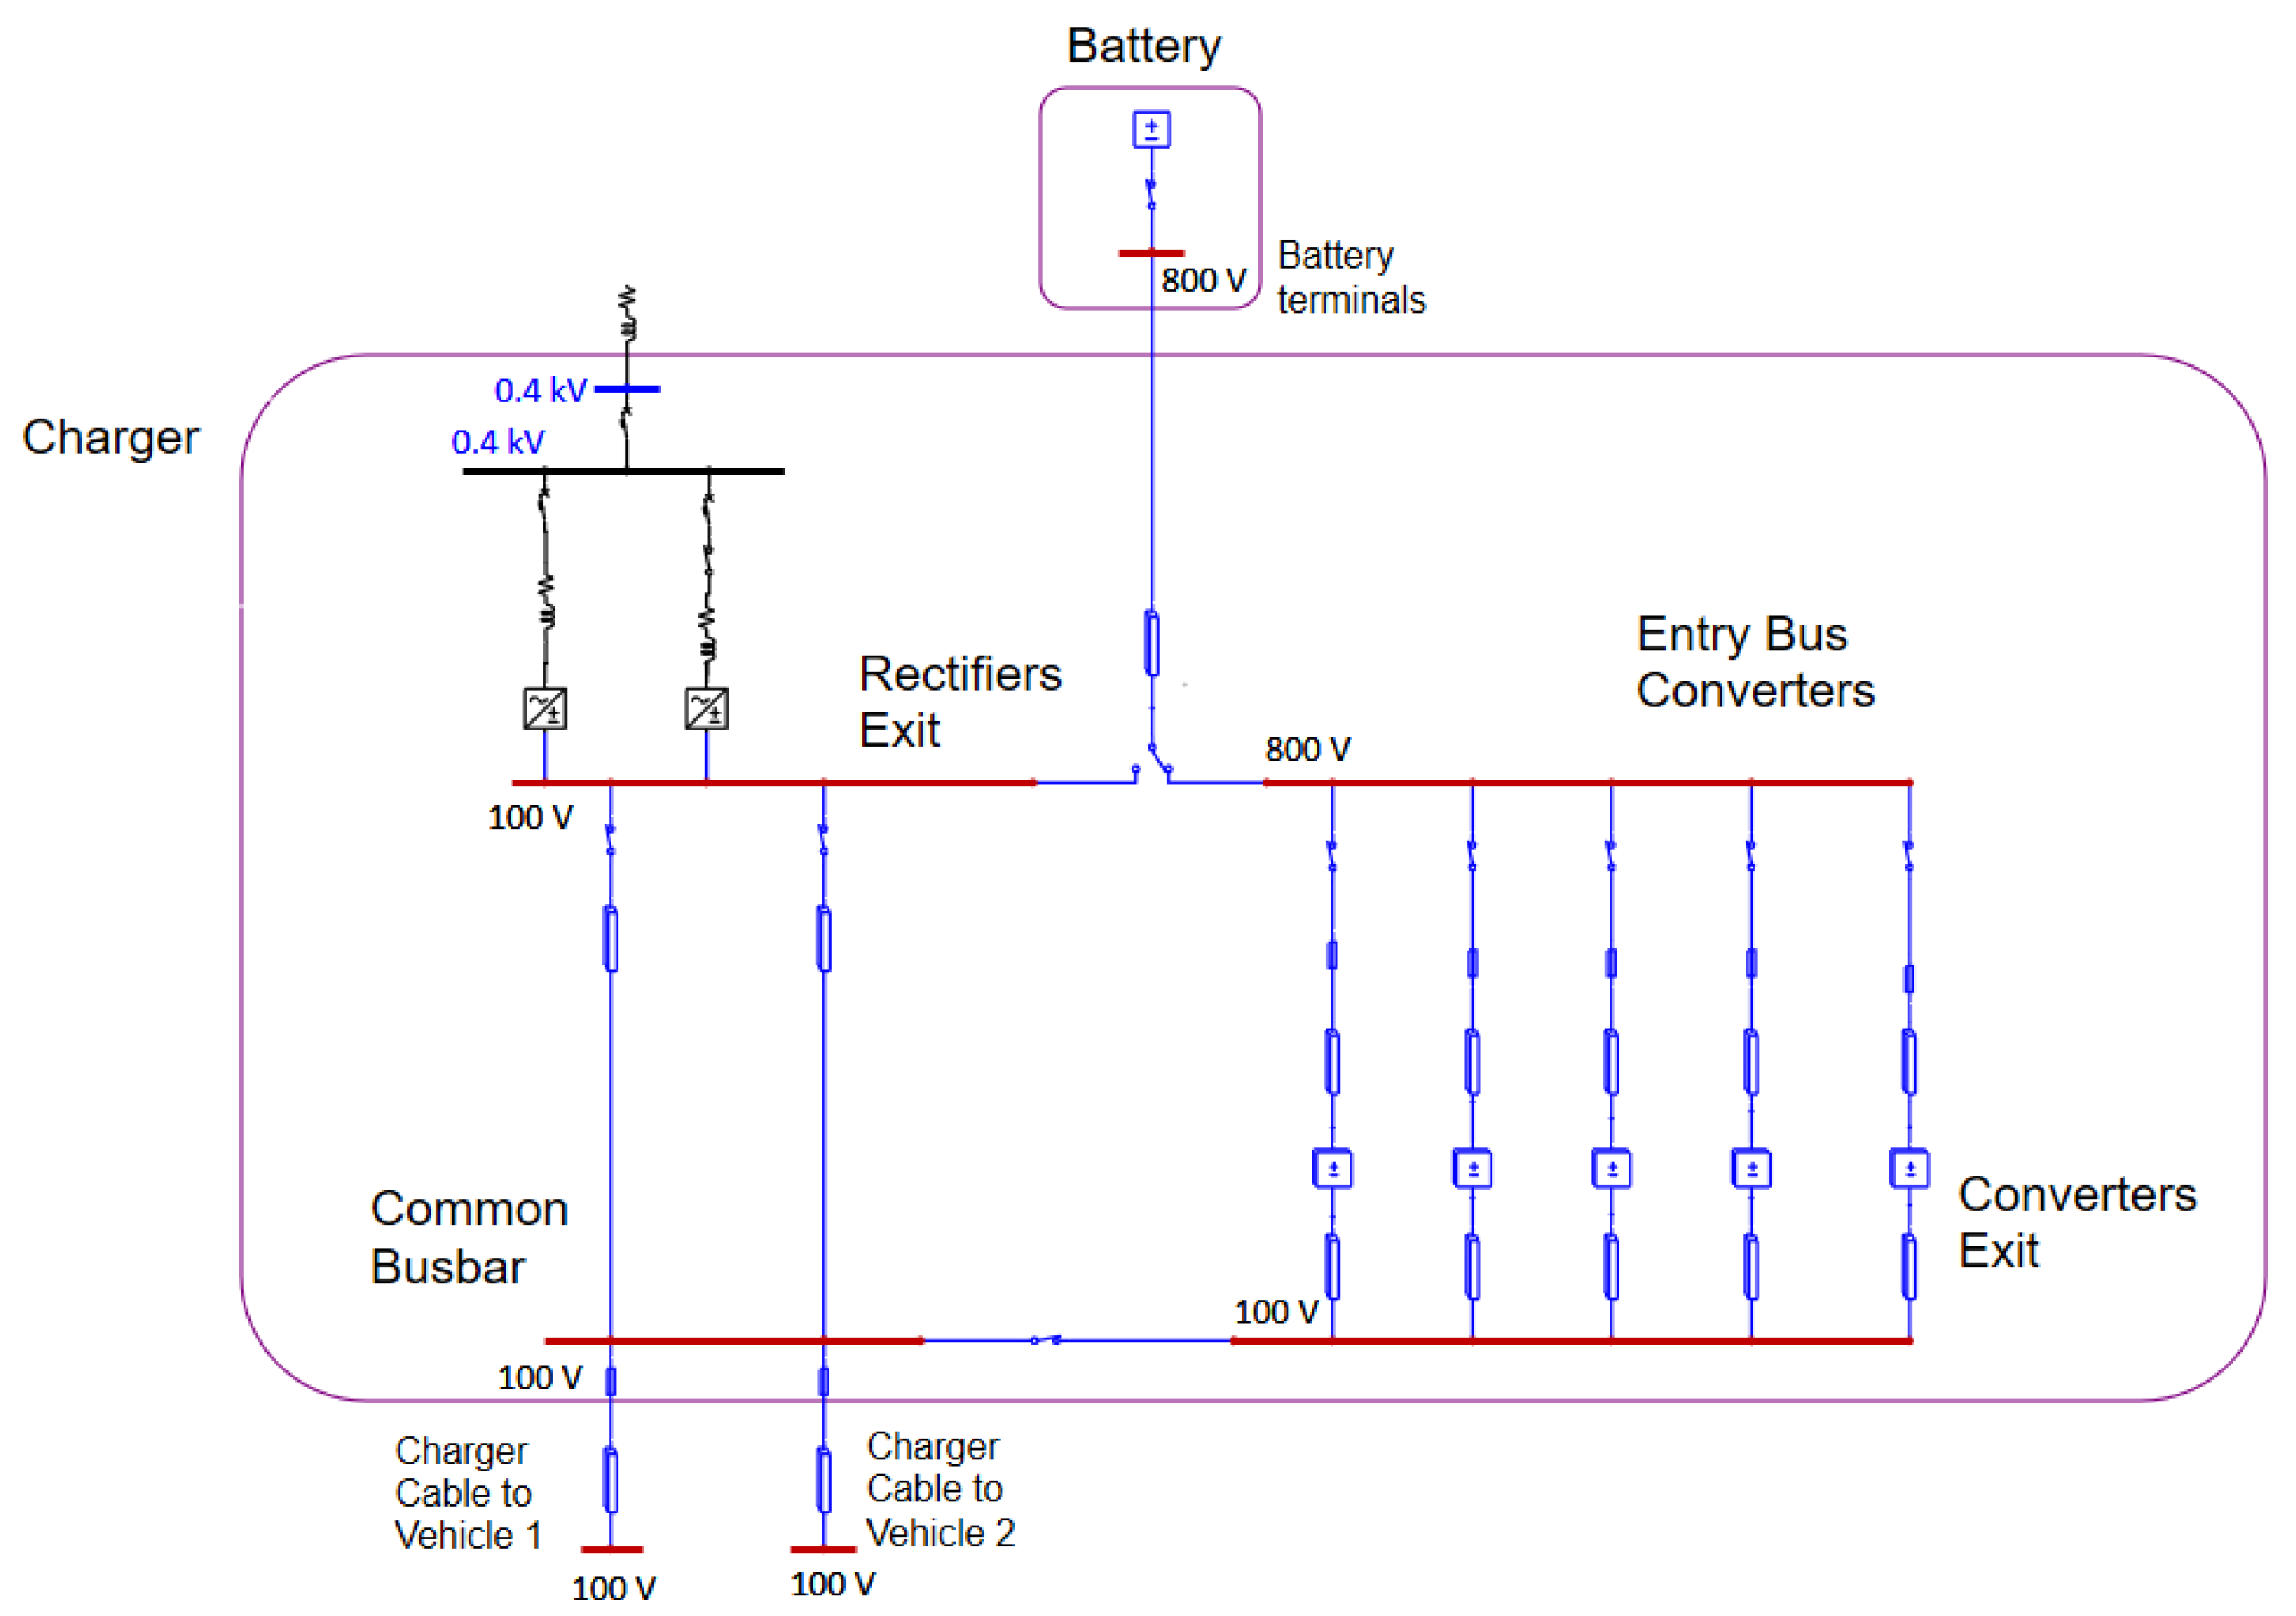
IE values have been calculated at seven specific points of the modelled system. Figure 10 shows the different busbars, which are described below:
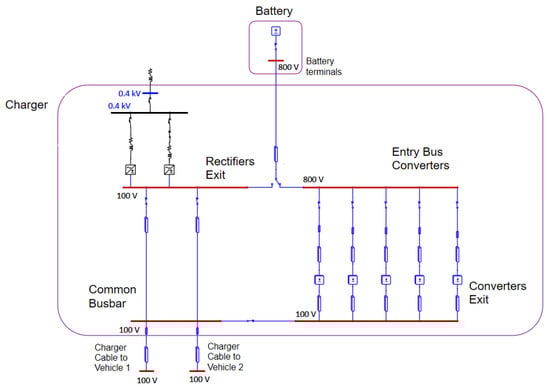
Figure 10.
Electrical busbars of the modelled system.
- Rectifiers exit: Busbar located at the exit of the two main AC/DC rectifiers that transform AC from the mains into DC for charging electric cars or for charging the battery attached to the charger.
- Battery terminals: The entry and exit points of the battery are attached to the charger.
- Entry bus converters: Common busbar supplying power to the 5 DC/DC converters, located at the battery exit.
- Converters exit: Converters exit the busbar.
- Common busbar: Common busbar, which can receive power from the rectifiers or the converters, depending on the grid connection capacity, the energy stored in the battery, and the instantaneous demand of the connected EVs.
- Charge cable to vehicle 1: Connection point of the cable feeding EV 1.
- Charge cable to vehicle 2: Connection point of the cable feeding EV 2.
4. Results and Discussion
4.1. Analysis of the AF on the AC Side
As already mentioned, the consequences in case of AF in high-power electrical charging systems are significant, both in AC and DC. A specific study of AF allows the design of charging systems that minimise the risks inherent in handling these high powers. This includes the selection of suitable materials, the correct sizing of conductors, the implementation of protective barriers, and the provision of equipment that allows safe and efficient operation.
In the model shown, as it is a high-power charger connected to the distribution grid, the device must also be studied in detail concerning the AF on the AC side. Table 7 shows the results obtained from the IE after the simulation and study of the real charger modelled on the different busbars on the AC side:
Table 7.
Calculation results of the IE in AC in the modelled system.
4.2. Analysis of the AF on the DC Side
The most innovative contribution of this article appears when we analyse its behaviour in different DC components. After studying the different analytical methods for calculating the IE in systems with DC energy storage, it is concluded that all of them can be applied to the model used, based on a charging station for EVs with lithium batteries. As this is a DC device, any of the three methods proposed in Section 2.2 of this article (Doan, Paukert, or Stokes and Oppenlander) could be applied for the following reasons.
- The system has electrodes in vertical and horizontal positions.
- The distances between the electrodes installed inside the equipment are small, about 1 cm.
- The operating currents of the system can exceed 100 A, especially in the steady state.
- The operating voltage of the system is always below 1 kV.
The IE has a quadratic dependence on the current (Iarc) and a direct dependence on time (tarc), as can be determined from the equations of the methods described in Section 2.2. While the first parameter (Iarc) is a characteristic of the system (charger), the tarc value is a characteristic parameter associated with the fuse that acts as protection for the system. These fuses are specific to the charging station model chosen for our simulation.
Once the proposed system has been simulated with the ETAP® simulation tool version 22.5.0, it has been observed that the protections (installed fuses described in point 3.4 of this document) do not clear the fault in times of less than 2 s. This is because the Iarc never reaches sufficiently high values to allow the fault to clear before this time, as seen in Figure 9.
The IEEE 1584 standard validates the assumption of a maximum arc duration time of 2 s, as this is the estimated time for a person to react to the fault and reach safety.
NFPA 70E also defines the DC exposure time limit as 2 s. This time limit is because in electrochemical storage systems, even if the guards were to intervene, they would continue to support arc energy up to a maximum time of 2 s, beyond which destruction would occur, and the arc would be extinguished.
Therefore, the 2 s exposure time represents the upper limit for DC arc flash analysis (tarc) and has been applied to the model.
Table 8.
IE calculation results by the Doan method.
Table 9.
IE calculation results by the Paukert method.
Table 10.
IE calculation results by the Stokes and Oppenlander method.
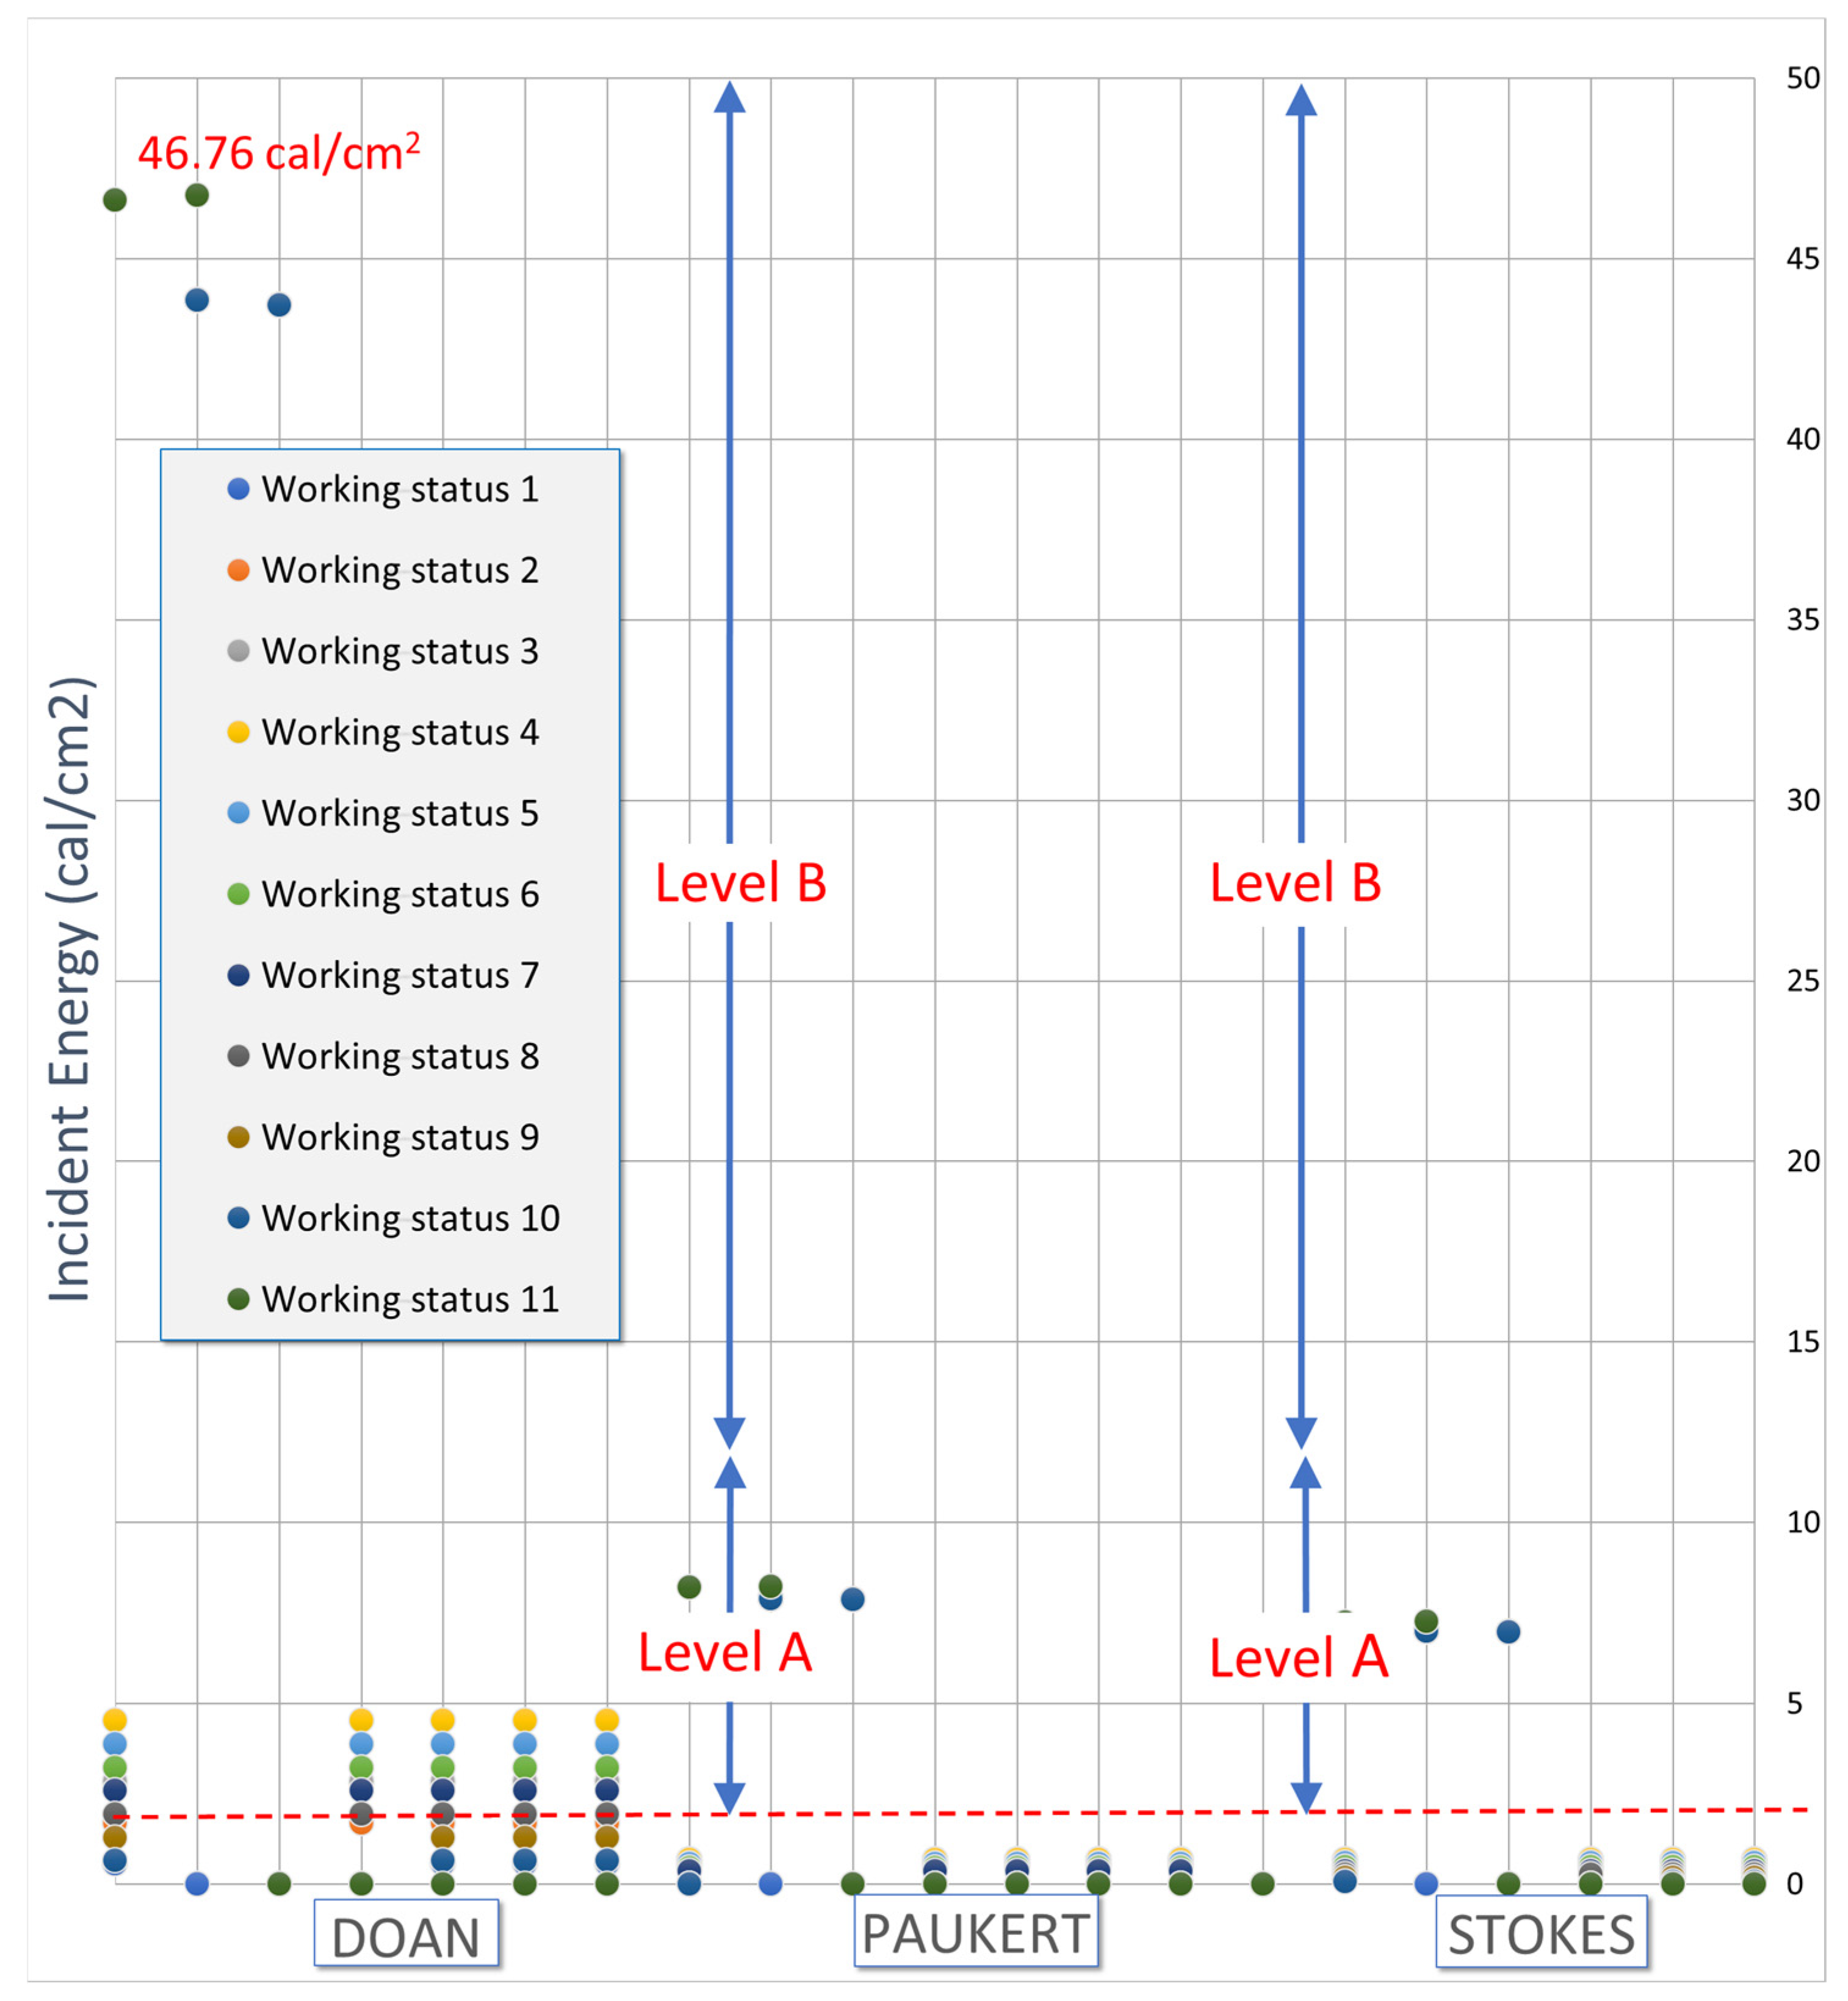
Figure 11 represents all the IE values obtained according to each of the analytical methods applied.

Figure 11.
Risk levels depending on the analytical method used.
4.3. Analysis of the Most Unfavourable AF
Once all the IE results of our model have been obtained and all the possible scenarios have been developed, we proceed to analyse the most unfavourable of all the possible cases. An AF at a point of maximum risk, in addition to users and workers, could seriously damage the components of the charging system, such as rectifiers, converters, transformers, or the EV itself. Knowing these critical points makes it possible to design and place protection devices that minimise damage.
Knowing the worst-case scenarios also helps to assess the overall reliability and safety of the charging system. This analysis is essential to ensure that the system operates safely under different charging or maintenance conditions. In addition, an AF at a critical point can lead to a significant disruption of the charging service, affecting both EV users and the supporting infrastructure. Thus, knowing the point of maximum risk in an EV charging system is vital to ensure personal safety, equipment integrity, regulatory compliance, and service continuity.
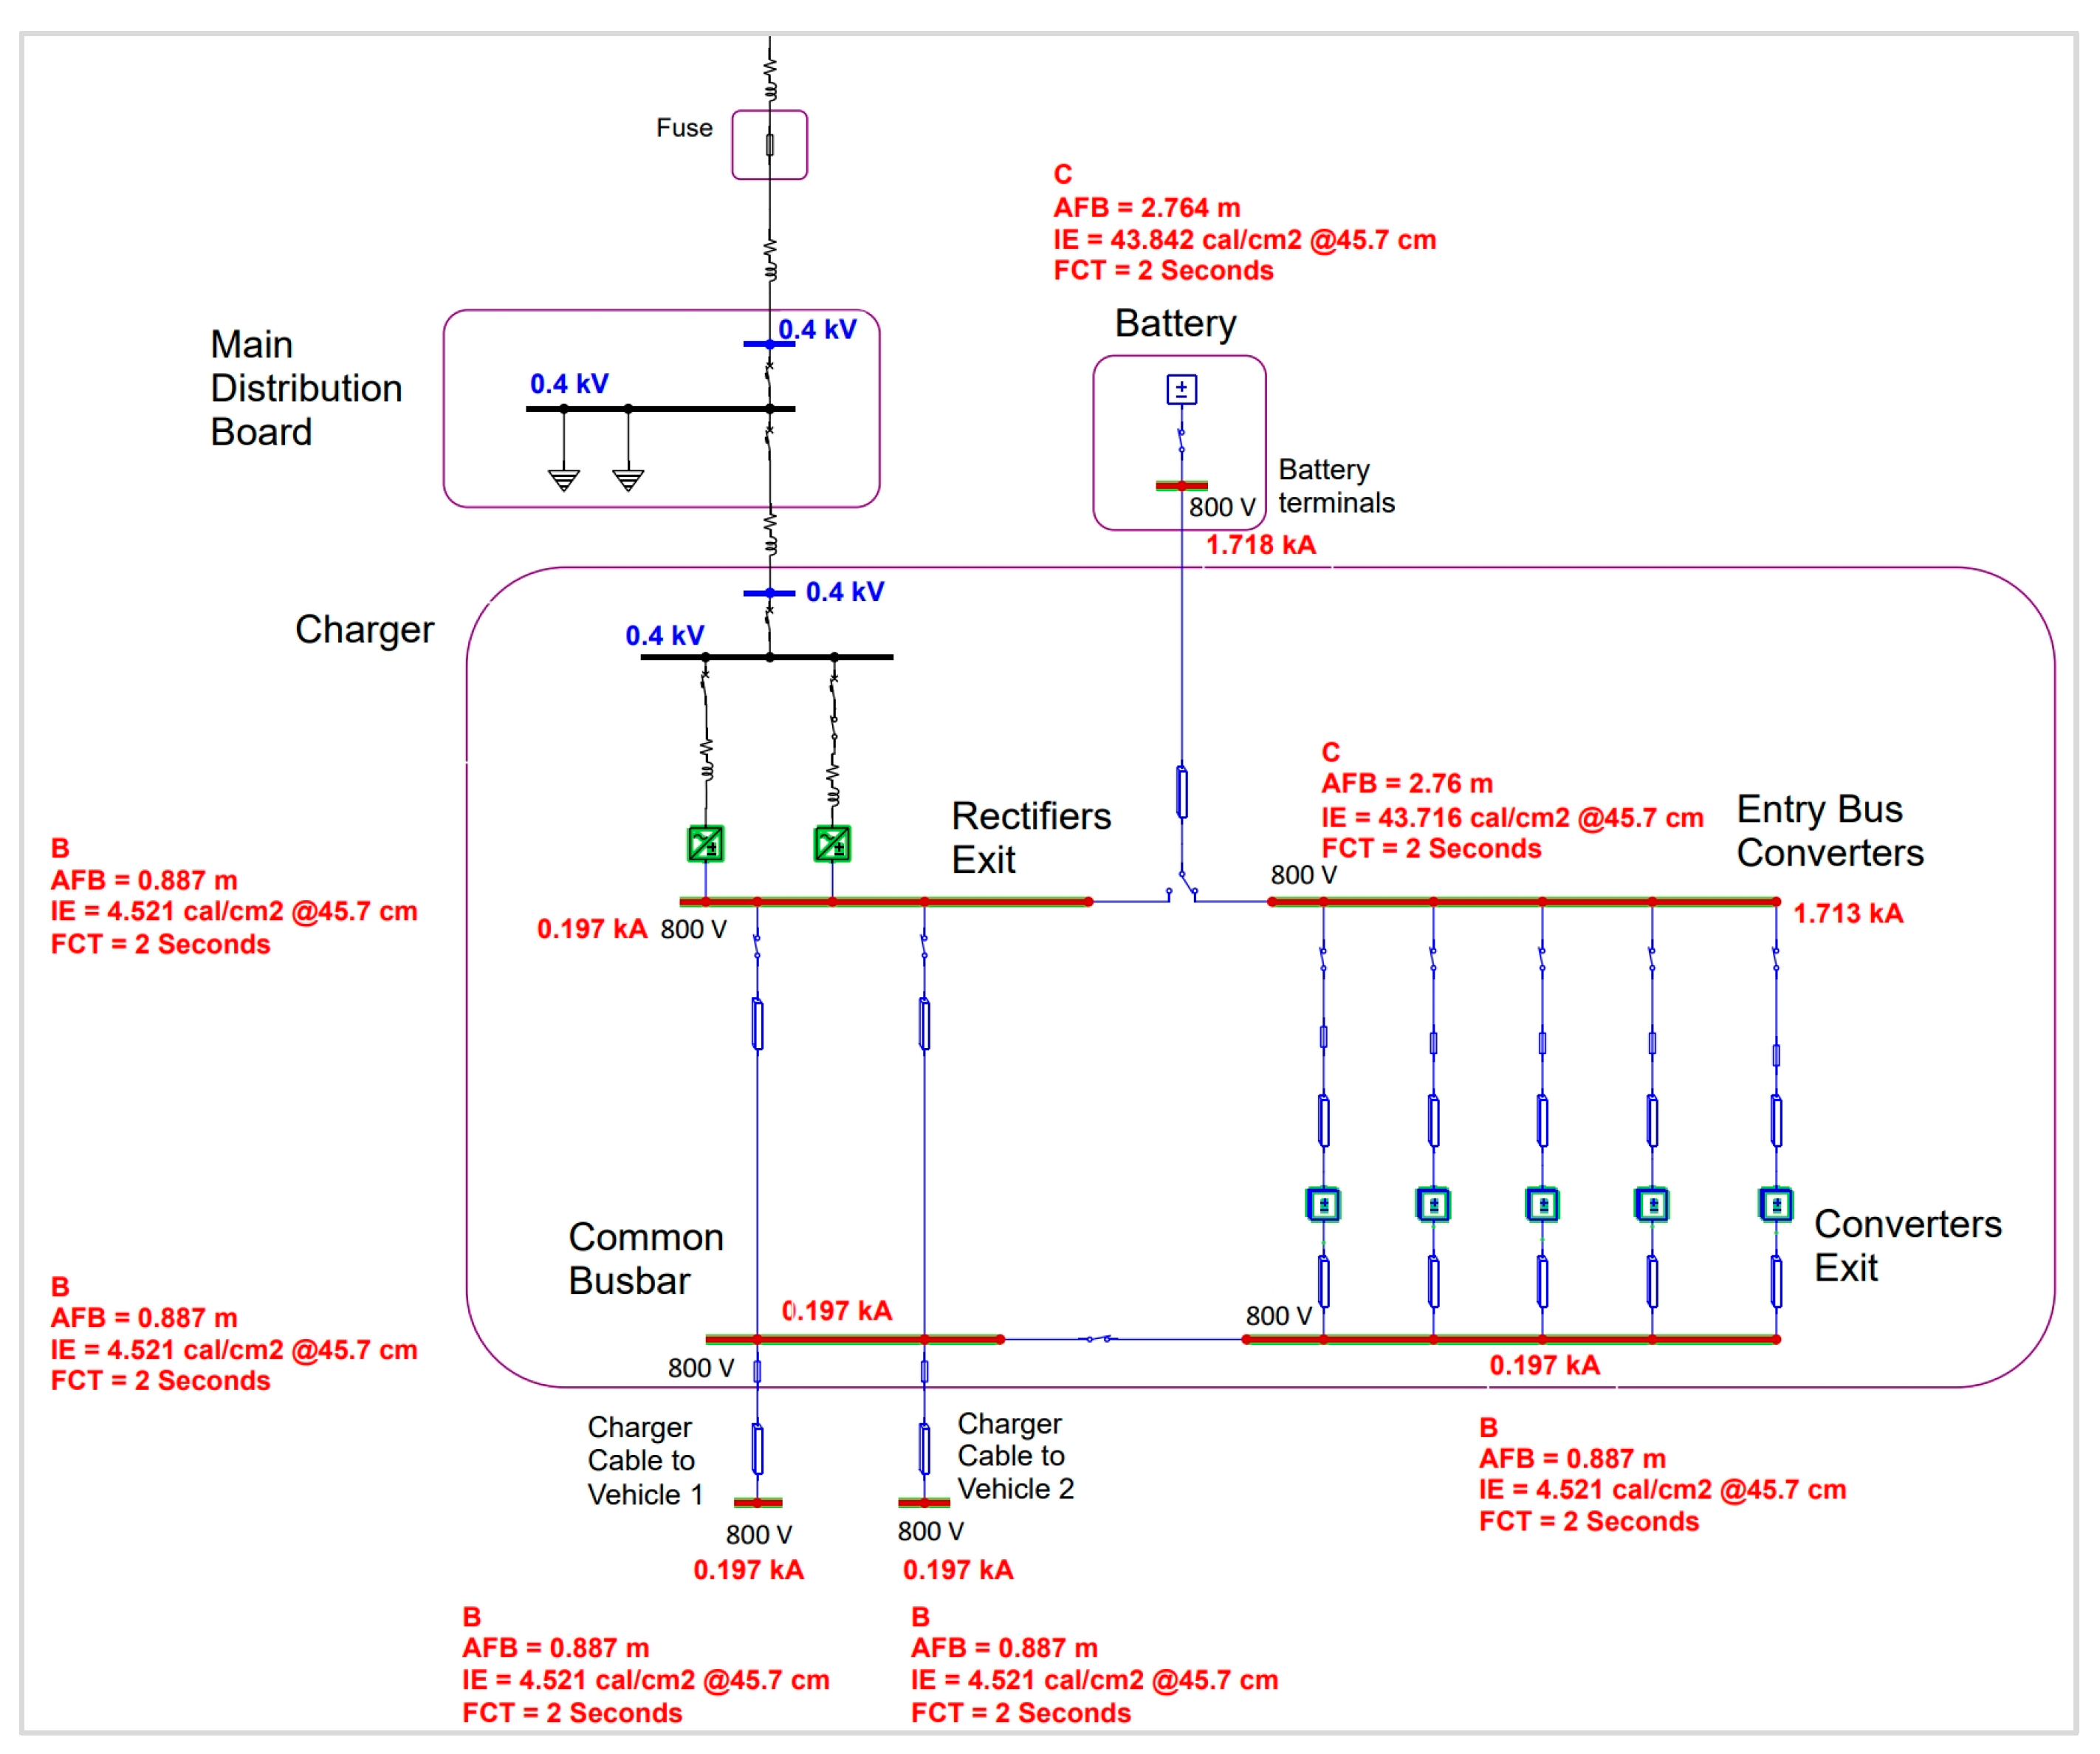
For this charging system, the stage identified as ‘working status 4’ is the instant of the charging process of maximum risk, since the two AC/DC rectifiers, as well as the five DC/DC converters, are working at maximum power. This circumstance gives rise to the most dangerous stage of all the analytical methods described. Figure 12 represents the maximum IE values that can occur in the system when the most restrictive analytical Doan calculation method is applied.
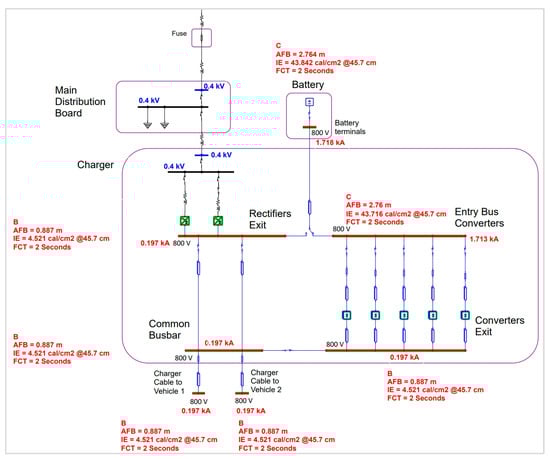
Figure 12.
IE on the system busbars, at the point of maximum power.
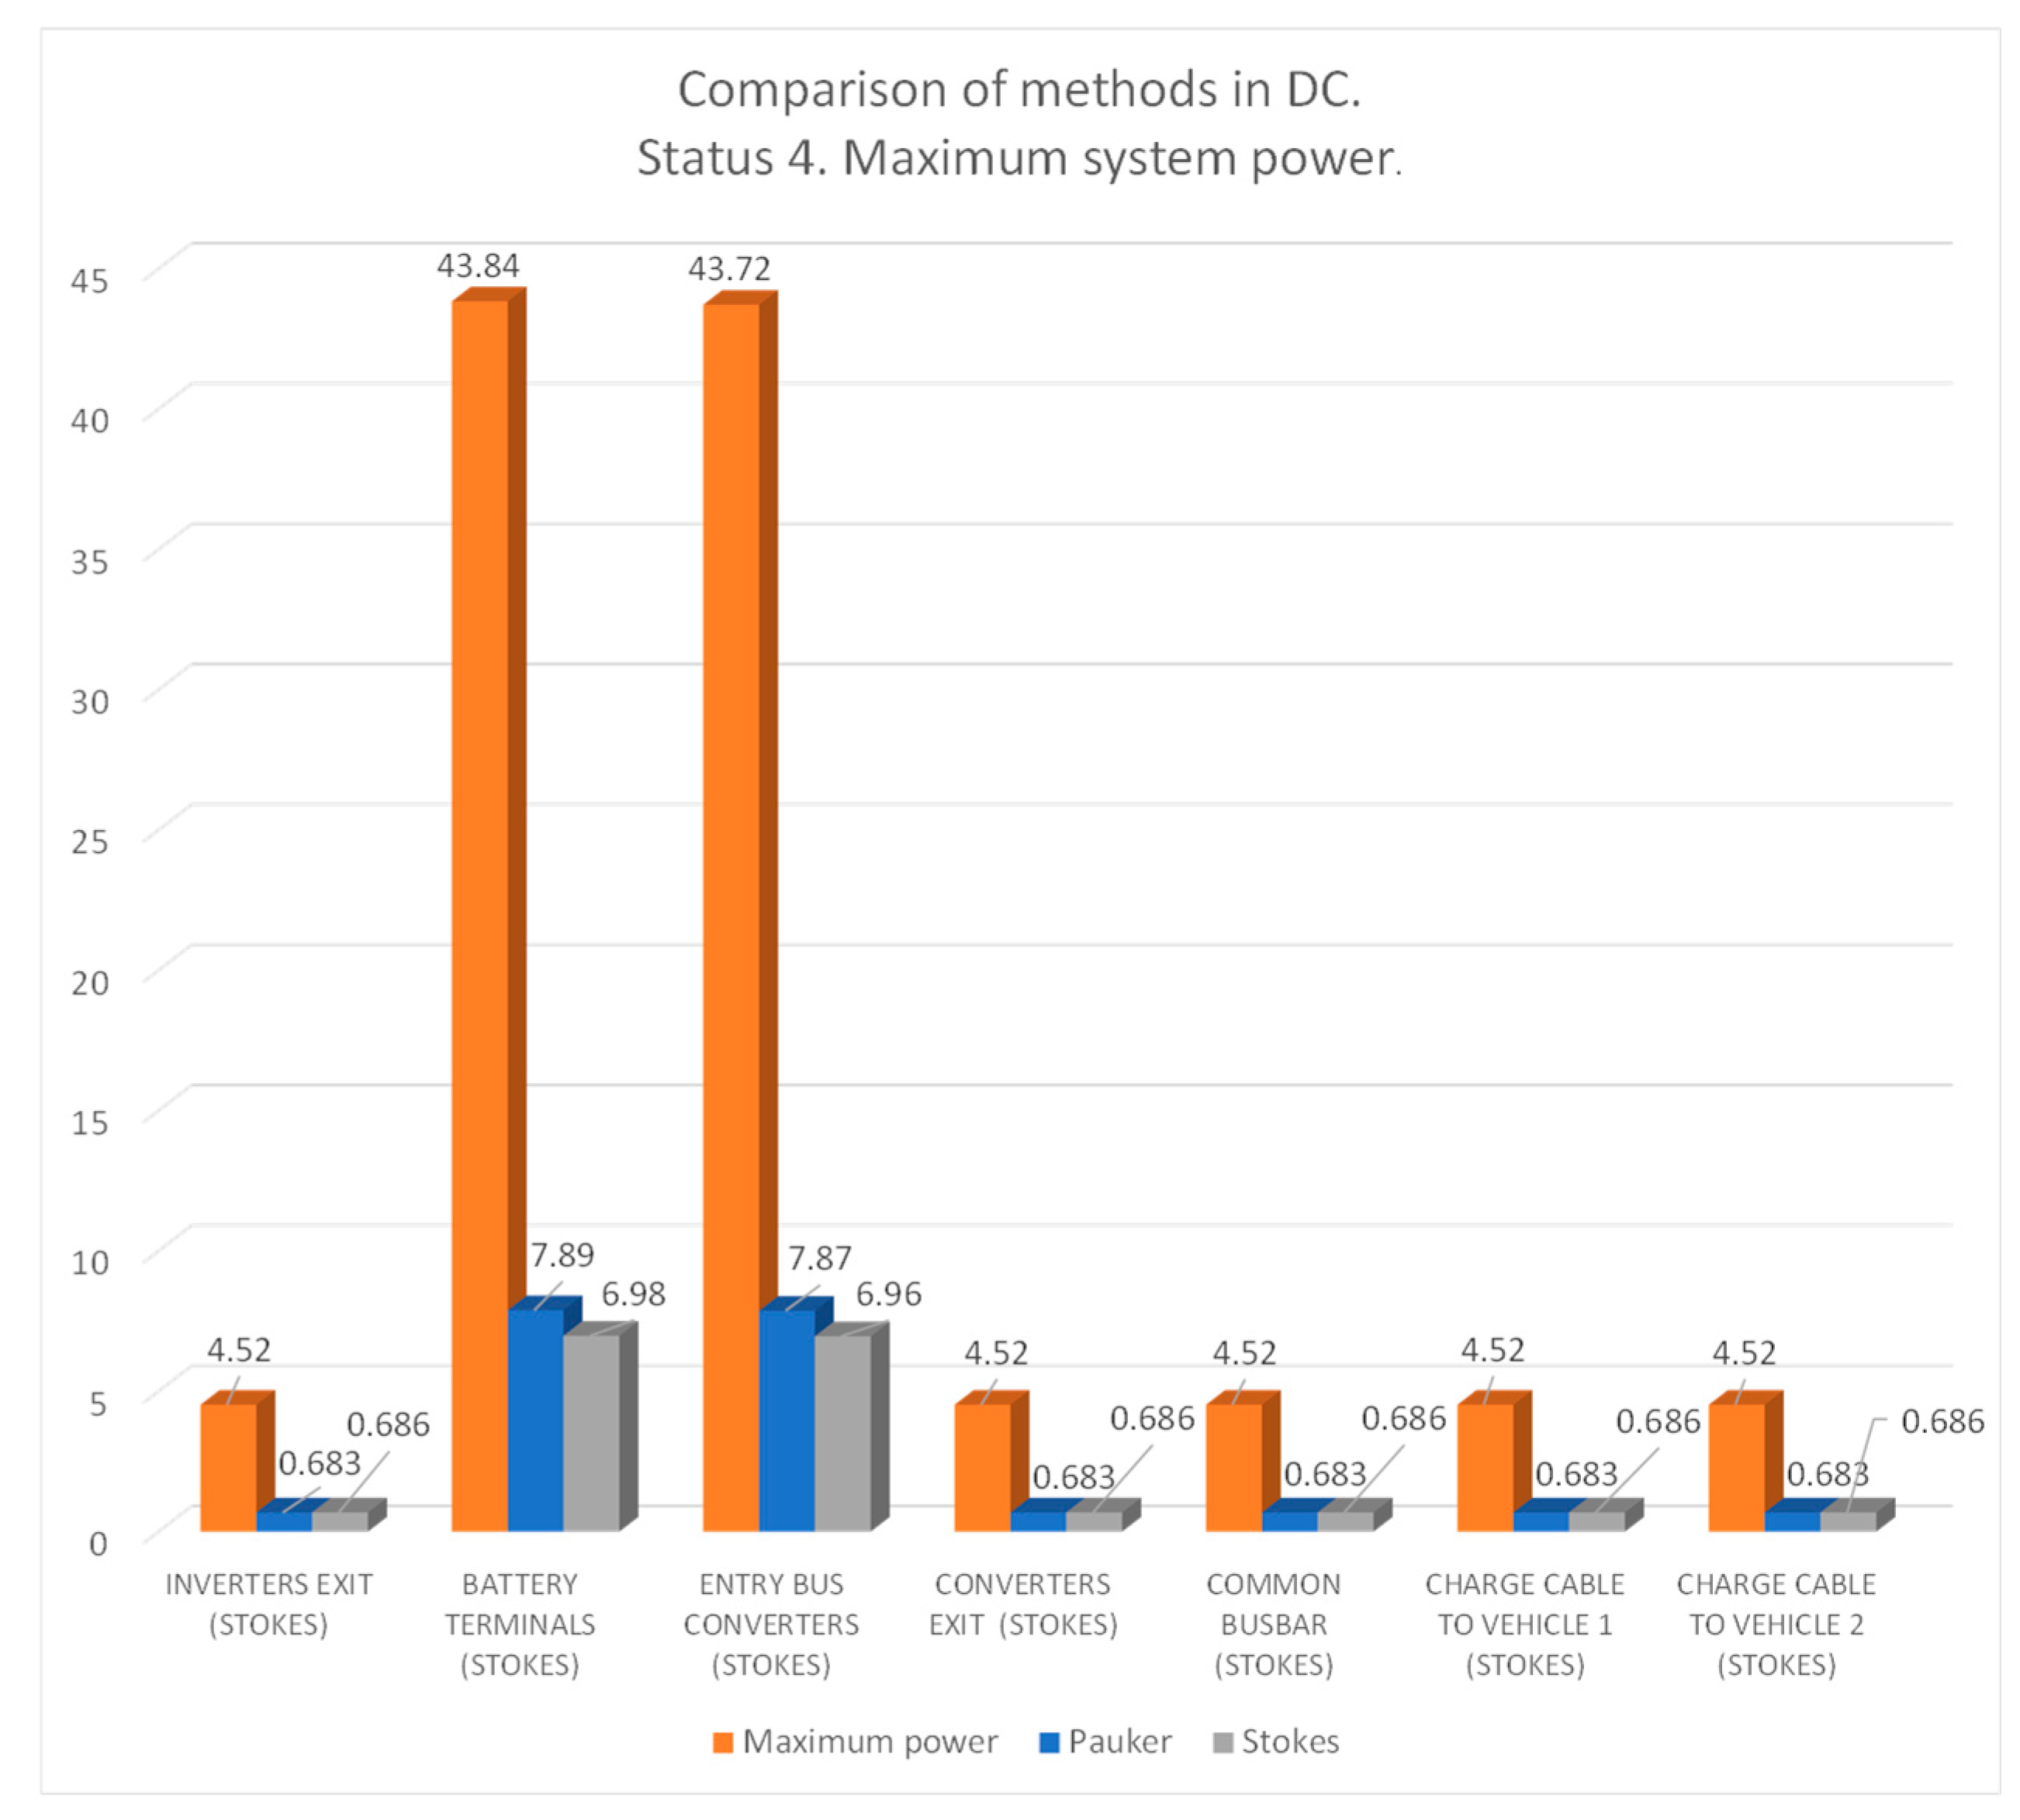
As already indicated, the results obtained depend mostly on the calculation method chosen, with the Doan method being particularly conservative. Figure 13 shows the quantitative difference between this method and the rest of the analytical methods for DC used at the point of maximum danger in the model.
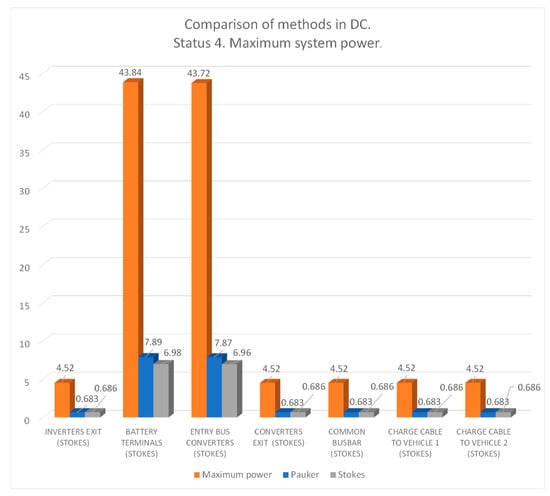
Figure 13.
IE (cal/cm2) for the different analytical methods of DC, working status 4.
As has been shown, charging systems for electric vehicles present dangers from the AF phenomenon. When these types of energised systems are used, and especially when they are handled during installation or maintenance, these devices are capable of causing severe damage to people, components, or nearby EVs.
Workers interacting with these charging systems must protect themselves against AF with the required PPE according to the calculated IE whenever they perform those tasks, operations, or manoeuvres with AF risk. These tasks include approaching energised parts of the batteries, opening doors, removing covers from energised electrical panels, accessing control circuits, or connecting/disconnecting circuits with voltages above 120 V.
Staff training is another priority element. Technical knowledge and experience of the system to be worked on is a key ingredient in assessing the competence of the person performing the work. Among other things, the scope of technical knowledge or experience may include an understanding of the hazards that may arise during the work and the precautions to be taken. The AF risk assessment provides good information on the severity of the consequences of an unplanned event. However, the goal should always be to avoid the hazard in the first place, for which the technology is available, based on sound research to determine protective measures for workers.
5. Conclusions
The performance of AF analysis on EV charging systems is crucial to ensure the safety of people, protect equipment and facilities, and ensure regulatory compliance, while optimising system performance. This novel analysis has provided information on the behaviour of state-of-the-art charging systems, and on the dangers that arise in these complex systems, where AC and DC power are near workers and users.
As this work has demonstrated, a detailed analysis of the AF in EV charging systems must be conducted due to safety and operational efficiency reasons. In EV charging stations, where high-voltage currents circulate, it is crucial to prevent arcing to avoid these dangers, and it is always necessary to quantify the IE to avoid harm to people.
Damage is not only costly to repair but can also disrupt the operation of charging stations and reduce the lifetime of the equipment. These types of AF studies help to identify vulnerabilities and design solutions to prevent failures. AF also represents a significant risk to the safety of people interacting with charging stations, such as drivers of electrified cars or maintenance personnel.
Thanks to the protections installed on the AC side and to the limitations presented by the distribution electrical network, the IE generated in the busbars of the main AC panels is really low. After analysing different busbars of the system, it can be observed that they do not exceed 1.2 cal/cm2 at any point. Therefore, there is no possibility of second-degree burns on personnel exposed to these busbars, since the maximum calculated value is 0.415 cal/cm2.
Considering the DC simulations, it can be stated that the DOAN or ‘maximum power’ method is especially restrictive, offering IE values that are not very feasible for this type of EV charging system with backup batteries. The application of the Paukert method is also not the most suitable for the modelled system for the reasons detailed below, although the combination of these methods plus the Stokes and Oppenlander method provides a solution to the problem posed. In future research, advanced numerical or empirical models could be applied to address the problems presented by the Doan and Paukert methods.
During the final charging process, constant voltage stages in Table 9, the supply currents to the electric vehicle are less than 100 A. This IE calculation method for DC has only been tested for currents higher than this value, so the Paukert method does not provide complete coverage to the modelled system.
During the ‘working status 11’ stage, when the battery is in the process of charging from the mains and there is no EV demanding energy, up to 46.76 cal/cm2. This value is particularly high and dangerous for the integrity of people. This value is even higher than the 40 cal/cm2 recommended in the NFPA 70E standard as the maximum value for working with energised equipment.
For this reason, it is always recommended to disconnect, isolate, separate, and discharge the affected battery before accessing it. During this stage, no EV is connected to the system, so it is considered a safe stage for users, but not for workers interacting with the energised charger. Users of charging systems do not encounter any risk associated with the AF if they do not carry out any of the manoeuvres listed in Table 3. This circumstance is unusual as it involves unqualified persons.
The values obtained using the Doan method are very restrictive and unrealistic. Values above 40 cal/cm2 are very high and would require the use of very heavy, expensive, and inefficient protective equipment (work clothing). The use of such heavy protective equipment could even create unsafe conditions for workers.
Beyond the distorted values provided by the Doan method, most of the IE values are below 12 cal/cm2, so the expected risk level in this type of system is risk level ‘A’ (maximum threshold) with its corresponding associated PPE, as shown in Table 6.
Therefore, in addition to protective equipment associated with electrical hazards (gloves, helmet, boots, etc.), in our case, specific protective equipment for AF must be used. Of particular importance is the use of arc-resistant clothing and equipment with an arc resistance value greater than the IE calculated in this article. Among this equipment, it is important to highlight the use of long-sleeved shirts and trousers or a full arc suit, together with a face shield, balaclava or hood, and arc-resistant leather gloves for industrial use.
Author Contributions
Conceptualization, J.R.C., D.B. and A.R.-P.; methodology, J.R.C., D.B. and A.R.-P.; software, J.R.C. and D.B.; validation, J.R.C., D.B. and A.R.-P.; formal analysis, J.R.C.; investigation, J.R.C.; resources, J.R.C.; data curation, J.R.C.; writing—original draft preparation, J.R.C.; writing—review and editing, J.R.C.; visualization, J.R.C.; supervision, D.B. and A.R.-P.; project administration, D.B. and A.R.-P. All authors have read and agreed to the published version of the manuscript.
Funding
This research received no external funding.
Data Availability Statement
The original contributions presented in the study are included in the article, further inquiries can be directed to the corresponding author.
Acknowledgments
This work has been developed within the framework of the ‘Doctorate Program in Advanced Computing, Energy and Plasmas’ of the University of Cordoba, being industrial research performed jointly within SGS Tecnos and the Industrial Research Group ‘Advanced Failure Prognosis for Engineering Applications’ from the UNED, framed under the spectrum of activities of the research-results transfer contract with reference 2022-CTINV-0084.
Conflicts of Interest
The authors declare no conflicts of interest.
Abbreviations
The following abbreviations are used in this manuscript:
| EVs | Electric vehicles |
| AF | Arc flash |
| IE | Incident energy |
| PPE | Personal protective equipment |
| PHEVs | Plug-in hybrid electric vehicles |
| V2G | Vehicle-to-grid |
| V2H | Vehicle-to-home |
| V2V | Vehicle-to-vehicle |
| AC | Alternating current |
| DC | Direct current |
| SF6 | Sulphur hexafluoride |
| IEEE | Institute of Electrical and Electronics Engineers |
| NFPA | National Fire Protection Association |
| EPRI | Electric Power Research Institute |
| AFB | Arc flash boundary |
| WA | Work accident |
| CPOs | Charge pint operators |
| BMS | Battery management system |
References
- Clairotte, M.; Suarez-Bertoa, R.; Zardini, A.A.; Giechaskiel, B.; Pavlovic, J.; Valverde, V.; Ciuffo, B.; Astorga, C. Exhaust emission factors of greenhouse gases (GHGs) from European road vehicles. Environ. Sci. Eur. 2020, 32, 125. [Google Scholar] [CrossRef]
- Ahmed, M.U.; Raximov, U.; Sayidvalieva, M.; Pradeep, A. Comparative Analysis of the Advancement of Hydrogen Vehicles and Electric Vehicles: A Critical Review. In Proceedings of the 2023 International Conference on Computational Intelligence and Knowledge Economy (ICCIKE), Dubai, United Arab Emirates, 9–10 March 2023; pp. 151–155. [Google Scholar] [CrossRef]
- Alhindawi, R.; Abu Nahleh, Y.; Kumar, A.; Shiwakoti, N. Projection of Greenhouse Gas Emissions for the Road Transport Sector Based on Multivariate Regression and the Double Exponential Smoothing Model. Sustainability 2020, 12, 9152. [Google Scholar] [CrossRef]
- Zhao, S.; Guo, M. Electric Vehicle Power System in Intelligent Manufacturing Based on Soft Computing Optimization. Heliyon 2024, 10, e38946. [Google Scholar] [CrossRef] [PubMed]
- Wang, Y. Intelligent Energy Management and Operation Efficiency of Electric Vehicles Based on Artificial Intelligence Algorithms and Thermal Energy Optimization. Therm. Sci. Eng. Prog. 2024, 55, 102900. [Google Scholar] [CrossRef]
- Chretien, B.; Nouvelière, L.; Ait Oufroukh, N.; Glaser, S.; Mammar, S.; Zhou, M.; Korte, M. A Vehicle Simulator for an Efficient Electronic and Electrical Architecture Design. IEEE Trans. Intell. Transp. Syst. 2013, 14, 1967–1982. [Google Scholar] [CrossRef]
- Wilcke, W.W.; Kim, H.-C. The 800-km Battery Lithium-Ion Batteries Are Played Out. Next up: Lithium-Air. IEEE Spectr. 2016, 53, 42–62. [Google Scholar] [CrossRef]
- Di Fonso, R.; Cecati, C. Test Cycle Simulation of an Electric Car with Regenerative Braking. In Proceedings of the 2020 AEIT International Conference of Electrical and Electronic Technologies for Automotive (AEIT AUTOMOTIVE), Turin, Italy, 18–20 November 2020; pp. 1–5. [Google Scholar]
- Wang, N.; Tian, H.; Guo, J.; Wu, H.; Lyu, J. Efficiency-Oriented Vehicle Relocation of Shared Autonomous Electric Fleet in Station-Based Car-Sharing System. J. Traffic Transp. Eng. 2024, 11, 681–699. [Google Scholar] [CrossRef]
- Rioux-Paradis, K.; Gaudreault, J.; Redmond, C.; Otomo-Lauzon, K.; Bernard, F.; Deschenes, A.; Quimper, C.G.; Boivin, S.; Blouin, P. Learning from Historical Data to Predict Electric Vehicle Taxi Consumption and Charging Time. In Proceedings of the 2018 Winter Simulation Conference (WSC), Gothenburg, Sweden, 9–12 December 2018; pp. 1216–1227. [Google Scholar]
- Biondi, E.; Boldrini, C.; Bruno, R. Optimal Charging of Electric Vehicle Fleets for a Car Sharing System with Power Sharing. In Proceedings of the 2016 IEEE International Energy Conference (ENERGYCON), Leuven, Belgium, 4–8 April 2016; pp. 1–6. [Google Scholar]
- Assolami, Y.O.; Gaouda, A.; El-Shatshat, R. A New Framework for Plug-In Electric Vehicle Charging Models Supported by Solar Photovoltaic Energy Resources. IEEE Can. J. Electr. Comput. Eng. 2021, 44, 118–129. [Google Scholar] [CrossRef]
- Duroha, J.C.; Macht, G.A. Solar Installation Occupational Risks: A Systematic Review. Saf. Sci. 2023, 160, 106048. [Google Scholar] [CrossRef]
- Benedetti, D.; Agnelli, J.; Gagliardi, A.; Dini, P.; Saponara, S. Design of an Off-Grid Photovoltaic Carport for a Full Electric Vehicle Recharging. In Proceedings of the 2020 IEEE International Conference on Environment and Electrical Engineering (EEEIC) and Industrial and Commercial Power Systems Europe, Madrid, Spain, 9–12 June 2020; pp. 1–6. [Google Scholar]
- Ho, C.; Lee, H.W.; Gambatese, J.A. Application of Prevention through Design (PtD) to Improve the Safety of Solar Installations on Small Buildings. Saf. Sci. 2020, 125, 104633. [Google Scholar] [CrossRef]
- Athulya, M.S.; Visakh, A.; Selvan, M.P. Electric Vehicle Recharge Scheduling in a Shopping Mall Charging Station. In Proceedings of the 2020 21st National Power Systems Conference (NPSC), Gandhinagar, India, 17–19 December 2020; pp. 1–6. [Google Scholar]
- Kesler, M.; Weinhold, M.; Bohlen, O. Smart Grid Ready Charging Infrastructure for Electric Vehicles—Challenges and Solutions. In Proceedings of the 2020 IEEE International Conference on Industrial Technology (ICIT), Buenos Aires, Argentina, 26–28 February 2020; pp. 1400–1405. [Google Scholar]
- Shahnia, F.; Mojtahedzadeh, M.; Zare, A. Optimal Coordination of Overcurrent Relays in EV Charging Stations Considering Different Penetration Levels. In Proceedings of the 2021 IEEE PES Innovative Smart Grid Technologies Europe (ISGT Europe), Espoo, Finland, 18–21 October 2021; pp. 1–5. [Google Scholar]
- Simonov, M.; Attanasio, A. Cooperative Recharge Method of Connected Electric Vehicles in Smart Grid. In Proceedings of the 2012 International Conference on Connected Vehicles and Expo (ICCVE), Beijing, China, 12–16 December 2012; pp. 329–334. [Google Scholar]
- Skiba, L.; Moser, A. Modeling Large Electric Vehicle Fleets in Power System Simulations. In Proceedings of the 2018 15th International Conference on the European Energy Market (EEM), Lodz, Poland, 27–29 June 2018; pp. 1–5. [Google Scholar]
- Chen, X.; Deng, Y.; Sun, L.; Yuan, Y.; Wang, X. A Novel Time Series Hybrid Model for Online Prediction of Electric Vehicles Battery Pack Capacity with Real Charging Data. J. Power Sources 2024, 597, 234161. [Google Scholar] [CrossRef]
- International Electrotechnical Commission. IEC 61851-1: Electric Vehicle Conductive Charging System—Part 1: General Requirements; IEC: Geneva, Switzerland, 2017. [Google Scholar]
- Prist, M.; Pallotta, E.; Cicconi, P.; Venturini, P.; Monteriu, A.; Germani, M.; Longhi, S. Energy Saving in Industrial Wireless Power Recharge System: Simulation of a PI-Sliding Mode Control for a Non-Inverting Buck-Boost Converter. In Proceedings of the 2018 IEEE PELS Workshop on Emerging Technologies: Wireless Power Transfer (WoW), Montreal, QC, Canada, 3–7 June 2018; pp. 1–6. [Google Scholar]
- Mariscotti, A. Characterization of Active Power Flow at Harmonics for AC and DC Railway Vehicles. In Proceedings of the 2019 IEEE Vehicle Power and Propulsion Conference (VPPC), Hanoi, Vietnam, 14–17 October 2019; pp. 1–7. [Google Scholar]
- Cabello, J.R.; Bullejos, D.; Rodríguez-Prieto, Á. Analysis of Incident Energy and Arc Flash Boundary Behavior in Electric Power Distribution Systems. IEEE Access 2023, 11, 54165–54174. [Google Scholar] [CrossRef]
- Eastwood, K.; Hancharyk, B.; Pace, D. The Value of Electrical Incident Case Histories. In Proceedings of the IEEE Industry Applications Society 50th Annual Petroleum and Chemical Industry Conference, Houston, TX, USA, 15–17 September 2003; pp. 321–327. [Google Scholar]
- Cawley, J.C. Electrical Accidents in the Mining Industry, 1990–1999. IEEE Trans. Ind. Appl. 2003, 39, 1570–1577. [Google Scholar] [CrossRef]
- Al-Bayati, A.J.; Bilal, G.A.; Esmaeili, B.; Karakhan, A.; York, D. Evaluating OSHA’s Fatality and Catastrophe Investigation Summaries: Arc Flash Focus. Saf. Sci. 2021, 140, 105287. [Google Scholar] [CrossRef]
- Kanokbannakorn, W.; Hongesombut, K.; Teerakawanich, N.; Srisonphan, S. Arc Flash Hazard in Distribution System with Distributed Generation. Procedia Comput. Sci. 2016, 86, 377–380. [Google Scholar] [CrossRef]
- Graham, A.M.; Hodder, M.; Gates, G. Current Methods for Conducting an Arc-Flash Hazard Analysis. IEEE Trans. Ind. Appl. 2008, 44, 1902–1909. [Google Scholar] [CrossRef]
- Keller, K. Understanding Arc Flash and Arc Blast Hazards. In Electrical Safety Code Manual; Butterworth-Heinemann: Oxford, UK, 2010; pp. 143–170. [Google Scholar]
- Bulut, M.S.; Ordu, M.; Der, O.; Basar, G. Sustainable Thermoplastic Material Selection for Hybrid Vehicle Battery Packs in the Automotive Industry: A Comparative Multi-Criteria Decision-Making Approach. Polymers 2024, 16, 2768. [Google Scholar] [CrossRef] [PubMed]
- NFPA. NFPA 70E: Standard for Electrical Safety in the Workplace; National Fire Protection Association: Quincy, MA, USA, 2018. [Google Scholar]
- IEEE. IEEE Std 1584-2018: IEEE Guide for Performing Arc-Flash Hazard Calculations; IEEE: New York, NY, USA, 2018. [Google Scholar]
- Andrea, J.; Schweitzer, P.; Martel, J.-M. Arc Fault Model of Conductance. Application to the UL1699 Tests Modeling. In Proceedings of the 2011 IEEE 57th Holm Conference on Electrical Contacts (Holm), Minneapolis, MN, USA, 11–14 September 2011; pp. 1–6. [Google Scholar]
- Frain, M. European Arc Flash Guide; Balboa Press: Bloomington, IN, USA, 2022. [Google Scholar]
- Marroquin, A.; McKinch, T. Methods for Evaluating DC Arc-Flash Incident Energy in Battery Energy Storage Systems. In Proceedings of the 2023 IEEE IAS Electrical Safety Workshop (ESW), Reno, NV, USA, 13–17 March 2023; pp. 19–29. [Google Scholar]
- Doan, D. Arc Flash Calculations for Exposures to DC Systems. IEEE Trans. Ind. Appl. 2010, 46, 2299–2302. [Google Scholar] [CrossRef]
- Stokes, A.; Oppenlander, W. Electric Arcs in Open Air. J. Phys. D Appl. Phys. 1991, 24, 26–35. [Google Scholar] [CrossRef]
- Paukert, J. The Arc Voltage and Arc Resistance of LV Fault Arcs. In Proceedings of the 7th International Symposium on Switching Arc Phenomena, Łódź, Poland, 27 September–11 October 1993; pp. 49–51. [Google Scholar]
- Hussain, M.Z.; Brown, W.; Alsafasfeh, Q. DC Arc Flash Above 1000 V Based on Statistical Regression Analysis. In Proceedings of the 2023 IEEE Industry Applications Society Annual Meeting (IAS), Nashville, TN, USA, 29 October–2 November 2023; pp. 1–6. [Google Scholar]
- Rivera, S.; Goetz, S.M.; Kouro, S.; Lehn, P.W.; Pathmanathan, M.; Bauer, P.; Mastromauro, R.A. Charging Infrastructure and Grid Integration for Electromobility. Proc. IEEE 2022, 111, 371–396. [Google Scholar] [CrossRef]

Disclaimer/Publisher’s Note: The statements, opinions and data contained in all publications are solely those of the individual author(s) and contributor(s) and not of MDPI and/or the editor(s). MDPI and/or the editor(s) disclaim responsibility for any injury to people or property resulting from any ideas, methods, instructions or products referred to in the content. |
© 2025 by the authors. Published by MDPI on behalf of the World Electric Vehicle Association. Licensee MDPI, Basel, Switzerland. This article is an open access article distributed under the terms and conditions of the Creative Commons Attribution (CC BY) license (https://creativecommons.org/licenses/by/4.0/).