Abstract
With the large-scale integration of high-penetration distributed photovoltaic (DPV) into distribution networks, its output volatility and reverse power flow characteristics are prone to causing voltage violations, necessitating the accurate identification of weak nodes to enhance operational reliability. This paper investigates the definition, quantification criteria, and multi-indicator comprehensive determination methods for weak nodes in distribution networks. A multi-criteria assessment method integrating voltage deviation rate, sensitivity analysis, and power margin has been proposed. This method quantifies the node disturbance resistance and comprehensively evaluates the vulnerability of voltage stability. Simulation validation based on the IEEE 33-node system demonstrates that the proposed method can effectively identify the distribution patterns of weak nodes under different penetration levels (20~80%) and varying numbers of DPV access points (single-point to multi-point distributed access scenarios). The study reveals the impact of increased penetration and dispersed access locations on the migration characteristics of weak nodes. The research findings provide a theoretical basis for the planning of distribution networks with high-penetration DPV, offering valuable insights for optimizing the siting of volatile loads such as electric vehicle (EV) charging stations while considering both grid safety and the demand for distributed energy accommodation.
1. Introduction
The widespread application of distributed photovoltaics (DPV) not only helps reduce greenhouse gas emissions but also effectively alleviates pressure on electricity supply [1,2]. According to data from the International Renewable Energy Agency (IRENA), the installed capacity of DPV has grown at an average annual rate of over 20% in the past decade [3].
Regional distribution networks face a series of challenges and opportunities when integrating DPV [4]. Traditional distribution networks typically involve unidirectional power supply, whereas DPV integration introduces bidirectional current flow. This can lead to issues such as voltage fluctuations and power imbalances. When PV generation is excessively high, local voltages might exceed safe limits, impacting the stability of the distribution network [5]. Effectively managing these voltage and power fluctuations has become one of the urgent challenges for regional distribution networks.
In recent years, domestic policies and practices regarding DPV integration have garnered significant attention, leading to a growing body of related research [6]. Within the context of DPV integration, the development of distribution network parameter identification technology is particularly crucial, directly impacting the stability and safety of the power system. To this end, reference [7] proposes a distribution network planning model based on an elite ant colony algorithm, emphasizing that optimizing parameter identification in the presence of large-scale DPV integration is not only key to improving system operational efficiency but also a necessary means to ensure system reliability. As DPV and electric vehicles (EVs) become more prevalent, power systems face new challenges, and improvements in parameter identification technology will help address these challenges [8], ensuring the reliability and economic efficiency of power supply.
Reference [9] delves into the expansion planning of power distribution networks, pointing out that in safety indicator evaluation, equipment reliability and overall system stability are crucial factors that cannot be overlooked, providing important reference for subsequent safety assessment methods. Building upon this, reference [10] proposes a data-driven algorithm for online identification of grid topology changes. This method offers a new approach for real-time monitoring and evaluation of safety indicators, enabling timely detection of potential safety hazards and ensuring stable grid operation. Reference [11], in discussing the optimal operation of distribution networks considering energy storage devices, emphasizes the importance of safety indicators in optimal operation, especially their effectiveness in responding to emergencies. These studies lay a solid theoretical foundation for safety indicator evaluation methods after DPV integration, promoting further development in related fields.
Regarding distribution network topology and parameter identification methods based on measurement data, reference [12] investigates a big-data-based feeder area grid topology identification method, emphasizing the importance of accurately identifying grid topology for safety assessment, considering topology identification as the basis for safety indicator evaluation. Reference [13] proposes a corresponding safety indicator system, analyzing the impact of voltage fluctuations and power fluctuations on distribution network safety to facilitate the assessment of the distribution network after PV integration. Furthermore, reference [14] proposes a cooperative game-based zoning and reactive power/voltage control method, offering a new approach to solve voltage violation and fluctuation issues in distribution networks.
At the same time, with the advent of the historical opportunity period for the explosive growth of electric vehicles (EVs), their widespread integration poses multifaceted challenges to low-voltage distribution networks. These challenges include significant increases in grid load, the need for distribution network upgrades and transformations, and the rationality of charging facility layout planning [15]. However, electric vehicles with substantial charging demands can further absorb the electricity generated by distributed photovoltaic systems, thereby promoting energy balance in the grid [16]. Utilizing EV charging station planning and scheduling methods to mitigate the impact of distributed PV generation on distribution networks is a potentially effective approach [17]. Therefore, researching methods for identifying weak nodes in the grid after the integration of distributed PV and proposing connection points for the construction of EV charging stations are issues that urgently require in-depth investigation.
Based on the above issues, this paper focuses on the criteria and identification methods for weak nodes in distribution networks. Starting from the voltage limit violations caused by high penetration of distributed photovoltaic systems in distribution networks, this paper proposes a method for identifying weak nodes based on a multi-criteria comprehensive assessment. The effectiveness of this method is verified using the IEEE 33-bus system.
The rest of the paper is organized as follows: Section 2 presents the Definition and Quantification Indicators of Weak Nodes. Section 3 proposes weak node identification methods. The original parameters of the case are given in Section 4. The impact of distributed photovoltaics on voltage is analyzed in Section 5. In Section 6 the results of the study are presented and discussed. Finally, Section 7 concludes the paper.
2. Definition and Quantification Indicators of Weak Nodes
As the scale of distributed generation in distribution networks continues to expand, the problem of voltage exceeding limits is becoming increasingly prominent. For the management and operation of distribution networks, it is meaningful to identify which nodes are more likely to experience voltage exceeding the upper limit and then take measures to control the node voltage. In radial distribution network systems, when distributed photovoltaic systems are connected to different nodes, some nodes exhibit significantly higher voltage fluctuations compared to others. This paper defines these nodes as weak nodes and establishes quantitative criteria based on their electrical characteristics to support the subsequent classification and assessment of weak nodes.
In distribution networks with a high proportion of distributed photovoltaic integration, the identification and quantification of weak nodes are crucial for voltage control and network optimization. This section proposes a comprehensive assessment method based on voltage sensitivity, voltage limit violation rate, and short-circuit capacity ratio. This method provides a theoretical basis for the safety analysis of distribution networks after the integration of distributed PV.
2.1. Definition of Weak Nodes in Distribution Networks
In distribution networks, weak nodes typically exhibit the characteristics shown in Table 1.

Table 1.
Characteristics of weak nodes.
Based on the characteristics outlined in Table 1, this paper defines weak nodes as those whose voltage stability, power supply reliability, or power quality are significantly lower than the system requirements due to factors such as structure, load, or operating conditions.
2.2. Quantitative Indicators for Weak Node Identification in Distribution Networks
The determination of weak nodes requires comprehensive consideration of static parameters and dynamic response characteristics. This paper mainly analyzes three types of indicators: voltage sensitivity, voltage violation rate, and short-circuit capacity ratio.
2.2.1. Voltage Sensitivity
Voltage sensitivity is a core indicator for measuring the sensitivity of distribution network nodal voltage to changes in power injection. It plays a crucial role in weak node identification and voltage control, especially in scenarios with high penetration of distributed photovoltaics. Voltage sensitivity reflects the degree of influence of PV integration on the distribution network voltage. The calculation equation is as follows:
Here, represents the node voltage, and represents the PV injected power. A larger value of indicates that the node voltage is more sensitive to PV fluctuations, making it more prone to voltage violation issues (e.g., voltage > 1.05 p.u. or < 0.95 p.u.). Traditional calculation methods primarily rely on taking the inverse of the Jacobian matrix J solved in power flow calculations [18].
Hence, we get
From this, voltage sensitivity can be directly obtained. However, these methods are relatively complex to compute and are not convenient for quick adoption. Therefore, this section adopts a simplified calculation method based on linear approximation, which quickly estimates voltage sensitivity through the nodal admittance matrix and initial power flow results. A small power perturbation (e.g., = 1 MW) can be applied to a node, and then the change in voltage is observed to obtain an approximate value of the voltage sensitivity, i.e.,
Actual data comparison confirms that the simplified calculation method is relatively accurate in low- and medium-voltage distribution networks and is also suitable for nodal networks of low-voltage distribution systems. In this paper, it is determined that if ≥ 0.05 p.u./MW, the voltage sensitivity is considered to be exceeded.
2.2.2. Voltage Violation Rate
The voltage violation rate reflects the frequency at which node voltage exceeds the safe range. In power systems, it is generally defined that node voltage must not exceed 1.05 p.u. or fall below 0.95 p.u. When high-penetration distributed photovoltaics are connected, or when multiple nodes simultaneously connect PV, the voltage violation rate generally increases significantly. The calculation equation for the voltage violation rate is shown below:
where is the number of violations for this node across all scenarios, and is the total number of scenarios.
2.2.3. Short-Circuit Capacity Ratio
Short-circuit capacity is an important indicator for measuring a node’s voltage support capability, reflecting the system’s tolerance to power fluctuations during faults or sudden changes [19]. Its calculation equation is as follows:
where is the short-circuit capacity of node i (MVA), and is the active power capacity of the PV connected to node i (MW).
A smaller SCR indicates that the node has weaker tolerance to changes in power and is more likely to become a weak node. Generally, if SCR > 10, the grid strength is high, and the impact of PV integration is small; if 5 < SCR ≤ 10, the grid strength may experience disturbances, requiring attention to voltage fluctuations; if SCR ≤ 5, the grid is weak and is prone to causing voltage violations or harmonic issues [20,21].
3. Weak Node Identification Method
After defining the quantitative criteria for weak nodes, the key issue becomes how to efficiently and accurately identify these nodes within the distribution network. This section proposes a method to determine weak nodes by combining the aforementioned voltage sensitivity, voltage violation rate, short-circuit capacity ratio, and the nodal characteristics after PV integration. The core of the method is to assign different weights to various indicators, as shown in the following equation:
This weight assignment is primarily based on a three-tier protection system for distribution networks: the first layer mainly addresses voltage violations, which is the most threatening indicator; the second layer focuses on voltage sensitivity, representing a potential risk of instability; and the third layer targets short-circuit capacity, primarily measuring grid structural strength. The identification steps are as follows:
- (1)
- Data Preprocessing: Extract node voltage data under different PV integration scenarios and perform per-unit normalization, converting actual voltage values into per-unit values.
- (2)
- Static Screening: First, conduct voltage violation screening to directly identify nodes with voltage violations, determine the number of violations, and subsequently calculate the voltage violation rate. Then, calculate the short-circuit capacity ratio (SCR) for each node using the equation mentioned above.
- (3)
- Dynamic Sensitivity Calculation: Employ the perturbation method, i.e., inject a small power disturbance into the target node to approximately calculate the voltage sensitivity.
- (4)
- Comprehensive Weighted Scoring: Assign corresponding weight coefficients to each type of indicator. This requires combining the specific distribution network model with actual application data.
- (5)
- Selecting weak nodes as access points for the construction of electric vehicle charging stations. Capacity planning and charge scheduling of electric vehicle charging stations. The flowchart is shown in Figure 1.
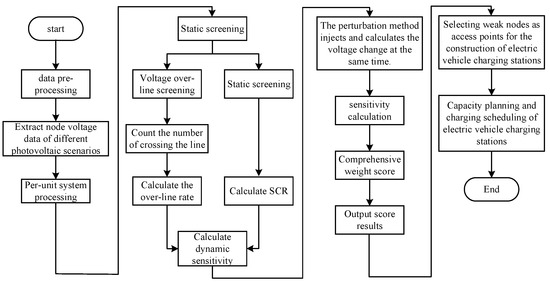 Figure 1. Identification method of weak nodes.
4. Case Raw Data
4.1. Original Parameters
The IEEE 33-node system is a standard distribution network test and analysis system, frequently used for distribution network analysis and algorithm validation, and is suitable for low-voltage distribution networks. Regional distribution networks integrating distributed photovoltaics are often applied in medium- to low-voltage networks. Therefore, this paper selects the IEEE 33-node data as the computational model for studying the impact of DPV integration on distribution networks. The topology of the IEEE 33-node system is shown in Figure 2.
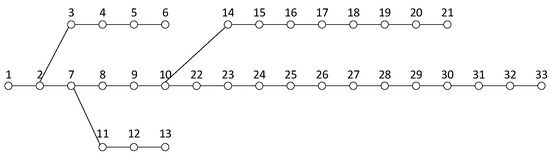
Figure 2.
IEEE 33-node topology diagram.
This distribution network is a radial network composed of 37 lines (including five tie-switch branches). Its voltage level is 10 kV, the total load is 3.92 MW + j2.44 Mvar, and the base capacity is set to 100 MVA. Node 1 is the slack bus, with its voltage per-unit value set to 1.0∠0, and the initial voltage of other nodes is set to 1.0 p.u. Furthermore, the short-circuit capacity of the aforementioned IEEE 33-node system is as shown in Table 2:
Table 2.
Short-circuit capacity of IEEE 33-bus system.
4.2. PV Access Point Selection
In practical applications, the access locations of distributed photovoltaics exhibit significant spatial randomness, primarily influenced by the following factors:
- User self-initiated behavior: Residential, commercial, and industrial users autonomously choose installation locations based on economic viability and policy incentives.
- Uneven resource distribution: Differences in available rooftop area and solar irradiance conditions lead to varying installation densities.
- Grid constraints: Some nodes cannot accommodate high-penetration PV due to voltage limits or line capacity restrictions.
Therefore, it is necessary to establish a randomized generation method to more accurately simulate the integration scenarios of distributed photovoltaic (PV) systems, thereby supporting the planning and operational analysis of distribution networks. To more realistically simulate the integration of distributed PV in actual distribution networks, this study proposes a randomized distribution design method for the locations of distributed PV integration based on a probabilistic model. This method considers various factors such as load demand at each node, available rooftop area, and solar irradiance conditions. By randomly generating the locations of PV integration points it provides more realistic simulation data for the analysis of weak nodes in distribution networks.
Based on factors such as load demand, available rooftop area, and solar irradiance conditions of each node in the actual distribution network, a weight value is assigned to each node. The weight assignment equation is shown in Equation (8). The higher the weight, the greater the probability of PV integration at that node.
where is the weight of node i; is the load demand of node i (normalized value); is the available rooftop area of node i (normalized value); is the solar irradiance intensity of node i (normalized value); are weight coefficients, satisfying .
Subsequently, a probability distribution is generated based on the node weights, and the roulette wheel selection algorithm is employed to randomly select the PV access nodes. The roulette wheel selection algorithm is a probability-based random selection mechanism. Its core idea is to assign a probability of being selected based on an individual’s fitness (or weight) within the total population; the higher the fitness, the greater the probability of being selected. The specific operating steps are as follows:
- (1)
- Calculate the total weight of all nodes: ;
- (2)
- Then calculate the cumulative probability for each node: ;
- (2)
- Generate a random number to select node i that satisfies as the PV access point.
Finally, the selected nodes undergo grid constraint verification, including voltage limits and line capacity. Based on the above analysis, this paper separately studies systems with single-node PV integration, two-node PV integration, and three-node PV integration.
5. Voltage Variation in the Case Study
5.1. Voltage Variation in Distribution Networks with Single-Node Integration of Distributed Photovoltaics
The analysis examines the voltage variation characteristics of each node in the system after distributed PV are integrated into different nodes. According to the method described above, nodes 2, 7, 13, 20, and 32 show a more pronounced willingness to integrate distributed PV. To control variables, this section assumes a constant capacity for the integrated distributed PV, with an active power of 4 MW and reactive power of 2 Mvar. Figure 3 illustrates the voltage variation curves for each node after distributed PV is individually integrated into nodes 2, 7, 13, 20, and 32.
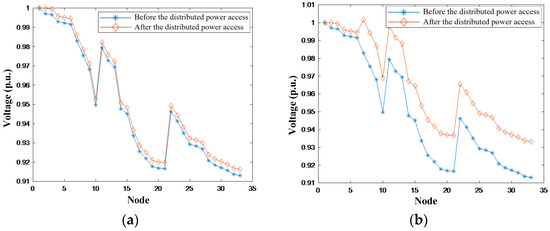
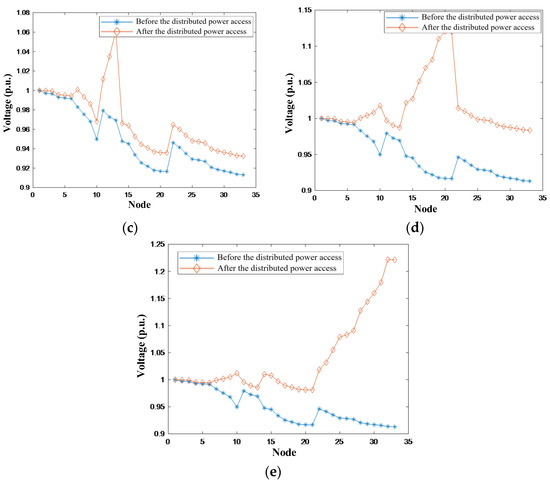
Figure 3.
Voltage changes after different nodes are connected to distributed photovoltaics. (a) Distributed photovoltaic access node 2. (b) Distributed photovoltaic access node 7. (c) Distributed photovoltaic access node 13. (d) Distributed photovoltaic access node 20. (e) Distributed photovoltaic access node 32.
The aforementioned data indicate that, in the scenario of distributed PV integration, the system exhibits a notable “voltage rise at the end nodes” phenomenon. For instance, nodes 20 and 32, which are located at the end of the lines, experience a significant increase in node voltage compared to other nodes when distributed PV is connected. Conversely, if the distributed PV is connected to nodes closer to the beginning of the line, such as node 2, the changes in node voltage magnitude are minimal, and in some cases, the voltage levels remain nearly identical to those without PV integration.
5.2. Voltage Changes in Distribution Network with Multiple Nodes Simultaneously Integrating Distributed Photovoltaics
When distributed photovoltaics are integrated according to the node groupings shown in Table 3, voltage changes across multiple different nodes can be observed. When multiple nodes integrate DPV, with each node having an active power of 2 MW and reactive power of 1 Mvar, the voltage experiences a significant increase compared to integrating DPV at only a single node, as shown in Table 3.
Table 3.
Node voltage amplitude after multiple nodes are connected to distributed photovoltaic at the same time (p.u.).
The data presented above indicates that while the voltage rise effect when a PV system is connected to only a single node is usually limited to the vicinity of the access point, when PV is connected to two or more nodes, the voltage improvement effect is more significant and more evenly distributed, forming a “multi-point support effect”, as shown in Figure 4 and Figure 5. Reasonably planning the access locations and combination methods of distributed photovoltaics can significantly improve the voltage quality of the distribution network, especially for providing voltage support at the ends of long feeders, which is clearly superior to single-point access solutions.
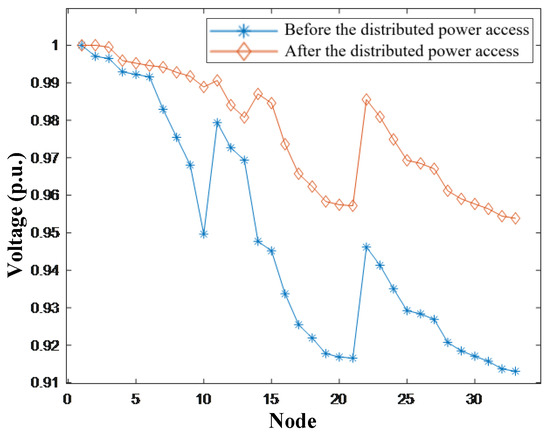
Figure 4.
Simultaneous PV integration at nodes 10 and 25.
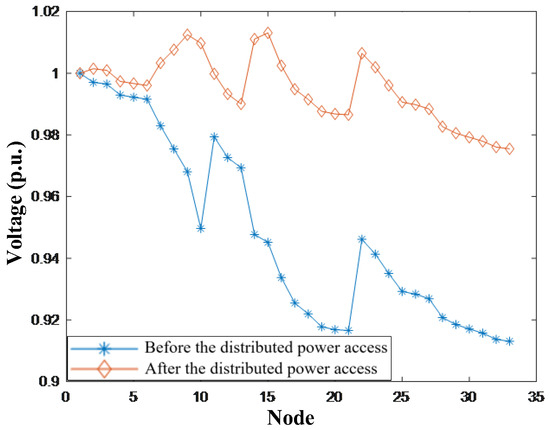
Figure 5.
Simultaneous PV integration at nodes 2, 9, and 15.
Further analysis indicates that multi-node PV integration exacerbates the imbalance in voltage distribution. For example, the PV output at node 15 will elevate the voltage of downstream nodes 16 to 33, while the connection at node 9 provides limited voltage support to upstream nodes 1 to 8, leading to an increased voltage difference between the beginning and end of the system.
5.3. Voltage Changes in Distribution Network for Single-Node PV Integration with Different PV Penetration Rates
Furthermore, this paper analyzes the impact of different photovoltaic penetration rates on distribution network voltage. Node 26 is selected as the integration point for distributed PV, with a potential PV installation capacity ranging from 0.8 to 5 MVA at this node. To further investigate the influence of PV integration capacity on the grid, this section employs PV penetration rate for definition and analysis, as shown in Equation (9).
where PR is the PV penetration rate, is the integrated PV capacity (MVA), and is the total installed capacity of the system. Therefore, within the 0–100% penetration range, by selecting PV installed capacities of 0.4615 MVA, 0.9234 MVA, 1.8468 MVA, 3.2319 MVA, and 4.617 MVA, the penetration rates are 10%, 20%, 40%, 70%, and 100%, respectively. This analysis studies the voltage change patterns of distribution network nodes with different single-node PV penetration rates. Assuming a power factor of 0.9, the different PV penetration rates are obtained as shown in Table 4.
Table 4.
The power accessed under different PV penetration rates.
Through power flow calculation of the distribution network, the curves illustrating the voltage magnitude changes in each node when node 26 integrates PV capacity at different penetration rates can be obtained, as shown in Figure 6.
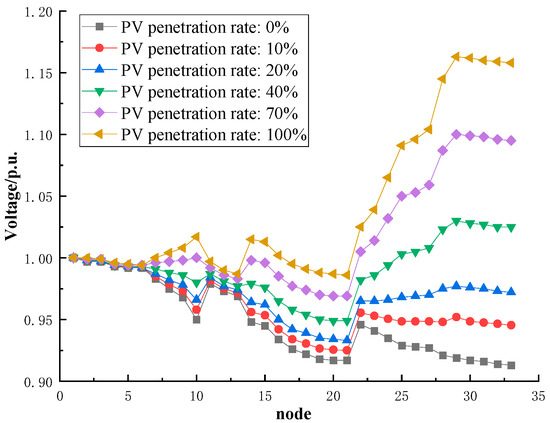
Figure 6.
The change in node voltage under different PV penetration rates.
From the figure, it can be observed that as the penetration rate of PV integrated at node 26 increases, the voltage rise in the downstream nodes becomes more pronounced, and the greater the integrated PV capacity, the greater the harm to the distribution network. The impact of PV penetration on the distribution network can be summarized as shown in Table 5.
Table 5.
Impact of PV penetration on power grid.
6. Identification of Weak Nodes in the Case Study
6.1. Weak Nodes Under High PV Penetration
For the distribution network system discussed in Section 4, we observe the nodes most affected by PV integration. To facilitate analysis, data from a high penetration scenario (70% PV penetration) is used, which also aids in subsequent validation. Subsequently, we screen for voltage-limit-exceeding nodes (>1.05 p.u.), identifying nodes 25, 26, 27, 28, 29, 30, and 31 as experiencing voltage limit violations. Among these, nodes 28, 30, and 31 exhibit the most severe voltage violations, with their voltage magnitudes exceeding 1.08 p.u. The remaining nodes are in a critical near-limit violation state as shown in Table 6.
Table 6.
Characteristics of voltage-limit-exceeding nodes.
Nodes 28, 30, and 31 were preliminarily identified as voltage weak points and subjected to a multi-indicator comprehensive evaluation. Specifically: Node 28 is located close to the distributed generation (DG) connection point. It has a high voltage limit violation rate, indicating that its voltage consistently exceeds the permissible limits across all penetration scenarios. The voltage sensitivity for Node 28 is denoted as . From Table 2, we obtain the value = 25.3, corresponding to . Taking the reciprocal of SCR yields 0.115.
For the IEEE 33-node system studied herein, based on the hierarchical relationship of the three-layer framework, weight coefficients are assigned as follows: = 0.5, = 0.3, and = 0.2. According to Equation (8), the vulnerability indices for voltage weak points can be calculated, as shown in Table 7. The vulnerability indices are defined as follows: C: non-weak nodes < 0.2, B: weak nodes 0.2 < W < 0.5, A: severely weak nodes > 0.5.
Table 7.
Indicators of weak nodes in the distribution network at 70% PV penetration.
A comprehensive comparison reveals the ranking of integrated scores for the three nodes, with node 31 identified as the weakest node, also considered the grid weak point of the system. Additionally, based on the different positions and characteristics of each node, improvement methods can be provided: for node 31, priority should be given to voltage control measures such as installing SVG or adjusting PV output. For node 30, due to its high sensitivity and end effect, network structure optimization, such as adding tie switches, can improve the situation. For node 28, located close to the PV connection point, local reactive power compensation can alleviate the issue.
6.2. Weak Nodes in Distribution Networks with a Single Node Connected to Distributed PV
When PV is connected to the initial segment nodes, its impact on the distribution network is minimal. Therefore, this study primarily analyzes the vulnerabilities of various nodes after connecting PV to the end nodes. Based on the node voltage magnitudes shown in Figure 3, statistical analysis can be conducted to determine voltage limit violations under this scenario. The voltage limit violations for different nodes are summarized in Table 8.
Table 8.
Voltage limit violations for different nodes.
Considering the voltage rise impact of PV integration on nearby nodes, attention is drawn to the voltage rise at critical tie nodes. Nodes 10, 24, 32, and 33 are selected for vulnerability analysis. For voltage sensitivity, to facilitate analysis, we calculate using the nodes with the maximum voltage rise due to PV integration, resulting in the vulnerability indices as shown in Table 9.
Table 9.
Weak nodes in distribution networks with a single node connected to distributed PV.
Nodes 32 and 33 exhibit the highest vulnerability levels in the simulation scenarios of this section. For a single PV system connected to the distribution network, the vulnerability of end nodes is more pronounced compared to nodes close to the PV connection point and critical tie nodes. For critical tie node 10, its vulnerability index is significantly lower than other nodes when only one node is connected to PV; thus, it can be defined as a non-vulnerable node.
6.3. Weak Nodes in Distribution Networks with Two Nodes Connected to Distributed PV
When two distributed PV nodes are connected simultaneously in the distribution network, the system voltage distribution characteristics will exhibit more complex interactions. Based on the combination data of two nodes connected to distributed PV in Table 10, including scenarios such as nodes {2, 10}, nodes {10, 25}, and nodes {24, 25}, and assuming a total PV generation power of 4 MW for each combination, the vulnerability levels can be calculated using the power flow data from Section 5.2. The vulnerability indices and levels for nodes 10 (critical tie node), 26 (most frequent voltage limit violations), and 33 (end node) are shown in Table 10.
Table 10.
Vulnerability indices for nodes with two distributed PV connections.
From the above analysis, it can be seen that compared to end nodes, node 26, which is closer to the distributed PV connection points, exhibits a higher vulnerability index. The vulnerability index of node 10 shows little change compared to the scenario with only one node connected.
6.4. Weak Nodes in Distribution Networks with Three Nodes Connected to Distributed PV
When three nodes are simultaneously connected to distributed PV, the total active power capacity of the PV systems is 6 MW, specifically at nodes 10, 28, and 33. Based on the data from Section 5.2, the vulnerability indices and levels can be calculated, as shown in Table 11.
Table 11.
Weak nodes in distribution networks with three nodes connected to distributed PV.
When PV capacity is connected to three nodes, especially when concentrated at different nodes, the voltage at end nodes will significantly increase. After connecting nodes 9, 15, and 33 simultaneously, the further away a node is from the starting point on the line after node 22, the greater the voltage rise. Based on the above vulnerability indices analysis, it can be easily determined that node 33 is the most vulnerable node in terms of voltage. Additionally, it should be noted that node 10, as a critical tie node, although its vulnerability index is relatively low compared to other nodes, has significantly increased compared to the scenario with two nodes connected to distributed PV. Attention should be paid to improving the vulnerability of this node.
The above analysis validates the effectiveness of the proposed vulnerability node identification method. Furthermore, when distributed PV systems with different capacities are connected to various nodes in a radial distribution network, the voltages of associated nodes will change. At this point, further measures such as establishing electric vehicle charging stations or installing charging piles can be adopted. By using price signals to encourage EV charging, the PV accommodation rate can be increased, ensuring stable operation of the distribution network.
6.5. Comparison of Weak Node Identification Methods
The analysis of weak nodes in the power grid is a key link in ensuring the safe and stable operation of the power grid and preventing large-scale power outages. This paper proposes a method for identifying weak nodes in low-voltage distribution networks for distributed power access based on comprehensive calculations of three indicators: voltage sensitivity, voltage over limit rate, and short-circuit capacity ratio, which can guide the planning and construction of electric vehicle charging stations. In addition, with the integration of new energy and the complexity of power grid structures, the identification methods for weak nodes are constantly enriched and improved, including topology and complex network analysis [22], information entropy fusion [23], and Bayesian/data-driven methods [24]. The comparison between the method proposed in this paper and other methods is shown in Table 12.
Table 12.
The comparison between the method proposed in this paper and other methods.
Based on the comparison in Table 12, suitable methods can be selected according to the characteristics of the scenario during the analysis of weak node data in the power grid.
7. Conclusions
Driven by China’s “dual-carbon” strategy, distributed photovoltaic systems are being integrated into distribution networks at an annual growth rate exceeding 30%. Once the penetration level surpasses 20%, the pronounced stochasticity of PV generation and the resulting reverse-power flows readily trigger voltage violations, equipment overloads, and even cascading disconnections. To address this challenge, this paper first proposes the concept of siting electric-vehicle charging stations at weak buses—rather than at arbitrary locations—to actively support renewable-energy absorption. Second, to systematically identify these weak buses under high PV penetration, we introduce a multi-criterion assessment framework that simultaneously incorporates (i) voltage-deviation ratio, (ii) sensitivity analysis, and (iii) power-margin metrics. Finally, leveraging the standard IEEE 33-node topology and its base-case data, our calculations reveal that when PV is connected to the network, buses located at the feeder ends exhibit markedly higher vulnerability than both the PV point of connection itself and any key tie buses. Moreover, the buses most prone to voltage-limit violations consistently display the greatest fragility. For example, when distributed PV is connected to only one node at a time—namely nodes 2, 7, 13, 20, or 32—the feeder-end nodes 32 and 33 consistently exhibit the highest vulnerability.
Therefore, when planning new or expanded distributed PV installations, utilities can apply the proposed methodology to reassess which buses will become vulnerable after the additional PV is connected. EV charging stations can then be deliberately sited at these newly identified weak buses, boosting local renewable-energy absorption while simultaneously mitigating the adverse impacts of distributed PV on the grid.
Author Contributions
Conceptualization, X.L. and J.L. (Jian Liu); methodology, L.L.; software, X.X.; validation, X.X., L.L. and X.L.; formal analysis, J.L. (Jiacheng Li); investigation, J.L. (Jian Liu); resources, N.G.; data curation, N.G.; writing—original draft preparation, X.X.; writing—review and editing, X.L.; visualization, J.L. (Jiacheng Li); supervision, J.L. (Jiacheng Li); project administration, N.G.; funding acquisition, J.L. (Jian Liu) All authors have read and agreed to the published version of the manuscript.
Funding
This research was funded by the Science and Technique Project Funds of State Grid Jiangsu Electric Power (grant number: J2024060).
Data Availability Statement
The original contributions presented in this study are included in the article. Further inquiries can be directed to the corresponding author.
Conflicts of Interest
Xiaoxing Lu, Xiaolong Xiao, Jian Liu, and Ning Guo are the employees of State Grid Jiangsu Electric Power Co., Ltd. The paper reflects the views of the scientists, and not the company.
References
- Ge, L.; Du, T.; Li, C.; Li, Y.; Yan, J.; Rafiq, M.U. Virtual Collection for Distributed Photovoltaic Data: Challenges, Methodologies, and Applications. Energies 2022, 15, 8783. [Google Scholar] [CrossRef]
- Wang, Y.; He, J.; Chen, W. Distributed solar photovoltaic development potential and a roadmap at the city level in China. Renew. Sustain. Energy Rev. 2021, 141, 110772. [Google Scholar] [CrossRef]
- Rahdan, P.; Zeyen, E.; Gallego-Castillo, C.; Victoria, M. Distributed photovoltaics provides key benefits for a highly renewable European energy system. Appl. Energy 2024, 360, 122721. [Google Scholar] [CrossRef]
- Singh, B.; Dubey, P.K. Distributed power generation planning for distribution networks using electric vehicles: Systematic attention to challenges and opportunities. J. Energy Storage 2022, 48, 104030. [Google Scholar] [CrossRef]
- Li, X.; Wang, L.; Yan, N.; Ma, R. Cooperative Dispatch of Distributed Energy Storage in Distribution Network with PV Generation Systems. IEEE Trans. Appl. Supercond. 2021, 31, 0604304. [Google Scholar] [CrossRef]
- Wang, Y.; Zhen, J. Evaluating the economic and environmental impacts of distributed photovoltaic policy: Insights from county-level data in China. Energy Policy 2025, 198, 114509. [Google Scholar] [CrossRef]
- Rajakumar, P.; Balasubramaniam, P.M.; Aldulaimi, M.H.; M, A.; Ramesh, S.; Alam, M.M.; Al-Mdallal, Q.M. An integrated approach using active power loss sensitivity index and modified ant lion optimization algorithm for DG placement in radial power distribution network. Sci. Rep. 2025, 15, 10481. [Google Scholar] [CrossRef]
- Li, B.; Ma, J.Y.; Hu, K.; Xu, S.H.; Jiao, H.; Chen, J.M.; Liu, W. A Method for Parameter Identification of Distribution Network Equipment Based on Sequential Model-Based Optimization. Int. Trans. Electr. Energy Syst. 2022, 2022, 9880284. [Google Scholar] [CrossRef]
- Wang, Z.; Lin, D.; Zeng, G.; Yu, T. A Practical Large-Scale Distribution Network Planning Model Based on Elite Ant-Q. IEEE Access 2020, 8, 58912–58922. [Google Scholar] [CrossRef]
- Zhao, C.; Li, X.; Cai, Y. A power grid topology detection method based on edge graph attention neural network. Electr. Power Syst. Res. 2025, 239, 111219. [Google Scholar] [CrossRef]
- Lu, Y.; Xiang, Y.; Huang, Y.; Yu, B.; Weng, L.; Liu, J. Deep reinforcement learning based optimal scheduling of active distribution system considering distributed generation, energy storage and flexible load. Energy 2023, 271, 127087. [Google Scholar] [CrossRef]
- Dalavi, F.; Golshan, M.E.H.; Hatziargyriou, N.D. A review on topology identification methods and applications in distribution networks. Electr. Power Syst. Res. 2024, 234, 110538. [Google Scholar] [CrossRef]
- Wang, L.; Xie, L.; Yang, Y.; Zhang, Y.; Wang, K.; Cheng, S. Distributed Online Voltage Control with Fast PV Power Fluctuations and Imperfect Communication. IEEE Trans. Smart Grid 2023, 14, 3681–3695. [Google Scholar] [CrossRef]
- Corrêa, H.P.; Vieira, F.H.T. Cooperative Markov Decision Process for Voltage Control of Grid-Tied Photovoltaic Generators with Reactive Power Support. IEEE Trans. Sustain. Energy 2022, 13, 919–933. [Google Scholar] [CrossRef]
- Xu, B.; Zhang, G.; Li, K.; Li, B.; Chi, H.; Yao, Y.; Fan, Z. Reactive power optimization of a distribution network with high-penetration of wind and solar renewable energy and electric vehicles. Prot. Control Mod. Power Syst. 2022, 7, 51. [Google Scholar] [CrossRef]
- Yin, W.; Qin, X. Cooperative optimization strategy for large-scale electric vehicle charging and discharging. Energy 2022, 258, 124969. [Google Scholar] [CrossRef]
- Adetunji, K.E.; Hofsajer, I.W.; Abu-Mahfouz, A.M.; Cheng, L. An optimization planning framework for allocating multiple distributed energy resources and electric vehicle charging stations in distribution networks. Appl. Energy 2022, 322, 119513. [Google Scholar] [CrossRef]
- Kinga, S.; Megahed, T.F.; Kanaya, H.; Mansour, D.-E.A. A new voltage sensitivity-based distributed feedback online optimization for voltage control in active distribution networks. Comput. Electr. Eng. 2024, 119, 109574. [Google Scholar] [CrossRef]
- He, S.; Zhao, S.; Wang, S.; Huang, J.; Zhang, C.; Wang, H. A fast short circuit capacity calculation model based on regression neural network in complex grid environment. Appl. Math. Nonlinear Sci. 2024, 9. [Google Scholar] [CrossRef]
- IEC 62477-1:2022; Safety Requirements for Power Electronic Converter Systems and Equipment-Part 1: General. IEC: Geneva, Switzerland, 2022. Available online: https://webstore.iec.ch/en/publication/28936 (accessed on 23 July 2025).
- GB 38755-2019; Code on Security and Stability for Power System. National Energy Administration: Beijing, China, 2019.
- Zhu, D.; Wang, H.; Wang, R.; Duan, J.; Bai, J. Identification of Key Nodes in a Power Grid Based on Modified PageRank Algorithm. Energies 2022, 15, 797. [Google Scholar] [CrossRef]
- Yan, M.; Wu, J.; Jiang, H.; Kou, Y.; Zhao, W. Comprehensive vulnerability assessment of power system nodes with wind power based on Dagum-Gini coefficient approach. Sci. Rep. 2025, 15, 11597. [Google Scholar] [CrossRef] [PubMed]
- Gao, X.; Ye, Y.; Su, W.; Chen, L. Assessing the comprehensive importance of power grid nodes based on DEA. Int. J. Crit. Infrastruct. Prot. 2023, 42, 100614. [Google Scholar] [CrossRef]
Disclaimer/Publisher’s Note: The statements, opinions and data contained in all publications are solely those of the individual author(s) and contributor(s) and not of MDPI and/or the editor(s). MDPI and/or the editor(s) disclaim responsibility for any injury to people or property resulting from any ideas, methods, instructions or products referred to in the content. |
© 2025 by the authors. Published by MDPI on behalf of the World Electric Vehicle Association. Licensee MDPI, Basel, Switzerland. This article is an open access article distributed under the terms and conditions of the Creative Commons Attribution (CC BY) license (https://creativecommons.org/licenses/by/4.0/).