1. Introduction
The permanent magnet synchronous motor (PMSM) is a critical technology in electric vehicles, recognized for its high power density, efficiency, and superior dynamic performance. Research indicates that PMSMs offer strong overload capacity, fast response, and smaller volume, making them ideal for electric vehicle drive systems. When compared to surface-mounted permanent magnet synchronous motors, interior permanent magnet synchronous motors (IPMSMs) boast high reluctance torque and a wide range of constant power operation, achieved through flux-weakening techniques. Therefore, IPMSMs are widely applied as drive motors in electric vehicles [
1,
2].
In recent years, the field of motor optimization has seen significant advancements, with multi-objective optimization methods emerging as a key research focus to enhance the overall performance of electric motors. For instance, multi-objective optimization techniques are extensively applied in motor design to balance various objectives such as efficiency, cost, volume, and weight, as detailed in the motor design application of multi-objective optimization [
3,
4,
5,
6,
7,
8]. These methods enable designers to identify a set of optimal solutions that represent a trade-off among conflicting objectives, thereby improving the general performance of electrical motors. Junguo Cui et al. applied a combined DOE and Taguchi approach to optimize the design of a submersible PMSM, aiming to achieve peak efficiency and significantly reduce cogging torque [
9]. Pin Lv et al. adopted an improved Multi-Objective Salp Swarm Optimization Algorithm (IMOSSA) and Spearman correlation analysis to weaken the torque ripple caused by cogging torque and increase the output torque of PMSMs [
10]. Yinquan Yu et al. presented a hybrid multi-objective optimization scheme combining the Taguchi method and particle swarm optimization (PSO) algorithm; the motor’s output torque, torque ripple, and core losses were optimized [
11]. Xu Wang et al. presented a radial–axial hybrid excitation machine with consequent poles for electric vehicles and optimized the torque output, flux-regulation ability, and torque ripple using the non-dominated sorting genetic algorithm II (NSGA II) [
12].
Besides the optimization method, the choice of the mapping method between design properties and objectives is another key issue. Currently, there are three main methods. The first one is the finite element analysis (FEA) model [
13]. FEA is a computational method that accurately models the relationships between design parameters and objectives. However, the FEA model requires substantial computational resources and execution time. The second one is an equivalent model based on several electromagnetic field theory models such as the subdomain field model [
14], the equivalent magnetic circuit model [
15], and the equivalent magnetic network model [
16]. Although equivalent models can achieve objectives swiftly, their calculation accuracy falls short of that provided by FEA. Furthermore, when the topology undergoes changes, the equivalent model requires reconstruction. The third one is the surrogate model, which is based on data-driven approaches like response surface methodology (RSM) [
17], the Kriging surrogate model [
18], artificial neural networks (ANNs) [
19], and so on. Although the surrogate model requires a lot of input data in the early stage, the results can be obtained quickly after the model is established. Focusing on non-linear systems, ANNs are the most beneficial among them.
From the studies in Refs. [
9,
10,
11,
12,
13,
14,
15,
16,
17,
18,
19], most optimization research has always aimed at improving existing electrical motors. The optimization variable dimensions were limited and optimization design was infrequently initiated at the onset of the design process. This paper introduces a multi-objective optimization framework tailored for V-Shaped IPMSM demands, which involve high-dimensional variables. Initially, a proportional parametric FEA model tailored for V-Shaped IPMSMs was developed. This FEA model boasts advantages stemming from its high-dimensional variables, particularly focusing on the aspect of design variables; it has strong versatility and can effectively reduce the possibility of size interference between design variables. The relations between design variables and objectives were confirmed by a design of experiments (DOE) approach, and the sensitivities of the design variables to the objectives were analyzed. Then, a back-propagation (BP) neural network was trained as a surrogate model using DOE results to replace the FEA model. Focusing on a specific demand of V-Shaped IPMSMs, optimal design parameters were acquired by combining the surrogate model and NSGA-II. Finally, a prototype of the electrical motor was fabricated, and the results of the conducted experiments confirmed the effectiveness of the optimization framework.
2. Topology and Design Specifications of Parametric Model
FEA methods can address the non-linearity of the magnetization process in the electrical motor design process, which has multiple variables and strong coupling properties. Therefore, it is necessary to establish a parametric FEA model to accurately evaluate output performance under different design parameters. This is the basis of the subsequent DOE.
The structure of a V-Shaped IPMSM is shown in
Figure 1. In order to reduce the probability of size interference between electrical motor design parameters, a proportional parametric model is established. The design parameters of the proportional parametric model are shown in
Table 1.
Dso is the stator outer diameter,
Dsi is the stator inner diameter,
Dro is the rotor outer diameter,
Q is the slot number,
p represents the pole pairs,
g is the air gap length,
bt is the tooth width of the stator,
by is the yoke height of the stator,
hm is the magnet thickness,
Wm is the magnet width,
θp is the pole arc angle, and
Ls is the iron core length.
In addition, the excitations in armature windings are assigned as in Equation (1).
where
Fs represents the magnetomotive force expressed in Equation (2),
ωelc represents the electrical angular frequency, and
γ is the primary phase angle.
where
Irms is the root-mean-square value of the phase current,
Ns is the conductor number per slot,
m is the phase number, and
a is the number of parallel branches for armature winding.
3. Surrogate Model Design
3.1. Design of Experiment
DOE technology is the key to constructing the surrogate model. The principle is to obtain the data characteristics in the global search space by selecting more typical design points. A reasonable experimental design can improve the sampling efficiency and the accuracy of the surrogate model.
The Latin hypercube sampling (LHS) method and the orthogonal sampling method are the most common methods used in surrogate models for electric motors. The orthogonal sampling experiment method is also called the Taguchi method, which can be used to obtain more useful information with fewer experiments. For high-dimensional design parameters, the effect of the orthogonal sampling method for decreasing experiment numbers is not useful, and the orthogonal sampling method cannot produce an arbitrary number of design points. However, the basis of LHS is a full stratification of the sampled distribution with a random selection inside each stratum. According to the value range of the influence factors of the experiment, the probability distribution function of the experiment factors is divided into non-overlapping sub-regions, and finally, independent equal-probability sampling is carried out at each sub-interval. Compared with the orthogonal sampling method, the number of experiments can be manually controlled by LHS [
20].
In this paper, the LHS method is employed as the sample method. The design parameters’ variation range and constraint value are shown in
Table 2. The results of copper loss, core loss, and average torque with a speed of 10,000 r/min are used as responses. They directly reflect the output characteristics of the electrical motor.
Copper loss can be calculated using Equations (3) and (4) when the design parameters are fixed.
ρCu is the electrical resistivity of copper,
lhalf is the half-turn length of the armature coil, and
Ac is the area of the conductor.
The number of samples is set to 4000, and the number of effective samples is 2502. The results of LHS are shown in
Table 3.
PFe is core loss, and
Tavg is average torque; they are calculated by FEA.
3.2. Sensitivity Analysis
Obviously, the excitation parameters must have a strong correlation with the response results. Greater attention is given to the relationship between structure parameters and response results. Therefore, the Pearson correlation analysis is used to analyze the sensitivity between structure parameters and response results.
Figure 2 shows the sensitivity between the structure parameters and
PCu,
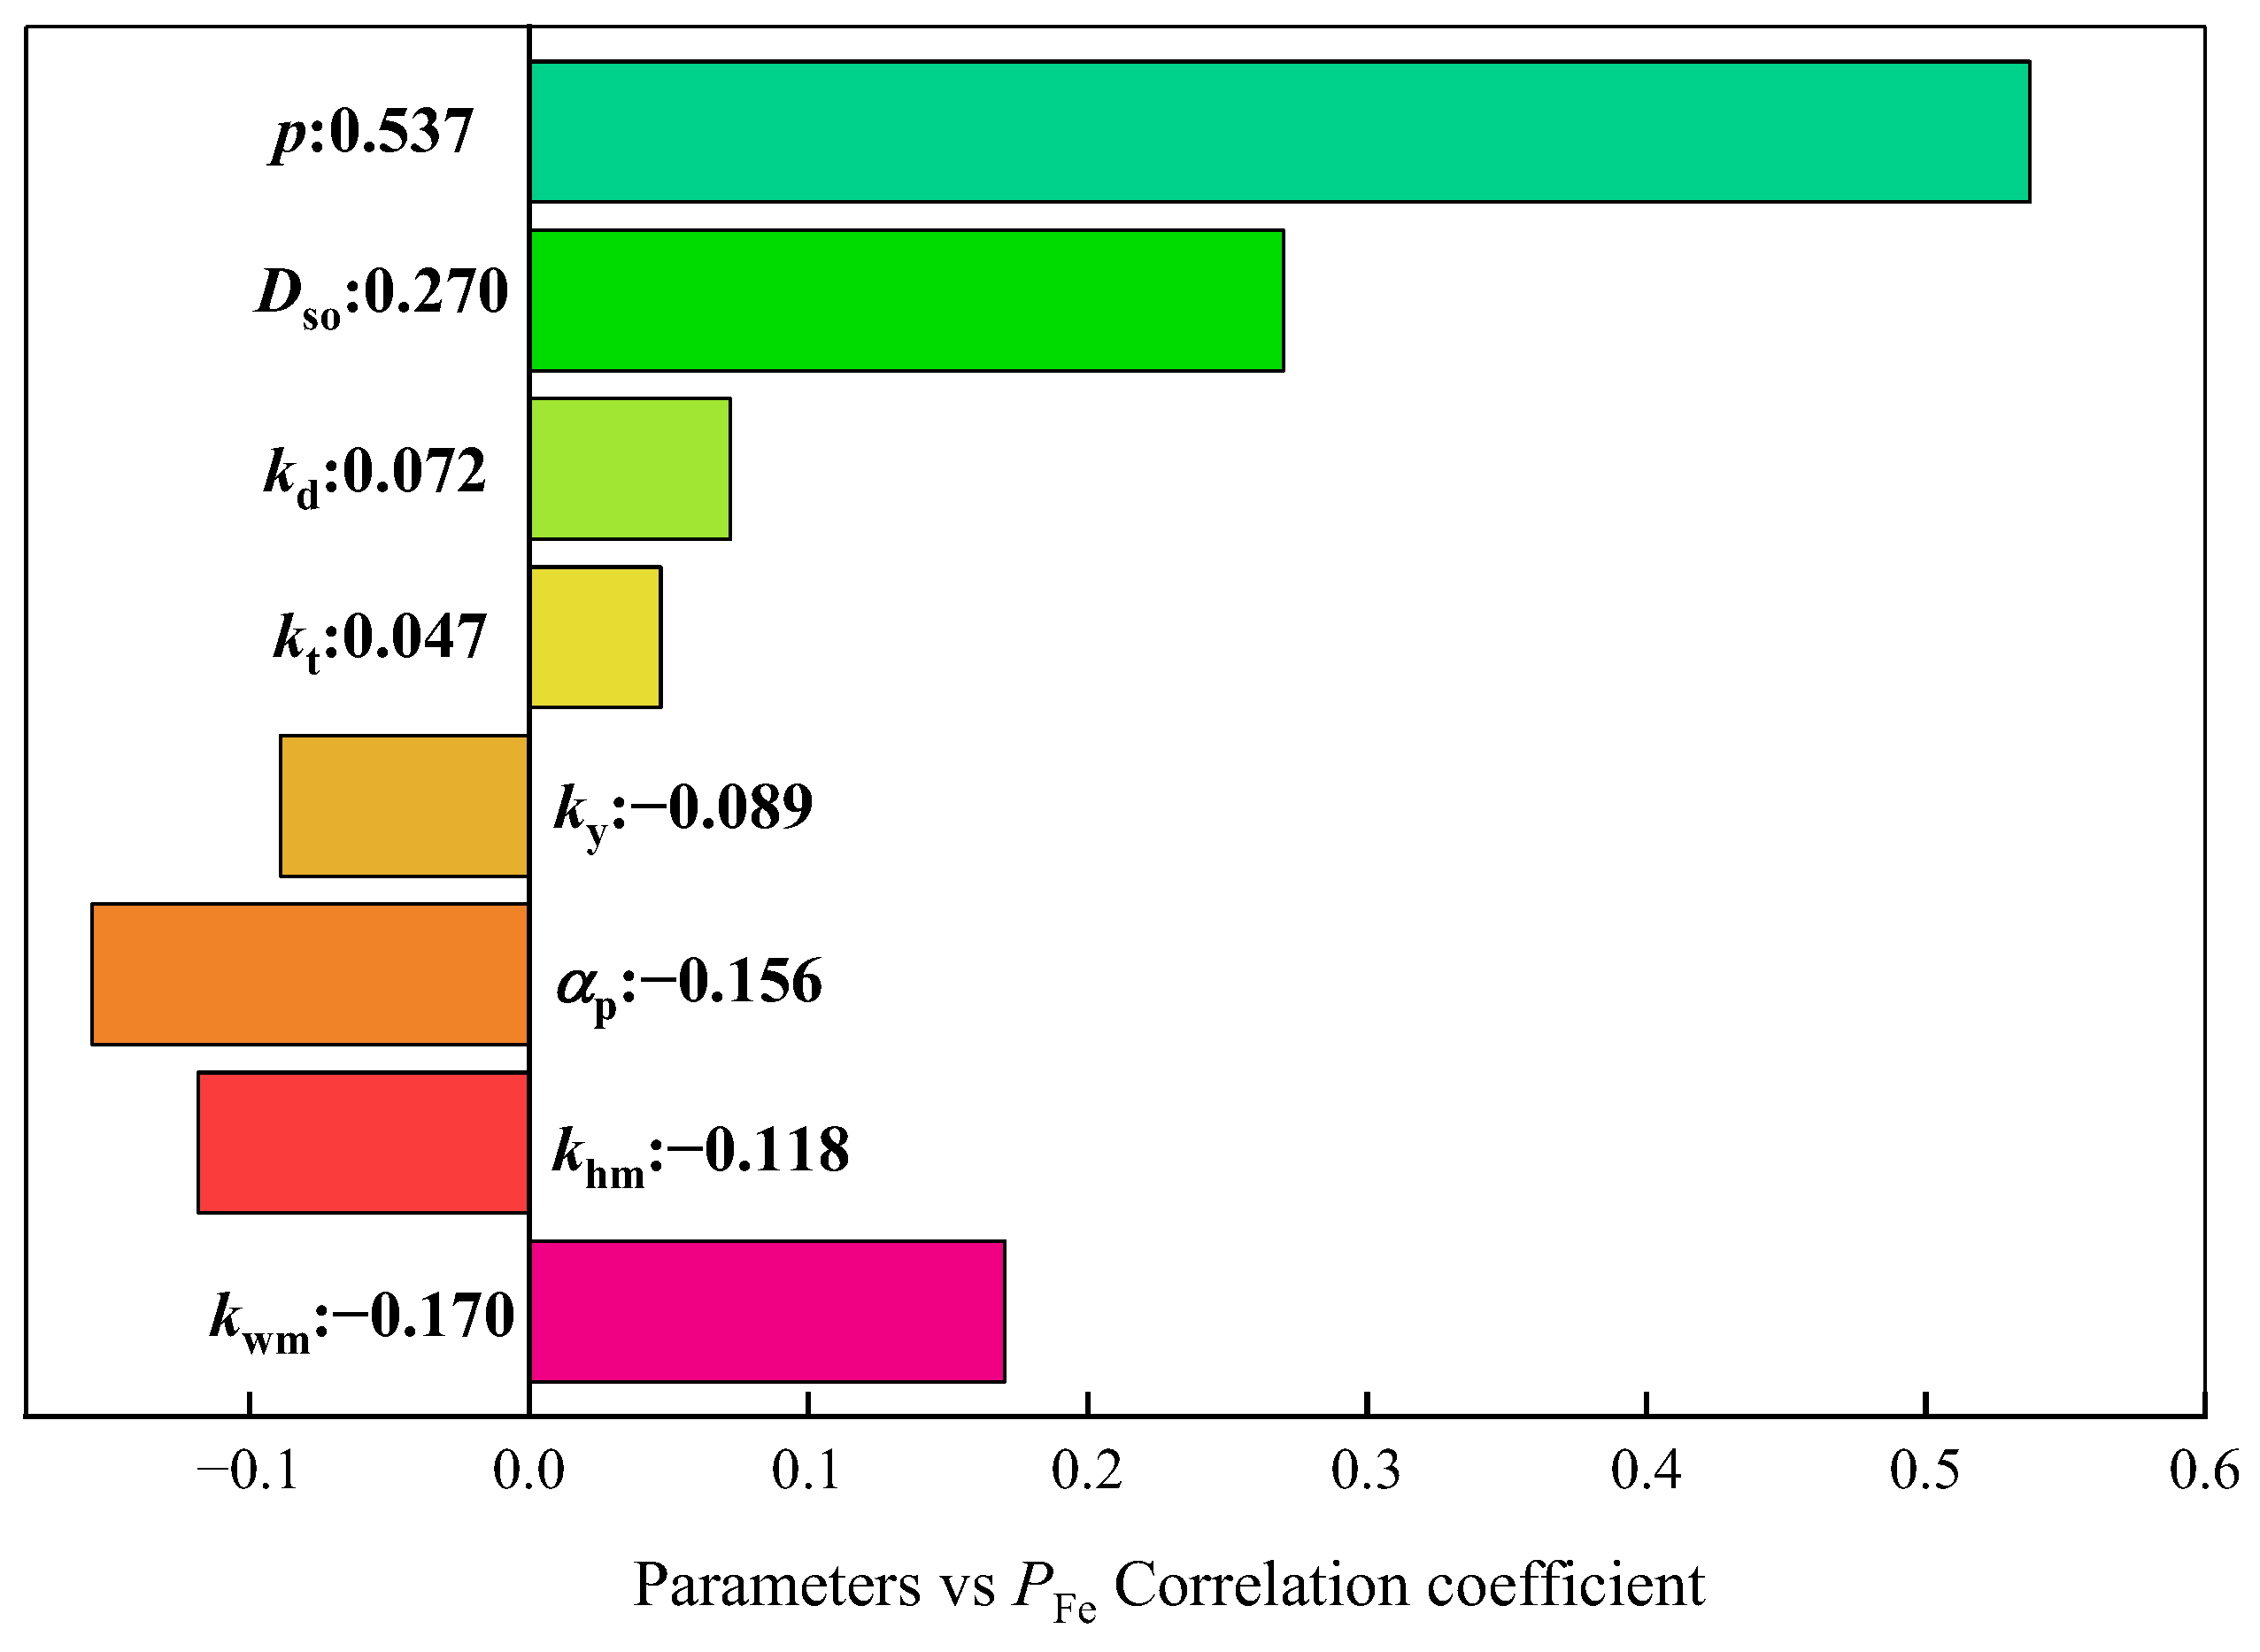
Figure 3 shows the sensitivity between the structure parameters and
PFe, and
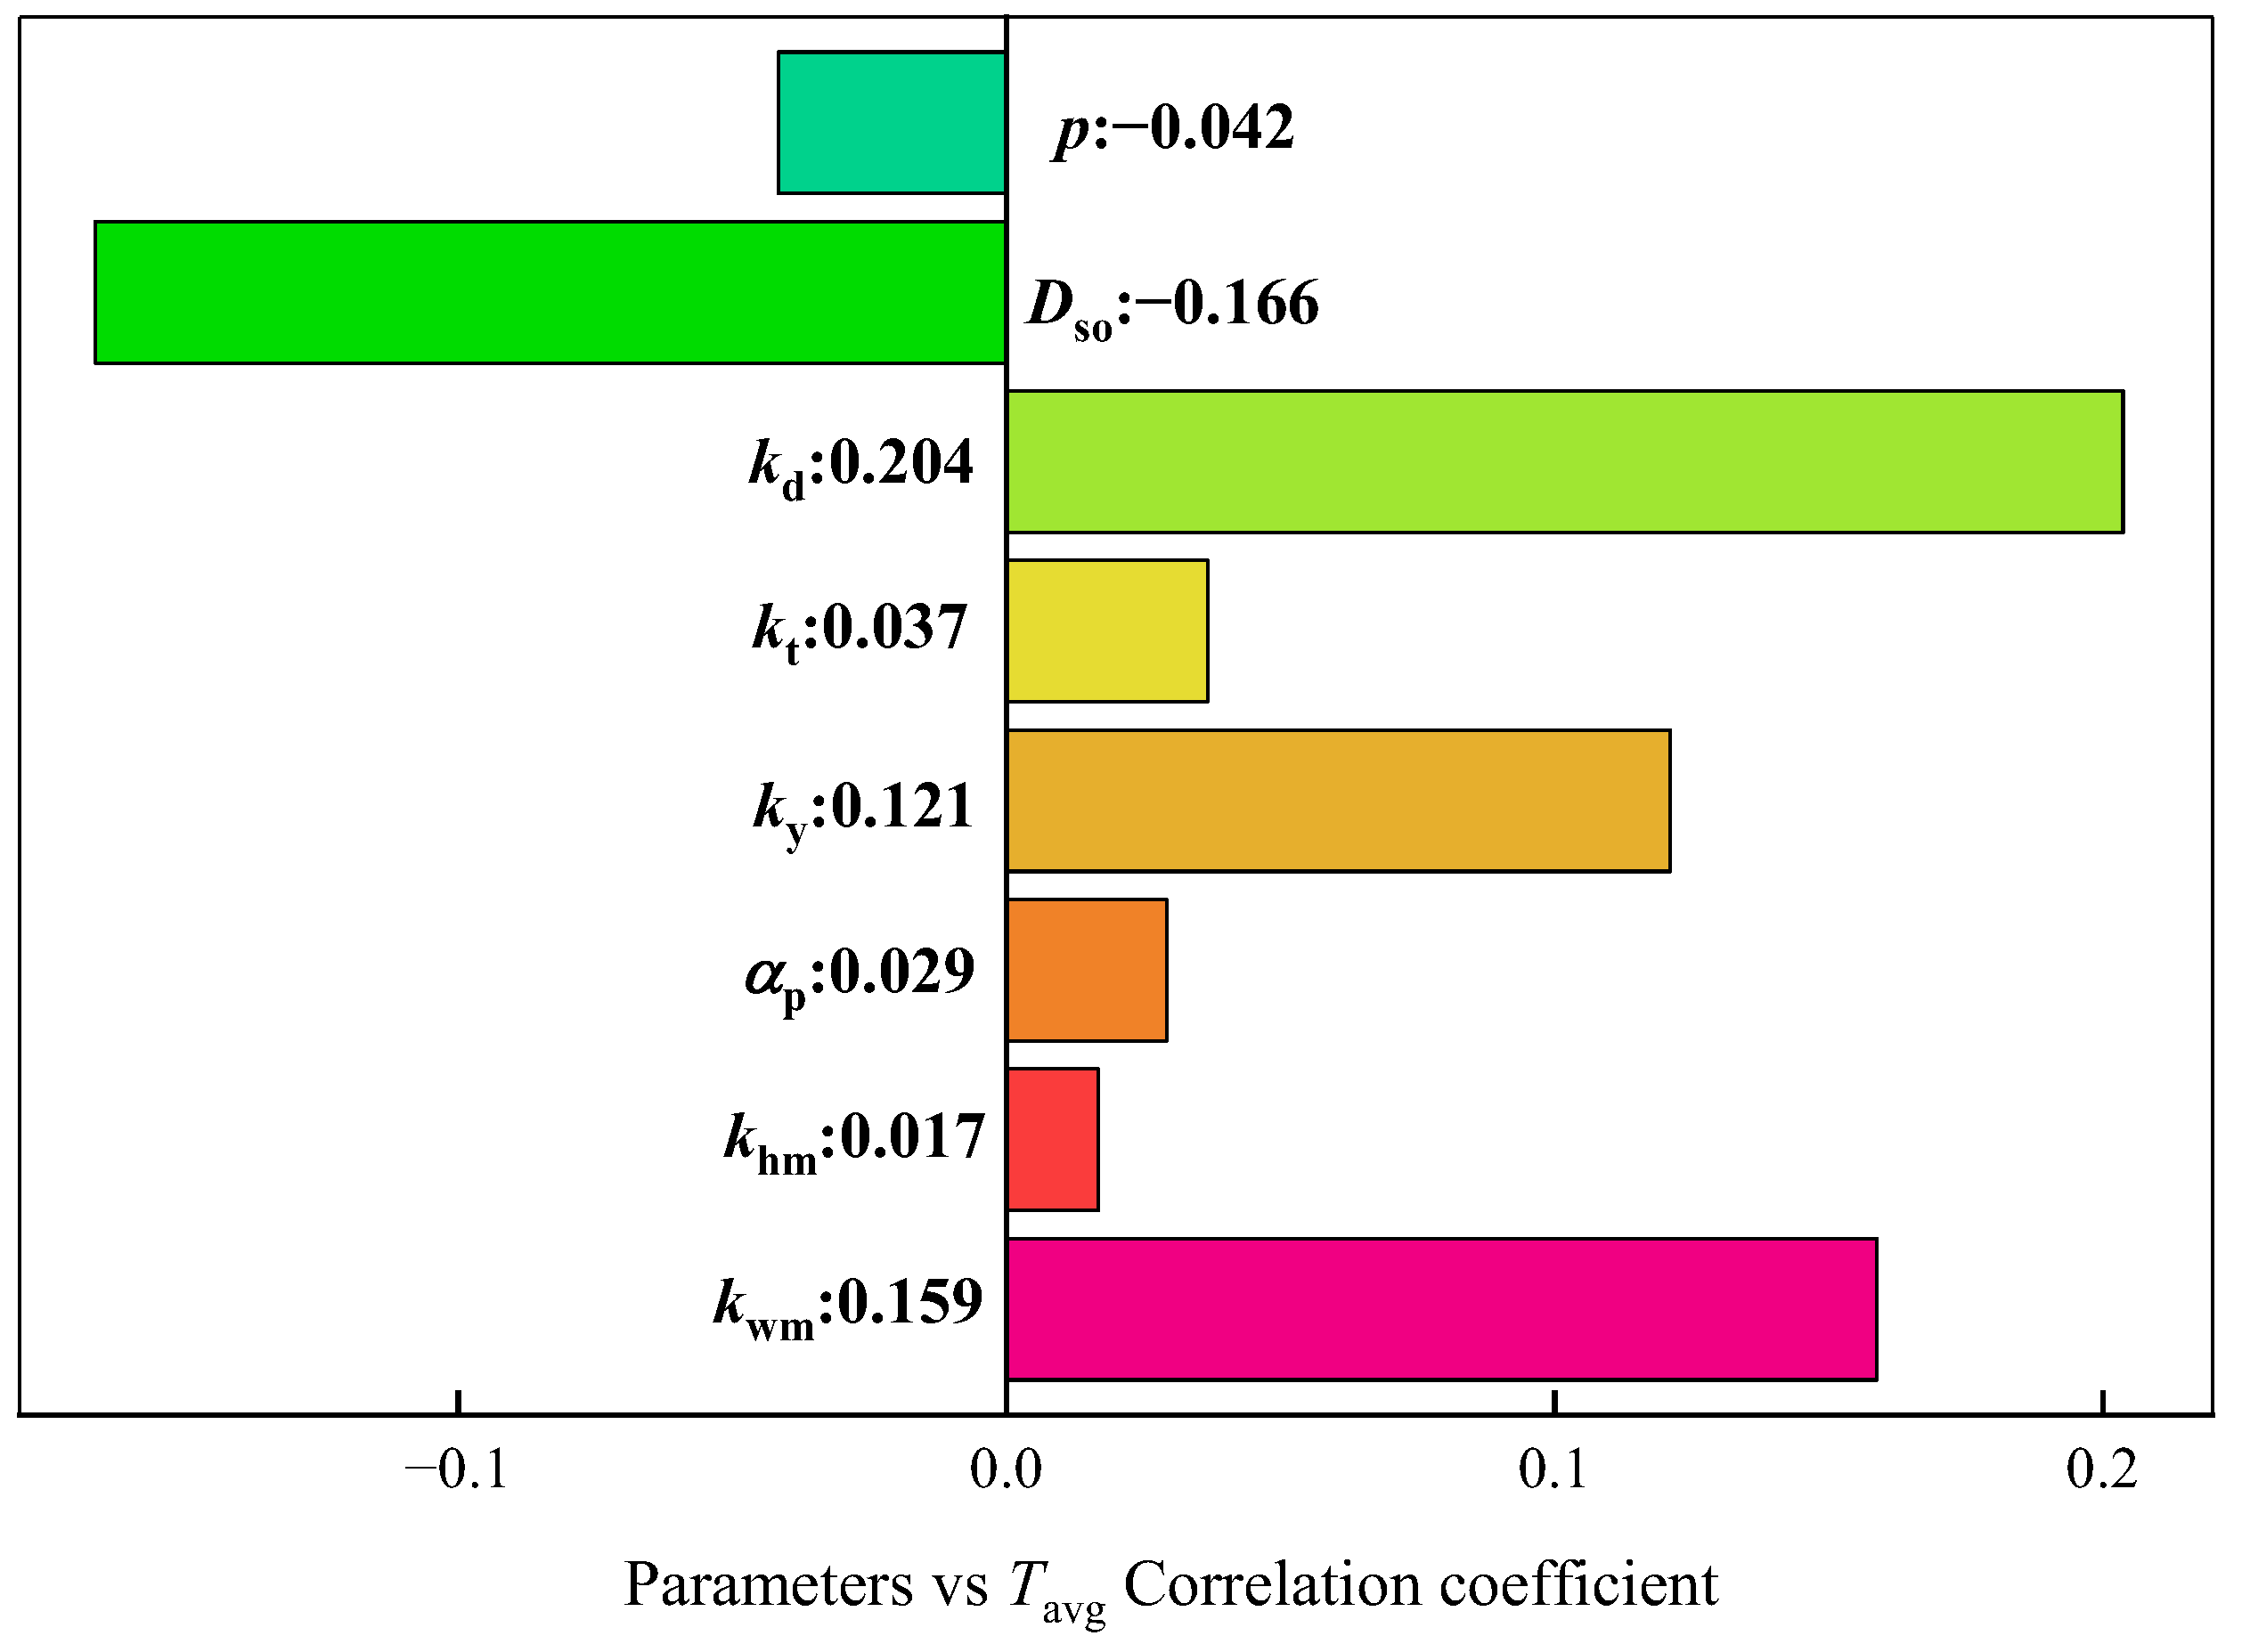
Figure 4 shows the sensitivity between the structure parameters and
Tavg. The plus sign represents a parameter that has a positive influence on the response result, and the minus sign represents a parameter that has a negative influence on the response result. The absolute value of the coefficient represents the strength of the correlation.
The above analysis shows that the absolute correlation coefficients of p, Dso, kd, kt,, and ky are above 0.03 for all response results; they exhibit strong sensitivity to all response outcomes. While αp and khm primarily affect PFe and display lower sensitivity to the other two response results, their influences on PFe and Tavg are in opposite directions. kwm has a greater impact on PFe and Tavg, with the least effect on PCu. It is impossible to accurately obtain three response results at the same time when any design parameter is missing. Therefore, to describe the loss characteristics and output torque characteristics of the motor accurately, all design parameters should participate in the surrogate model construction.
3.3. ANN Training
The BP neural network stands as one of the most prevalent algorithms within ANNs, offering particular advantages in non-linear systems. A BP neural network is used to establish the surrogate model in this paper. A BP neural network comprises one input layer, multiple hidden layers, and one output layer. To introduce the principle of the BP neural network, a simple model is shown in
Figure 5. The simple model has an input layer with three input parameters, a hidden layer with three neurons, and an output layer with two output objectives [
21].
x1~x3 are variables of the input layer; wi11~wi33 represent the weight factors from the input layer to the hidden layer; z12, z22, and z32 represent the weighted input variables of the hidden layer; b12, b23, and b32 are the biases of the hidden layer; a12, a22, and a32 represent the output variables of the hidden layer; wh11~wh32 represent the weight factors from the hidden layer to the output layer; z13 and z23 represent the weighted input variables of the output layer; b13 and b23 are the biases of the output layer; and y1 and y2 are output objectives.
The mathematical relationships of the parameters above are expressed as Equations (5)–(8). The s function is an activation function, as shown in Equation (9).
PFe and
Tavg are trained by BP, respectively, in this paper. Based on the experience and sample data size, the designed BP neural network has one input layer, three hidden layers, and one output layer. The input layer contains all of the variation parameters shown in
Table 2. The first hidden layer has 40 neurons, the second hidden layer has 25 neurons, and the third hidden layer has 20 neurons. Of the samples in
Table 3, 70% were used to train the BP neural network, 15% were used to verify the effectiveness of the BP neural network, and 15% were used to test the BP neural network. Before BP neural network training, the input data and output data were all normalized. The BP neural network was trained in MATLAB R2021a, and Bayesian Regularization was adopted as the training algorithm.
Finally, the mean squared error (MSE) between the results predicted by the trained BP neural network and from the samples of
PFe is 7.3662 × 10
−5, while the MSE between the results predicted by the trained BP neural network and from the samples of
Tavg is 1.8443 × 10
−5. To validate the effectiveness of the trained BP neural network, 10 sets of data from the test set were selected randomly. The
Tavg comparison results between the BP neural network and FEA are shown in
Table 4. The
PFe comparison results between the BP neural network and FEA are shown in
Table 5. The order number in the first column of
Table 4 and
Table 5 is the same as the order number in
Table 3. In
Table 4, all the differences are less than 5%. In
Table 5, all the differences are less than 1%, except for a single point with a difference of 1.57%. From the value of MSE, the overall accuracy of the BP neural network is very high, but there may still be relatively high errors at individual points.
4. Optimization Design
A specific electrical motor design requirement is shown in
Table 6. The variation range of the design parameters and constraint values is presented in
Table 2. The objectives are to optimize the highest efficiency of the electrical motor and achieve the lowest temperature of the armature winding under rated working conditions.
Focusing on the requirements above, the surrogate model trained by BP was used instead of FEA to predict
PFe and
Tavg.
PCu is calculated by Equations (3) and (4). The maximum temperature of armature winding is calculated by the thermal circuit method using MotorCAD based on values of
PFe and
PCu, and the efficiency is calculated using Equations (10) and (11).
n is the speed of the electrical motor.
NSGA-II is used as the multi-objective optimization method in this paper, which is a fast non-dominated sorting procedure, an elitist strategy, a parameterless approach, and a simple yet efficient constraint-handling method [
22]. The objective function is defined by Equations (12) and (13), where
Tw is the temperature of the armature winding.
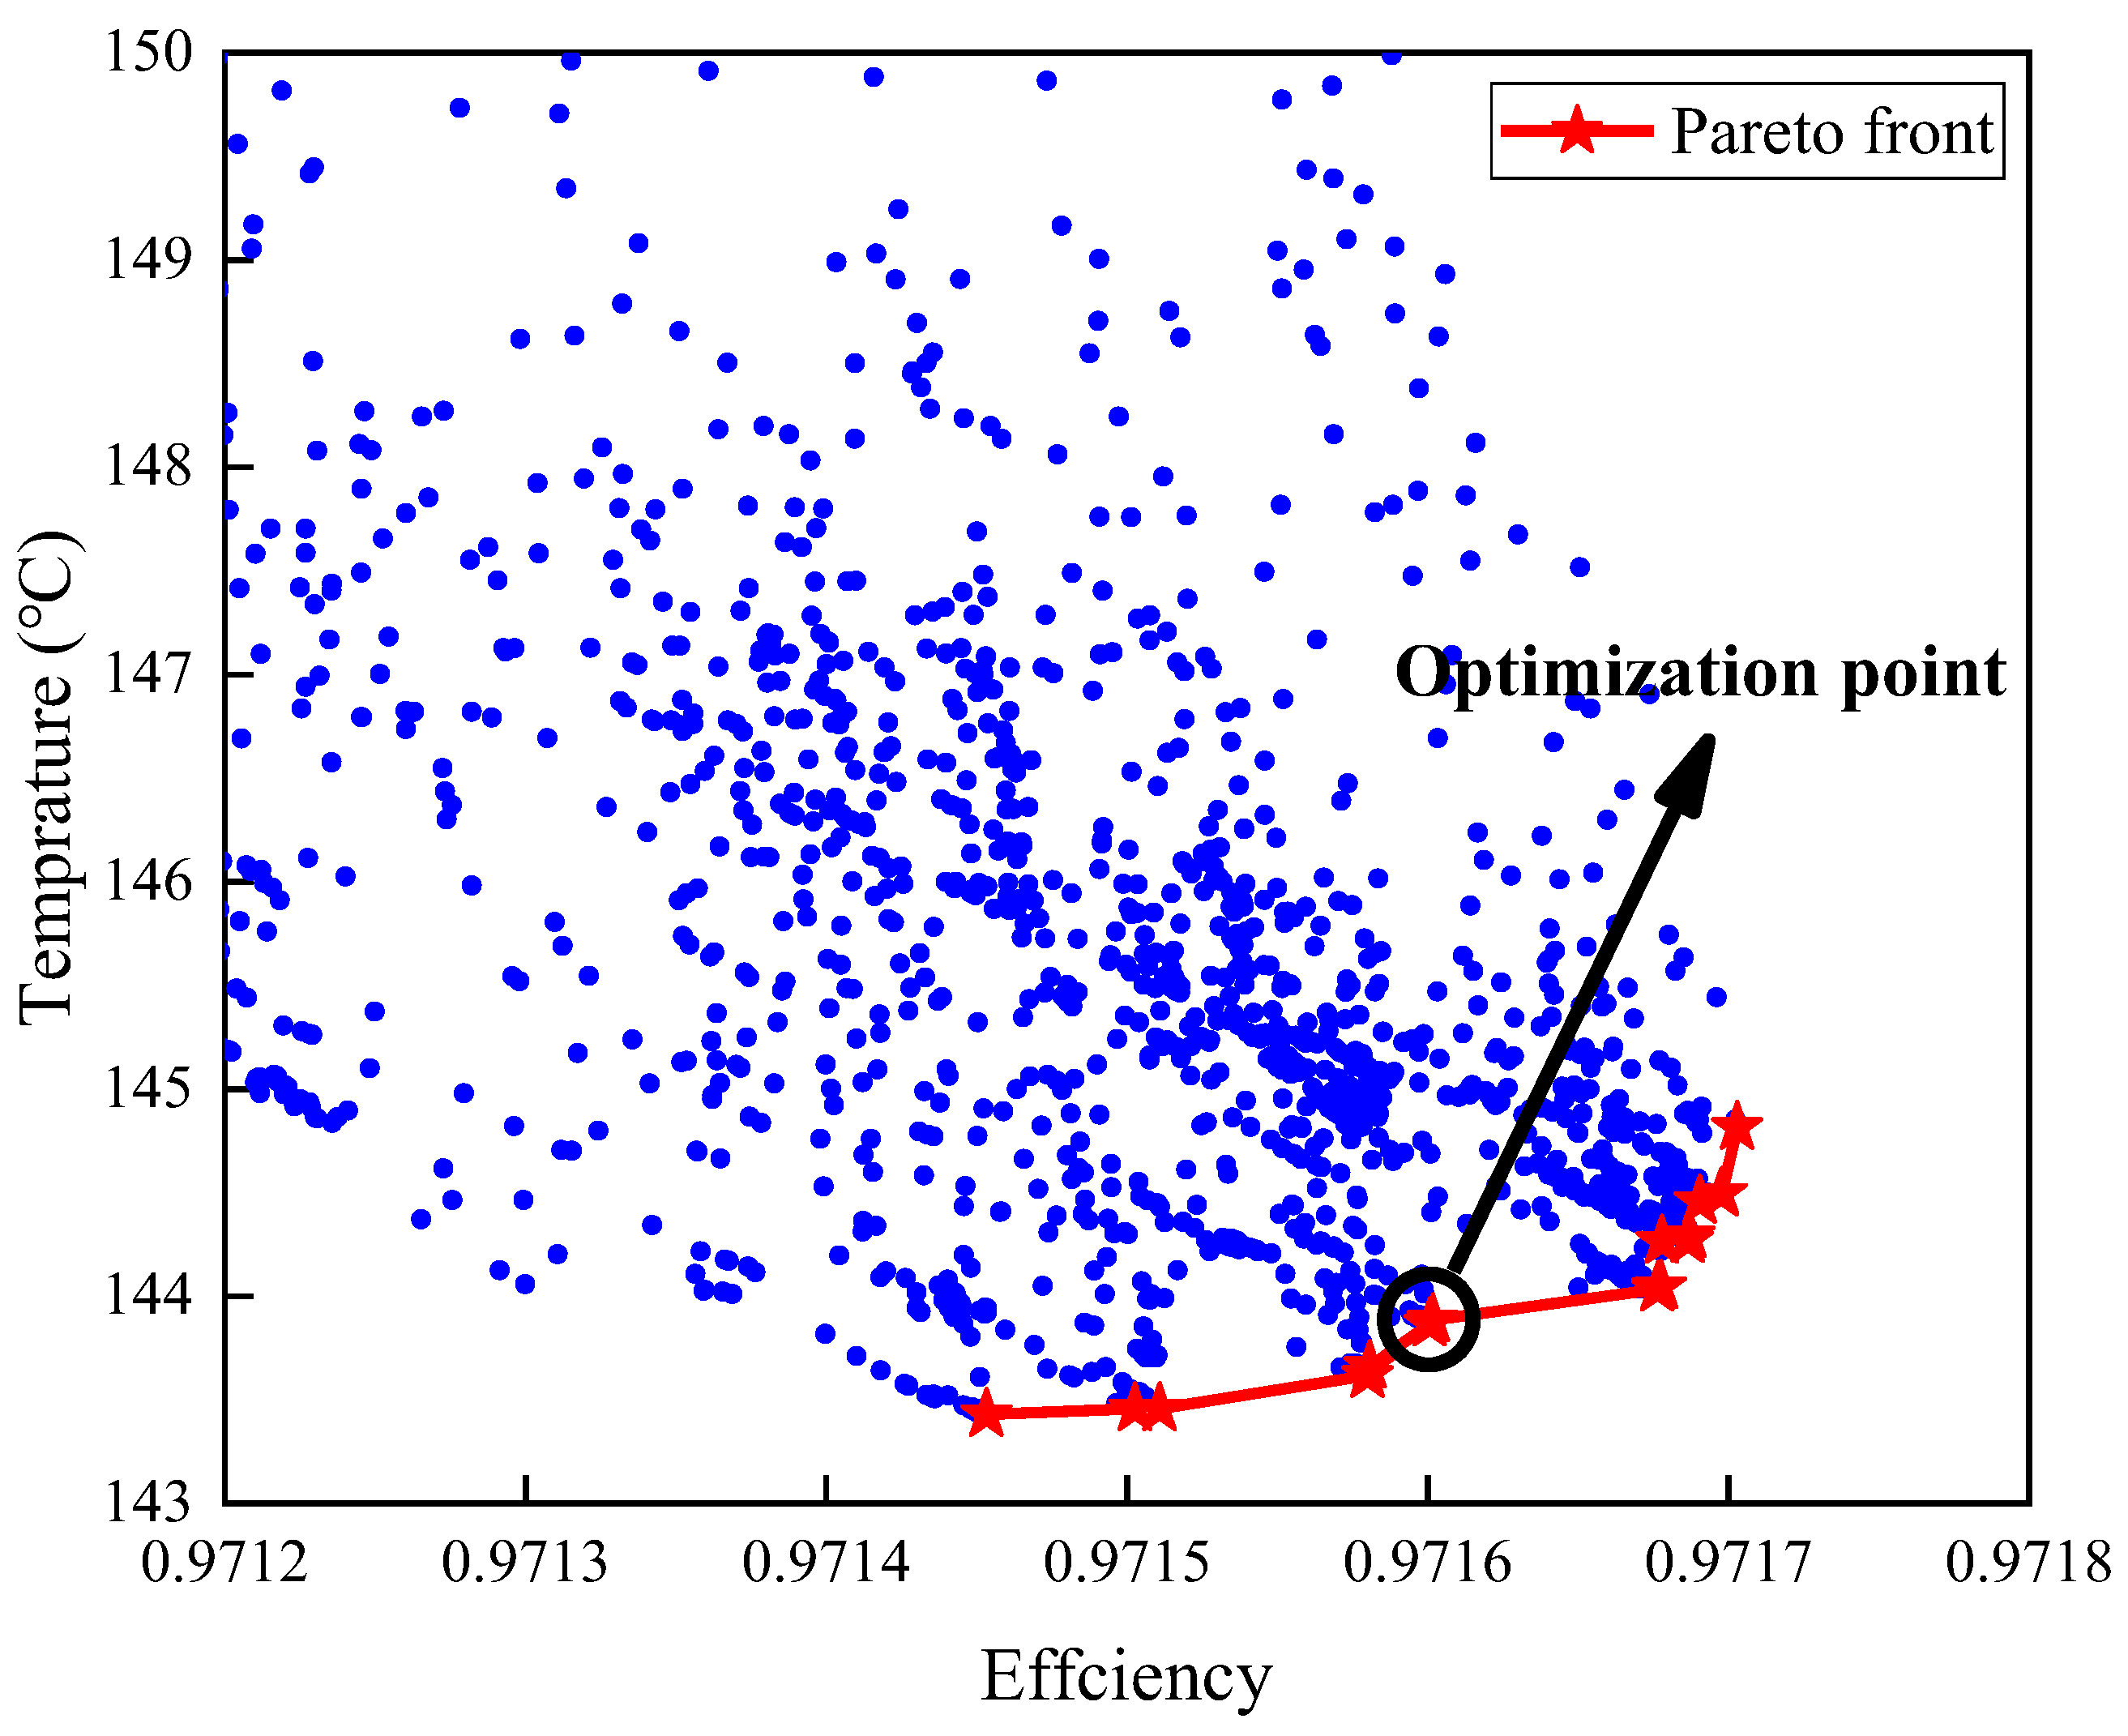
The optimization results are depicted in
Figure 6, where the red line with stars represents the Pareto front. To trade off the efficiency of the electrical motor and temperature of armature winding, the optimal result should be selected from the middle position of the Pareto frontier. The point indicated with the arrow is selected as the final optimization result.
The parameters of the final optimization result point are shown in
Table 7. The results of the surrogate model and FEA are compared in
Table 8.
The parameters of the final optimization result point are determined from the sample data in
Table 3. Although the surrogate model has high accuracy compared with sample data, a difference is inevitable when predicting points using sample data with a surrogate model. The results of the surrogate model for
Tavg and
η are nearly equal to those obtained by FEA, and the difference in
Tw is less than 10%. Thus, the validity of the surrogate model is proven again.
5. Results of Experiment
A prototype of an electrical motor is fabricated according to the optimization results. Photos of the electrical motor are shown in
Figure 7.
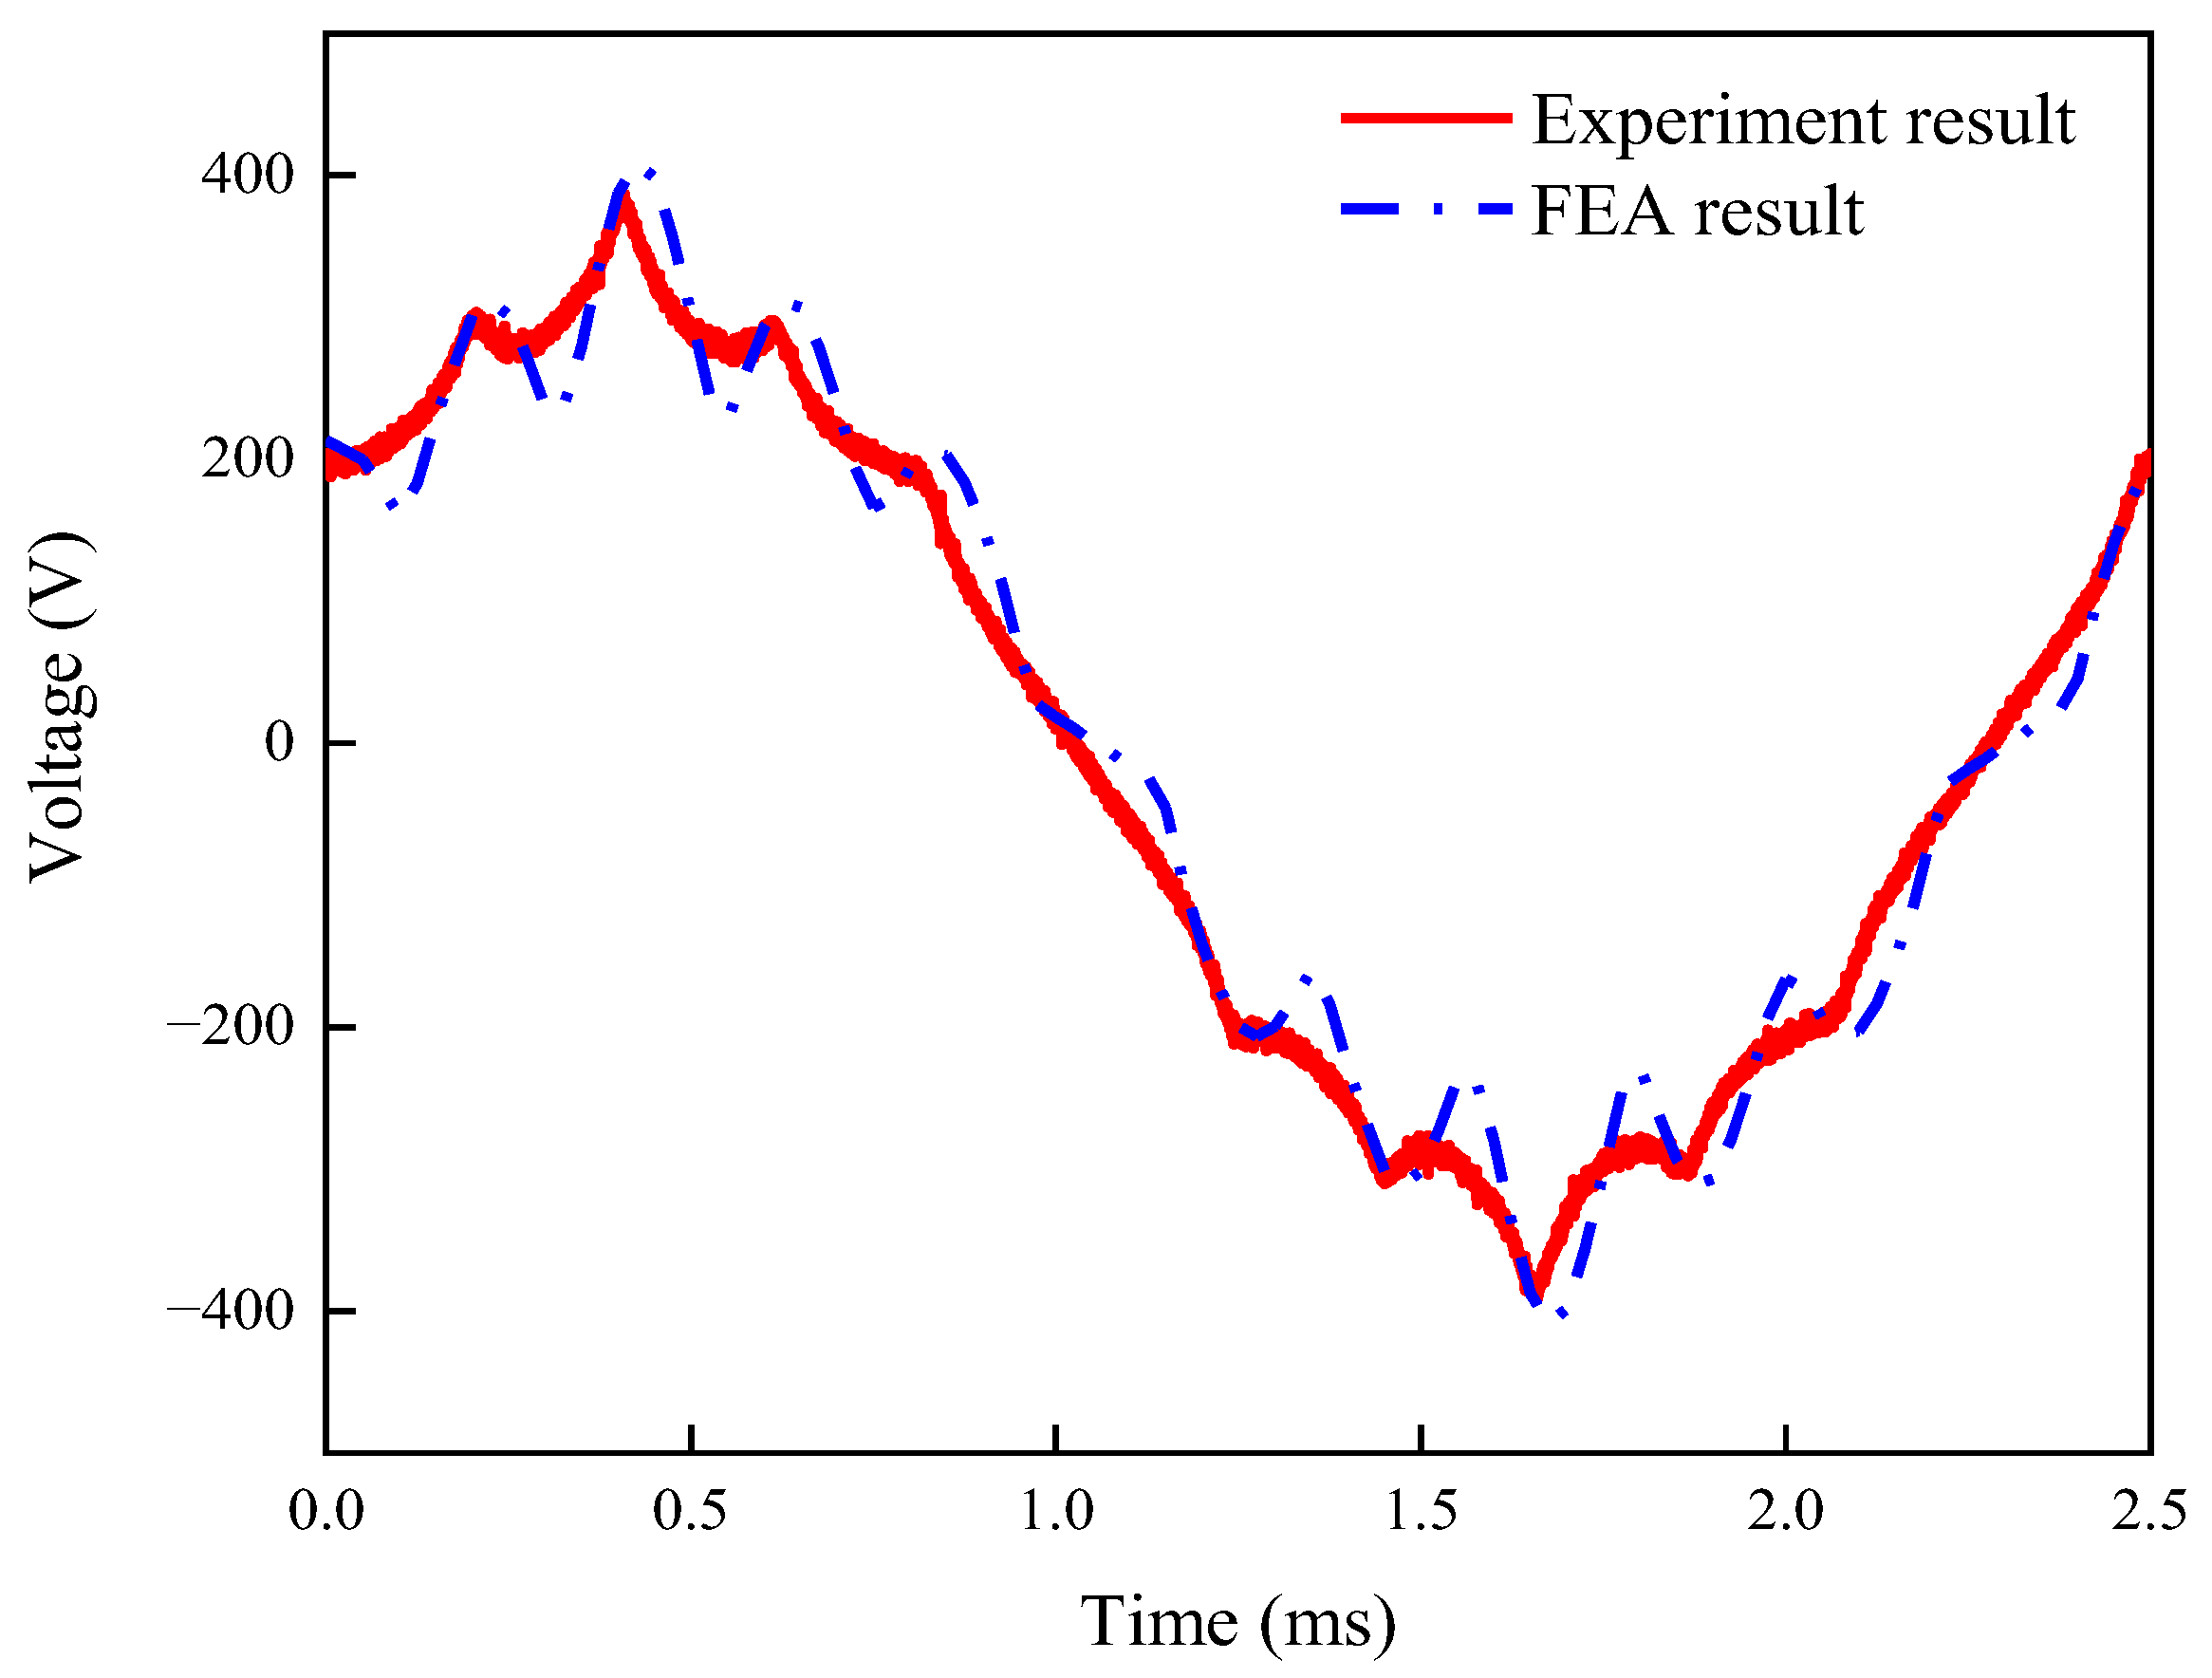
A comparison of no-load back-EMF at 6000 r/min between the experimental and FEA results is shown in
Figure 8. The root-mean-square value (RMS) of the experimental model is 230.29 V, and the RMS of FEA is 229.68 V. The error between them is 0.27%.
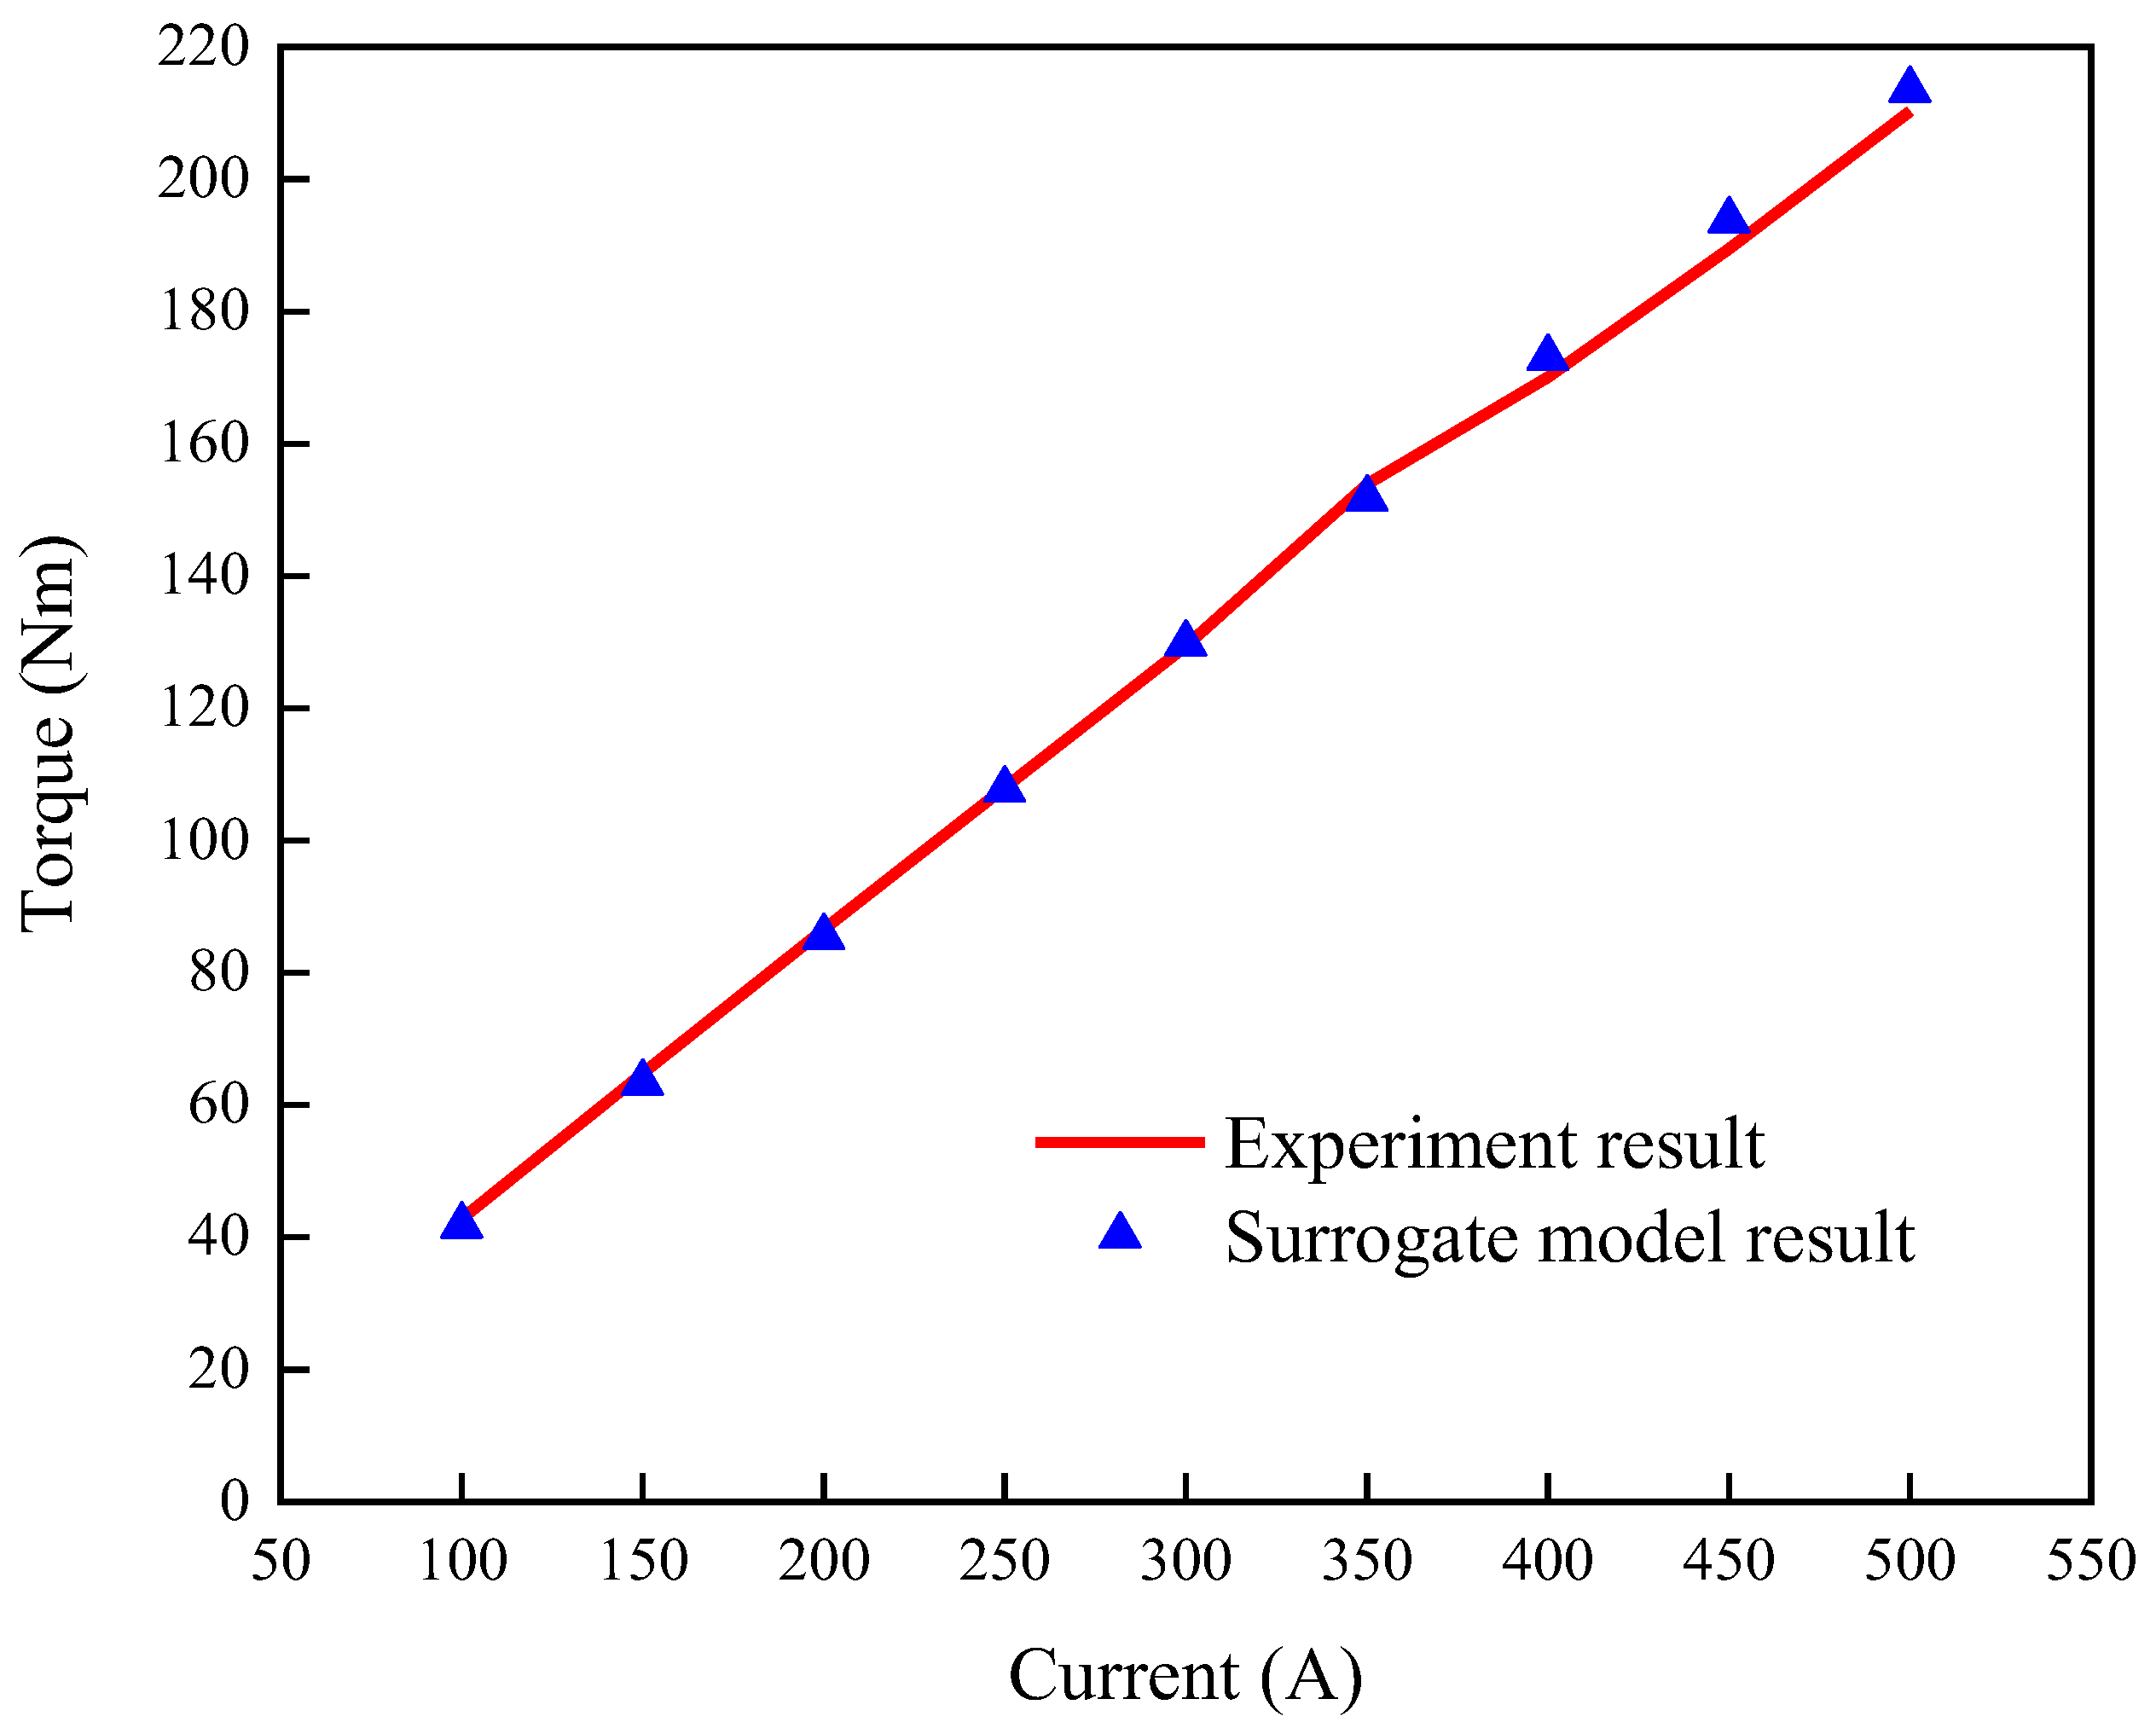
The average torque versus amplitude currents of the experimental and surrogate models are compared in
Figure 9. The rated torque appears at 450 A. The average torque of the experimental model is 189.5 Nm, and the average torque of the surrogate model is 193.8 Nm. The error between them is 2.27%.
Two load tests were conducted. The first test’s load condition was set to 500 r/min, and the amplitude of the phase current was set to 300 A. The thermal test time was set as 1800 s. The three-phase current waveforms are shown in
Figure 10a, and the maximum temperatures of the experiment, acquired by the thermal circuit method using MotorCAD, are compared in
Figure 10b. The temperature curves stabilize around 600 s. The final temperature of the experiment is 60.9 °C, while the temperature calculated by the thermal circuit is 60.0 °C, resulting in an error of 1.5%.
The second test’s load condition was set to 6000 r/min, and the amplitude of the phase current was set as 450 A. The thermal test time was set as 1800 s. The three-phase current waveforms are shown in
Figure 11a, and the maximum temperatures obtained from the experiment and the thermal circuit method using MotorCAD are compared in
Figure 11b. The final temperature of the experiment is 119.2 °C, while the final temperature calculated by the thermal circuit is 116.0 °C, resulting in an error of 2.76%.
Based on the analysis of the existing test results, the simulation results are consistent with the test results. Therefore, it can be inferred that the optimization results are reliable.
6. Conclusions
This paper introduces a multi-objective optimization framework tailored for the demands of V-Shaped IPMSMs, which involves high-dimensional variables. This optimization framework offers robust support for the selection of design parameters during the initial design phase of an electrical motor. The optimization framework is divided into three parts.
The first part involves the establishment of a proportional parametric FEA model for V-Shaped IPMSMs. This parametric model incorporates 10 design parameters, comprising 8 structural design parameters and 2 excitation parameters. The proposed model effectively reduces the likelihood of interference among motor design parameters, thereby enhancing the precision and efficiency of the design process.
The second part involves training a BP neural network as a surrogate model, using results from the DOE to replace the FEA model. When the design parameters are fixed, PCu can be calculated directly; PFe and Tavg can be obtained through FEA. Since PCu, PFe, and Tavg directly reflect the output characteristics of the electrical motor, they are selected as the objectives for the surrogate model, providing greater flexibility in subsequent analyses. Based on the sensitivity analysis, the surrogate model, which incorporates all proposed parameters, accurately describes the loss characteristics and output torque characteristics of the electrical motor. Finally, the MSE between the predictions of the trained BP neural network and the PFe samples is 7.3662 × 10⁻⁵, while the MSE between the predicted results and the Tavg samples is 1.8443 × 10⁻⁵. These results validate the effectiveness and accuracy of the trained BP neural network model.
The third part involves optimization design, specifically addressing a particular electrical motor design requirement. The surrogate model serves as the fitness function, while NSGA-II is employed as the optimization method. The objectives are to maximize η and minimize Tw under rated working conditions. Since η and Tw are indirectly determined by PCu, PFe, and Tavg, these parameters play a critical role in the optimization process. The optimal design parameters have been identified, and the comparison results between the surrogate model and FEA validate the efficacy of the optimization.
After the optimization process, a prototype of the electrical motor was fabricated. The simulation results exhibit strong consistency with the test results, thereby validating the reliability of the optimization outcomes.
Author Contributions
Conceptualization, C.S. and Q.L.; methodology, C.S.; validation, Y.L. and H.L.; formal analysis, Q.L.; investigation, T.F.; resources, Q.L.; data curation, Q.L.; writing—original draft preparation, C.S.; writing—review and editing, C.S.; supervision, X.W.; project administration, Q.L. All authors have read and agreed to the published version of the manuscript.
Funding
This work was supported by National Key R&D Program of China, grant number 2021YFB2500600; Strategic Priority Research Program of Chinese Academy of Sciences, grant number XDA28040100; and Youth Innovation Promotion Association CAS, grant number 2022135.
Data Availability Statement
The original contributions presented in the study are included in the article; further inquiries can be directed to the corresponding author.
Conflicts of Interest
The authors declare no conflicts of interest.
References
- Guidotti, G.; Barri, D.; Soresini, F.; Gobbi, M. Optimal Design of Interior Permanent Magnet Synchronous Motor Considering Various Sources of Uncertainty. World Electr. Veh. J. 2025, 16, 79. [Google Scholar] [CrossRef]
- Guo, S.; Zhao, H.; Wang, Y.; Yin, X.; Qi, H.; Li, P.; Lin, Z. A Design Technique of Traction Motor for Efficiency Improvement Based on Multiobjective Optimization. World Electr. Veh. J. 2021, 12, 260. [Google Scholar] [CrossRef]
- Hwang, M.-H.; Lee, H.-S.; Cha, H.-R. Analysis of Torque Ripple and Cogging Torque Reduction in Electric Vehicle Traction Platform Applying Rotor Notched Design. Energies 2018, 11, 3053. [Google Scholar] [CrossRef]
- Zhang, G.; Yu, W.; Hua, W.; Cao, R.; Qiu, H.; Guo, A. The Design and Optimization of an Interior, Permanent Magnet Synchronous Machine Applied in an Electric Traction Vehicle Requiring a Low Torque Ripple. Appl. Sci. 2019, 9, 3634. [Google Scholar] [CrossRef]
- Watanabe, K.; Suga, T.; Kitabatake, S. Topology Optimization Based on the ON/OFF Method for Synchronous Motor. IEEE Trans. Magn. 2018, 54, 7201104. [Google Scholar] [CrossRef]
- Yamazaki, K.; Kato, Y. Optimization of High-Speed Motors Considering Centrifugal Force and Core Loss Using Combination of Stress and Electromagnetic Field Analyses. IEEE Trans. Magn. 2013, 49, 2181–2184. [Google Scholar] [CrossRef]
- Xu, J.; Zhang, L.; Meng, D.; Su, H. Simulation. Verification and Optimization Design of Electromagnetic Vibration and Noise of Permanent Magnet Synchronous Motor for Vehicle. Energies 2022, 15, 5808. [Google Scholar] [CrossRef]
- Li, X.; Zhang, L.; Ying, H.; Huang, S.; Zhang, Q. Study of suppression of vibration and noise of PMSM for electric vehicles. IET Electr. Power Appl. 2020, 14, 1274–1282. [Google Scholar] [CrossRef]
- Cui, J.; Xiao, W.; Zou, W.; Liu, S.; Liu, Q. Design optimisation of submersible permanent magnet synchronous motor by combined DOE and Taguchi approach. IET Electr. Power Appl. 2020, 14, 1060–1066. [Google Scholar] [CrossRef]
- Lv, P.; Ma, H.; Su, X.; Xu, D.; Liu, Z.; Liu, L. Multi-objective optimization of permanent magnet motor based on Improved Salp Swarm Algorithm and Spearman correlation. Int. J. Appl. Electromagn. Mech. 2024, 75, 459–477. [Google Scholar] [CrossRef]
- Yu, Y.; Zhao, P.; Hao, Y.; Zeng, D.; Hu, Y.; Zhang, B.; Yang, H. Multi Objective Optimization of Permanent Magnet Synchronous Motor Based on Taguchi Method and PSO Algorithm. Energies 2023, 16, 267. [Google Scholar] [CrossRef]
- Wang, X.; Fan, Y.; Yang, C.; Wu, Z.; Lee, C.H.T. Multi-Objective Optimization Framework of a Radial-Axial Hybrid Excitation Machine for Electric Vehicles. IEEE Trans. Veh. Technol. 2023, 72, 1638–1648. [Google Scholar] [CrossRef]
- Liu, H.; Song, T.; Zhang, Z.; Du, J. Optimization of vibration and noise performance of permanent magnet synchronous motor for electric vehicles. Trans. Nanjing Univ. Aeronaut. Astronaut. 2020, 37, 332–342. [Google Scholar]
- Min, S.G. A Design Technique for Shaping of Back-EMF Using Heuristic Optimization and Winding Factors in Brushless AC and DC Machines. Electr. Power Compon. Syst. 2020, 48, 944–956. [Google Scholar] [CrossRef]
- Kim, K.C.; Lee, J.; Kim, H.J.; Koo, D.H. Multiobjective Optimal Design for Interior Permanent Magnet Synchronous Motor. IEEE Trans. Magn. 2009, 45, 1780–1783. [Google Scholar]
- Ding, L.; Liu, G.; Chen, Q.; Xu, G. A Novel Mesh-Based Equivalent Magnetic Network for Performance Analysis and Optimal Design of Permanent Magnet Machines. IEEE Trans. Energy Convers. 2019, 34, 1337–1346. [Google Scholar] [CrossRef]
- Xu, G.; Jia, Z.; Zhao, W.; Chen, Q.; Liu, G. Multi-objective Optimization Design of Inset-surface Permanent Magnet Machine Considering Deterministic and Robust Performances. Chin. J. Electr. Eng. 2021, 7, 73–87. [Google Scholar] [CrossRef]
- Im, S.Y.; Lee, S.G.; Kim, D.M.; Xu, G.; Shin, S.Y.; Lim, M.S. Kriging Surrogate Model-Based Design of an Ultra-High-Speed Surface-Mounted Permanent-Magnet Synchronous Motor Considering Stator Iron Loss and Rotor Eddy Current Loss. IEEE Trans. Magn. 2022, 58, 8101405. [Google Scholar] [CrossRef]
- Ashabani, M.; Mohamed, Y.A.-R.I.; Milimonfared, J. Optimum Design of Tubular Permanent-Magnet Motors for Thrust Characteristics Improvement by Combined Taguchi–Neural Network Approach. IEEE Trans. Magn. 2010, 46, 4092–4100. [Google Scholar] [CrossRef]
- Xie, B.; Zhang, Y.; Xu, Z.; Zhang, F.; Liu, W. Review on Multidisciplinary Optimization Key Technology of Electrical Machine Based on Surrogate Models. Trans. China Electrotech. Soc. 2022, 37, 5117–5143. [Google Scholar]
- Sun, C.; Li, Q.; Fan, T.; Wen, X.; Li, Y. Multi-objective Optimization Design of External Rotor Permanent Magnet Machine for In-wheel Applications. In Proceedings of the 2023 24th International Conference on the Computation of Electromagnetic Fields (COMPUMAG), Kyoto, Japan, 22–26 May 2023. [Google Scholar]
- Deb, K.; Pratap, A.; Agarwal, S.; Meyarivan, T. A fast and elitist multiobjective genetic algorithm: NSGA-II. IEEE Trans. Evol. Comput. 2002, 6, 182–197. [Google Scholar] [CrossRef]
| Disclaimer/Publisher’s Note: The statements, opinions and data contained in all publications are solely those of the individual author(s) and contributor(s) and not of MDPI and/or the editor(s). MDPI and/or the editor(s) disclaim responsibility for any injury to people or property resulting from any ideas, methods, instructions or products referred to in the content. |
© 2025 by the authors. Published by MDPI on behalf of the World Electric Vehicle Association. Licensee MDPI, Basel, Switzerland. This article is an open access article distributed under the terms and conditions of the Creative Commons Attribution (CC BY) license (https://creativecommons.org/licenses/by/4.0/).


