Article

The Study of Waste Heat Recovery of the Thermal Management System of Electric Vehicle Based on Simulation and Experimental Analyses

1
College of Vehicle and Traffic Engineering, Henan University of Science and Technology, Luoyang 471003, China
2
National Joint Engineering Research Center for Abrasion Control and Molding of Metal Materials, Henan University of Science & Technology, Luoyang 471003, China
*
Authors to whom correspondence should be addressed.
World Electr. Veh. J. 2025, 16(6), 298; https://doi.org/10.3390/wevj16060298
Submission received: 4 April 2025 / Revised: 27 May 2025 / Accepted: 27 May 2025 / Published: 28 May 2025
(This article belongs to the Special Issue Thermal Management System for Battery Electric Vehicle)

Abstract

:
In this study, in order to overcome the limitations of existing electric vehicle (EV) thermal management systems (TMS), a highly integrated and coordinated operation strategy for EV thermal management was proposed. Specifically, an integrated architecture with a 10-way valve was established to replace traditional 3-way and 4-way valves to enhance the coupling between coolant circuits. Six operating modes were realized via the switching function of the 10-way valve, including the mode of waste heat recovery. A highly integrated TMS model was developed on the AMEsim2304 platform, followed by parameter matching. The accuracy of the model was validated through comparative analysis with laboratory and environmental chamber test results. Based on the designed highly integrated TMS, a classical fuzzy Proportional-Integral-Derivative Control (PID) control strategy was introduced to regulate the coolant circulation pump. Simulation analyses and experimental results demonstrated that the optimized system could reduce the battery pack heating time by approximately 300 s compared to the pre-optimized configuration. Moreover, the waste heat recovery could improve the cabin heating rate from 1.9 °C/min to 3.4 °C/min, representing a 43.7% enhancement. Furthermore, the output power of the high-pressure liquid heater remained low, resulting in a 10% reduction in overall heating energy consumption. Based on simulation and experimental analyses, this research can promote the progress of thermal management system technology for electric vehicles to a certain extent.

1. Introduction

Electric vehicles (EV) can offer significant advantages, including zero emissions, high energy efficiency, and low noise levels, positioning them as one of the most promising solutions in the field of EV [1,2]. The thermal management system (TMS) is a critical component of EVs to determine vehicle range, safety, and reliability [3,4,5]. This system must simultaneously regulate the temperatures of various subsystems, including the battery, motor, electronic control unit, and cabin. Reference [6] analyzed thermal runaway and heat generation mechanisms in lithium-ion batteries at low temperatures, highlighting the need for accurate thermal modeling. The study identified major gaps between current Battery Thermal Management System (BTM) strategies and practical applications, calling for optimized or novel approaches to improve temperature uniformity, extend battery life, and enhance safety in large-scale battery packs. Reference [7] proposed a hybrid active-passive BTM system using nano-enhanced phase change materials (NePCM) composed of graphite nanopowder and highly oriented pyrolytic graphite. Through experimental and coupled electrochemical-thermal modeling, the study demonstrated that enhancing thermal conductivity is essential for restoring PCM heat storage capacity, offering a promising solution for improving module-level thermal control. Reference [8] developed a method for energy distribution based on vehicle aerodynamics and motor characteristics, achieving extended driving range by reducing thermal parasitic losses. The proposed strategy improved range by 24.2% in summer and 18.6% in winter by repurposing thermal savings. Reference [9] reviewed energy management systems (EMS), thermal management systems (TMS), and integrated energy-thermal management systems (IETMS), recommending joint energy-thermal optimization strategies for improved system performance. Reference [10] summarized recent cooling technologies for electric motor thermal management, including high-conductivity insulation materials, spray cooling, advanced fluids, and combined air-liquid convection systems aimed at loss reduction and heat dissipation enhancement. Reference [11] observed growing attention to improving thermal efficiency at both component and vehicle levels. However, further innovation is needed to reduce cabin heat loads in hot climates and improve heating system performance in cold environments. Reference [12] reviewed recent advances in vehicle thermal management and modeling, focusing on cabins, electronics, and external components. Topics included High Voltage Coolant Heater (HVAC) optimization, smart glazing, surface treatments, and both active and passive cooling for electronics using heat pipes, heat sinks, jet impingement, and PCM. Despite progress, significant challenges remain, and further research is needed to address system integration and performance trade-offs.
Given the differing optimal operating temperatures of each subsystem, effective energy distribution and heat flow management are essential, leading to a complex system architecture and control challenges [13,14]. Power battery lifespan and performance are particularly sensitive to temperature variations, adding another layer of complexity to the research [15,16]. Furthermore, the absence of engine waste heat recovery in EVs results in a range achievement rate of less than 50% under extremely low-temperature conditions [17,18]. Thus, there is a pressing need to achieve a high degree of system integration and coordinated operation to optimize overall performance and energy efficiency, dynamically adapt to driving conditions, and minimize energy consumption while maintaining thermal comfort. This approach will enhance the vehicle’s range [19,20]. However, in the traditional thermal management architecture, subsystems such as batteries, motor control systems, and air conditioners lack a collaborative mechanism, resulting in energy efficiency losses and system redundancy issues, significantly increasing the overall cost. The repetitive layout of pipelines and the stacking of components, brought about by the decentralized design, not only occupy cabin space but also increase the weight of the vehicle body and cause additional energy loss. As electric vehicles develop towards high power density and intelligence, an integrated architecture has become an inevitable choice to balance the demands of efficient heat dissipation, lightweight design, and driving and riding comfort.
This study addresses the limitations of existing electric vehicle thermal management systems by investigating the system integration design and control logic optimization for a specific pure electric vehicle model. The study proposes the use of a 10-way valve to replace traditional 3-way and 4-way valves, achieving a higher degree of coupling among the coolant circuits. By utilizing the switching functionality of the 10-way valve, six operating modes, including a waste heat recovery mode, are realized. An integrated TMS architecture simulation model is then developed using the AMEsim2304 platform. The model is parameterized based on real-world vehicle data, and its reliability is validated through comparisons with laboratory and environmental chamber test results. Additionally, a fuzzy PID control strategy for the coolant circulation pump is designed within the established model. Simulations under specific low-temperature conditions, using the China Light-Duty Vehicle Test Cycle (CLTC) [21], are performed to assess the performance improvements of the system, facilitated by the waste heat recovery mode and the optimized control strategy.

2. System Integration and Simulation Model Development

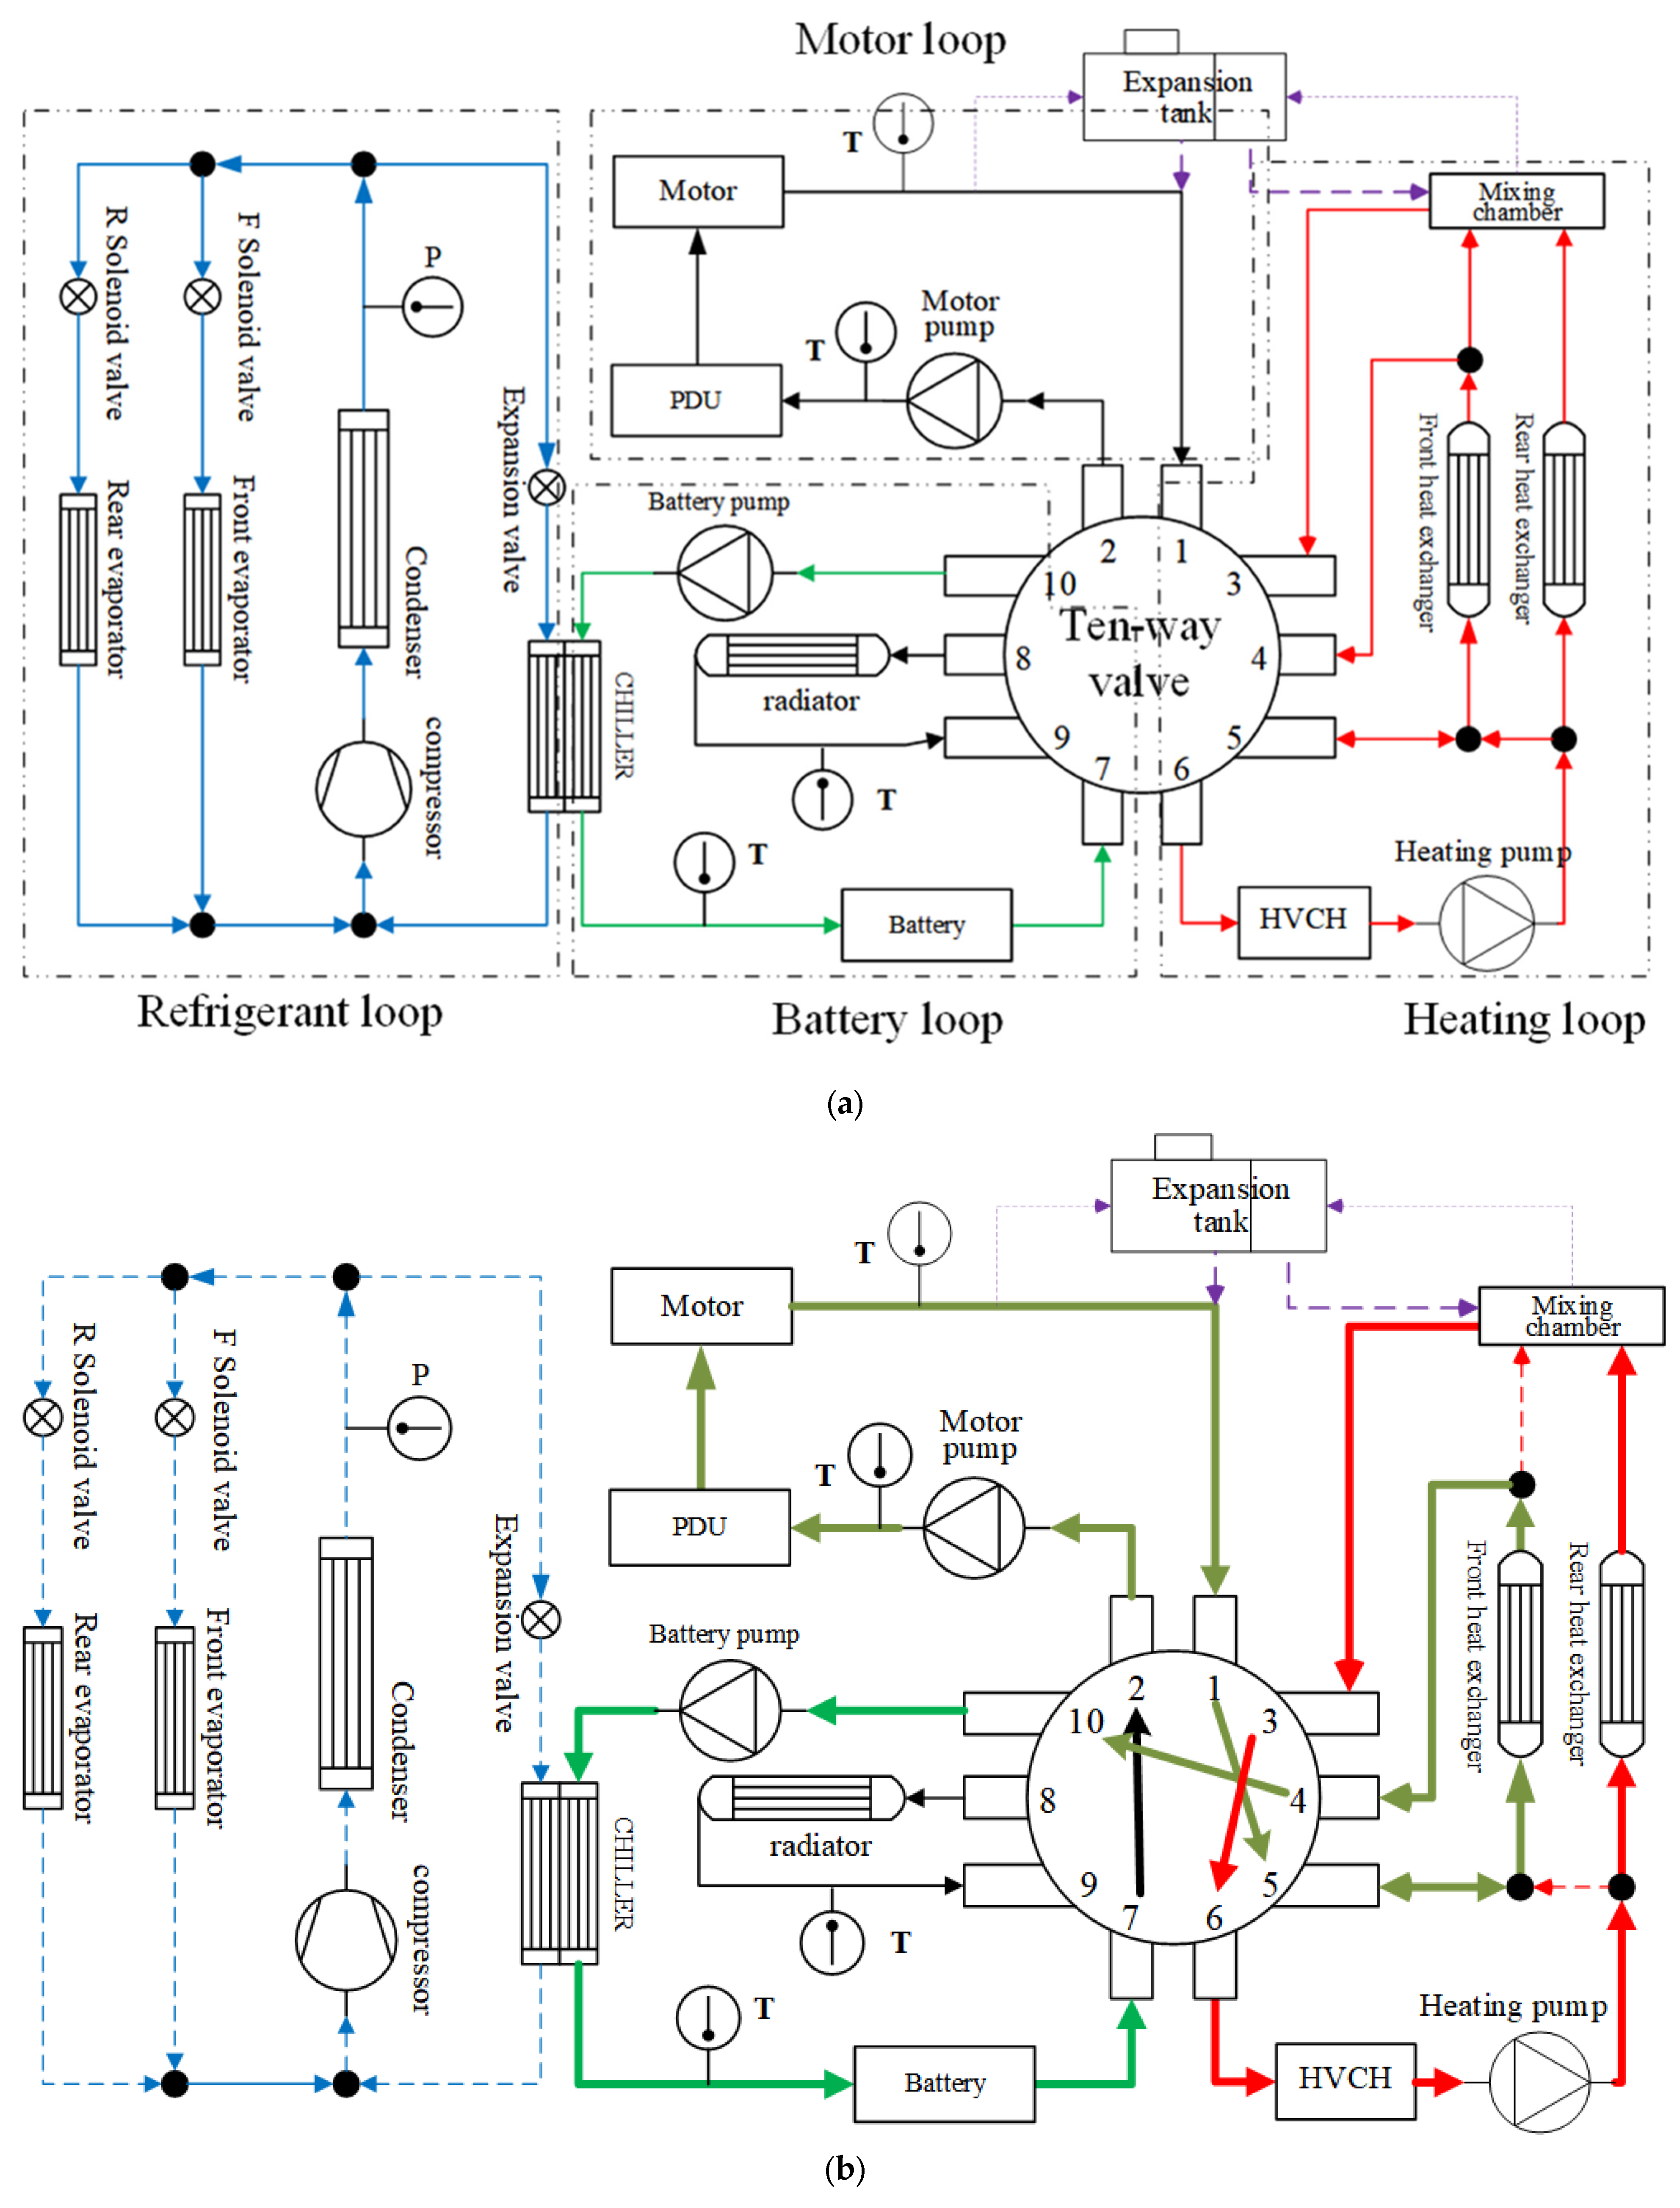
2.1. System Architecture Integration

The most commonly used thermal management system in electric vehicles consists of two primary circuits: a refrigerant-based circuit (refrigerant side) and a coolant-based circuit (water side). The refrigerant side typically functions as the air conditioning cooling system, while the water side is responsible for regulating battery temperature, cooling the motor and electronic control unit, and providing heating for the cabin. The system-specific configuration is given in Figure 1.
Traditional decentralized thermal management systems rely on numerous 3-way and 4-way valves to switch between coolant circuits. It results in relatively independent circuits, an excessive number of system components, complex control logic, low thermal efficiency, and an increased risk of leakage. To enhance energy efficiency, simplify the system structure, reduce weight and costs, improve system reliability, and increase the intelligence and flexibility of the control system, this study proposes replacing the traditional 3-way and 4-way valves, as well as plate heat exchangers, with an integrated multi-way valve. The 10-way valve enables high system integration without altering the original functionalities, allowing for the use of a single expansion tank to replace the two tanks typically found in the traditional motor and battery circuits. After using the integrated module, the number of water-side pipelines in the thermal management system has been reduced from 23 to 10. It is estimated that the cost of components will be saved by 15.6% and the installation working hours by 60%. The architecture of the thermal management system utilizing this integrated approach is illustrated in Figure 2a. The 10-way valve features ten ports, which are connected to the radiator, the battery coolant circuit, the motor and electronic control unit coolant circuit, and the heating circuit. The valve core has six operating positions, each corresponding to one of six working modes of TMS: active battery cooling, passive battery cooling, waste heat recovery, defrosting, passive battery heating, and active battery heating. Operational status of the system under different modes:
Mode 1—Battery Active Cooling
Configuration: Motor/controller coolant circuit and battery circuit operate in parallel.
Cooling Strategy: The Air conditioning refrigeration system cools the battery coolant via the chiller. Motor/controller coolant is cooled by the radiator.
Mode 2—Battery Passive Cooling
Configuration: Motor/controller and battery coolant circuits operate in series.
Cooling Strategy: Both circuits share the radiator for coolant cooling.
Mode 3—Waste Heat Recovery
Configuration: Motor/controller and battery coolant circuits operate in series.
Function: Recovers waste heat from the motor/controller for low-temperature battery heating. Transfers residual heat to the front cabin heater, while the rear cabin heater operates independently via the High Voltage Coolant Heater (HVCH).
Mode 4—Defrosting
Configuration: Motor/controller and battery coolant circuits operate in series.
Function: Utilizes motor/controller waste heat to warm the battery during driving. The front cabin heater operates independently via the HVCH.
Mode 5—Battery Passive Heating
Configuration: Motor/controller and battery coolant circuits operate in series.
Function: Maintains battery temperature via motor/controller waste heat during driving. Front/rear cabin heaters are jointly heated by the HVCH.
Mode 6—Battery Active Heating
Configuration: Battery and cabin heating systems operate in series.
Function: Heats coolant via the HVCH to simultaneously warm the battery and cabin. Designed for low-temperature battery preheating during charging.
In waste heat recovery mode, the 10-way valve connects the electric drive circuit in series with both the battery and heating circuits. By transferring heat generated during the operation of the electric drive system, the mode utilizes the waste heat to heat both the power battery and the passenger cabin, thereby enabling the recovery and utilization of waste heat. The heat flow in the waste heat recovery mode is shown by the solid line in Figure 2b.

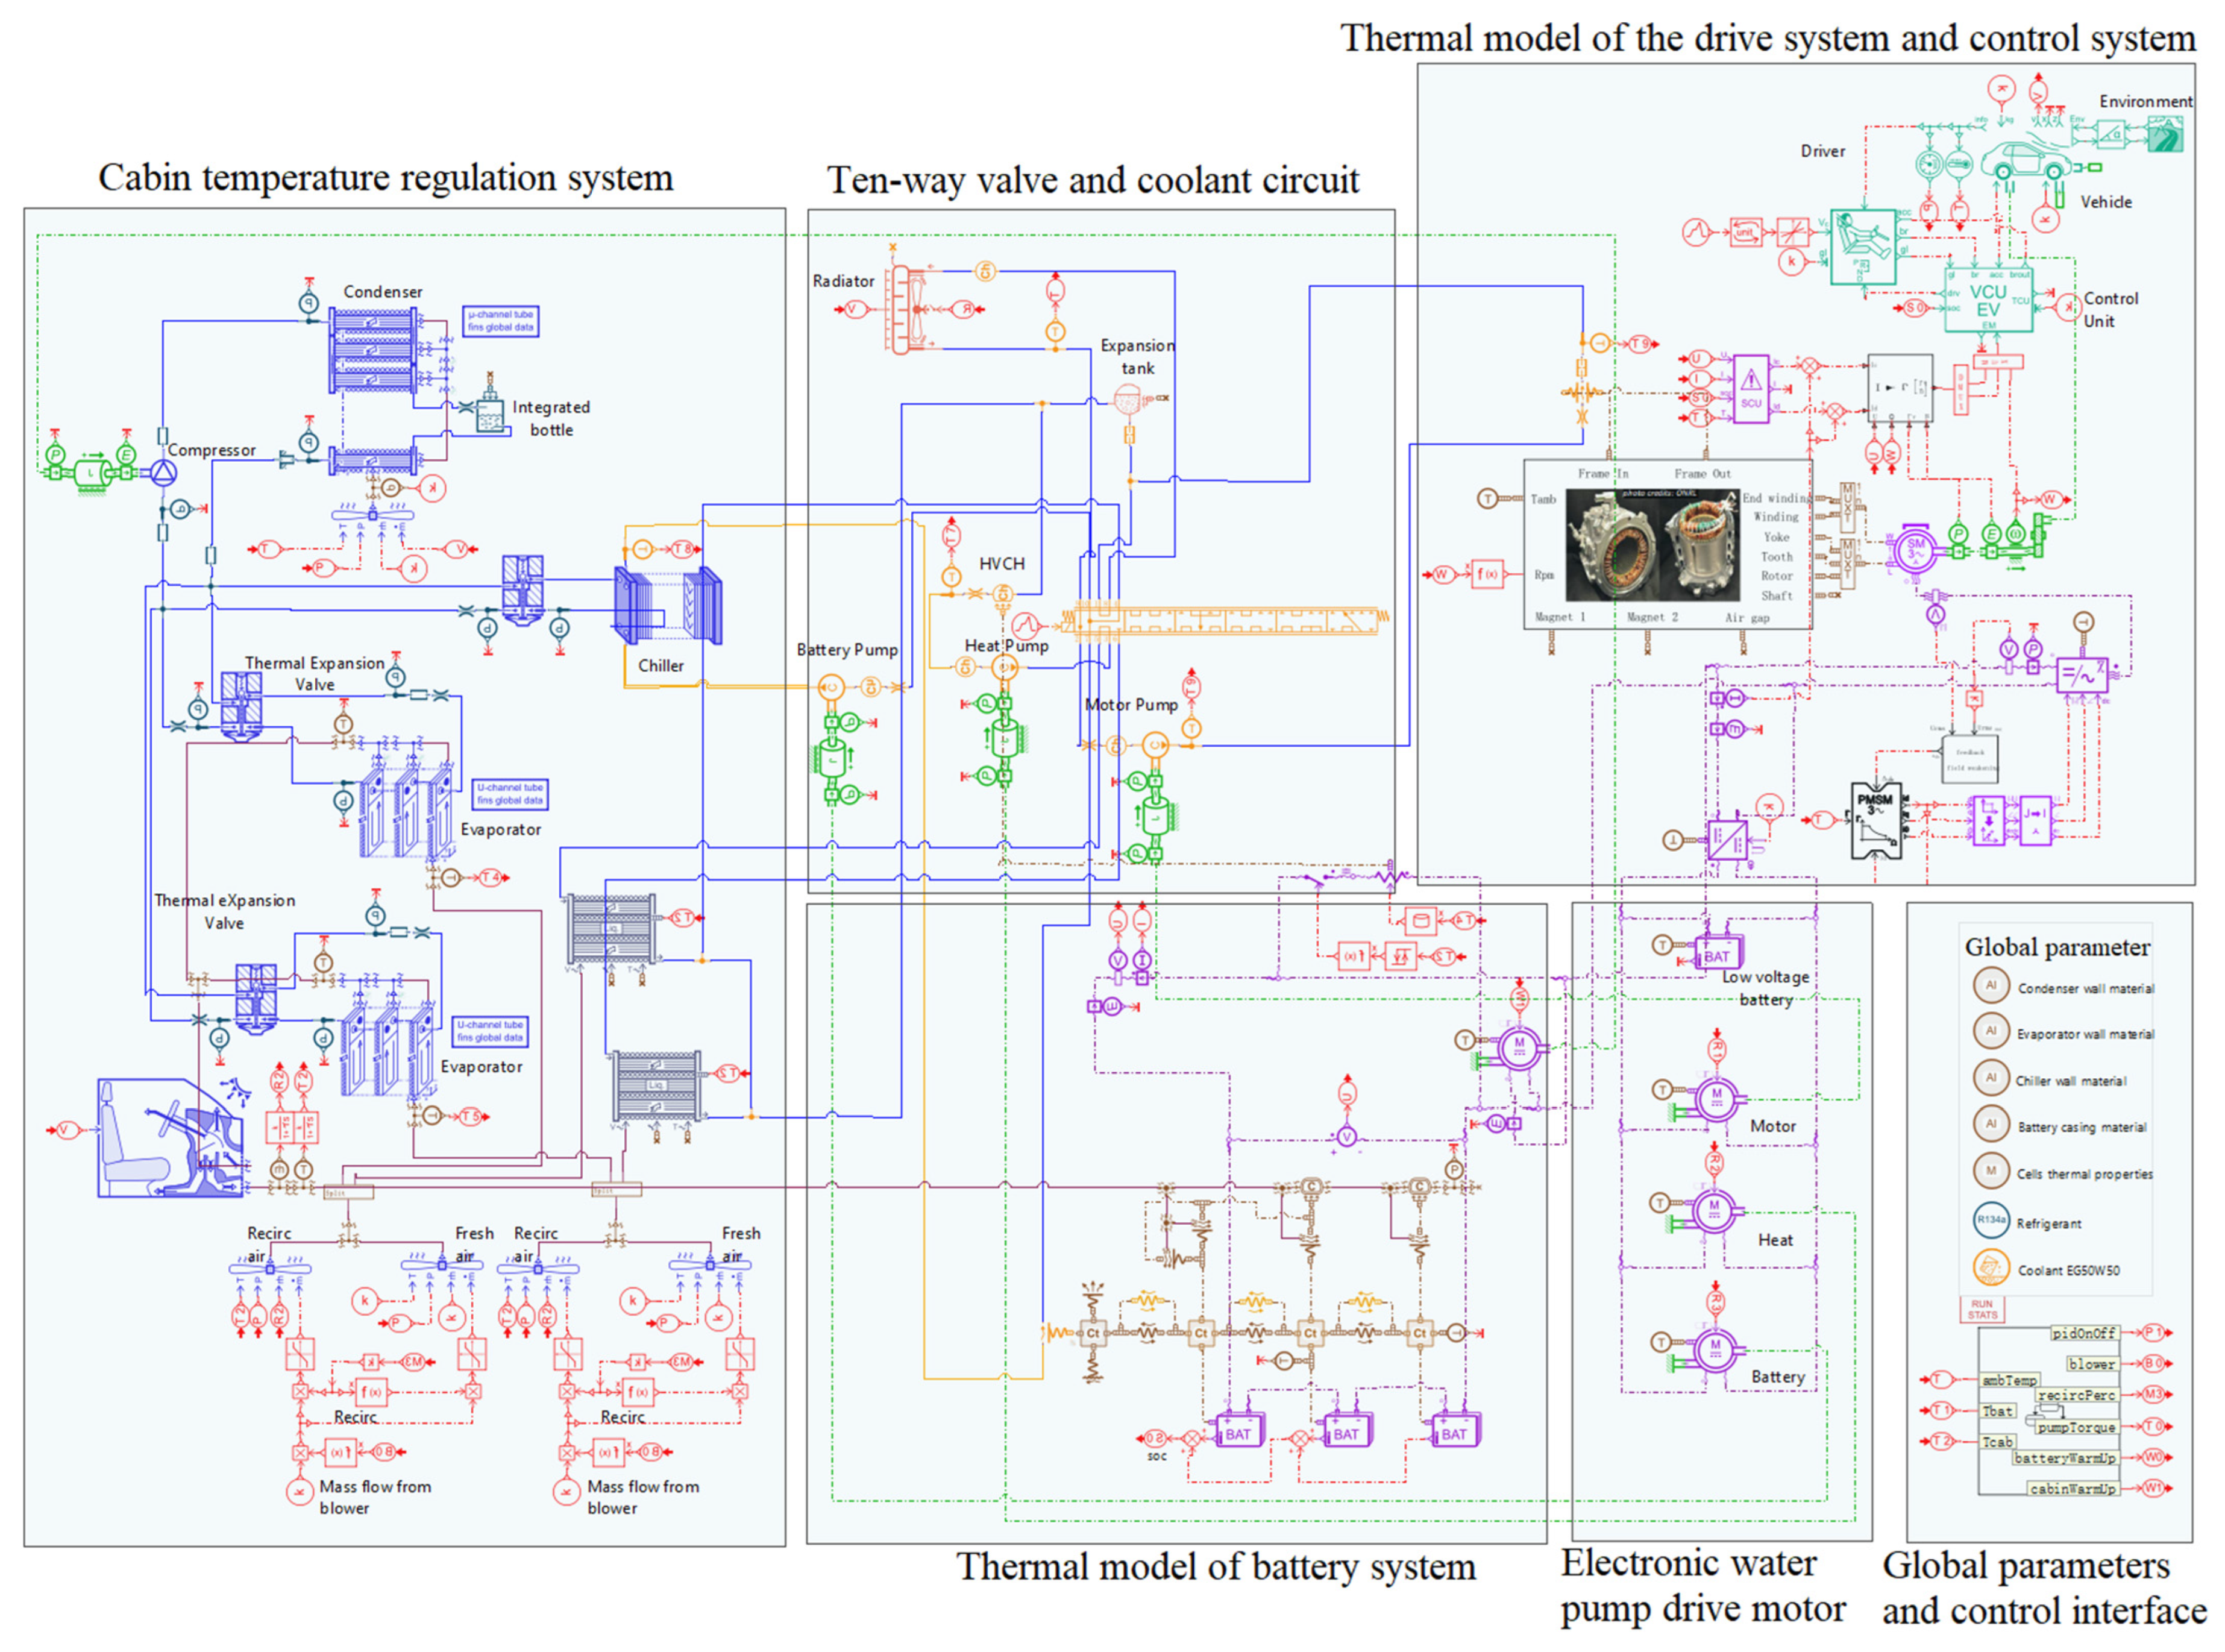
2.2. Development of Simulation Model

A vehicle TMS simulation model is developed on the AMEsim2304 platform, consisting of several key components: a model of the electric drive system heat generation, a model of the battery system heat generation, and the TMS model. The electric drive system and battery system heat generation models simulate heat production during actual operation by analyzing their respective heat generation characteristics. Meanwhile, the heat transfer characteristics of the TMS model can be used to simulate the heat exchange process during operation.
The battery thermal management system primarily targets the high-voltage power battery. The high-voltage battery pack heat generation model is composed of different equivalent batteries at different temperatures, including the minimum temperature, the average temperature, and the maximum temperature. Thermal capacitance blocks are used to simulate the temperature states of the equivalent batteries and the battery casing, while linear heat conduction modules are employed to model the heat conduction process across different temperature ranges, as shown in Figure 3.
Heat in the electric drive system mainly arises from energy losses during motor operation, including copper loss in windings and iron loss in the core, creating localized high temperatures. Heat conducts through the insulation to the stator core, then to the motor casing, which typically contains cooling jackets. Heat is transferred to the coolant via convection, then carried to a radiator for dissipation via air or secondary cooling. The motor’s thermal model uses equivalent thermal capacitance and resistance modules to simulate heat generation and transfer in the rotor, stator, air gaps, and housing.
Because of similar temperature characteristics between the motor, motor controller, and the “small three electric” systems (on-board charger, DC/DC, power distribution unit), they are typically integrated into a single structure, sharing the same thermal management circuit for temperature control. Therefore, these components are combined into a super component heat generation model for the drive system, as shown in Figure 3. A thermal fluid flow module with heat exchange is used to simulate the cooling process of the coolant.
The TMS includes the cabin air conditioning, heating system, and temperature management systems for the battery and drive system. The main components of TMS are the compressor, the condenser, the evaporator, the chiller, and the heating heat exchanger. Through the integrated design of the vehicle thermal management architecture, the vehicle TMS model was constructed. The vehicle TMS model primarily consists of the air conditioning module, heating module, drive thermal management module, and battery thermal management module. Since the test vehicle was equipped with separate front and rear air conditioning systems, both the air conditioning and heating modules in the model contained two independent heat exchange systems, which could be controlled independently.
This study employs a coaxial motor-driven compressor, where the cooling capacity is regulated by controlling the motor speed. A feedback loop, incorporating a built-in proportional control valve, receives system pressure setpoints from an external control unit to enable dynamic pressure stabilization, ensuring output pressure matches the target value.
The condenser is modeled using a microchannel fin-tube heat exchanger from the AMEsim2304 air conditioning library. The heat exchange process is divided into internal refrigerant-side flow and external moist air-side flow. On the refrigerant side, pressure drop and heat transfer are calculated using dynamic two-phase flow, while the air side models heat exchange between moist air and surfaces as air flows vertically across the exchanger.
The evaporator consists of stacked U-shaped channel plate-fin heat exchangers. Similar in principle to the condenser, the U-shaped channel design extends the refrigerant flow path, enhancing turbulence and promoting thorough contact between the refrigerant and fins, thereby improving heat transfer.
The chiller comprises alternately arranged corrugated metal plates, forming complex flow channels between adjacent plates. Counterflow of hot and cold fluids on either side of the corrugation induces turbulence, which reduces boundary layer thickness, enhances convective heat transfer, and increases the heat transfer surface area per unit volume.
A ten-port supercomponent was constructed using a customized valve from the AMEsim2304 Hydraulic library. The valve was configured as a six-position, ten-port valve, corresponding to the six operating states and ten coolant ports in the integrated architecture. Based on the specific connection modes in each operation state, the spool’s flow paths were defined, and coolant flow was distributed accordingly.
The vehicle’s thermal management system (TMS) integrates battery, motor/controller, and cabin heating loops, each driven by a coaxial permanent magnet synchronous motor pump with speed-based flow control. Dynamic heat transfer between coolant and integrated water jackets around key components—battery pack, drive motor, and HVCH—is modeled using a distributed-parameter approach. A ten-port valve enables loop coupling and flow routing. Subsystem heat generation and TMS component models are integrated with defined material and environmental parameters. The complete vehicle-level model, shown in Figure 3, includes drive, battery, cabin, and control modules, forming a compact, highly integrated TMS architecture.

3. Parameter Matching and Model Validation

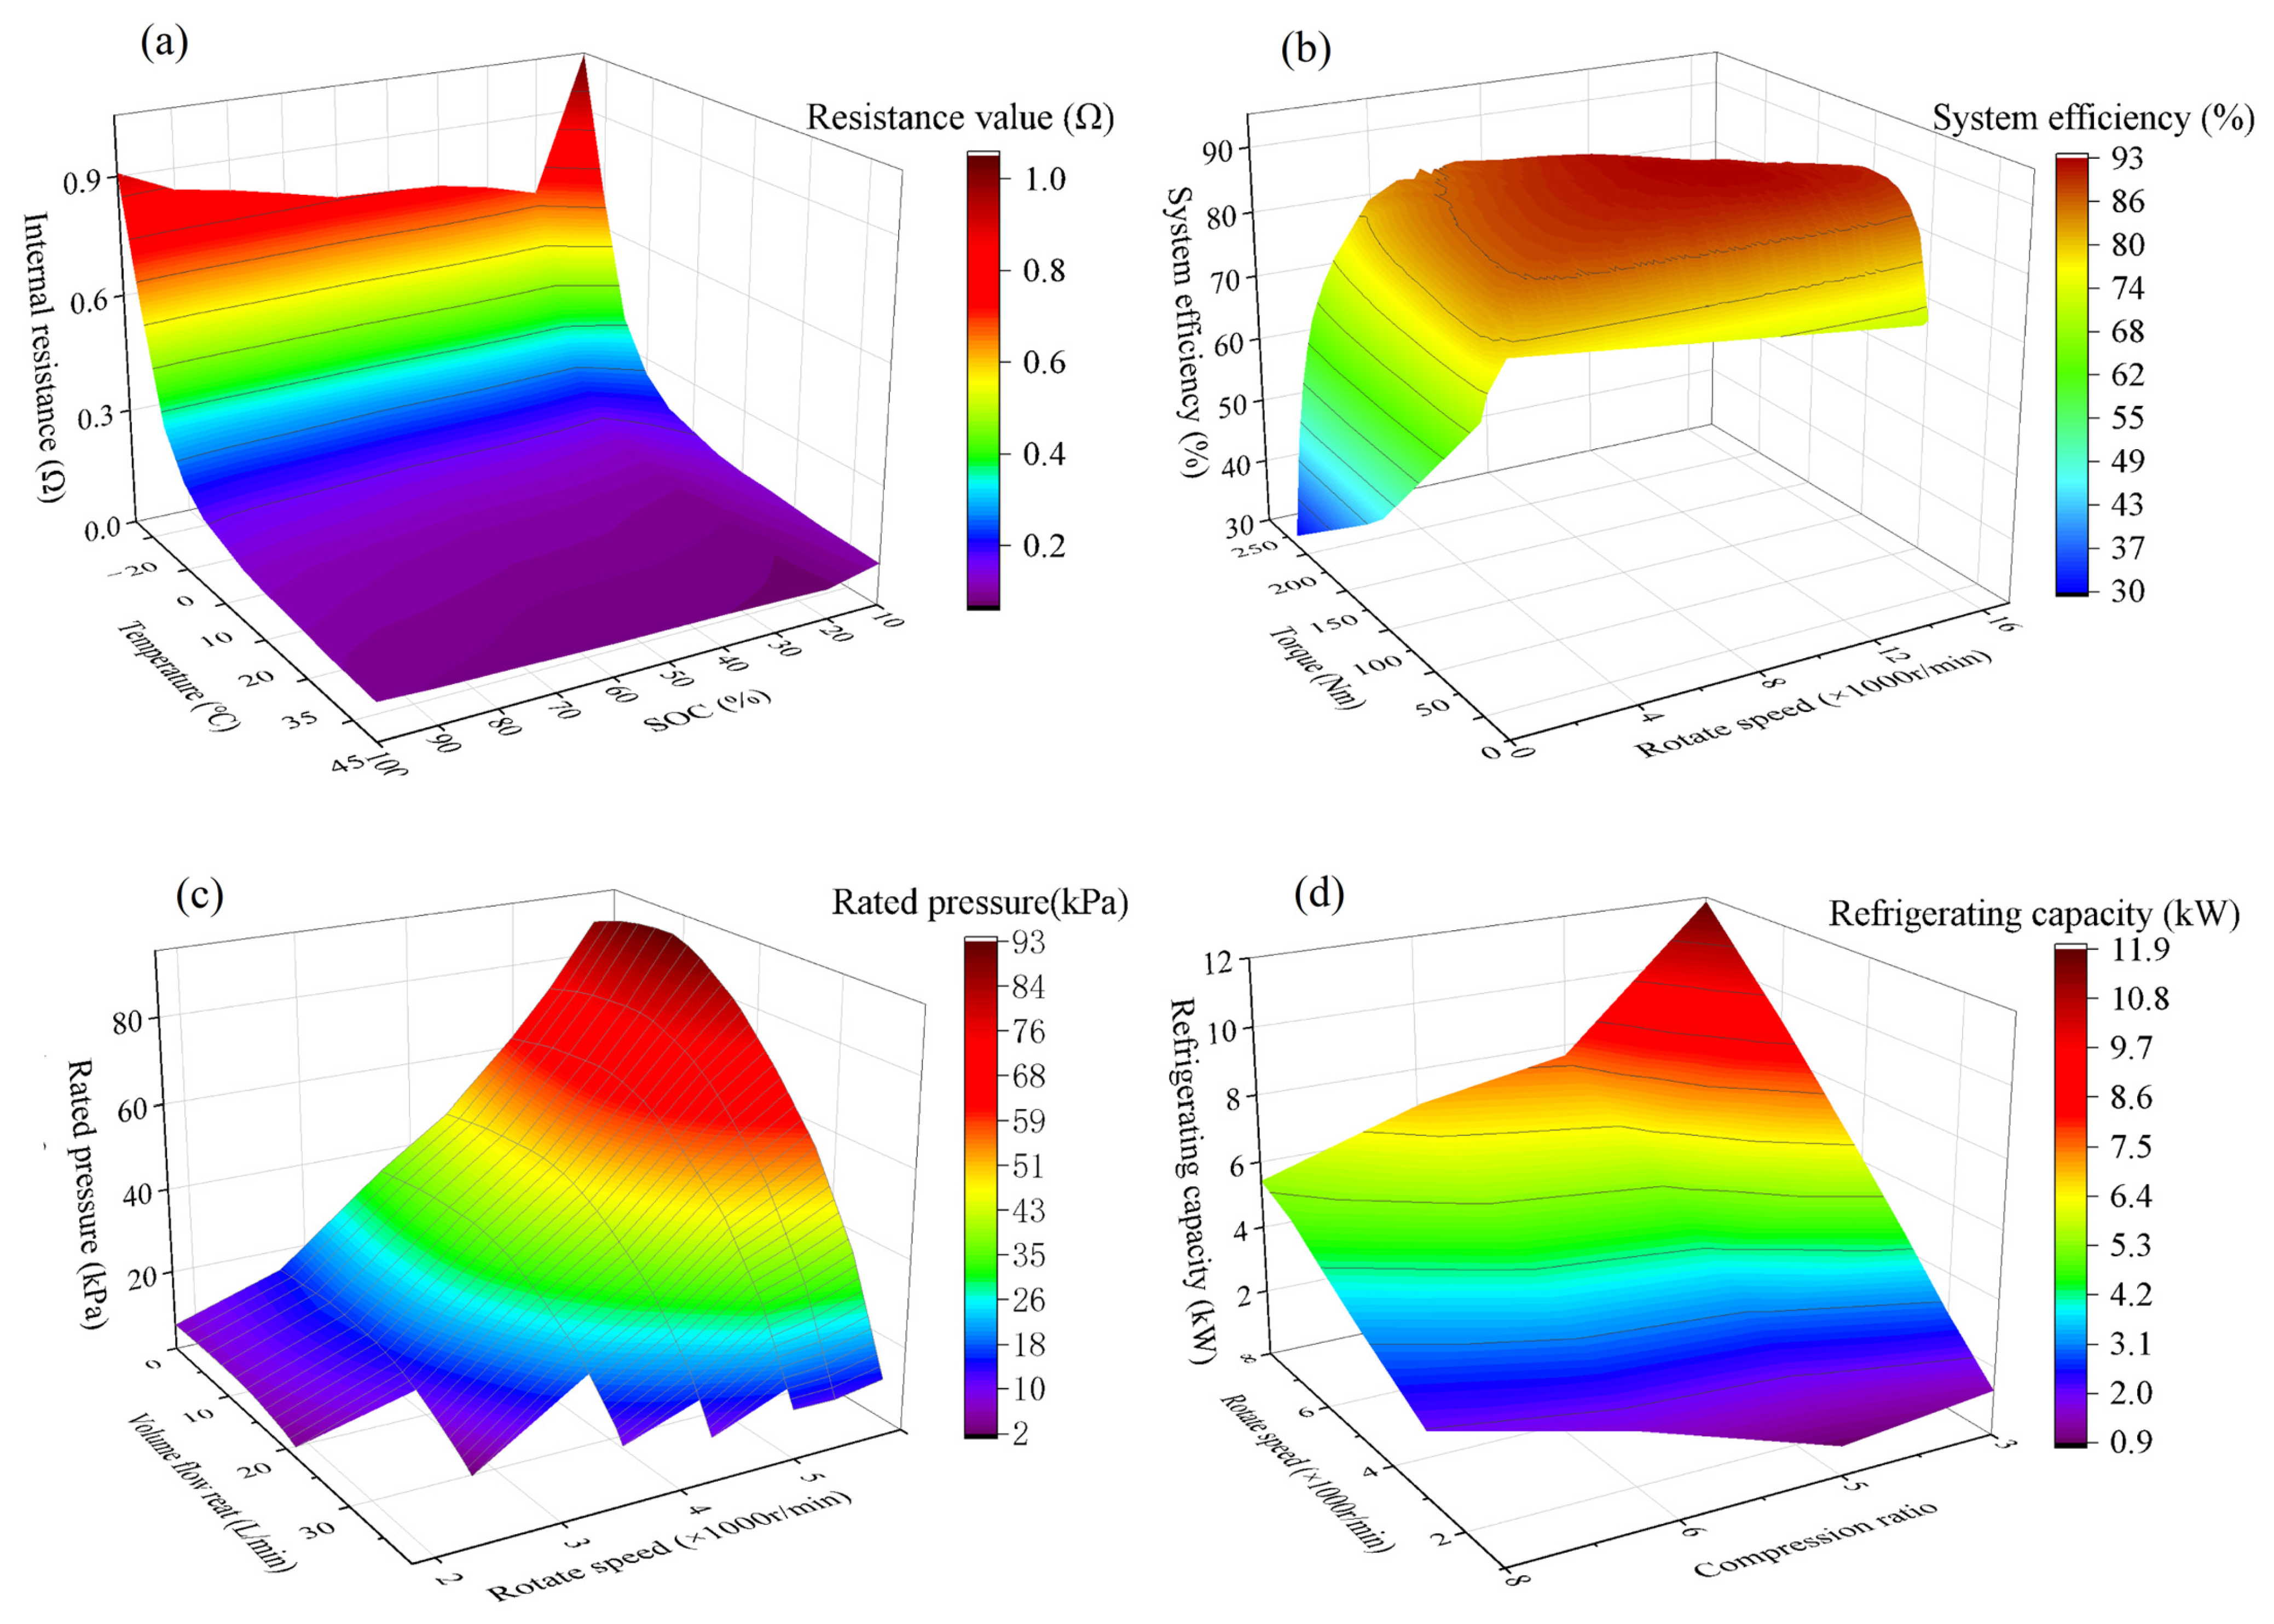
3.1. Parameter Matching

The TMS simulation model is parameterized using actual vehicle data. By adjusting the physical parameters and system characteristics within the model, the simulation results are aligned more closely with real-world operating conditions, which can provide a solid foundation for control system design and optimization.
During charge/discharge cycles, heat generation in lithium-ion batteries originates from internal electrochemical reactions and energy losses, categorized into four types: Joule heat ( Q j ), reaction heat ( Q r ), polarization heat ( Q p ), and side reaction heat ( Q s ).
Joule Heat ( Q j ):
Caused by internal resistance during current flow, calculated via Joule’s law:
Q j = I 2 · R · t
where I is current (A), R is internal resistance (Ω), and t is time (s).
Reaction Heat ( Q r ):
Generated by the endothermic/exothermic lithium-ion intercalation/deintercalation reactions, dependent on temperature and current:
Q r = n · m · Q e M · F · I · t
where n is the number of battery cells, m is electrode mass (kg), Q e is electrode reaction enthalpy (J), M is molar mass ( g / m o l ), and F is Faraday’s constant ( F = 96484.5   C / m o l ).
Polarization Heat ( Q p ):
Arises from voltage deviation due to electrode polarization, proportional to current and overpotential:
Q p = I 2 · R p · t
where R p is polarization resistance (Ω).
Side Reaction Heat ( Q s )
Minor heat from side reactions (e.g., electrolyte decomposition, Solid Electrolyte Interphase (SEI) layer rupture), often negligible in practical applications.
Simplified Thermodynamic Model (Bernardi Model):
For engineering applications, the total heat generation Q is simplified via the first law of thermodynamics:
Q = I U U O C V + T U O C V T
where U is terminal voltage (V), U O C V is open-circuit voltage (V), and T is battery temperature (K).
Electric drive motors primarily include Permanent Magnet Synchronous Motors (PMSMs), Induction Motors, and Switched Reluctance Motors. PMSMs are becoming mainstream due to their high efficiency, power density, compact size, and high torque at low speeds. However, energy losses—including winding resistance loss, core loss, mechanical loss, and stray loss—result in heat generation during operation.
Winding Resistance Loss (Copper Loss, P c u )
Caused by Joule heating from current flowing through stator windings, influenced by current amplitude, winding material, and temperature. For three-phase AC motors:
P c u = 3 I 2 · R
where I is the effective phase current (A), and R is the temperature-corrected single-phase winding resistance (Ω).
Core Loss (Iron Loss, P f e )
Arises from hysteresis and eddy current effects in the core material under alternating magnetic fields, dependent on silicon steel thickness, flux density ( B m ), and frequency ( f ). The modified Steinmetz equation (MSE) is an extension of the classical Steinmetz formula and is applicable to considering the frequency-dependent core loss mechanism under non-sinusoidal excitation.
Modified Steinmetz equation:
P f e = k h · f · B m α + k e · f 2 · B m α + k c · f 1.5 · B m α
where k h , k e , and k c are hysteresis, eddy current, and excess loss coefficients, respectively; α is an empirical constant.
The Modified Steinmetz Equation can be derived from the Separation of Loss Mechanisms, Unified Flux Density Exponent, and Calibration for Non-Sinusoidal Waveforms are explained from three aspects:
Separation of Loss Mechanisms
The classical Steinmetz equation ( P f e = k · f α · B m β ) empirically aggregates hysteresis, eddy current, and excess losses into a single frequency-dependent term. In contrast, the modified equation explicitly decomposes the total loss into three distinct physical components:
  • Hysteresis loss term ( k h · f · B m α ): Retains the linear frequency dependence ( f 1 ) as energy loss per cycle scales with hysteresis loop area.
  • Eddy current loss term ( k e · f 2 · B m α ): Reflects the quadratic frequency dependence ( f 2 ) derived from Maxwell’s equations, where induced eddy currents dissipate power proportionally to (dB/dt)2.
  • Excess loss term ( k c · f 1.5 · B m α ): Introduces an intermediate frequency exponent ( f 1.5 ) to model anomalous losses caused by domain wall motion and localized eddy currents.
Unified Flux Density Exponent ( B m α )
While traditional models assign separate exponents to Bm for hysteresis (β ≈ 2) and eddy currents (β ≈ 2), the MSE simplifies the formulation by adopting a unified exponent aa. This approach, supported by experimental studies, reduces parameter complexity while maintaining accuracy within the tested frequency range.
Calibration for Non-Sinusoidal Waveforms
The MSE coefficients ( k h ,   k e ,   k c ) were calibrated using the Generalized Steinmetz Methodology, which correlates loss components to the Fourier spectrum of the excitation waveform.
Mechanical Loss ( P m )
Generated by bearing friction, rotor windage, and brush contact. Empirical model [22]:
P m = P Z + P F = k m · G R · n m o t · 10 3 + 2 D R 3 · n m o t 3 · l R 10 6
where P Z (friction loss) and P F (windage loss) depend on friction coefficient k m , rotor weight G R , diameter D R , length l R , and rotor speed n m o t .
Stray Loss ( P s )
Additional losses from harmonic fields, leakage flux, and local eddy currents, approximated as [23]:
P s = ( 0.5 % ~ 2 % ) × ( P c u + P f e )
The test subject uses a lithium iron phosphate (LFP) power battery; its battery pack is formed by 120 cells connected in series. The nominal voltage is 384 V, the nominal capacity is 174 Ah, the nominal energy is 66.82 kWh, and the mass of each cell is 3.04 kg. The cell-specific heat capacity is 1.01 J·kg−1·K−1. The battery pack features a coolant jacket positioned at the bottom, where the coolant flow facilitates heat exchange with the battery, ensuring it operates within a reasonable temperature range. The jacket hydraulic diameter is 6 mm, with a length of 26.32 m. The cross-sectional area is 2182.91 mm2, it holds 3 L of coolant, and the total heat exchange area is 956,000 mm2. An analysis of the power battery thermal load reveals that the battery’s internal resistance plays a critical role in its heat generation characteristics. Currently, the battery module impedance is typically assessed by measuring the direct current resistance (DCR). The DCR technique calculates the internal resistance by evaluating the voltage difference between the instant before discharge ends and the stabilized voltage after discharge during intermittent discharge cycles. The DCR measurement results of the battery discharged at a rate of 1 C under varying temperatures and states of charge (SOC) are shown in Figure 4a.
Figure 4a demonstrates a temperature-dependent surge in DCR of the power battery at 20% SoC, particularly below 0 °C. This abrupt increase stems from triple low-temperature effects: (1) Elevated electrolyte viscosity reduces ionic conductivity (e.g., <20% of room-temperature values at −20 °C), hindering Li+ mobility; (2) Lattice contraction induces exponential decline in solid-phase diffusion coefficients (graphite anode Li+ diffusion coefficient decreases from 10−10 cm2/s at 25 °C to 10−12 cm2/s at −20 °C), coupled with charge transfer impedance (Rct) escalation; (3) Reduced SEI film porosity further restricts Li+ transport. These synergistic mechanisms elevate DCR to multiple times room-temperature levels below 0 °C, precipitating power performance collapse and low-temperature charging limitations.
This study utilizes a drive motor with a peak power of 120 kW, a rated voltage of 360 V, and a peak torque of 220 N·m. The stator has a specific heat capacity of 460 J·kg−1·K−1 and a mass of 13.2 kg. The windings have a specific heat capacity of 385 J·kg−1·K−1 and a mass of 3.75 kg. The rotor has a specific heat capacity of 460 J·kg−1·K−1 and a mass of 12.36 kg. For the drive system water jacket, the length is 3.654 mm, the hydraulic diameter is 18 mm, the cross-sectional area is 225 mm2, the heat exchange area is 251,320 mm2, and it holds 0.819 L of coolant. The loss in the motor mainly includes iron loss, mechanical loss, and copper loss, all of which are ultimately dissipated as heat. Additionally, the loss of semiconductor power components is an important heat source for control systems. Analyzing the drive system efficiency is essential for understanding its heat generation characteristics. The efficiency of the drive system is shown in Figure 4b.
The primary source of thermal load in the passenger cabin is solar radiation, the intensity of which is influenced by factors such as the body area, window area, cabin volume, interior area, and materials used. The total volume of the passenger cabin is 5.877 m3, and the solar absorption coefficient is 1000 W. The total window area is 3.314 m2, the roof area is 1.417 m2, and the body area is 8.607 m2. In terms of the interior, the dashboard area is 1.151 m2, respectively, and the floor area is 4.78 m2. TMS performance is primarily determined by the water pump and compressor. The water pump regulates the coolant flow rate in each circuit by controlling its rotational speed, with key performance parameters being pressure and flow rate. In this study, three water pumps of the same model are installed for the electric drive circuit, the heating system, and the battery circuit, respectively. The performance calibration data for these pumps are shown in Figure 4c.
The cooling capacity of the compressor is a key indicator of its refrigeration performance. By calibrating and calculating its cooling capacity at different rotational speeds and pressure ratios, the refrigeration system’s ability to transfer thermal loads can be accurately assessed. The compressor cooling capacity parameters are shown in Figure 4d.

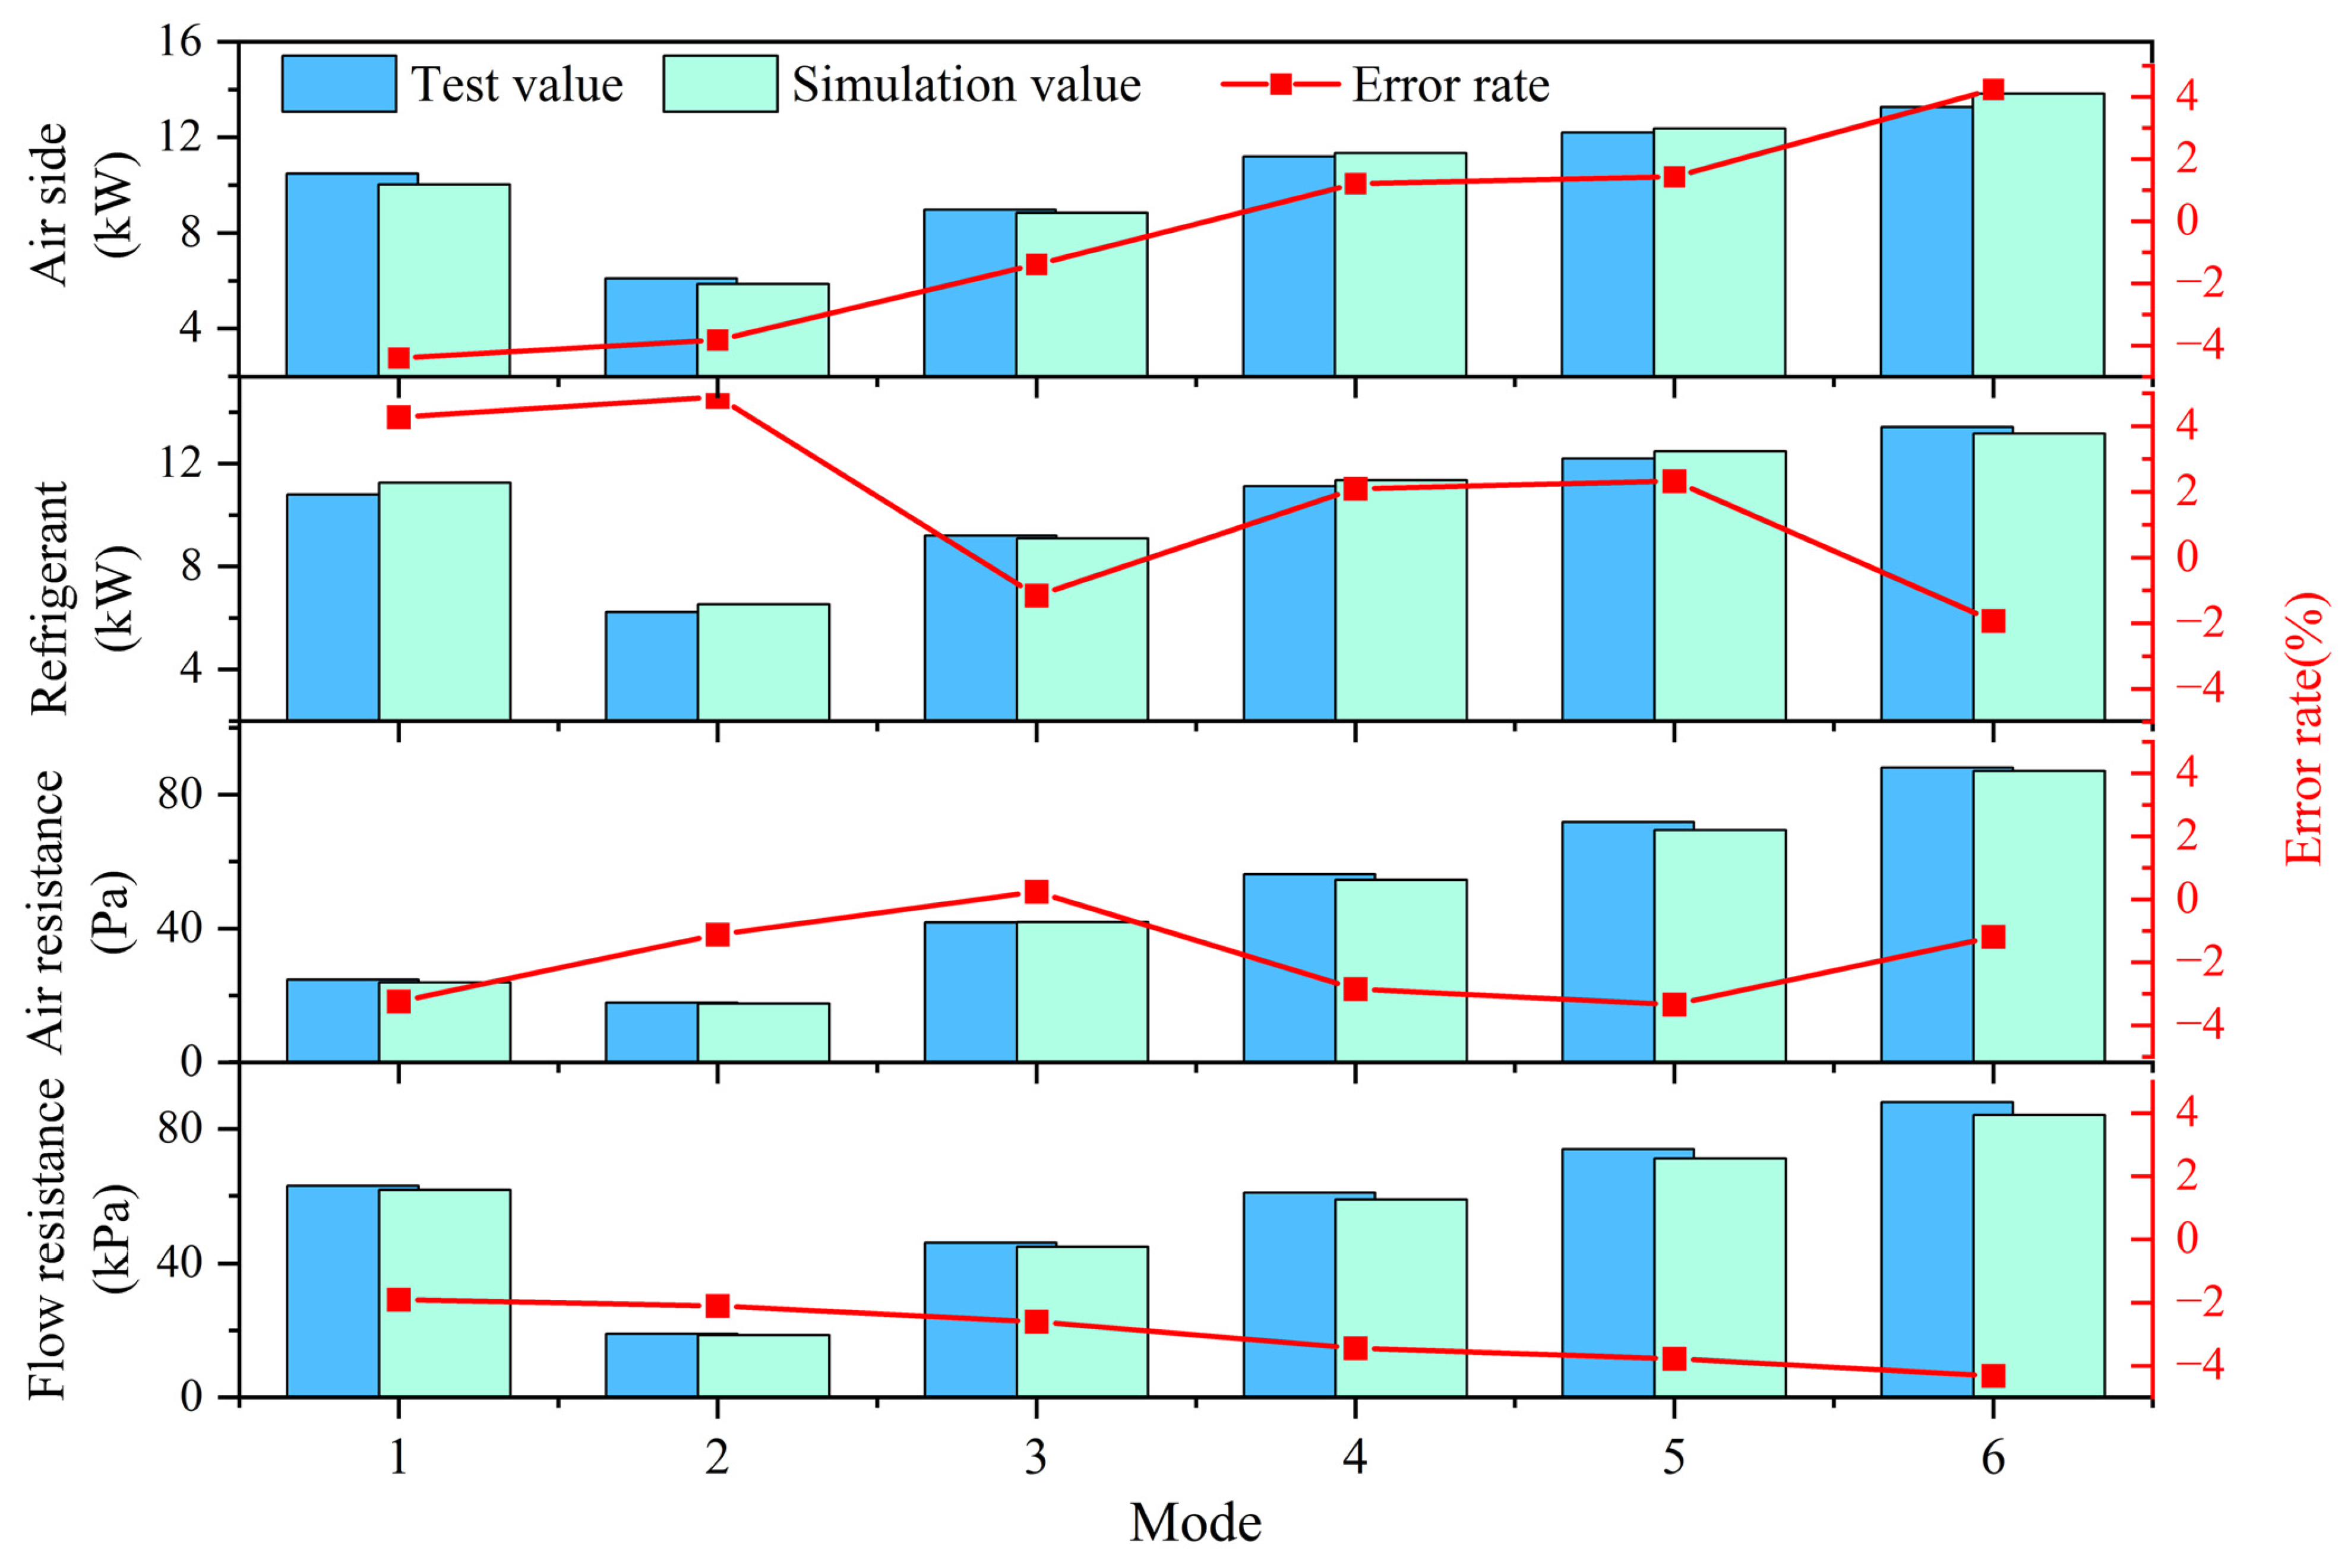
3.2. Model Validation

After the parameter matching is completed, the accuracy of the system model should be verified, mainly including the condenser heat transfer system, the heating characteristics system, the vehicle thermal management system, and so on.
The performance of the heat exchangers used in the TMS is tested using an automotive air conditioning comprehensive performance test bench based on six modes. The specific test conditions are detailed in Table 1.
The tests assess the air-side heat exchange capacity, refrigerant-side heat exchange capacity, air resistance, and flow resistance of the condenser. The results of the bench test and simulation of the condenser are compared, and the result is given in Figure 5. The comparison indicates that the error percentages for air-side and refrigerant-side heat exchange range from −5% to 5%, while the error percentages for air resistance and flow resistance range from −5% to −2%. The absolute errors of the simulation are less than 5%, which can meet the relevant testing requirements.
In order to verify the accuracy of the vehicle heating characteristics system model, the study conducts experiments on the vehicle’s heat generation characteristics using a vehicle test environmental chamber. The powertrain tests focus on heat generation in the electric drive system and temperature variations during the power battery charging and discharging process. During the temperature rise characteristic test of the drive system, the power to the circulating pump in the electric drive system’s thermal management circuit is cut off, and the vehicle is placed on a dynamometer for load simulation testing. The vehicle is driven at 30 km/h to increase the temperature of the drive system. Temperature changes at various points of the drive assembly are monitored in real time using temperature sensors, while the internal coolant temperature changes are recorded by collecting data messages to analyze the system’s heat transfer characteristics. The motor temperature rise test and simulation results are shown in Figure 6a. Since the motor temperature was below 25 °C before the test conditions began, the initial test temperature is slightly lower than the simulated temperature. Additionally, the air flow caused by wheel rotation during the test results in a measured motor temperature lower than the simulated temperature. After 3.5 min of testing, the coolant temperature approaches 60 °C, prompting the vehicle’s Vehicle Control Unit (VCU) to issue a torque limitation command, which restricts the vehicle’s output power and slows the motor’s temperature rise. At 4 min, the coolant temperature reaches the motor’s maximum operating temperature of 65 °C, at which point the vehicle’s power is interrupted, and the temperature stabilizes. Since the simulation conditions did not include a maximum allowable temperature, the simulated temperature continues to rise. However, the maximum error during the temperature rise process is less than 3 °C, which meets the simulation requirements for normal operating conditions. The discharge temperature rise test was conducted on the power battery at an ambient temperature of 25 °C. During the test, the coolant circulation pump for the power battery was disconnected, relying solely on natural cooling for heat dissipation. Due to insufficient cooling, the cells near the battery pack interior experienced higher temperatures. As a result, the highest cell temperature within the battery module was selected as the focus of this test. The comparison between the results of the test and simulation is shown in Figure 6b. The average battery temperature gradually increases during the discharge process. With the increase of the temperature difference between the battery and the environment, the natural cooling speed is accelerated, and the temperature rise rate tends to be stable. The output power begins to be limited when the temperature approaches 35 °C. Throughout the continuous discharge process, the maximum temperature difference between the simulation and test results is less than 2 °C, meeting the accuracy requirements for the simulation.
To validate the accuracy of the thermal management system model, a cooling performance verification test under high-temperature operating conditions was conducted. A temperature-correlated linear adjustment strategy was implemented: the compressor and battery cooling water pump actuators performed dynamic speed adjustments based on the power battery temperature (10–45 °C), while the water pump and cooling fan in the electric drive cooling circuit established a coordinated control mechanism linked to the motor temperature (0–65 °C). Simultaneously, the cabin air conditioning was activated with the blower fan speed set to level 3, and thermal management performance simulations were executed using the AMESim2304 model. Identical operating conditions were replicated in an environmental simulation chamber. Real-time monitoring parameters included front grille intake airflow, refrigerant phase-change temperature, key thermodynamic parameters in the coolant circulation loop, and cabin head/footwell temperatures. The experimental platform configuration and sensor layout are illustrated in Figure 7.
Based on the aforementioned setup, the performances of the full-vehicle thermal management characteristics system are tested. At an ambient temperature of 35 °C, the vehicle TMS starts to work, and the results are shown in Figure 8a. Results show that the temperature errors for the electric drive system are less than 2 °C, with the initially significant fluctuations gradually stabilizing. The maximum simulation temperature error for the power battery is less than 1 °C, as shown in Figure 8b.
In summary, the simulation accuracy for the systems (including the condenser heat transfer system, the heating characteristics system, and the thermal management characteristics system) can meet the required testing requirements.

4. Design of Fuzzy PID Controller for Electric Water Pump

Fuzzy PID controllers are widely used in the control of various complex systems, such as temperature control, robotic systems, and process control. It combines fuzzy logic techniques [24,25] with the PID control algorithm. It converts input signals into fuzzy sets through a fuzzification process, and then performs inference on the fuzzy inputs based on predefined fuzzy rules to generate fuzzy outputs. Finally, the fuzzy outputs are defuzzified to obtain specific control actions.
They offer distinct advantages, particularly in systems where precise mathematical models are difficult to establish. By combining fuzzy logic with PID control, fuzzy PID controllers are better equipped to handle nonlinearity, time-varying behaviors, and uncertainties in systems, thereby improving the control system’s overall performance and robustness.
Fuzzy PID was used as a classical control algorithm in this study, and its structure and fuzzy control rules of PID coefficients are shown in Figure 9. In the water circulation loop, coolant flow is controlled by adjusting the water pump speed, ensuring that the control target temperature remains stable at the desired set point. By addressing the nonlinearity, time-varying behavior, and uncertainties in the operation of the coolant circulation pump, fuzzy PID control can enhance control accuracy, improve system stability, achieve a rapid response, and optimize the overall energy consumption of the system.
According to the system control requirements, a dual-input, triple-output fuzzy PID controller architecture is adopted to regulate the water pump speed. The deviation between target temperature and actual temperature, and its variable ratio, are used as inputs in the fuzzy reasoning process. The outputs are the adjustments to the PID parameters: k p , k i and k d .
K p = K p 0 + K p K d = K d 0 + K d   K i = K i 0 + K i
To enhance computational efficiency, the triangular function is chosen as a membership function. The discourse domain of fuzzy input and output variables is defined as follows:
E 3 ,   3 E c 3 ,   3 K p 1 ,   1 K i 0.3 ,   0.3 K d 0.3 ,   0.3
In this study, the seven sets of fuzzy linguistic variables serve as inputs for the controller E c and E . Figure 9 shows the fuzzy control curves in the Fuzzy Controller module. The centroid method is employed for defuzzification to obtain the values of k p , k i and k d . The adjustment ranges for these parameters are constrained to prevent abrupt changes, allowing for real-time adjustments of the PID controller input parameters. Additionally, an overtemperature protection mechanism is implemented, where the water pump operates at full speed when the real-time temperature exceeds the maximum allowable limit.

5. Performance Test Verification of the Vehicle TMS

5.1. Test Condition Settings

To reflect the performance of the TMS during actual operation, our work adopts China Light-Duty Vehicle Test Cycle (CLTC) for simulation. The CLTC-P cycle for passenger vehicles within the CLTC has a total duration of 1800 s, including the three speed intervals of high, medium, and low. In the total time, the high-speed zone accounted for 24.1%, the medium-speed zone accounted for 38.5%, and the low-speed zone accounted for 37.4%. The low-speed interval accounts for 37.4% of the total time, the medium-speed interval for 38.5%, and the high-speed interval for 24.1%. The maximum speed is 114.0 km/h, and the average speed is 29.0 km/h. The total sampling distance is 14.48 km, and the idling proportion is 22.1%.
The test environmental conditions for the CLTC are as follows: the temperature range is 20–30 °C, the humidity range is 45–80%, and the vehicle load is 75 kg. Approximately 40% of the time is spent in acceleration, 36% in deceleration, 2% in cruising, and the remaining time in a stationary state. Since the test environmental temperature of the CLTC falls within the optimal range for power batteries, it does not account for extreme operating scenarios. Therefore, based on the same driving cycle, a −10 °C low-temperature environment is established, with the target cabin temperature set to 25 °C, to evaluate the waste heat recovery performance of the TMS under low temperature conditions.
To ensure the repeatability and accuracy of the test results, all experiments were conducted in a controlled climate chamber conforming to ISO 16750-4 standards [26]. The ambient temperature was precisely maintained at −10 °C with a tolerance of ±1 °C, and the humidity was kept below 30% to simulate dry winter conditions. The test vehicle was preconditioned by parking in the chamber for at least 8 h prior to the test to ensure uniform thermal soak. The power battery state of charge (SOC) was stabilized at 60% before each test to eliminate variations caused by initial battery conditions. Additionally, the heating load applied to the passenger cabin was standardized using two calibrated thermal manikins representing front-seat occupants, each with a constant heat dissipation of 100 W.
Vehicle speed and load variations during the CLTC-P cycle were replicated using a chassis dynamometer equipped with real-time road load simulation capabilities. The HVAC system operated in automatic mode, and all actuators and valves within the TMS were controlled by a pre-programmed strategy identical for both test scenarios. All sensors used for temperature and power measurements were calibrated before testing, with measurement accuracy within ±0.5 °C for temperature and ±2% for energy consumption. These strict test conditions ensure that the observed differences in performance arise solely from the architectural and control differences in the TMS under evaluation.

5.2. Test Result Analysis

To verify the performance improvement of the TMS under low-temperature conditions, the temperature changes and energy consumption of each subsystem were tested under the −10 °C low-temperature condition. Figure 10a gives a comparison of power battery temperature change curves. From the comparison of test data, it can be observed that during the first 600 s of the test cycle, the motor temperature was too low to provide sufficient waste heat, and the TMS operated in an independent cycle mode. As the motor temperature increased and the system entered waste heat recovery mode, the rate of temperature rise of the power battery gradually accelerated. At around 1200 s in the test cycle, the temperature difference between the waste heat recovery architecture and the traditional architecture reached 7.9 °C. The temperature of the waste heat recovery power battery was already approaching the target temperature at 1300 s. Compared to the architecture without waste heat recovery, the time required to heat the power battery to 20 °C was shortened by approximately 300 s. Furthermore, the optimized control strategy resulted in smaller temperature fluctuations in the system compared to the traditional solution.
The output power of the HVCH in the thermal management loop under the low-temperature condition is shown in Figure 10b. The data indicates that in the waste heat recovery mode, the TMS can quickly reach the heat holding state, and the HVCH output power drops to around 0.8 kW. In contrast, in the architecture without waste heat recovery, the HVCH required power consumption around 2 kW at the heat holding state after a delay of approximately 400 s.
During the waste heat recovery process, the maximum difference in HVCH output power reached 2.7 kW. Furthermore, at the state of heat holding, the HVCH output power in the waste heat recovery architecture was approximately 1.2 kW lower than that in the traditional architecture, indicating that the power contribution from the TMS in the waste heat recovery mode is more than 1.2 kW.
To evaluate the enhancement of cabin thermal comfort through waste heat recovery in the integrated architecture, this study conducted dual-mode comparative tests under a constant low-temperature condition (−10 °C). Based on the system’s thermodynamic characteristics, the control group initially maintained the heating system’s inactivity. When the integrated architecture began work in the waste heat recovery mode at 700 s, two front cabin heating simulation loads were simultaneously activated to maintain constant HVCH power. Comparative simulation data are shown in Figure 11.
In the waste heat recovery mode, the integrated architecture achieved cabin heating from the initial temperature to the target 25 °C within 620 s, with an average temperature rise rate of 3.4 °C/min. This represents a 43.7% reduction in heating duration compared to the traditional architecture (1100 s). Thermodynamic comparison curves revealed a peak temperature difference of 12.91 °C between the two systems during heating.
The results demonstrate that the integrated waste heat recovery system nearly halved the time required to reach thermally comfortable cabin conditions, conclusively validating its engineering value in improving heating efficiency under low-temperature environments.
The heating energy consumption of TMS and the rate of cabin temperature change under −10 °C low-temperature conditions are shown in Table 2. In a complete test cycle (1800 s), the heating energy consumption decreased from 3 kWh to 2.7 kWh, indicating a reduction of approximately 10%. Considering experimental measurement errors and system operation variability, the estimated uncertainty in energy consumption is ±0.05 kWh. Therefore, the energy-saving rate is approximately 10% (±1.7%). This result demonstrates that the waste heat recovery strategy can significantly enhance the energy performance of the vehicle under low-temperature conditions.

6. Conclusions

(1)
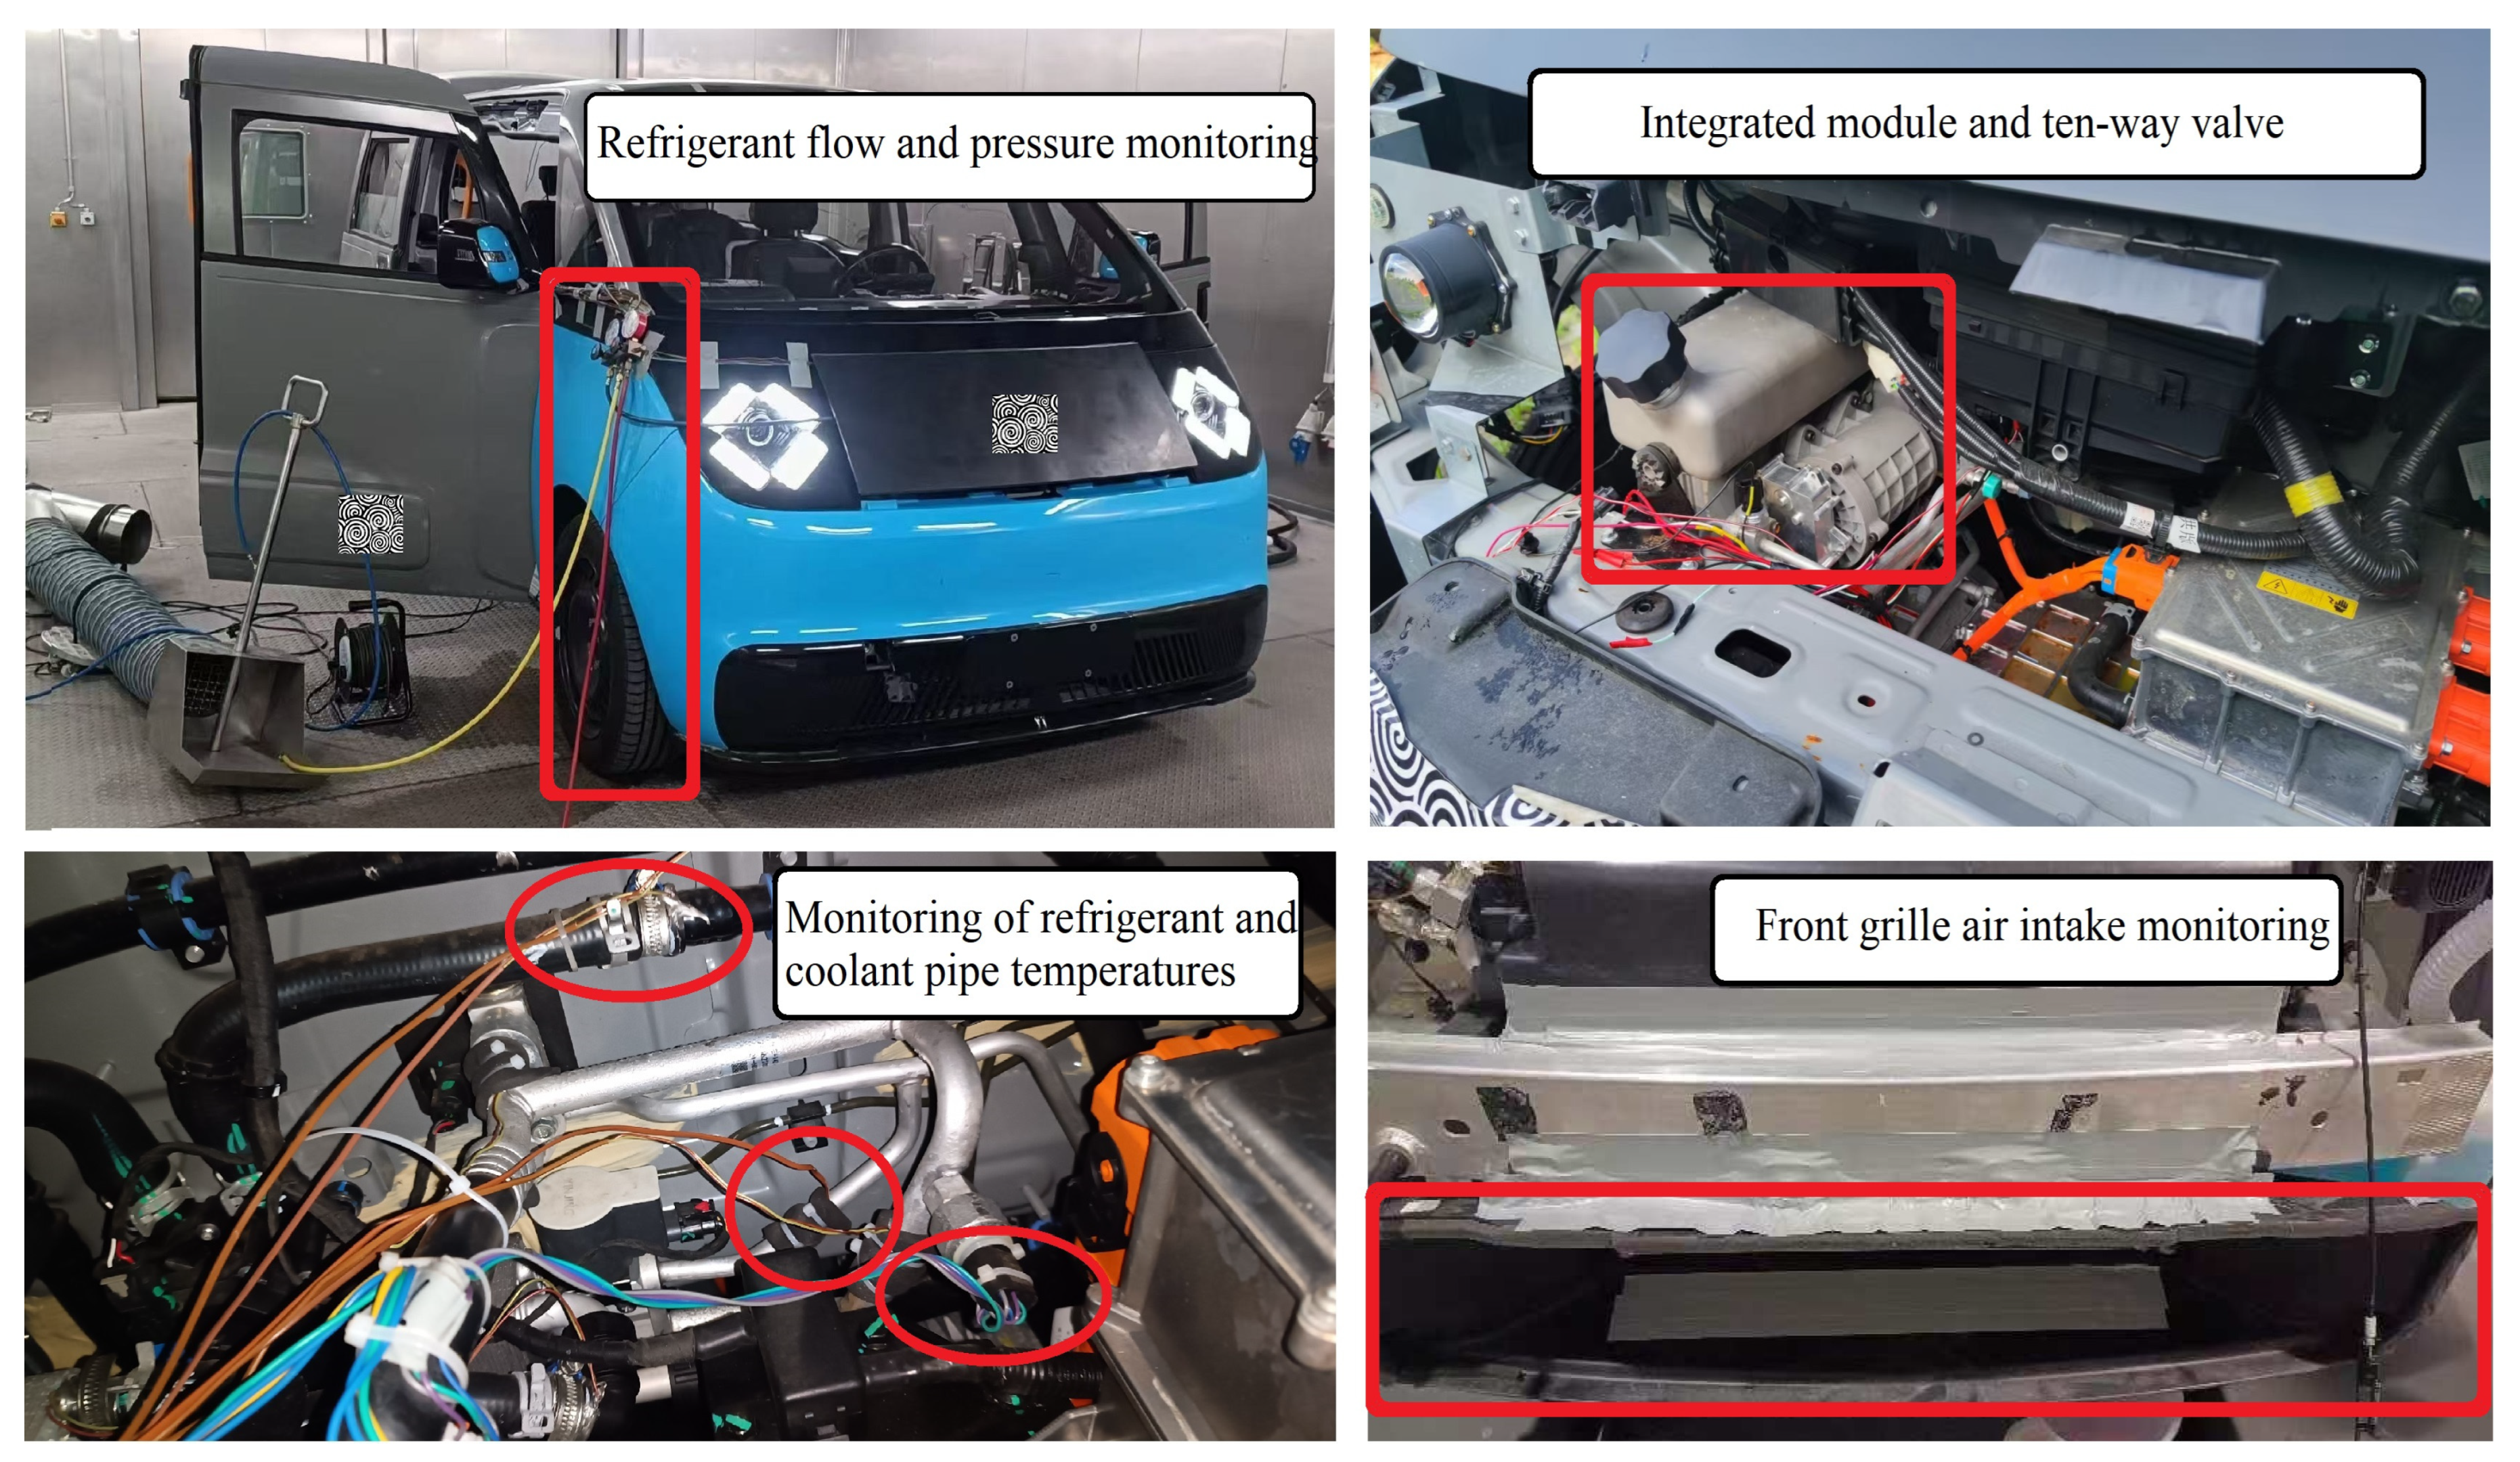
A novel, highly integrated TMS based on a 10-way valve with 6 working modes is proposed, which can eliminate the need for multiple valves and plate heat exchangers, offering improved energy efficiency, optimized control logic, space savings, and precise temperature regulation.
(2)
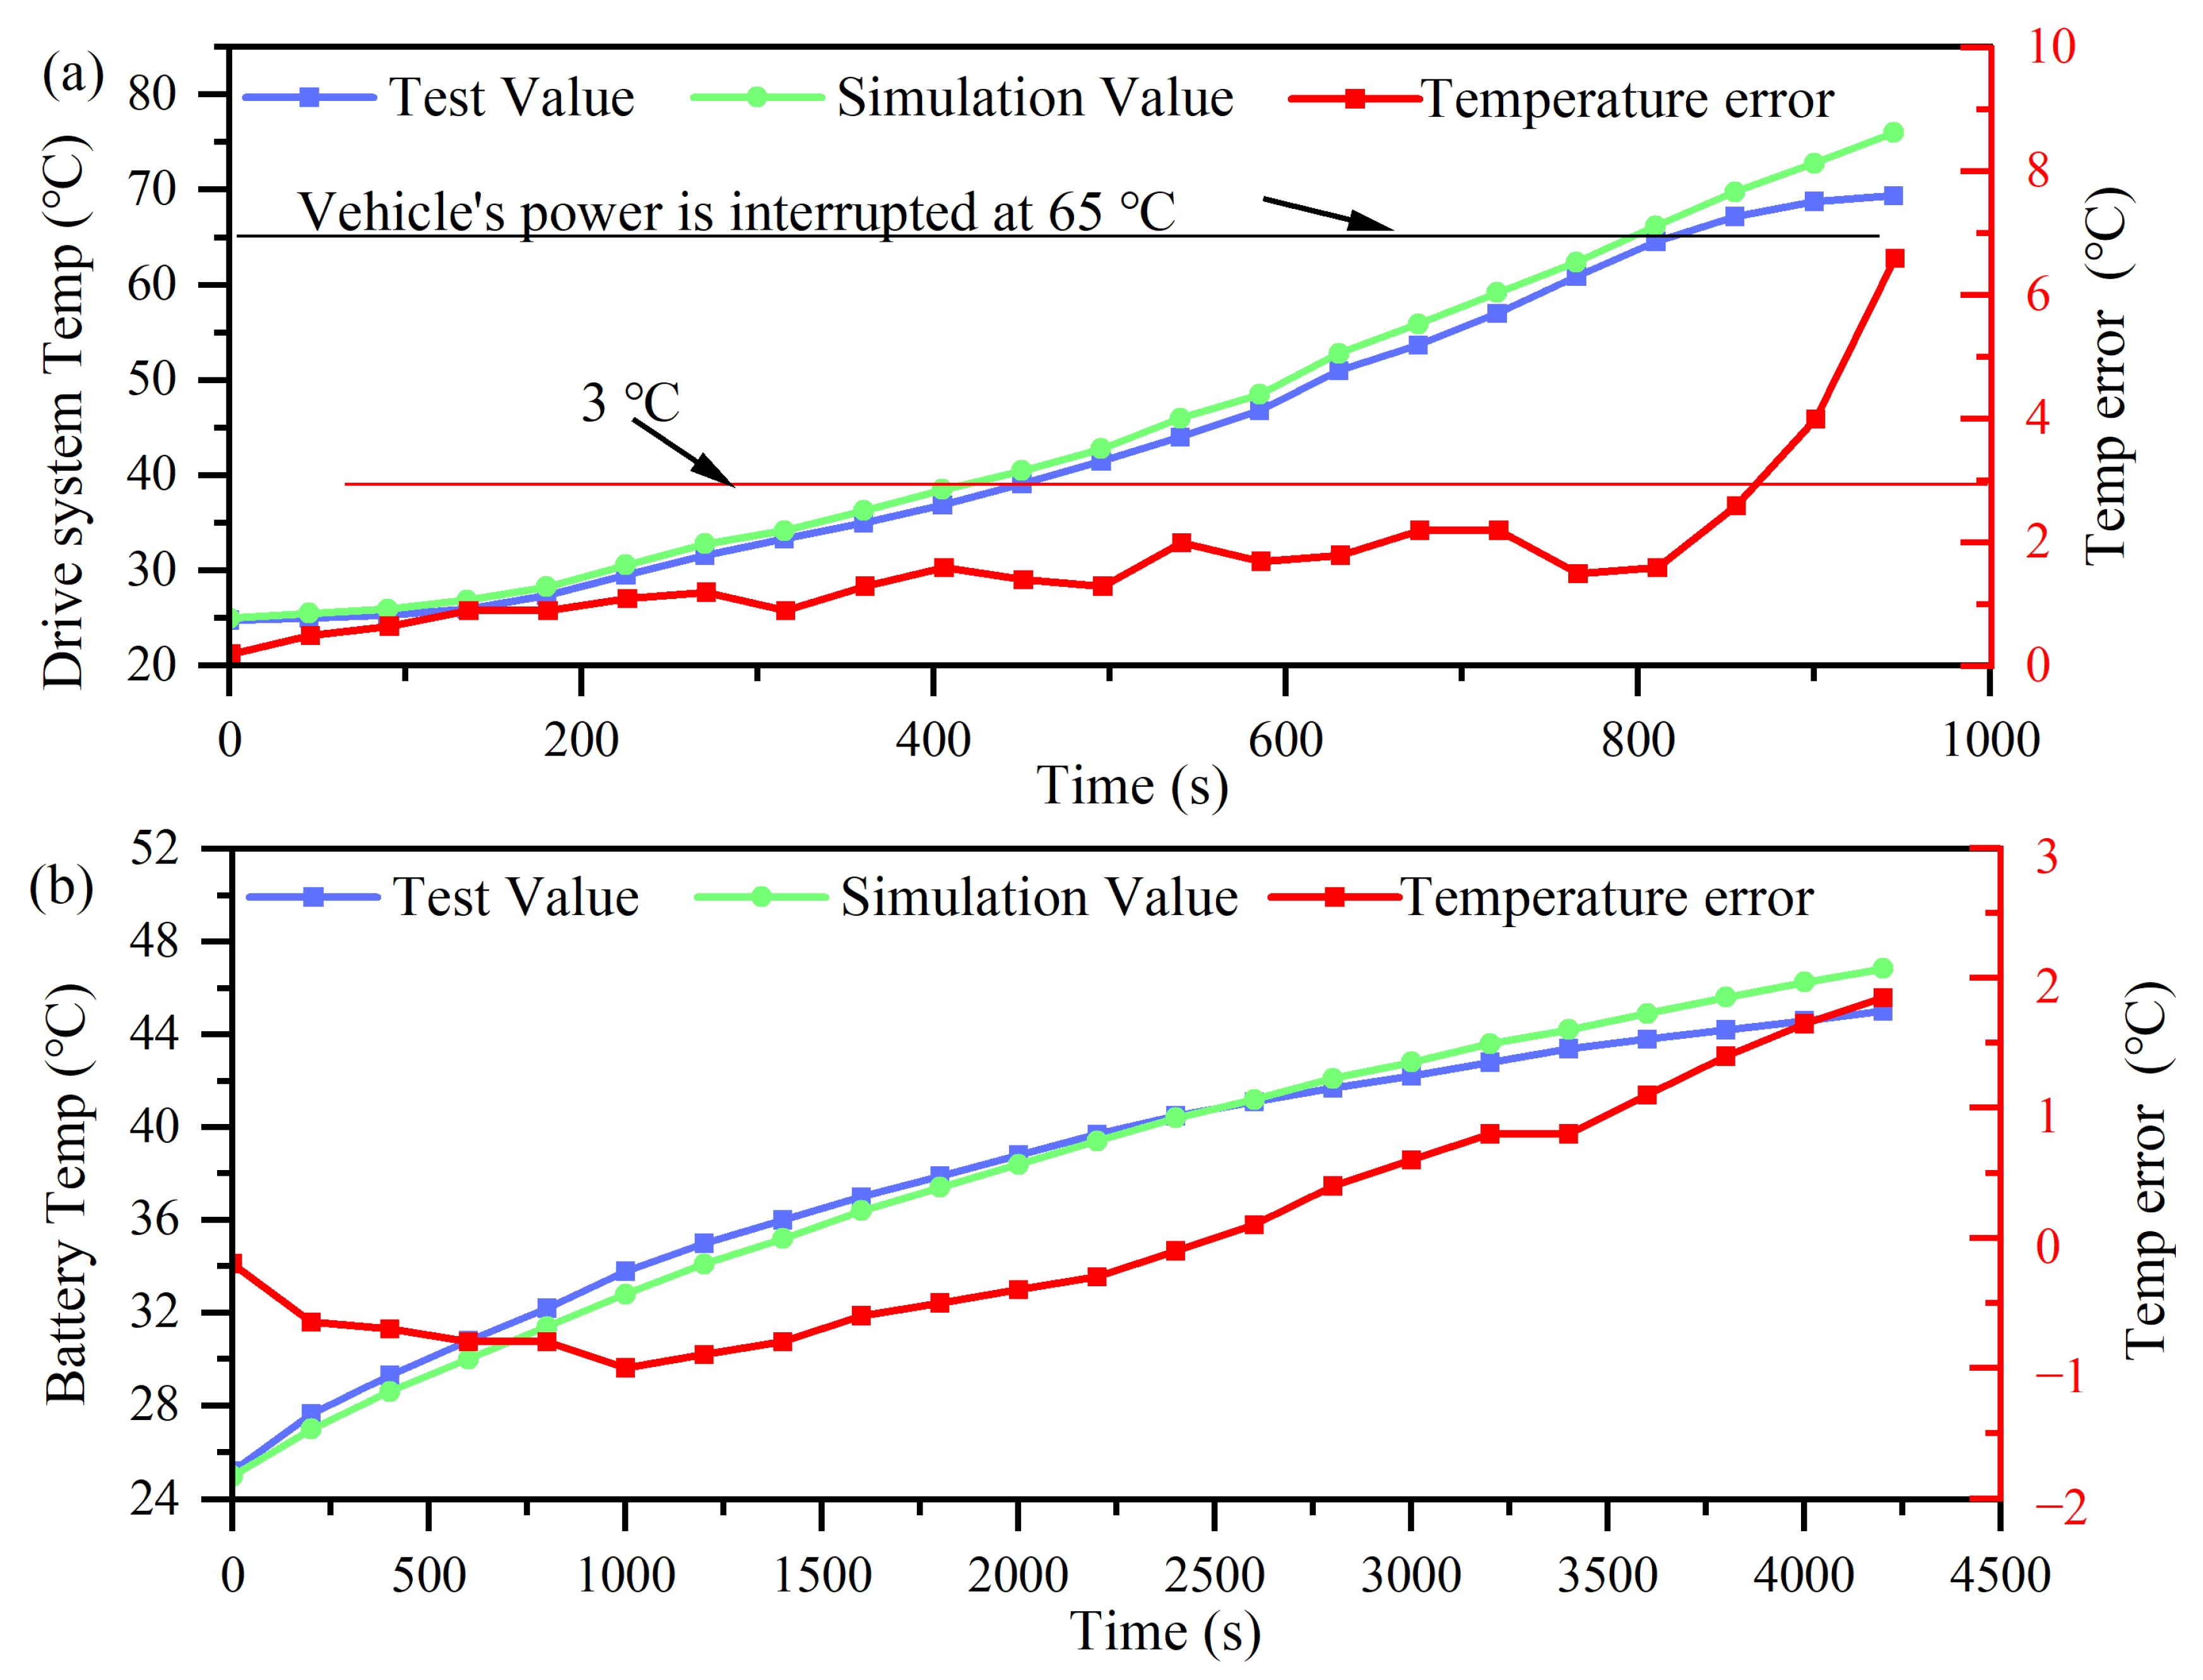
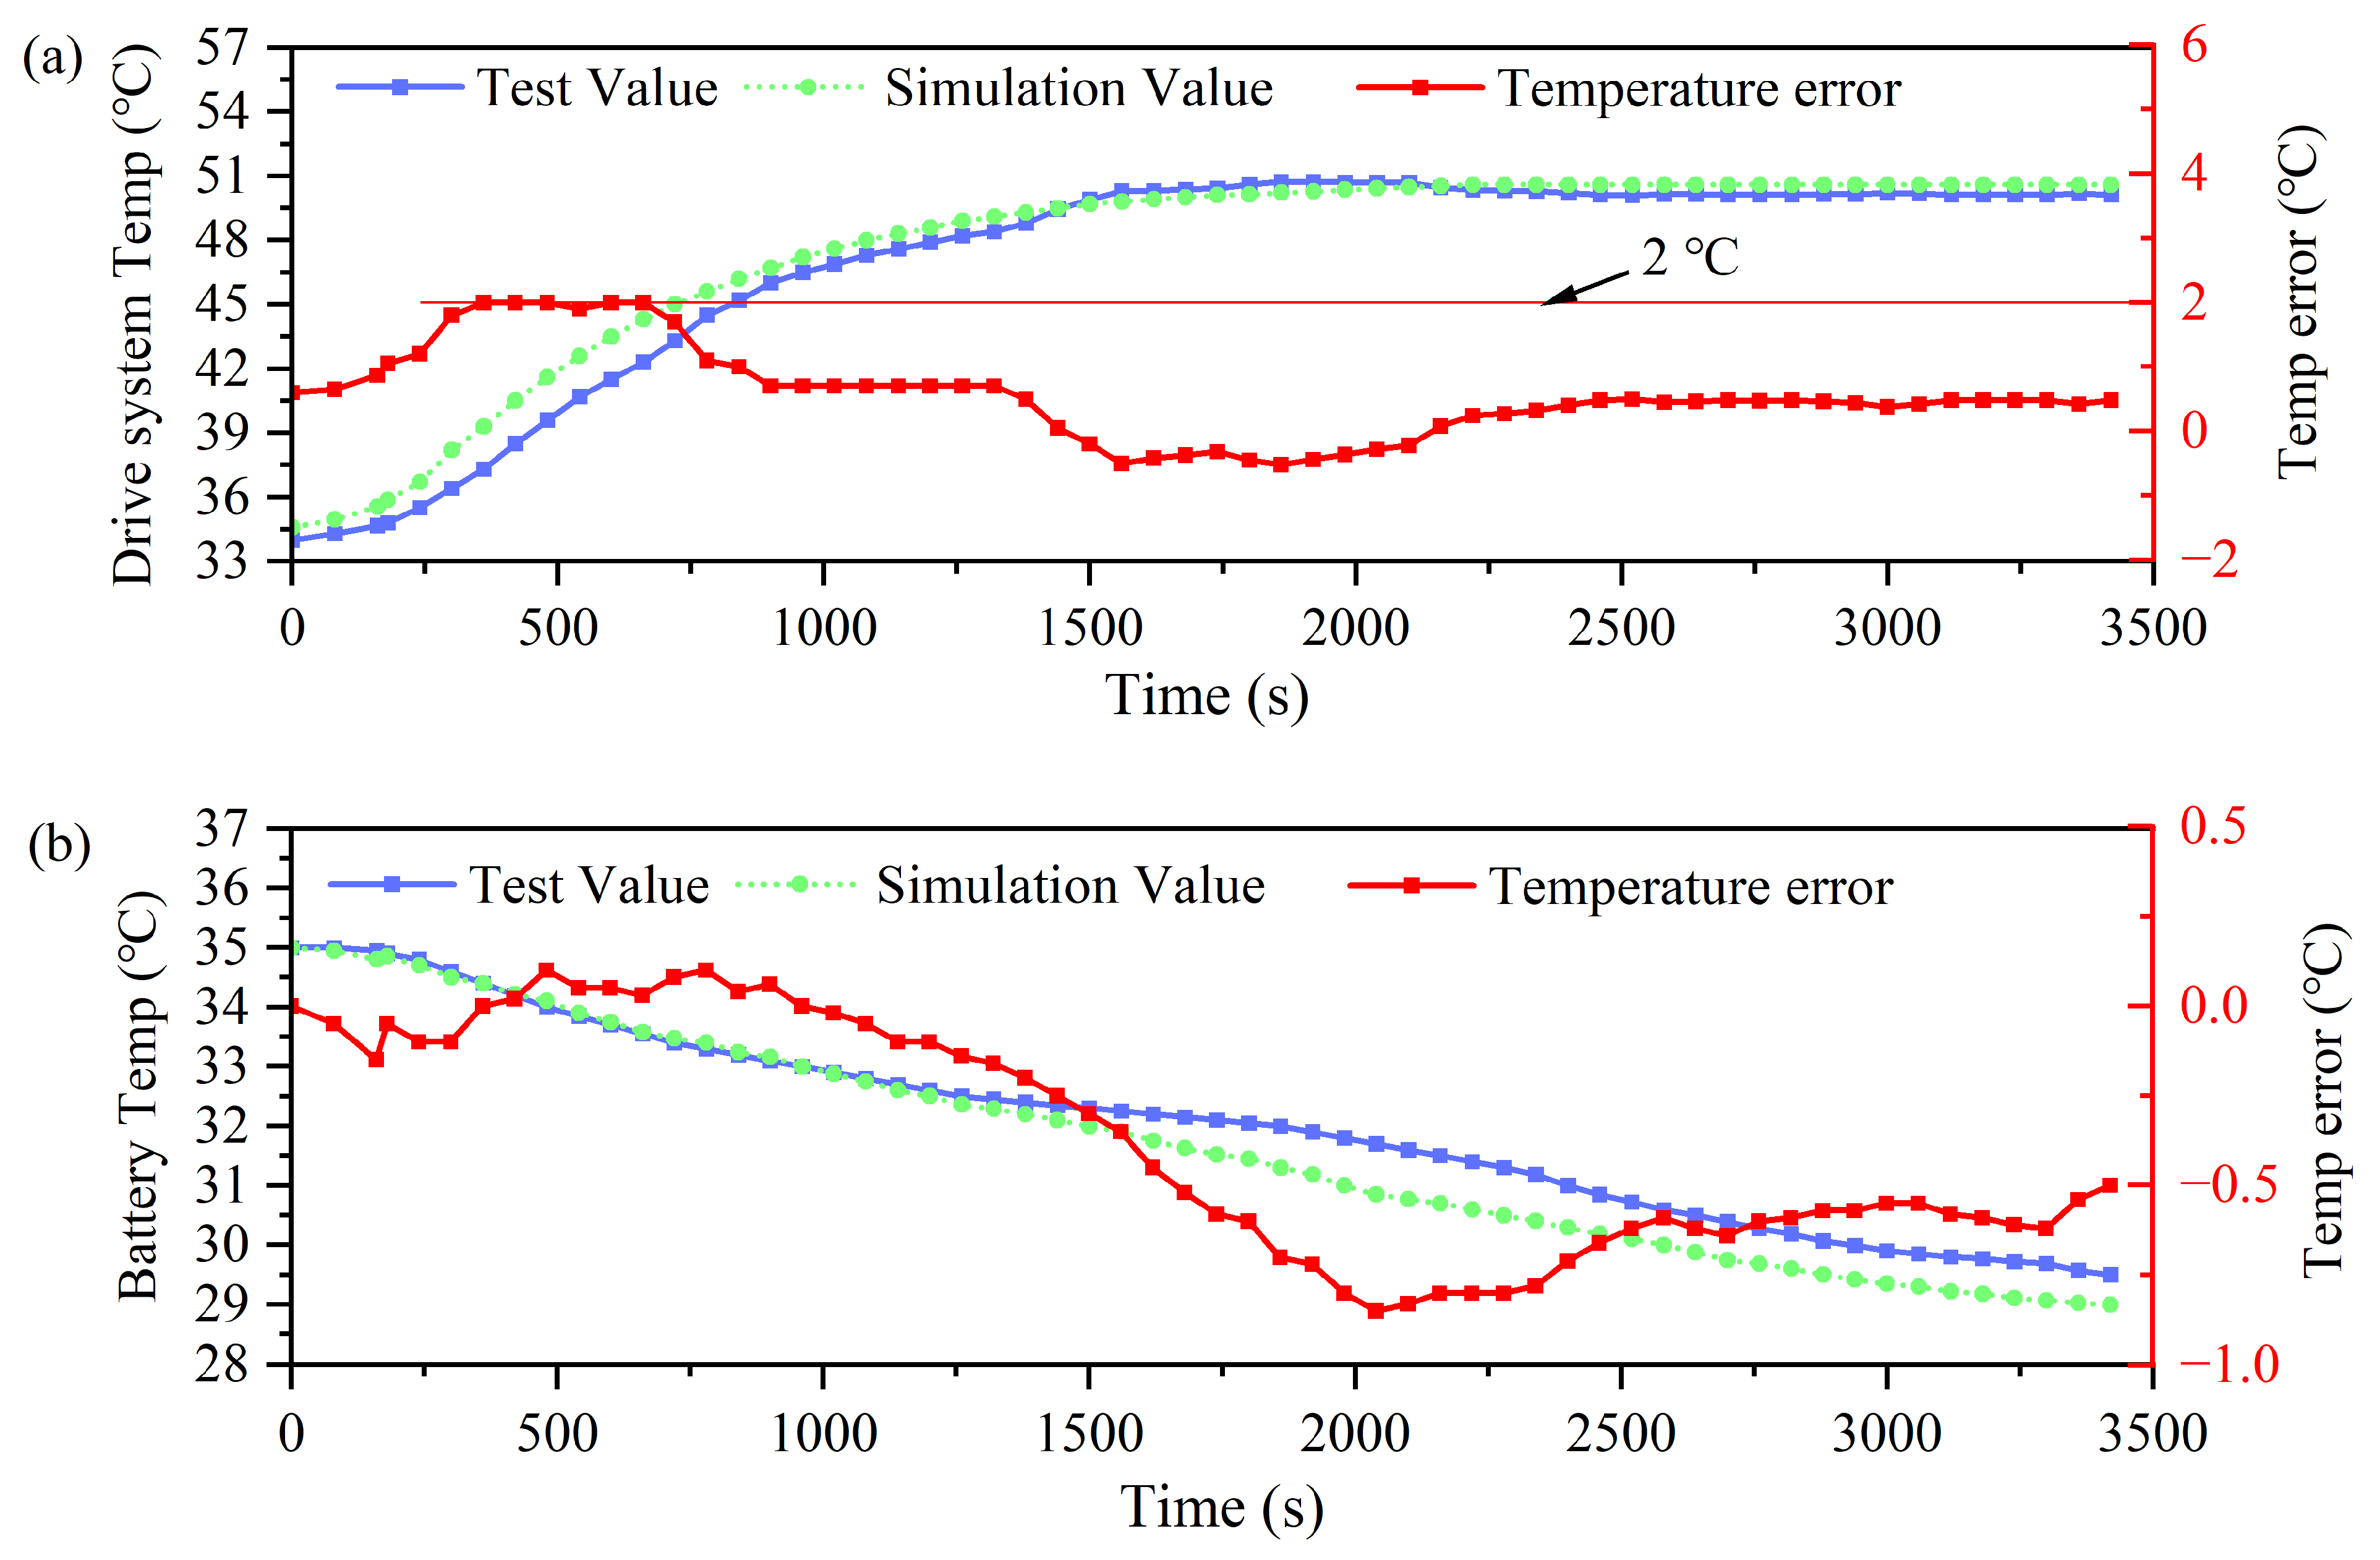
An integrated TMS architecture simulation model was employed based on the AMEsim2304 platform, and the accuracy of the model was validated through comparative analysis with laboratory and environmental chamber test results. The condenser heat transfer system simulation errors can be controlled below 5%, the heating characteristics system (including battery system and drive system) deviations are within 3 °C, and thermal management characteristics system errors are less than 2 °C.
(3)
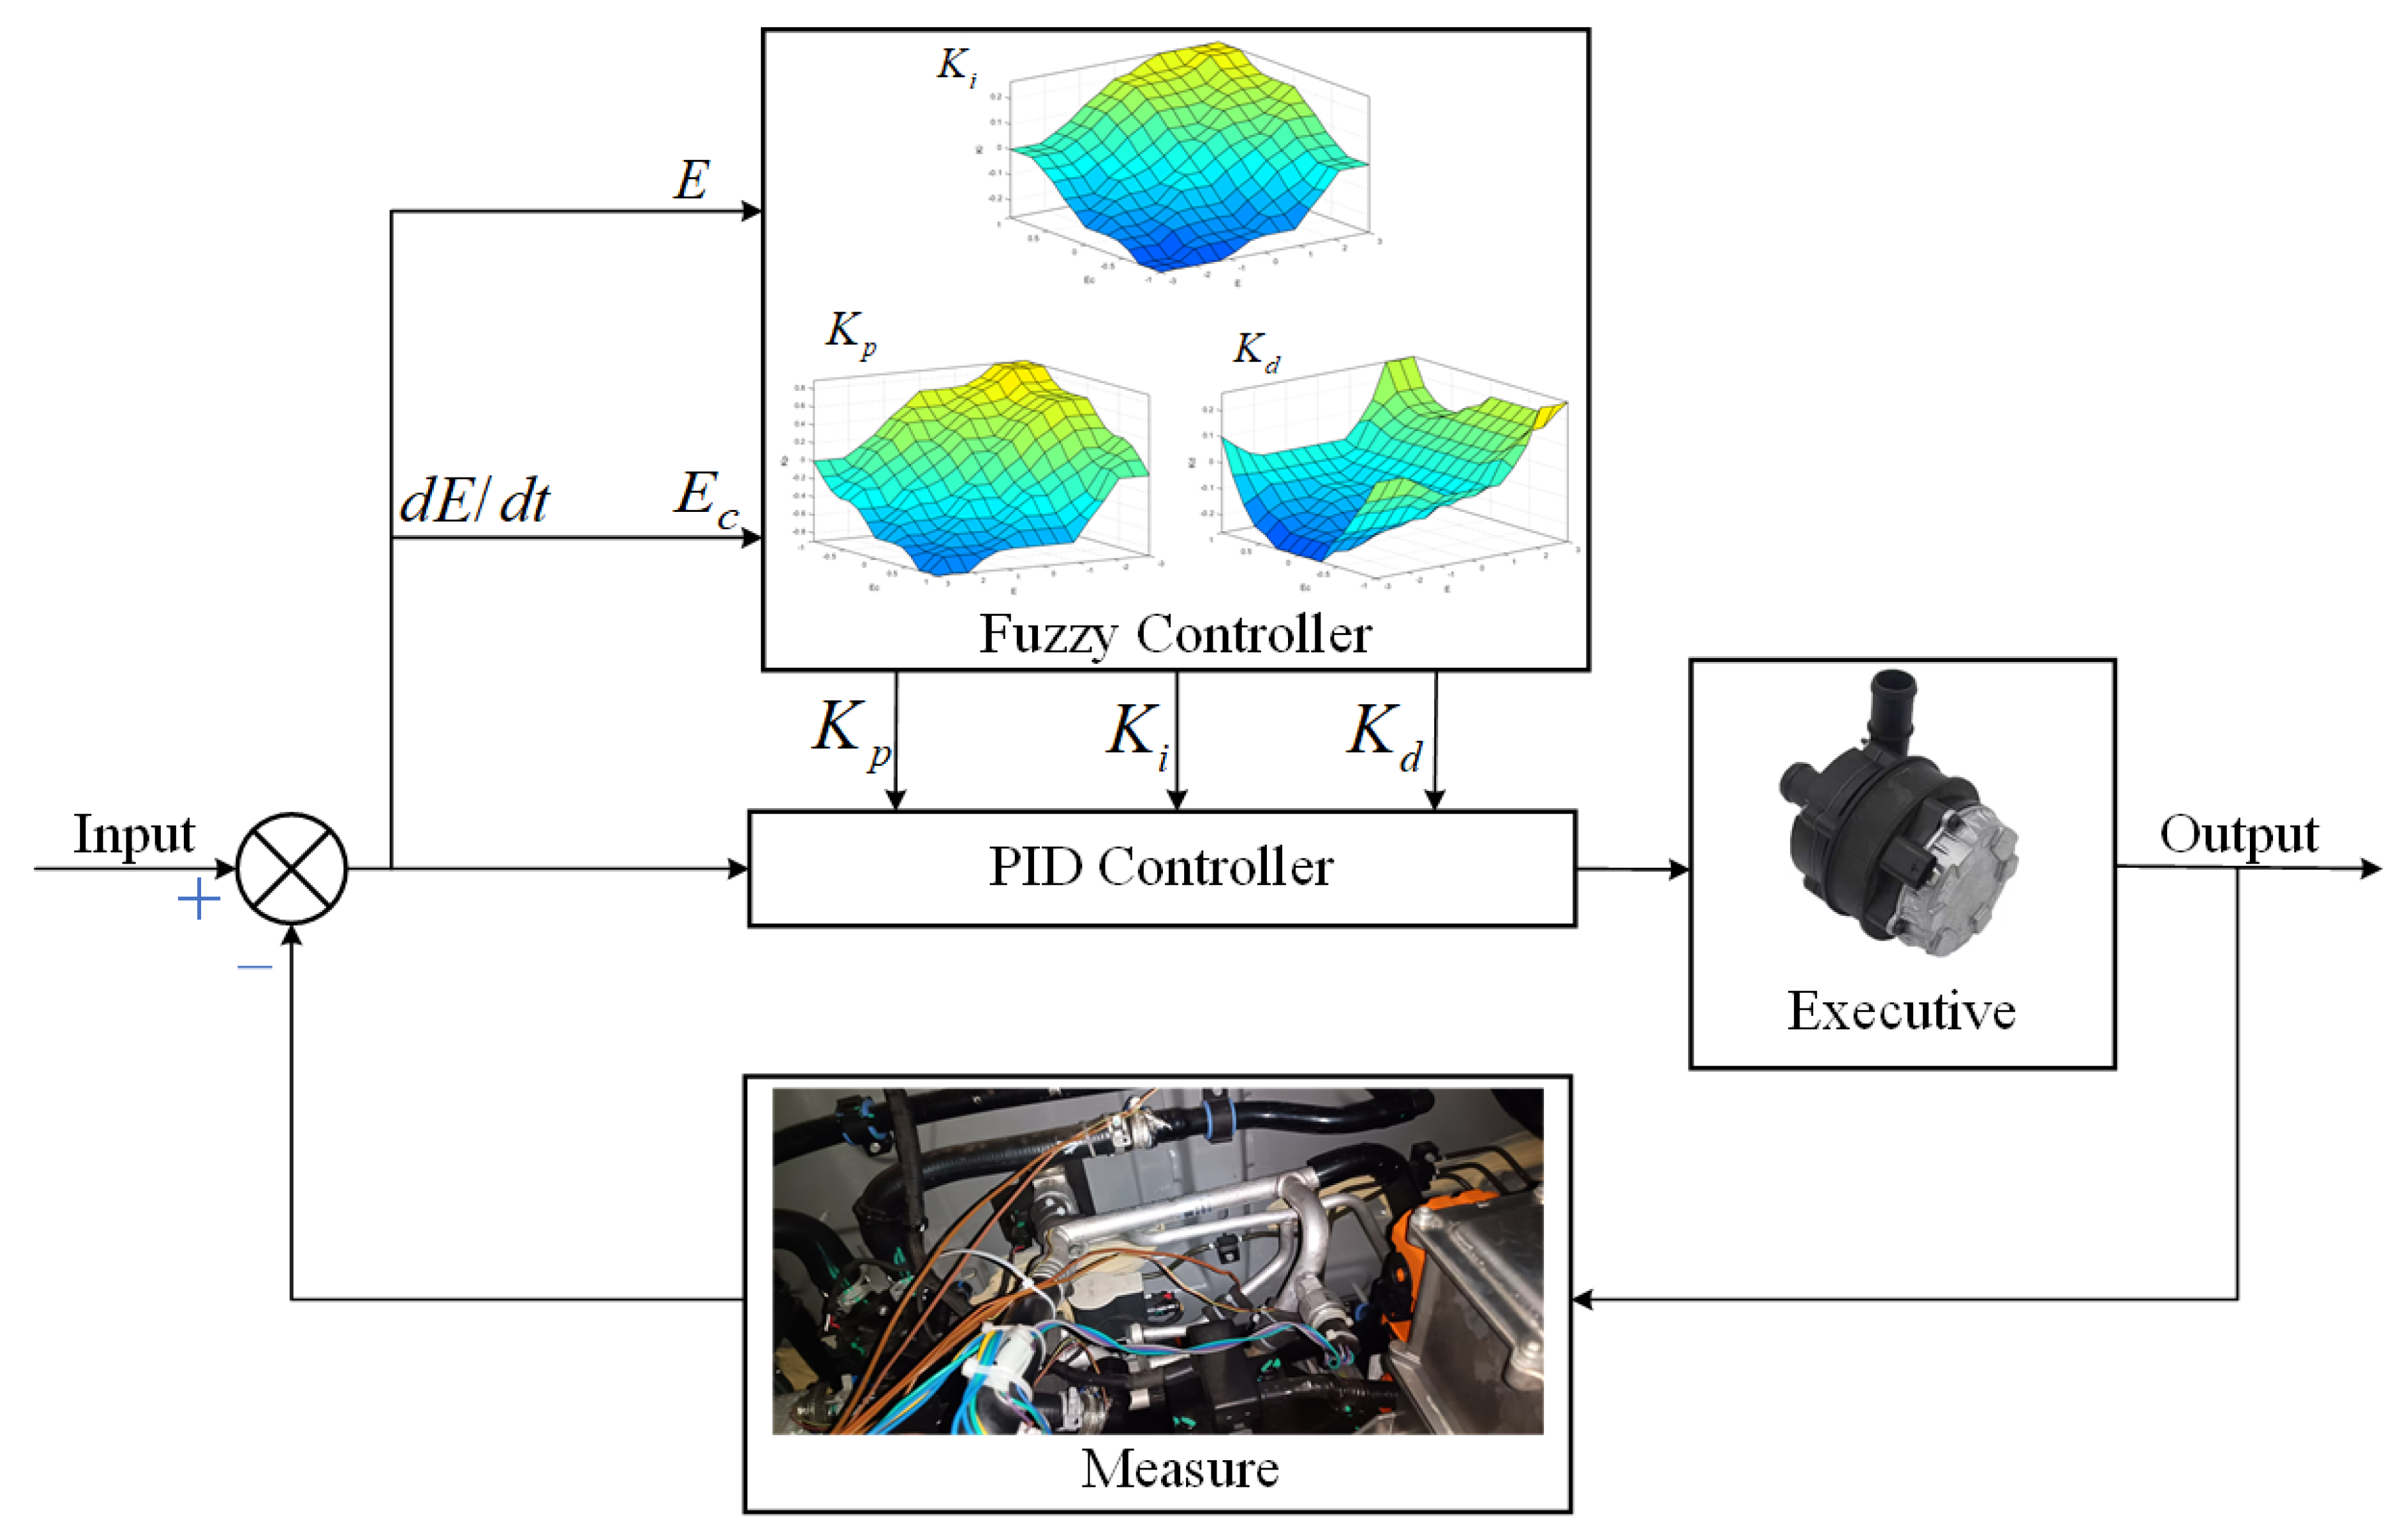
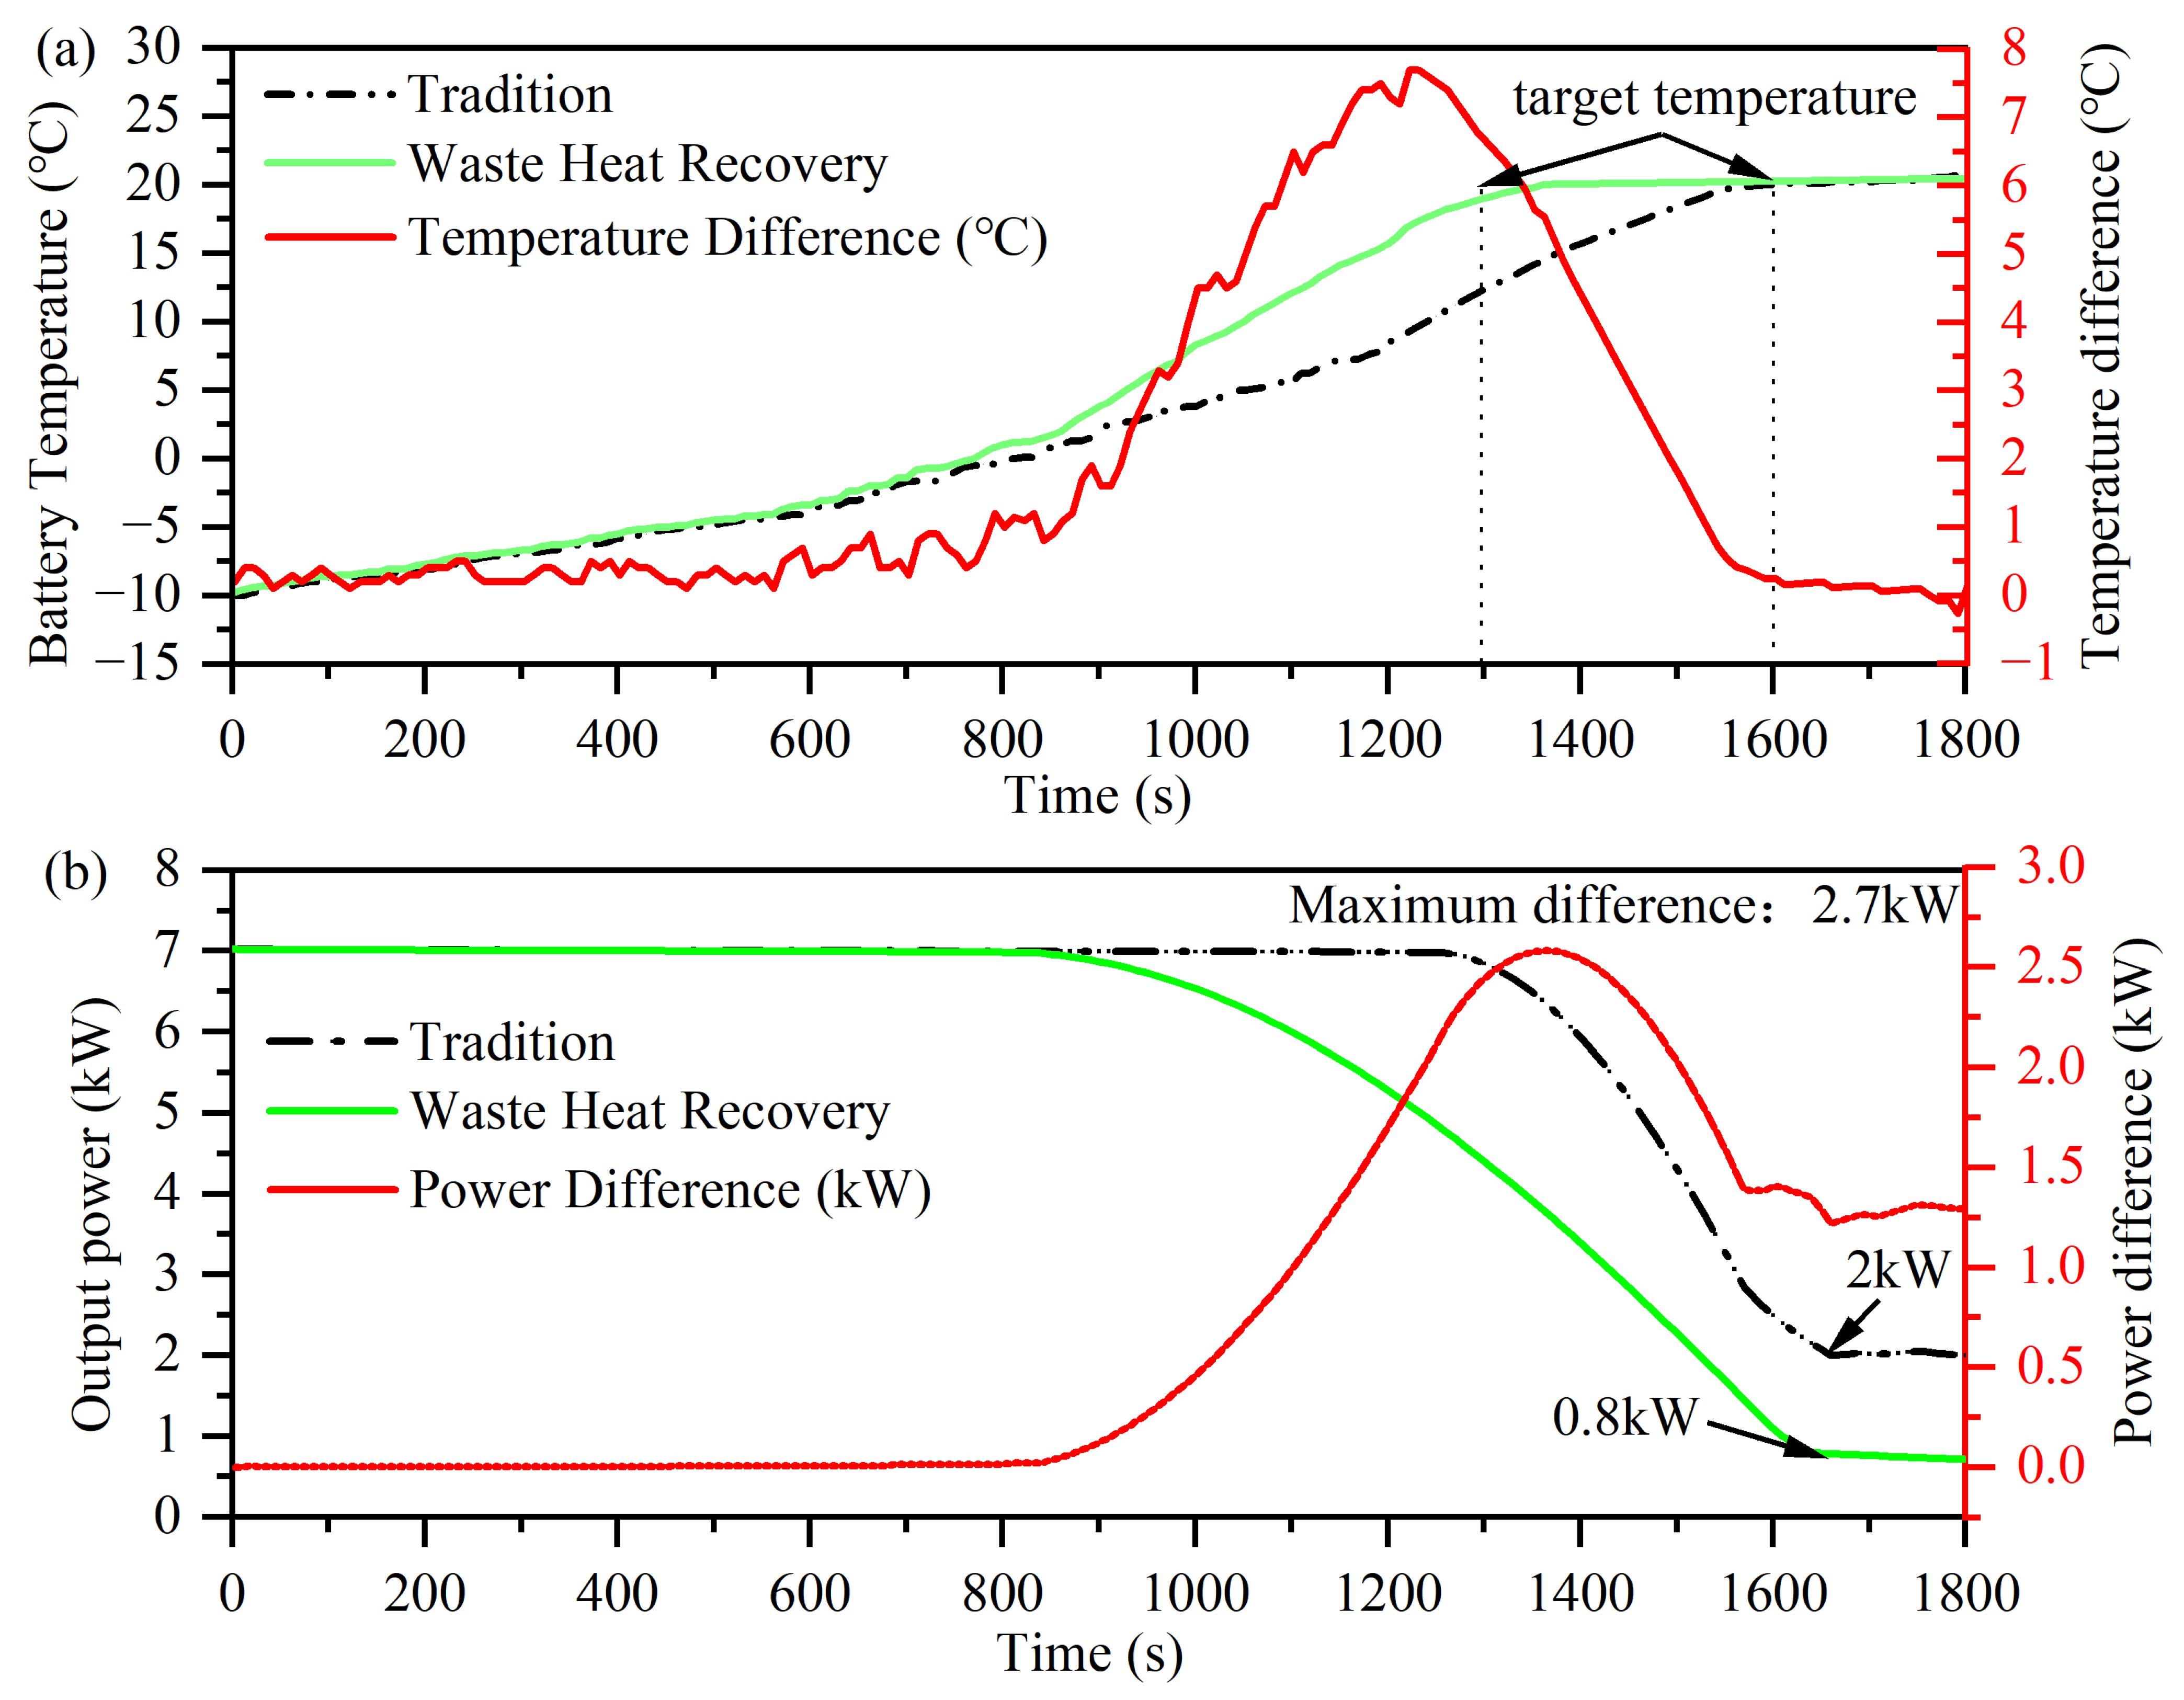
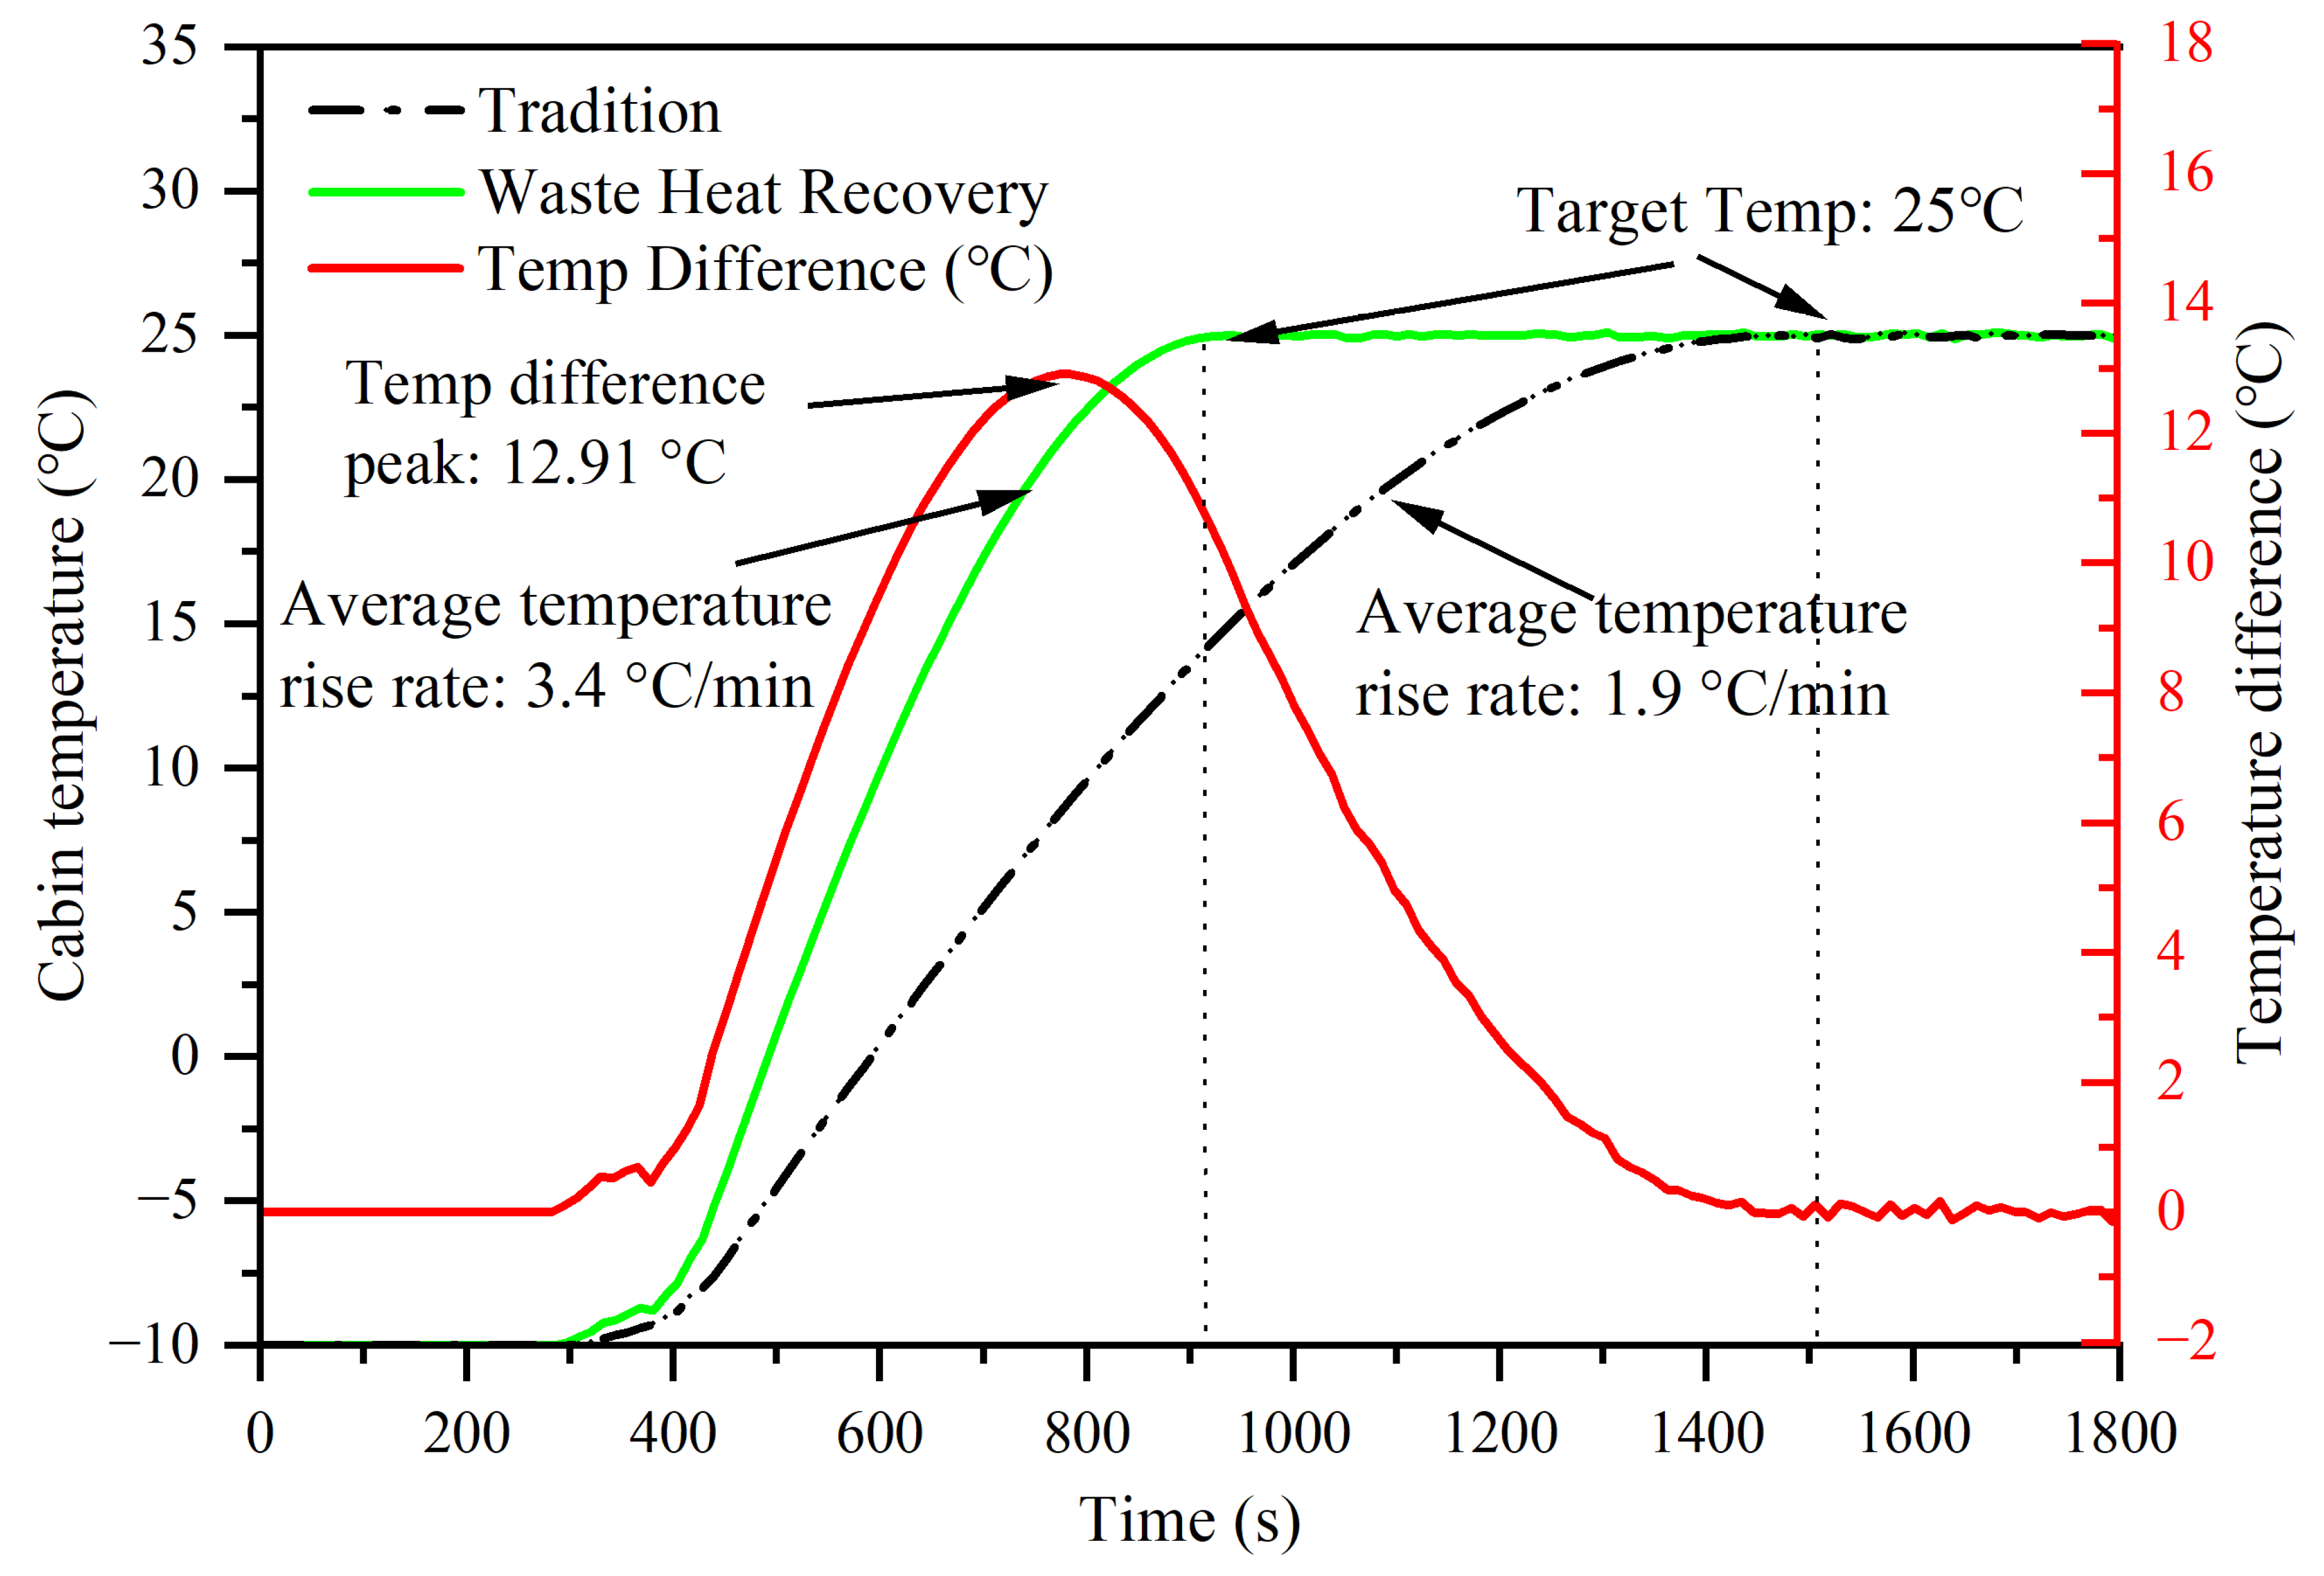
A classical control strategy based on fuzzy PID was introduced to regulate the electronic water pump, which could significantly improve system efficiency and reduce system energy consumption. Comparative tests under −10 °C conditions showed substantial improvements: a 300 s reduction in battery heating time to 20 °C, a 43.7% increase in the cabin temperature rise rate, and a 10% decrease in HVCH heating energy consumption compared to traditional systems.

Author Contributions

W.L.: Investigation, Data curation, and Writing—Original draft preparation. Q.Y.: Conceptualization, Methodology, Software, and Writing—Reviewing and Editing. L.X. and X.L.: Conceptualization and Writing—Reviewing and Editing. All authors have read and agreed to the published version of the manuscript.

Funding

The study was funded by the National Key R&D Program of China (2022YFD2001203).

Data Availability Statement

Data is contained within the article.

Conflicts of Interest

The authors declare no conflicts of interest.

References

  1. Cao, Y.; Liang, C.; Cheng, S.; Yin, X.; Chen, D.; Liu, Z.; Sun, C.; Chen, T. Predictive Energy Management Strategy for Heavy-Duty Series Hybrid Electric Vehicles Based on Drive Power Prediction. World Electr. Veh. J. 2025, 16, 186. [Google Scholar] [CrossRef]
  2. Xu, F.; Tan, K.Y. Optimal decisions of closed-loop electric vehicle batteries supply chains under extended producer responsibility policies. Int. J. Syst. Sci.-Oper. Logist. 2025, 12, 2437153. [Google Scholar] [CrossRef]
  3. Bai, Z.P.; Yu, Y.Y.; Zhang, J.Y.; Hu, H.M.; Xing, M.Y.; Yao, H.W. Study on Fire Characteristics of Lithium Battery of New Energy Vehicles in a Tunnel. Process Saf. Environ. Prot. 2024, 186, 728–737. [Google Scholar] [CrossRef]
  4. Guo, R.; Miao, Q.; Xu, Y. Review of Graphene Applications in Electric Vehicle Thermal Management Systems. World Electr. Veh. J. 2025, 16, 166. [Google Scholar] [CrossRef]
  5. Lin, Y.H.; Hung, Y.H. Integrated thermal and energy management systems using particle swarm optimization for energy optimization in electric vehicles. Case Stud. Therm. Eng. 2025, 71, 106136. [Google Scholar] [CrossRef]
  6. Wang, Q.; Jiang, B.; Li, B.; Yan, Y. A Critical Review of Thermal Management Models and Solutions of Lithium-Ion Batteries for the Development of Pure Electric Vehicles. Renew. Sustain. Energy Rev. 2016, 64, 106–128. [Google Scholar] [CrossRef]
  7. Bahiraei, F.; Ghalkhani, M.; Fartaj, A.; Nazri, G. Electrochemical–Thermal Evaluation of an Integrated Thermal Management System for Lithium-Ion Battery Modules. Adv. Theory Simul. 2018, 1, 201800021. [Google Scholar] [CrossRef]
  8. Hong, J.; Song, J.; Han, U.; Kim, H.; Choi, H.; Lee, H. Performance Investigation of Electric Vehicle Thermal Management System with Thermal Energy Storage and Waste Heat Recovery Systems. eTransportation 2024, 20, 100317. [Google Scholar] [CrossRef]
  9. Wei, C.; Hofman, T.; Caarls, E.I.; Van Iperen, R. Evolution and Classification of Energy and Thermal Management Systems in Electrified Powertrains. In Proceedings of the 2019 IEEE Vehicle Power and Propulsion Conference, VPPC 2019—Proceedings, Hanoi, Vietnam, 14–17 October 2019; Institute of Electrical and Electronics Engineers Inc.: Piscataway, NJ, USA, 2019. [Google Scholar]
  10. Popescu, M.; Staton, D.; Boglietti, A.; Cavagnino, A.; Hawkins, D.; Goss, J. Modern Heat Extraction Systems for Electrical Machines—A Review. In Proceedings of the 2015 IEEE Workshop on Electrical Machines Design, Control and Diagnosis, WEMDCD 2015, Turin, Italy, 26–27 March 2015; Institute of Electrical and Electronics Engineers Inc.: Piscataway, NJ, USA, 2015; pp. 289–296. [Google Scholar]
  11. Lajunen, A.; Yang, Y.; Emadi, A. Review of Cabin Thermal Management for Electrified Passenger Vehicles. IEEE Trans. Veh. Technol. 2020, 69, 6025–6040. [Google Scholar] [CrossRef]
  12. Marshall, G.J.; Mahony, C.P.; Rhodes, M.J.; Daniewicz, S.R.; Tsolas, N.; Thompson, S.M. Thermal Management of Vehicle Cabins, External Surfaces, and Onboard Electronics: An Overview. Engineering 2019, 5, 954–969. [Google Scholar] [CrossRef]
  13. Liang, K.F.; Zhang, Y.P.; Wang, W.B.; Gao, C.Y.; Chen, H.Y.; Li, K.; Zhou, X.; Chen, B.; Cao, Y.; Wang, W.M.; et al. Performance Analysis and Multi-Objective Optimization of Refrigerant-Based Integrated Thermal Management System for Electric Vehicles. Appl. Therm. Eng. 2024, 244, 122707. [Google Scholar] [CrossRef]
  14. Dan, D.; Zhao, Y.; Wei, M.; Wang, X. Review of Thermal Management Technology for Electric Vehicles. Energies 2023, 16, 4693. [Google Scholar] [CrossRef]
  15. Zhan, J.; Deng, Y.; Ren, J.; Gao, Y.; Liu, Y.; Rao, S.; Li, W.; Gao, Z. Cell Design for Improving Low-Temperature Performance of Lithium-Ion Batteries for Electric Vehicles. Batteries 2023, 9, 373. [Google Scholar] [CrossRef]
  16. Jaguemont, J.; Boulon, L.; Dubé, Y. A Comprehensive Review of Lithium-Ion Batteries Used in Hybrid and Electric Vehicles at Cold Temperatures. Appl. Energy 2016, 164, 99–114. [Google Scholar] [CrossRef]
  17. Ma, J.; Sun, Y.; Zhang, S.; Li, J.; Li, S. Experimental Study on the Performance of Vehicle Integrated Thermal Management System for Pure Electric Vehicles. Energy Convers. Manag. 2022, 253, 115183. [Google Scholar] [CrossRef]
  18. Zhang, L.; Yuan, Q.; Hu, S.; Xu, X. Research on Performance of Thermal Management System Integrated with Multiple Heat Exchange Methods. Ionics 2022, 28, 789–799. [Google Scholar] [CrossRef]
  19. Lian, Y.; Ling, H.; Zhu, J.; Lv, J.; Xie, Z. Thermal Management Optimization Strategy of Electric Vehicle Based on Dynamic Programming. Control Eng. Pract. 2023, 137, 105562. [Google Scholar] [CrossRef]
  20. Li, K.; Liu, Q.; Hu, Y.; Gao, J.; Chen, H. A Coupling Thermal Management Strategy Based on Fuzzy Control for a Range Extended Electric Vehicle Power System. IEEE Trans. Veh. Technol. 2022, 71, 2573–2586. [Google Scholar] [CrossRef]
  21. Liu, Y.; Liang, Y.K.; Yu, H.Z.N.; An, X.P.; Li, J.Y. Comparative Analysis of China Light-duty Vehicle Test cycle for Passenger Car and Other Typical Driving Cycles. E3S Web Conf. 2021, 241, 02002. [Google Scholar] [CrossRef]
  22. Inoue, K.; Okada, N.; Kiyose, H.; Kato, T. Numerical Design Methodology of Optimal Trajectories for Efficient Induction Motor Drive based on a Loss Map. In Proceedings of the 2013 IEEE Energy Conversion Congress and Exposition, Denver, CO, USA, 15–19 September 2013; pp. 3154–3158. [Google Scholar]
  23. Aarniovuori, L.; Laurila, L.I.E.; Niemela, M.; Pyrhonen, J.J. Measurements and Simulations of DTC Voltage Source Converter and Induction Motor Losses. IEEE Trans. Ind. Electron. 2012, 59, 2277–2287. [Google Scholar] [CrossRef]
  24. Zhang, S. Application of Fuzzy PID Control in Motor Test; Atlantis Press: Dordrecht, The Netherlands, 2017. [Google Scholar]
  25. Lee, C.C. Fuzzy Logic in Control Systems: Fuzzy Logic Controller—Part I. IEEE Trans. Syst. Man Cybern. 1990, 20, 404–418. [Google Scholar] [CrossRef]
  26. ISO 16750-4:2010; International Organization for Standardization. Road Vehicles—Environmental Conditions and Testing for Electrical and Electronic Equipment—Part 4: Climatic Loads. ISO: Geneva, Switzerland, 2010.
Figure 1. Traditional thermal management architecture. (The blue curves and arrows indicate the refrigerant flow path within the refrigerant-side circuit; the red lines and arrows represent the coolant flow path of the passenger compartment heating circuit; the green lines and arrows denote the coolant flow path for the power battery; and the black lines and arrows illustrate the coolant flow path of the electric drive system).
Wevj 16 00298 g001
Figure 2. Integrated thermal management architecture and the heat flow in the waste heat recovery mode: (a) Integrated thermal management architecture. (b) Heat flow in the waste heat recovery mode. (The blue lines and arrows denote the refrigerant flow path in the refrigeration circuit, while the green, red, and black lines and arrows indicate the coolant flow paths and directions).
Wevj 16 00298 g002
Figure 3. Vehicle thermal management simulation model based on the AMEsim2304 platform. (The solid lines denote the flow paths of coolant and refrigerant, while the dashed lines represent the electrical wires and signal connections).
Wevj 16 00298 g003
Figure 4. Maps of component parameters: (a) Battery discharge internal resistance map. (b) Efficiency of drive system. (c) Pump pressure characteristic curve. (d) Cooling capacity parameters of the compressor.
Wevj 16 00298 g004
Figure 5. Test and simulation results of condenser heat transfer.
Wevj 16 00298 g005
Figure 6. Test and simulation results of the heating characteristics system: (a) Drive system temperature rise. (b) Battery temperature rise.
Wevj 16 00298 g006
Figure 7. Thermal management characteristics test layout. (The annotations with black characters on a white background in the picture are the annotations with red boxes and circles.)
Wevj 16 00298 g007
Figure 8. Test and simulation results of the thermal management characteristics system: (a) Drive system temperature increase. (b) Battery temperature decrease.
Wevj 16 00298 g008
Figure 9. The structure of fuzzy PID.
Wevj 16 00298 g009
Figure 10. Results of battery and HVCH tests under low temperature conditions: (a) Changes of power battery temperature. (b) Changes of HVCH heating power.
Wevj 16 00298 g010
Figure 11. Result of cabin heating test under low temperature conditions.
Wevj 16 00298 g011
Table 1. The heat exchanger verifies the operating condition setting.
Working ConditionAir Speed (m/s)Inlet Dry Bulb Temperature (°C)Inlet Pressure (Mpa)Degree of Supercooling (°C)Degree of Superheat (°C)
11.8035.061.6065.5324.49
21.5040.071.4955.6825.33
32.5040.061.4955.9725.24
43.0040.021.4984.5824.77
53.5040.021.4905.4424.81
64.0040.011.4875.4624.38
Table 2. Energy consumption performance under low temperature conditions.
Performance ParameterTraditionWaste Heat RecoverySave Energy
Consumption (%)
TMS heating energy consumption (kWh)32.710% (±1.7%)
Disclaimer/Publisher’s Note: The statements, opinions and data contained in all publications are solely those of the individual author(s) and contributor(s) and not of MDPI and/or the editor(s). MDPI and/or the editor(s) disclaim responsibility for any injury to people or property resulting from any ideas, methods, instructions or products referred to in the content.

