1. Introduction
Transportation methods have transformed global travel and connectivity. Since the advent of combustion engine vehicles (CEVs), the movement of people and goods over long distances has become faster and more efficient. However, these vehicles have contributed significantly to both air and noise pollution. Emissions from CEVs are associated with numerous health and environmental issues [
1]. Road transportation is a significant contributor to carbon dioxide emissions, with cars being a major source due to their heavy reliance on fossil fuels [
2,
3]. This environmental impact has spurred the rising popularity of electric vehicles (EVs), prompting traditional CEV manufacturers to shift their focus towards EV production and promotion. Additionally, various countries have supported the adoption of EVs through policies and financial incentives, accelerating their integration into the market.
The growing adoption of EVs is expected to have a substantial impact on the power grid. While EVs offer environmental benefits by reducing greenhouse gas emissions and enhancing air quality, they also increase electricity demand [
4]. This heightened demand could lead to grid congestion during peak charging periods, potentially causing instability and even blackouts. However, the challenges posed by EV integration can be alleviated through the use of smart charging and vehicle-to-grid (V2G) technology. Smart charging optimizes the timing of EV charging by shifting it to off-peak hours, when electricity demand is lower, while V2G technology enables EVs to supply power back to the grid during times of high demand [
5]. These technologies enhance grid stability, bolster resilience, and facilitate the integration of renewable energy sources [
6]. As EV adoption grows, it becomes crucial for the power industry to develop innovative strategies to maintain a stable and sustainable grid. Research has already explored areas such as voltage deviations, power system losses, increased peak demand, grid overloads, and harmonics [
7,
8,
9].
Several studies have been conducted to assess the impact of EVs on modern power systems. In [
10], the authors examine how various levels of EV penetration affect power losses, voltage stability, reliability, and economic losses in distribution networks, focusing on the location of charging stations to reduce these impacts. When too many EVs connect to the grid at once, it can cause issues such as congestion and voltage drops, as distribution grids are designed for a specific load. If a large number of EVs connect simultaneously, system security may be compromised and the grid might fail to return to normal levels before significant damage occurs [
11]. In [
12], the authors perform a sensitivity analysis using Monte Carlo simulations to evaluate the effects of high EV penetration, considering factors like charger types, driving patterns, and grid configuration. Despite providing a comprehensive analysis, the study does not address voltage levels or propose solutions for the identified issues. In [
13], a study examines the impact of private EVs on residential electricity prices in Germany, showing that EVs can lower electricity costs for households. However, the study does not propose strategies to address the grid impacts caused by EVs. Rahman et al. [
14] review the integration of EV charging loads in low-voltage distribution systems, analyzing voltage profiles as EV penetration increases. They also discuss strategies to optimize grid performance, such as peak load management and increasing renewable energy penetration, but do not suggest solutions for mitigating the impacts of EVs.
There are various methods for modeling the penetration levels of EVs in power distribution networks, which can be divided into three main categories: deterministic approaches, data-driven approaches, and uncertainty-based approaches [
15,
16]. The first category includes measurement-based load-modeling techniques, such as the approach used in [
17], where a ZIP-based model is applied to estimate the load for EV fast-charging stations in AC distribution grids. The second category involves machine learning methods, like k-nearest neighbors [
18], linear regression [
19], and random forest [
20], which analyze large datasets to model the interaction between EVs and power systems. These data-driven methods rely on extensive data to simulate realistic charging behaviors. The third category focuses on approaches that account for the random behavior of EV users, including the use of various probability distributions (such as Gaussian [
21], Weibull [
22], and lognormal [
23]), stochastic processes [
24], and Monte Carlo simulations [
12]. While all three approaches offer innovative ways to assess the impacts of EVs on distribution networks, data-driven and uncertainty-based methods require significant amounts of data and are computationally demanding. For these reasons, polynomial-based load models, such as ZIP-based methods, offer a promising alternative for analyzing the impact of EVs on distribution systems. Considering the ZIP-based methods, the authors of [
25] evaluate the impact of EVs on Curaçao’s power grid, analyzing congestion and voltage degradation to determine the grid’s hosting capacity.
In addition, several studies have examined the integration of electric vehicles into power systems, focusing on their impact on grid stability and the optimization of charging behavior. In [
26], the authors investigate how high load demands from EVs can induce dynamic instabilities in the distribution network, affecting frequency stability. They propose control strategies to mitigate these effects. The effects of large-scale EV charging on power grid stability are analyzed in [
27], with a focus on potential frequency fluctuations caused by uncoordinated charging behaviors. In [
28], the implications of widespread EV charger deployment on grid stability are examined, including challenges related to frequency and voltage stability. The impact of increased EV penetration on distribution system components, power loss, and grid stability is explored in [
29], emphasizing the necessity of effective management to prevent frequency instability. In [
30], while the potential benefits of EVs are highlighted, the challenges posed by high charging demands are also addressed, as improper management may lead to grid instability.
In numerous studies examining the impact of EVs on power systems, the specific type of charger is often overlooked. While most research focuses on the overall EV load, the varying categories of chargers, from slow AC chargers to DC fast chargers, significantly influence grid dynamics. EV chargers, primarily composed of power electronic converters, exhibit different behaviors compared to traditional loads in power systems [
31]. This study aims to evaluate the frequency stability of Curaçao’s power network, building on the work presented in [
25], which assessed voltage profiles and component capacity. For this purpose, a ZIP load modeling approach was adopted to represent EV charging stations, following the methodology outlined in [
31]. This model is applicable to both static and dynamic studies, and the analysis includes both AC and DC fast charging stations, which have been shown to exert the most significant impact on power systems [
32].
As the global transition toward sustainable transportation accelerates, understanding the effects of EV integration on power systems has become increasingly critical. Many studies emphasize steady-state analyses, underscoring the necessity of complementing them with dynamic studies, especially those assessing frequency stability in the context of EV integration. Such research provides essential insights into the challenges and opportunities of incorporating EVs into existing grids. By examining charging patterns, demand fluctuations, stability, and infrastructure needs, researchers can offer valuable guidance to policymakers and utilities. However, in certain regions, including some states and countries, these studies remain unaddressed due to various factors. This paper evaluates the impact of EV penetration on the frequency stability of Curaçao’s power network. To the authors’ knowledge, no prior studies have specifically examined this aspect on the island. Using the representative network prototype from [
25], this research aims to continue and expand previous work, focusing on encouraging the adoption of electric vehicles in Curaçao. The primary features and contributions of this study are as follows:
The representative prototype of Curaçao’s power network presented in [
25] is enhanced by adding and adjusting the dynamic models of the speed governors of synchronous machines, with the data made available to the academic community for further studies.
The impacts of EVs on the frequency stability of the grid are analyzed, considering different scenarios of EV participation, enabling the identification of the potential effects on the island’s network.
One of the main contributions of this study is the implementation of the Inertia Emulation Control Strategy for BESSs through EVs operating in V2G mode using RoCoF-Based Synthetic Inertia. This technique allows battery energy storage systems (BESSs) present in V2G-capable EVs to contribute to grid stability by providing a synthetic inertia response based on the rate of change of frequency (RoCoF). By dynamically adjusting the power injected or absorbed according to frequency variations, this strategy enhances the system’s resilience to disturbances, mitigating the impact of events such as sudden generation loss or massive load disconnections.
The remainder of this document is structured as follows:
Section 2 describes the proposed methodology, including the electric power grid representation, EV charging, load modeling, and the effects of EVs on frequency stability.
Section 3 describes the results obtained in each of the proposed scenarios. Finally, the conclusions, limitations, and potential directions for future work are presented in
Section 4.
2. Methodology to Assess the Effect of EVs in Frequency Stability
2.1. Curaçao’s Electric Power Grid Representation
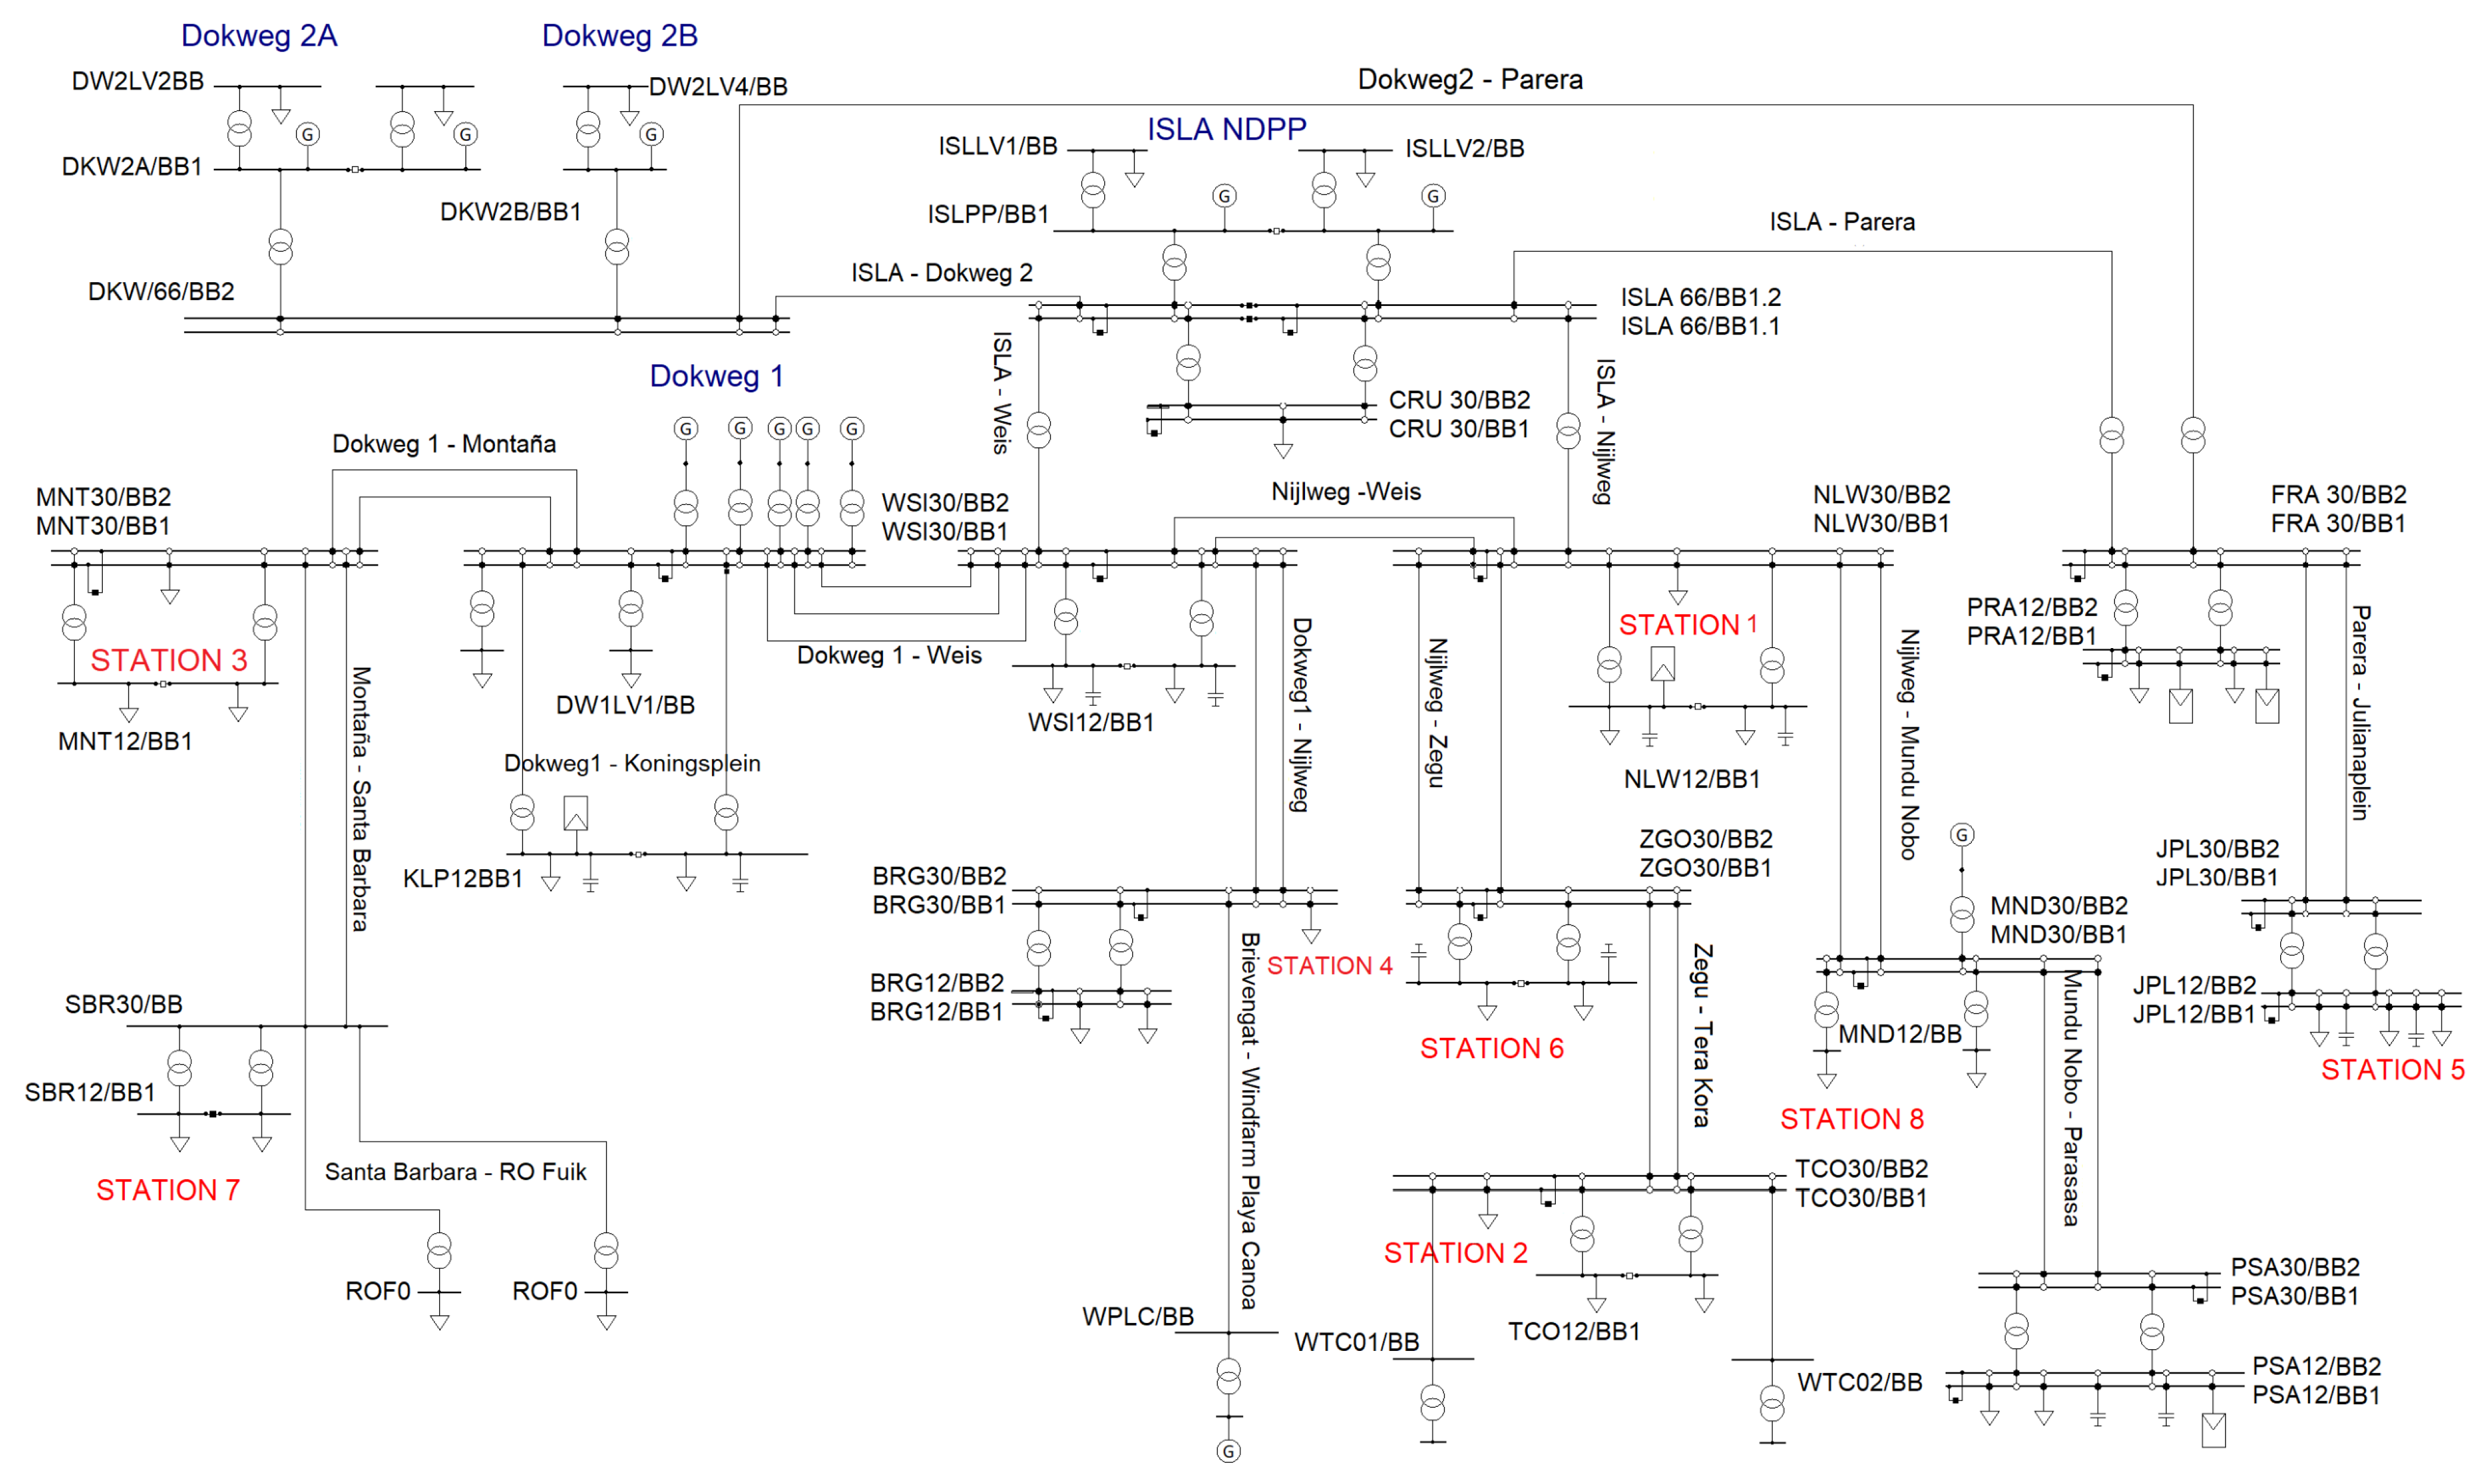
The representative prototype of Curaçao’s power network is presented in [
25] (see
Figure 1). Curaçao, located in the southern Lesser Antilles and part of the Kingdom of the Netherlands, spans around 444 square kilometers and has a population of over 164,000. The island relies heavily on imported energy, primarily oil and natural gas, to meet its electricity and transportation needs. However, recent efforts have focused on adopting renewable energy sources like wind and solar power to reduce dependence on fossil fuels and lower the island’s carbon footprint. Although specific data on Curaçao’s power grid is not publicly accessible, this study presents a representative model based on information from [
33].
The island’s energy system primarily consists of fossil fuel power plants, supported by wind and solar installations. Curaçao’s grid includes five power plants, two wind farms, 13 substations, 321 km of overhead lines, 1354 km of underground cables, and various transformers. The grid’s highest voltage level is 66 kV, which is distributed through eleven 30 kV substations and, subsequently, through twelve 12 kV and two 6 kV substations, where aggregated loads are connected [
25].
Curaçao’s peak electricity demand is about 130 MW, varying throughout the year. Despite having an installed capacity exceeding peak demand, this capacity is not always fully utilized due to variability in wind and solar power generation. The island’s primary power generation includes three main plants: the first plant comprises two sections with a combined capacity of 74.8 MW, the second plant has a capacity of 33.2 MW, and the third plant, consisting of seven smaller generators, has a capacity of 42.8 MW. Together, these fossil fuel power stations contribute a total of 150.8 MW, connected through 66 kV and 33 kV transmission lines.
Wind energy is the second-largest energy source, with three wind farms located on the windward coast. These farms have a combined capacity of 46.5 MW under ideal conditions. Additionally, Curaçao has five solar parks contributing a total of 14 MW, supported by an estimated 760 photovoltaic installations, each with a modeled capacity of 2.8 MW. This renewable energy infrastructure plays a crucial role in supporting the island’s electric grid [
25].
The speed regulator controller is applied to all synchronous generators in Curacao’s networks system. Each synchronous generator is equipped with a speed regulator controller, which is responsible for primary frequency regulation by adjusting the mechanical power input based on frequency deviations. This helps stabilize the system after disturbances such as generation loss or EVs load disconnections. The speed regulator controller depicted in
Figure 2 was used for the synchronous thermal generators on the test grid. In this case, Wref represents the reference speed, W is the actual speed, Pref is the reference power, and P is the measured power. Additionally, TA corresponds to the ambient temperature limit, while Pt denotes the turbine output power. The controller parameters are presented in
Table 1. Primary frequency regulation, carried out by the speed controller shown in
Figure 2, plays a key role in maintaining the dynamic stability of the power system. One of its main advantages is its fast response to sudden imbalances between generation and load, acting within seconds to correct frequency deviations. This helps to dampen initial oscillations and lowers the risk of system failures or blackouts. Since the controller provides a proportional response based solely on local frequency measurements, it operates without the need for centralized coordination, making the system more resilient to local disturbances.
2.2. Load Modeling and Charging of EVs
EV chargers enable the conversion of alternating current (AC) from the grid into direct current (DC) through power converters [
34]. Depending on the charger type, this conversion process can take place either inside or outside the vehicle. There are two main types of EV chargers: onboard and off-board converters.
Onboard chargers are integrated into the vehicle itself, meaning the AC/DC conversion is constrained by the vehicle’s size and weight. As a result, the conversion rate is slower, extending the charging time. In contrast, off-board chargers perform the AC/DC conversion externally and inject DC power directly into the EV battery. Since these converters are not restricted by vehicle dimensions, they offer higher efficiency, significantly reducing charging duration [
35]. The different charging methods can be classified as indicated below [
36,
37].
Level 1 or AC trickle charging: This is the most basic and widely accessible charging method, typically rated up to 3 kW. It operates using a standard household outlet (120 V in North America, 230 V in Europe) without requiring special infrastructure. Due to its low power output, charging times range between 11 and 20 h, depending on battery capacity and state of charge. Level 1 charging is best suited for overnight use, low-mileage drivers, and situations where faster charging is not necessary.
Level 2 or AC fast charging: This charging method provides a significant improvement in charging speed, with power ratings typically ranging from 7 kW to 22 kW. It requires a dedicated circuit and a specialized charging station, commonly installed in residential garages, workplaces, and public charging locations. Charging times are reduced to approximately 3 to 4 h, making it a more practical solution for daily use. Level 2 charging utilizes the vehicle’s onboard charger to convert AC power to DC, balancing efficiency and infrastructure costs while offering a faster alternative to Level 1 charging.
Level 3 or DC fast charging: This is the most powerful and rapid charging method, delivering between 50 kW and 350 kW. Unlike Level 1 and Level 2, it relies on an off-board charger that performs AC/DC conversion externally before directly supplying DC power to the EV battery. Due to the high voltage and current requirements, Level 3 charging stations are typically located along highways, fleet depots, and urban fast-charging hubs rather than in residential areas. Charging times range from 30 to 60 min, significantly reducing downtime for EV users. However, this method places a substantial demand on the grid, potentially causing voltage deviations, reliability concerns, and increased power losses. Additionally, not all EVs are equipped to handle such high-power charging, and its intensive use may accelerate the aging of distribution network transformers.
The main features of the charging stations are presented in
Table 2:
To accurately model the behavior of an EV charging station, the ZIP load model was implemented. This approach provides a mathematical representation of the relationship between power consumption and voltage variations at a load bus. The ZIP model is widely used in both static and dynamic power system studies, as it captures how different types of electrical loads respond to voltage fluctuations. It expresses power as a polynomial function of voltage, incorporating three distinct components: constant impedance (Z), constant current (I), and constant power (P).
In the context of EV charging, the ZIP model is particularly relevant because it reflects the varying electrical characteristics of chargers. Most EV chargers primarily behave as constant power loads (P-component), meaning their power consumption remains stable regardless of voltage changes. However, depending on the type of charger and grid conditions, small contributions from the impedance (Z) and current (I) components may also be present. By utilizing this model, the active power demand of EVs can be accurately simulated, allowing for a more precise assessment of their impact on grid stability and performance.
Equation (
1) indicates the polynomial load model, where
is the active power for a supply voltage of 1 p.u. Furthermore,
,
, and
correspond to model parameters. If any of them draws close to 1, it indicates that the load operates as a constant impedance, constant current, or constant power, respectively. Finally, the independent parameter
V indicates the supply voltage in p.u.:
Table 3 presents the parameters of Equation (2) that characterize each EV charging station, which were estimated using the least-squares method as described in [
31].
The load model used in this work is based on the model proposed in [
31] to represent the dynamic behavior of EV chargers. To improve the accuracy of the load modeling, the ZIP model parameters were carefully estimated using various detailed EV models and validated with simulated data. The least-squares estimation method, as referenced in [
31], was employed to calibrate the model, ensuring that it accurately reflected the dynamic behavior of EV charging stations under different grid conditions. Additionally, the implementation of the ZIP model accounted for the voltage-dependent nature of EV loads, allowing for a more comprehensive representation of their impact on power system stability. Since most EV chargers exhibit power electronics-based behavior, their response to voltage fluctuations is primarily governed by the P-component of the ZIP model. However, variations in grid voltage and charger design can introduce small Z and I components, which were incorporated into the analysis to improve realism. This approach ensured that the load dynamics in the network were realistically represented, enabling a more accurate assessment of frequency stability under different operating conditions.
2.3. EVs in Frequency Stability
The frequency stability of the power system is crucial for ensuring the reliable operation of the electrical grid [
38]. In this context, the impact of V2G integration on grid frequency becomes a significant concern. Firstly, from a demand perspective, the charging load of a large number of EVs can lead to a substantial increase in the total grid load, especially during peak charging periods [
38]. Secondly, with the growing share of renewable energy in the power system, the high randomness and decentralization of energy generation and consumption further complicate grid frequency management. Beyond the overall frequency decline caused by increased load, the volatility of EV charging demand is also a concern that cannot be overlooked. As a new type of load, EV charging demand is highly variable, which can cause a sharp increase in grid load over a short period. If this short-term load fluctuation is not effectively managed and regulated by the grid, it may lead to rapid frequency fluctuations. These short-term frequency fluctuations can pose a challenge to the stable operation of the power grid, particularly when the grid’s regulation capacity is limited [
38].
According to [
28], one of the key findings in this area is the variation in the behavior of the RoCoF in the Great Britain system. The disconnection of the DC circuit, where EVs are charged, can lead to high RoCoF when the DC circuit is heavily loaded. The company that conducted the study (Sygensys) reported this phenomenon and identified that the increasing EV load could exacerbate the RoCoF, with varying impacts throughout the system. The variation in the RoCoF is correlated with the physical location of the generator. For EV charging, this means that the observable frequency during significant generation losses depends not only on the size of the loss but also on where the load is fed from the transmission system. The disconnection of V2G-enabled EVs during this time due to the RoCoF could worsen the disturbance and potentially lead to a blackout. The results from Great Britain serve as a reminder that transmission planning personnel must understand oscillatory modes and identify whether the RoCoF increases due to large amounts of inverter-based resources (IBRs) and converter-based resources could trigger generation trips. As an increasing RoCoF raises global risks, planners need to pay special attention to the impact of EV charging when exporting to the grid in V2G modes or when EV chargers draw power from the grid in charging modes. The conclusions of [
28] are based on comparisons of the RoCoF at various levels of EV penetration.
2.4. Inertia and Frequency Dynamics in Power Systems
Inertia plays a fundamental role in the dynamic response of power systems following a disturbance. The inertia constant, typically denoted H, quantifies the kinetic energy stored in the rotating masses of generators and turbines. This stored energy helps to momentarily balance the power deficit caused by sudden generation losses or load changes, thereby resisting abrupt frequency deviations. The following section introduces the mathematical definition of the inertia constant and its relationship to system frequency, power imbalance, and the rate of change of frequency (RoCoF), forming the basis for inertia estimation and system stability analysis.
The inertia constant
H of a rotating system, or
in the case of an individual generator, characterizes the kinetic energy stored in its rotating mass, represented by
. It is defined as the amount of time (in seconds) required to replenish this stored energy when the system operates at its nominal mechanical speed
and nominal apparent power
. The overall inertia of the system is given by Equation (2) [
39]:
where
J is the total moment of inertia in kg·m
2,
is the angular velocity of the system in radians per second (rad/s), and
denotes the selected base power in megavolt-amperes (MVAs).
The dynamic relationship between the frequency
and the power imbalance
at the terminals of generator
i is described by Equation (3):
where
is the mechanical power supplied by the turbine (in per unit),
is the electrical power output (in per unit),
denotes the power imbalance between generation and load (in per unit),
is the inertia constant (in seconds),
is the frequency observed by element
i (in Hz),
is the nominal system frequency (in Hz), and
represents the RoCoF (in Hz/s).
If the time at which the disturbance occurs is known,
, along with the corresponding power imbalance
and the RoCoF
then the inertia contributed by generator
i can be estimated using Equation (4):
Equation (4) is valid only within a short time window following the disturbance, prior to the influence of other dynamic factors such as control actions or system damping effects [
40]. Since the RoCoF represents the time derivative of frequency, it can be approximated by evaluating the slope between two consecutive frequency measurements, as shown in Equation (5):
where
and
correspond to the frequency data taken at
and
, respectively.
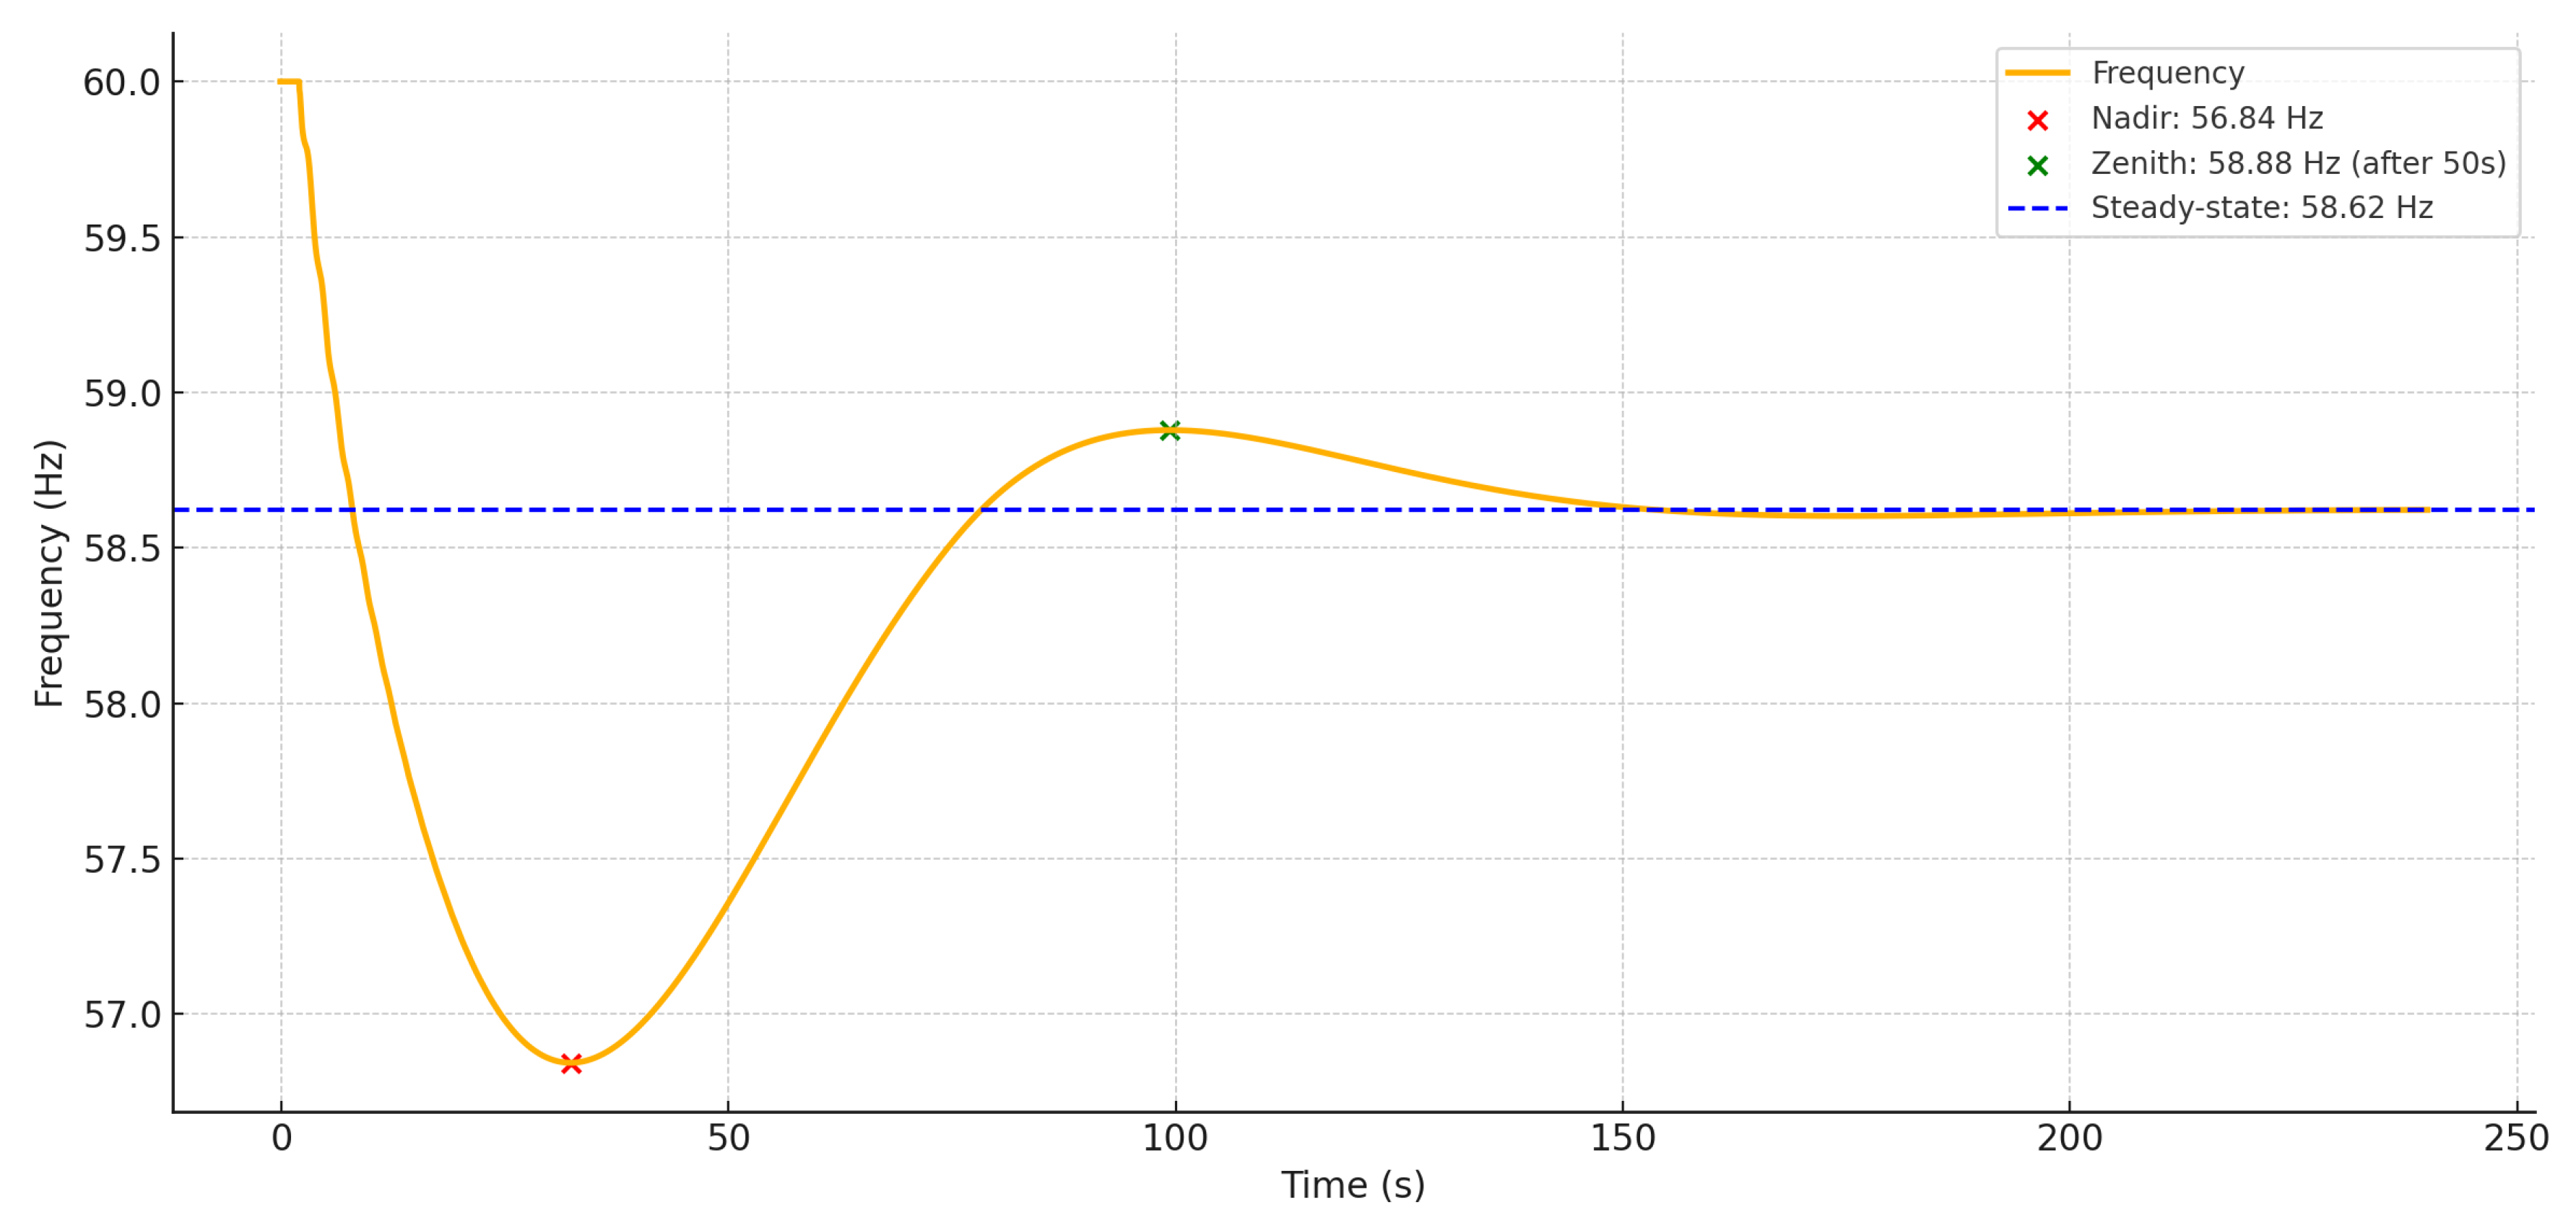
Figure 3 illustrates the frequency response of a power system following a generation disturbance. The initial sharp decline in frequency is a direct result of an imbalance between generation and demand. When generation suddenly falls short of the load, the system experiences a power deficit. As a consequence, the kinetic energy stored in the rotating masses of synchronous machines is used to supply the shortfall, causing the system to slow down and the frequency to drop.
The lowest point reached after the disturbance is known as the nadir (56.84 Hz), marking the moment of greatest energy deficit. Subsequently, the frequency recovers as primary control mechanisms (such as governors) act to restore balance. This leads to a temporary overshoot known as the zenith (58.88 Hz), occurring after 50 s in this case. Eventually, the system reaches a new steady-state frequency of approximately 58.62 Hz, which reflects the new operating point at a lower speed due to the sustained imbalance.
These three key points—nadir, zenith, and steady-state frequency—are commonly used metrics to characterize the frequency behavior of the system after a disturbance.
2.5. Inertia Emulation Control Strategy for BESS in EVs with V2G Using RoCoF-Based Synthetic Inertia
One of the main contributions of this study is the implementation of the Inertia Emulation Control Strategy for battery energy storage systems (BESSs) through electric vehicles (EVs) operating in V2G mode, using RoCoF-based synthetic inertia. This technique enables BESSs integrated into V2G-capable EVs to support grid stability by providing a synthetic inertia response based on frequency variation. By dynamically adjusting the injected or absorbed power according to frequency changes, this strategy enhances the system’s resilience to disturbances, mitigating the impact of events such as sudden generation loss or massive load disconnections.
Conventional battery energy storage systems (BESSs) do not inherently provide frequency response. Therefore, additional control strategies are required to establish a link between grid frequency and the power output of the BESS, allowing it to contribute to frequency regulation during disturbances in the AC system. In this context, [
41,
42] presents two approaches for delivering synthetic inertia through BESSs to address frequency deviations or active power imbalances: one-shot RoCoF control and continuous RoCoF control.
Continuous RoCoF control in BESSs utilizes real-time measurements of the instantaneous RoCoF on the grid side, offering high adaptability to frequency disturbances. However, this approach requires more sophisticated control mechanisms to effectively filter out harmonics, as instantaneous RoCoF measurements can amplify noise.
In the context of BESSs, once the grid frequency is measured its derivative with respect to time can be obtained to estimate the RoCoF. Due to the inherently noisy nature of this signal, it must be properly filtered before being scaled by a gain known as the synthetic inertia constant. This process enables the BESS to emulate inertia response. The behavior is represented by Equation (6):
where
represents the inertial active power of the machine,
is the inertial of the machine, and
is the frequency of the system.
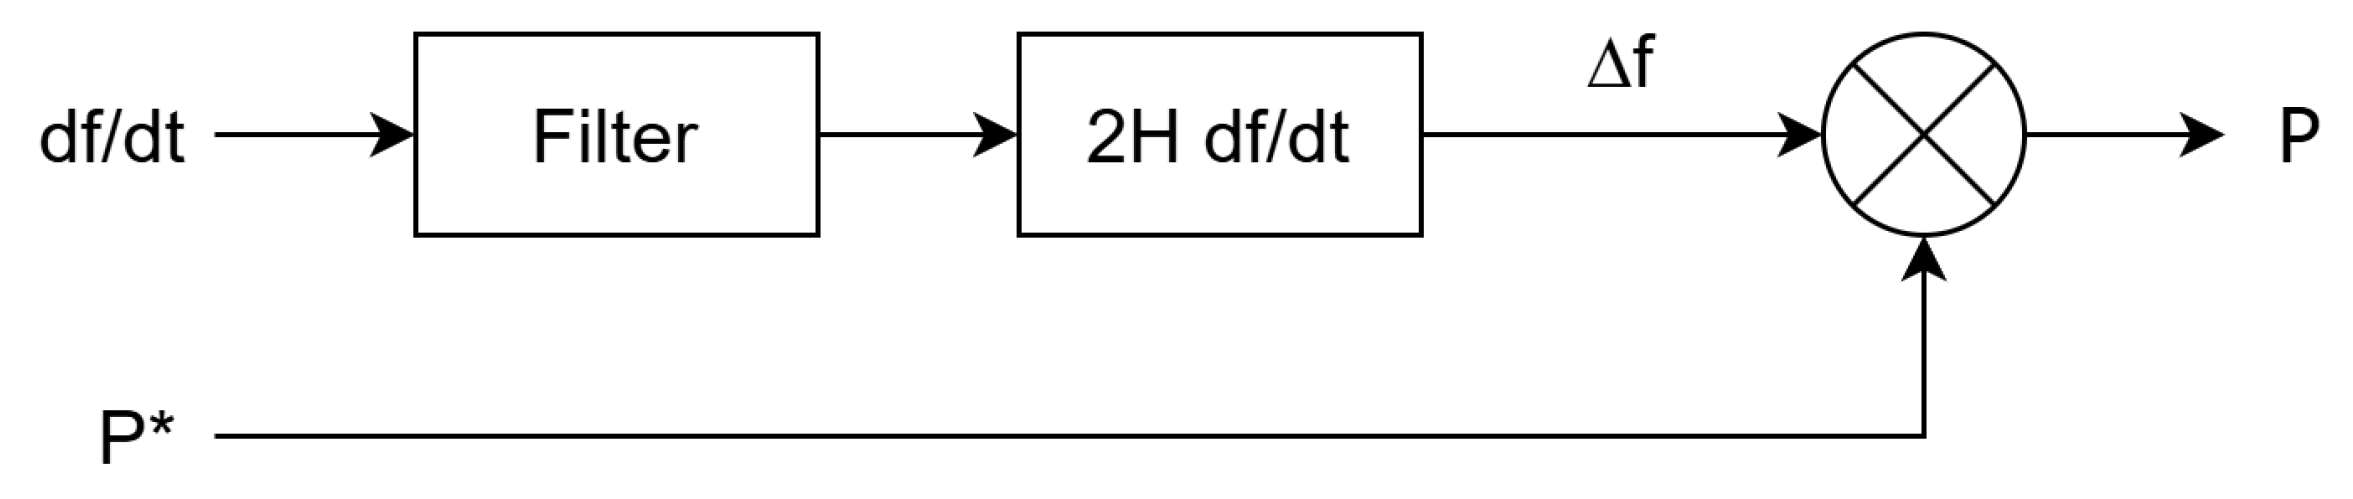
Figure 4 illustrates the control strategy used for inertia emulation in BESSs. The RoCoF is first filtered to remove high-frequency noise. The resulting signal is then multiplied by
, where
represents the synthetic inertia constant of the machine. This product yields the inertial active power contribution,
, which reflects the amount of power the BESS injects or absorbs in response to frequency deviations. This value is then added to the reference power setpoint,
, to compute the total active power output,
P. In this context,
represents the system frequency. This control loop enables the BESS to support grid stability by dynamically adjusting its power output according to frequency variations [
43].
3. Tests and Results
The research analyzed three different demand conditions: peak, average, and minimal, which corresponded to electricity consumption levels of 149.81 MW, 104.3 MW, and 74.5 MW, respectively. In each scenario, a designated proportion of the total vehicle fleet was assumed to be electric, with all EVs simultaneously drawing power from the grid. The penetration levels analyzed ranged from 0.5% to 4.5%, increasing incrementally by 0.5%.
Table 4 provides a detailed breakdown of these values. In this context, CL refers to the charging level. For instance, the first row illustrates that a single Charging Level 3 station with a 0.5% EV penetration results in a 9 MW increase in load. When EV penetration reaches 1%, the load rises to 17 MW, with further increments following the same pattern. The corresponding increase in the number of EVs at each penetration level is shown in the final row of
Table 4.
Eight EV charging stations were planned for installation at specific locations on the island, highlighted in red in
Figure 1. The first station corresponded to a DC superfast charging station, while stations two, three, and four were standard DC fast charging stations. The remaining four stations were AC fast charging stations. Stations one through four were linked to 30 kV substations, whereas the last four were connected to 12 kV substations. A total of nine EV penetration scenarios were evaluated for each demand condition. The objective of the study was to assess the impact of EV integration on frequency stability. To analyze the most critical scenario, all the EVs were assumed to be connected to the system simultaneously.
For the frequency stability analysis, the guidelines outlined in [
28] were followed, examining two scenarios across all demand conditions and EV penetration levels. The first scenario analyzed the system’s frequency response to the abrupt disconnection of EVs. The second scenario evaluated the consequences of generation loss during peak EV load periods.
In the first case, the analysis focused on assessing the quality of the frequency response by examining the RoCoF and the highest frequency value recorded during the transient period (the zenith). The results for this scenario are summarized in
Table 5.
For the second case, the evaluation centered on the RoCoF and the lowest frequency value observed during the transient period (the nadir). The corresponding results are presented in
Table 6.
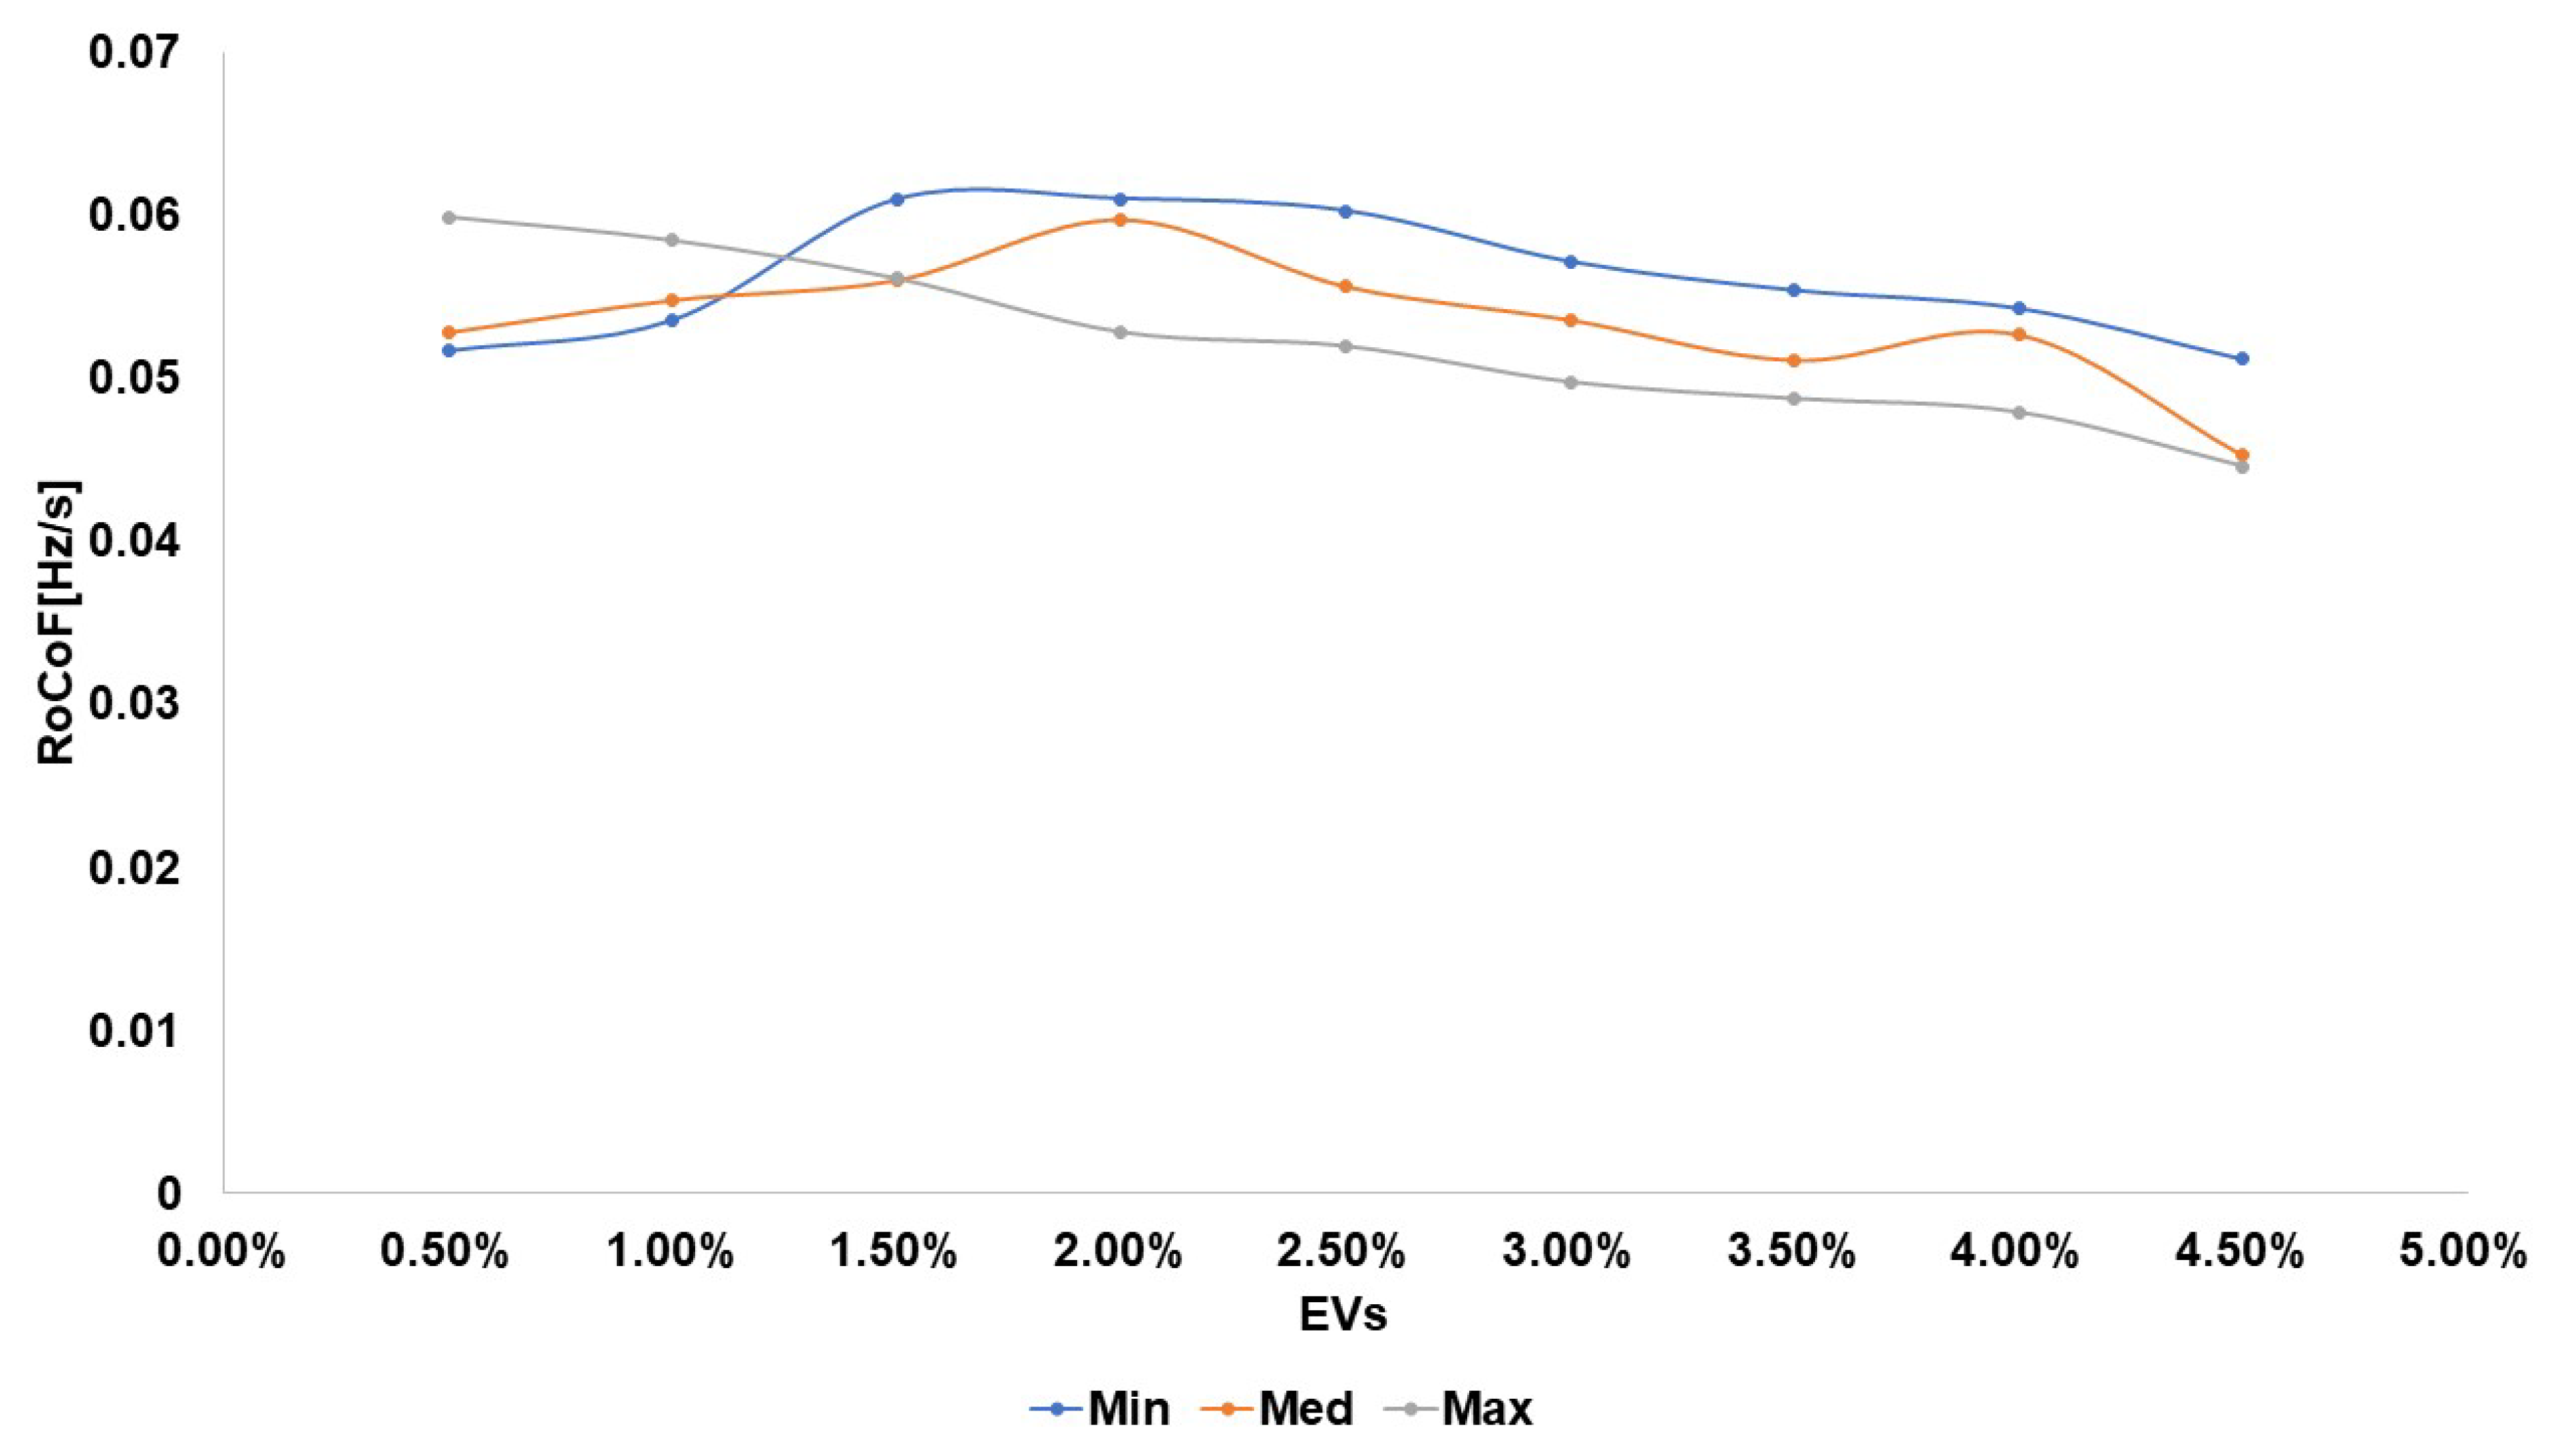
According to the results presented in
Table 5, an increase in EV penetration within Curaçao’s electrical grid may compromise frequency stability during simultaneous EV disconnection events. This is evident when analyzing the behavior of the zenith and the RoCoF, as these parameters showed a rising trend with higher EV penetration levels. Such an increase poses a risk to the grid, indicating a reduced ability to withstand frequency disturbances.
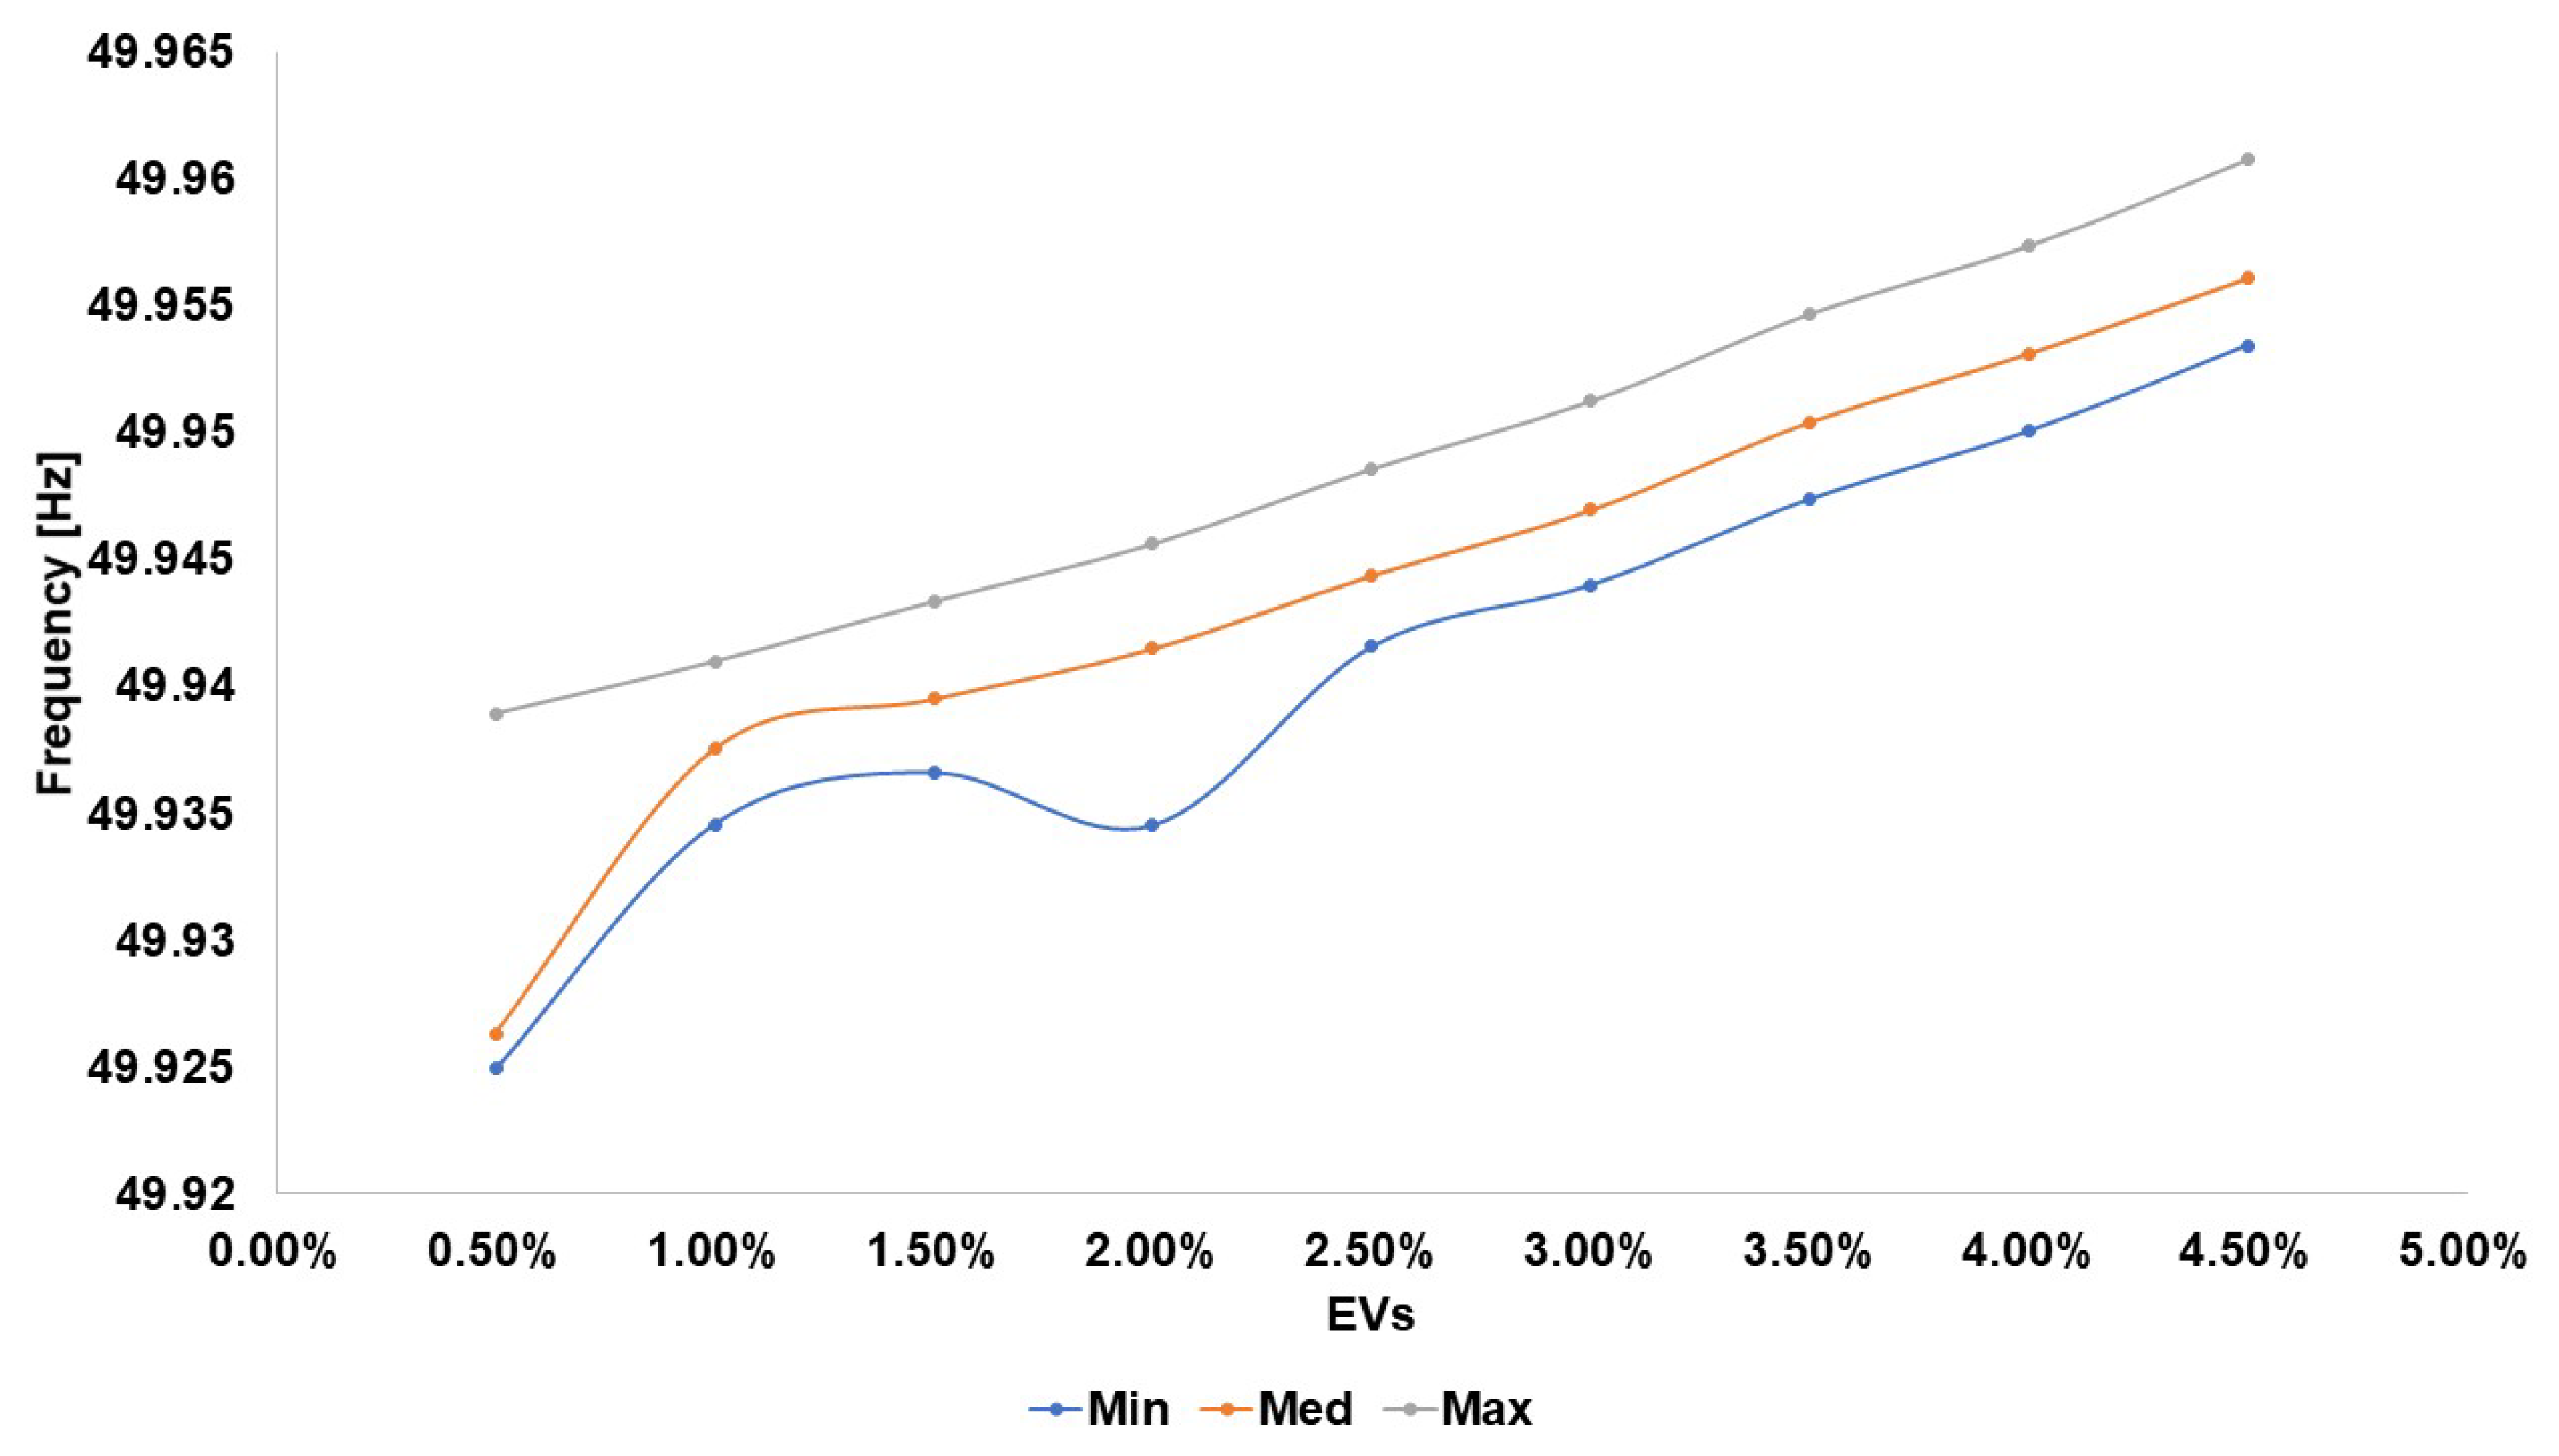
When evaluating the zenith and the RoCoF across different demand conditions, it becomes clear that these indices experienced a consistent rise in all scenarios, as illustrated in
Figure 5 and
Figure 6. Additionally,
Figure 5 and
Figure 6 show that the zenith values tended to peak during low-demand conditions, whereas the RoCoF reached its highest levels in maximum-demand scenarios.
According to the results presented in
Table 6, in the case of generation loss, the risk is not as critical at the moment of the event because an increase in generation leads to a rise in system inertia. However, the risk becomes more pronounced when system inertia is low due to the prevalence of renewable energy plants.
By analyzing the behavior of the nadir and the RoCoF, it is evident that the former tends to increase, while the latter decreases as EV penetration rises. This trend suggests an improvement in the grid’s ability to withstand frequency disturbances, assuming a dispatch primarily composed of thermal generation plants.
Figure 7 and
Figure 8 also illustrate that nadir values tend to be higher in maximum-demand scenarios (max), whereas RoCoF values decrease under the same conditions due to greater system inertia.
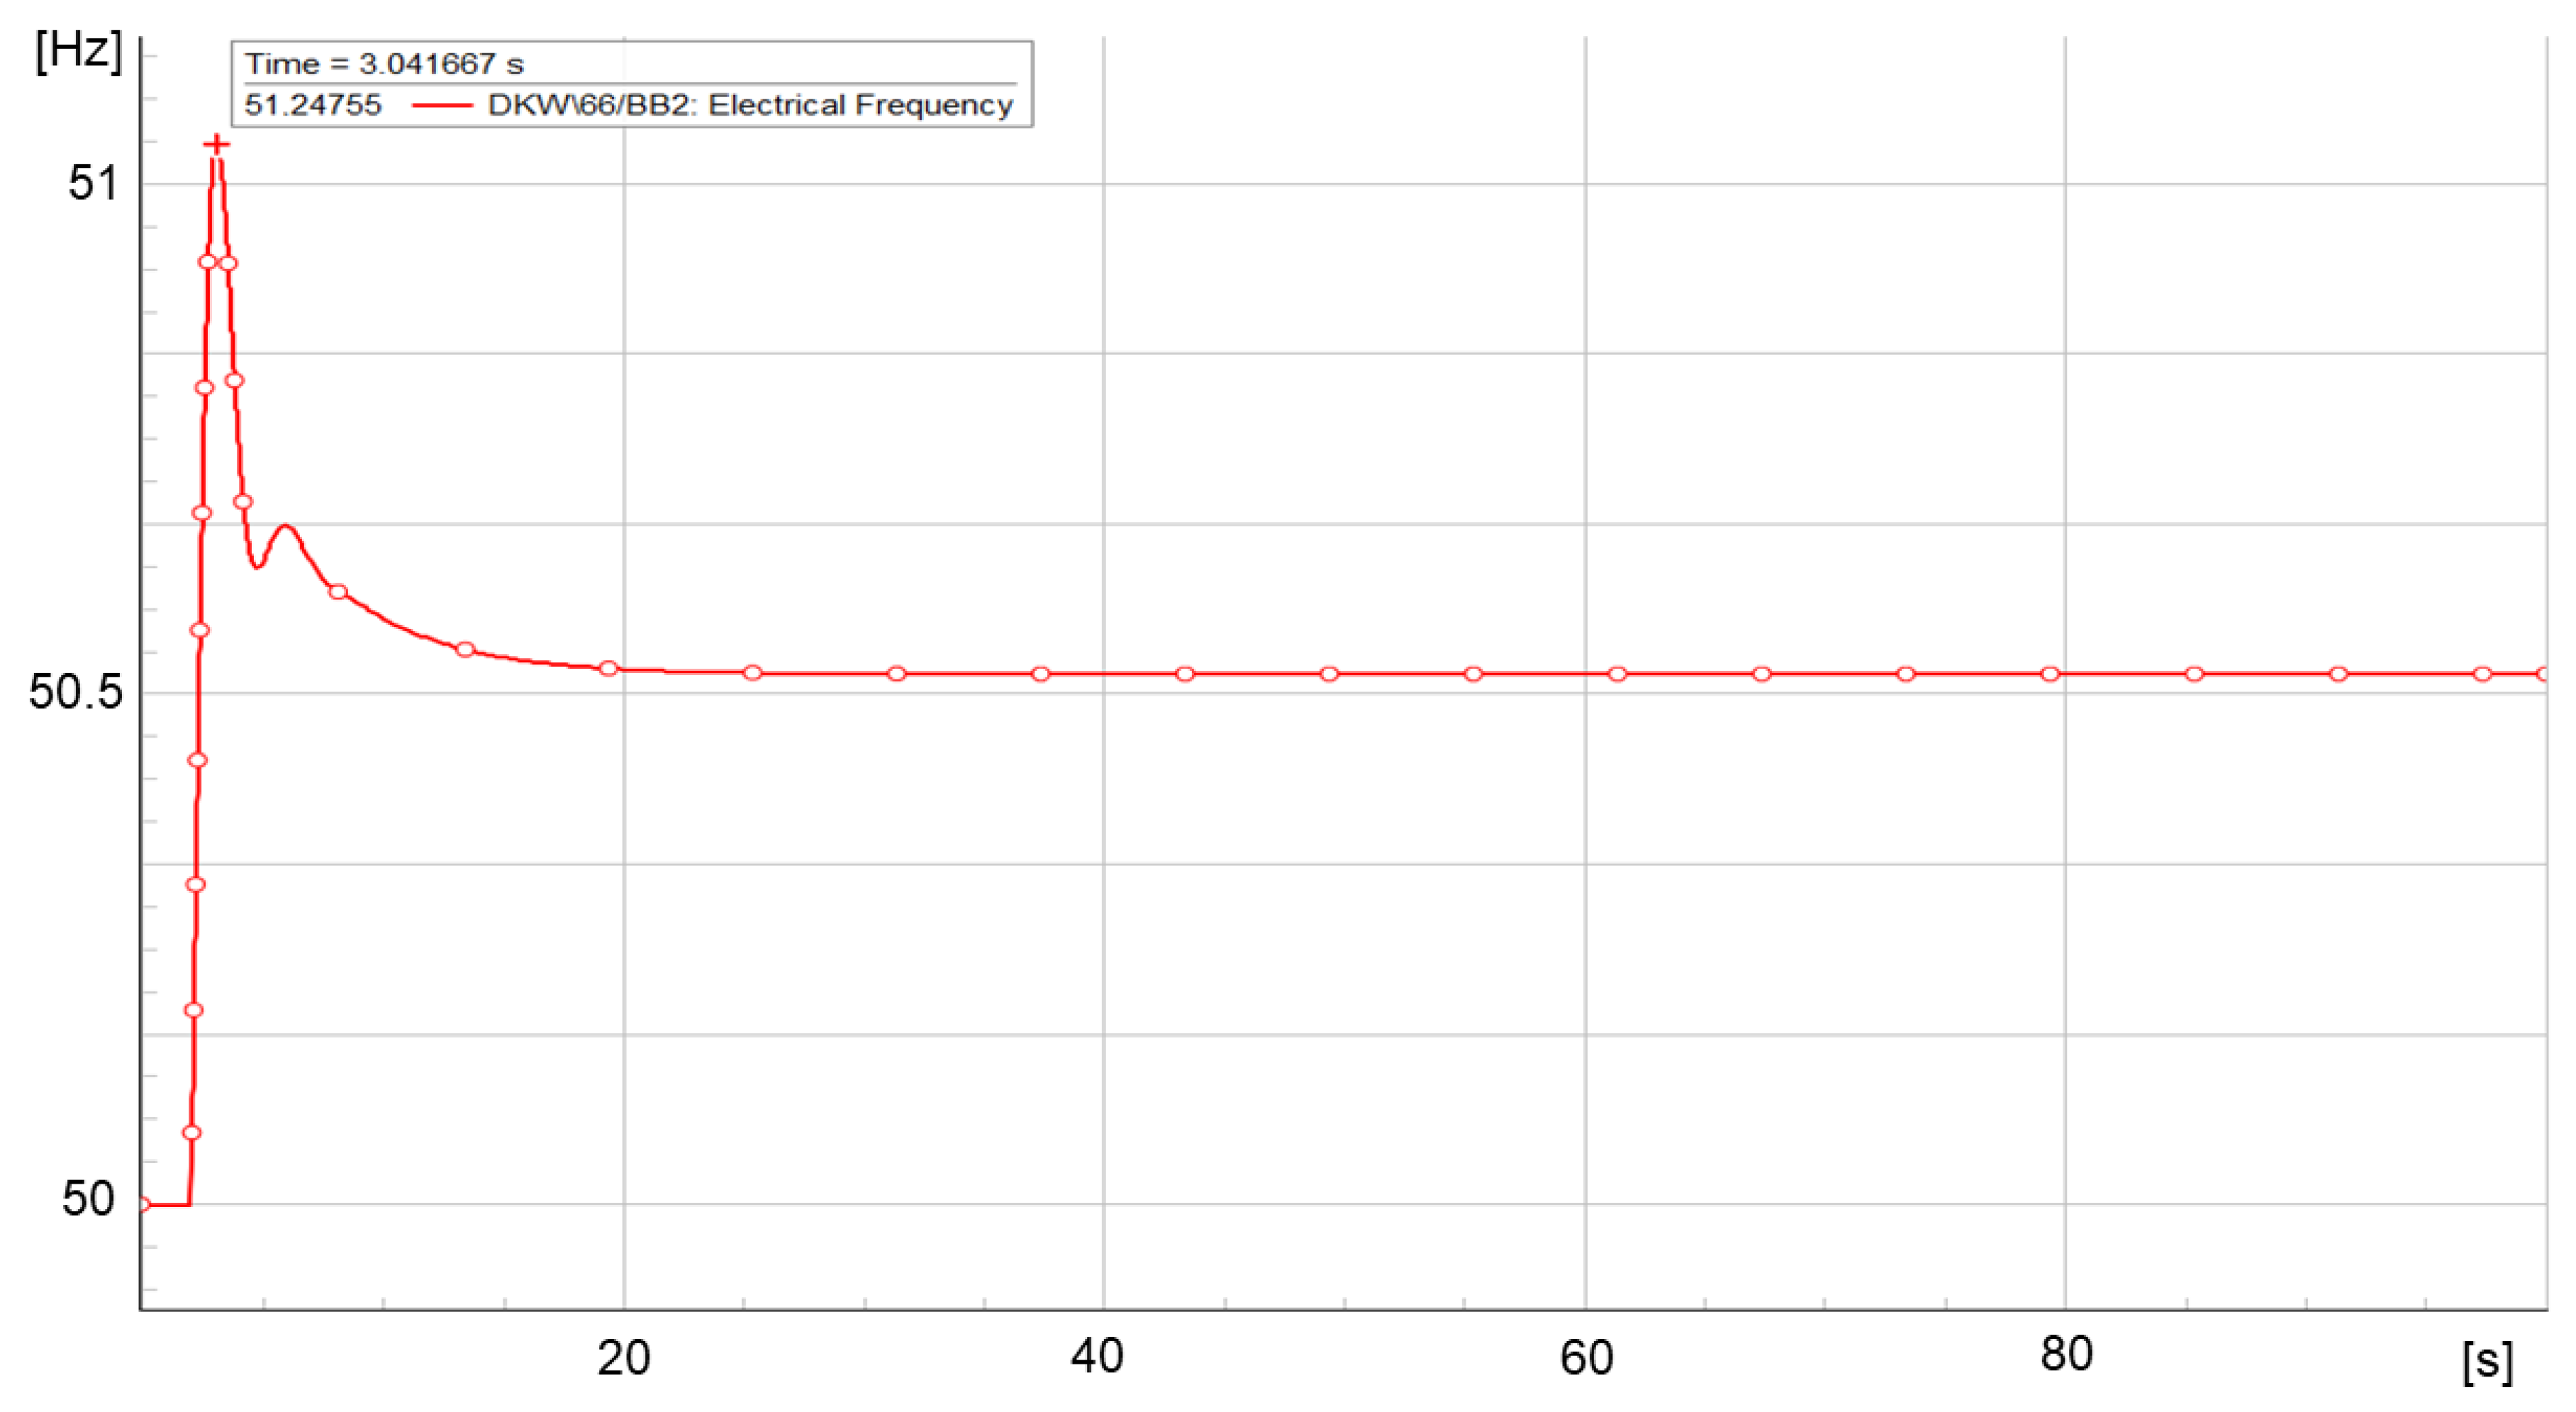
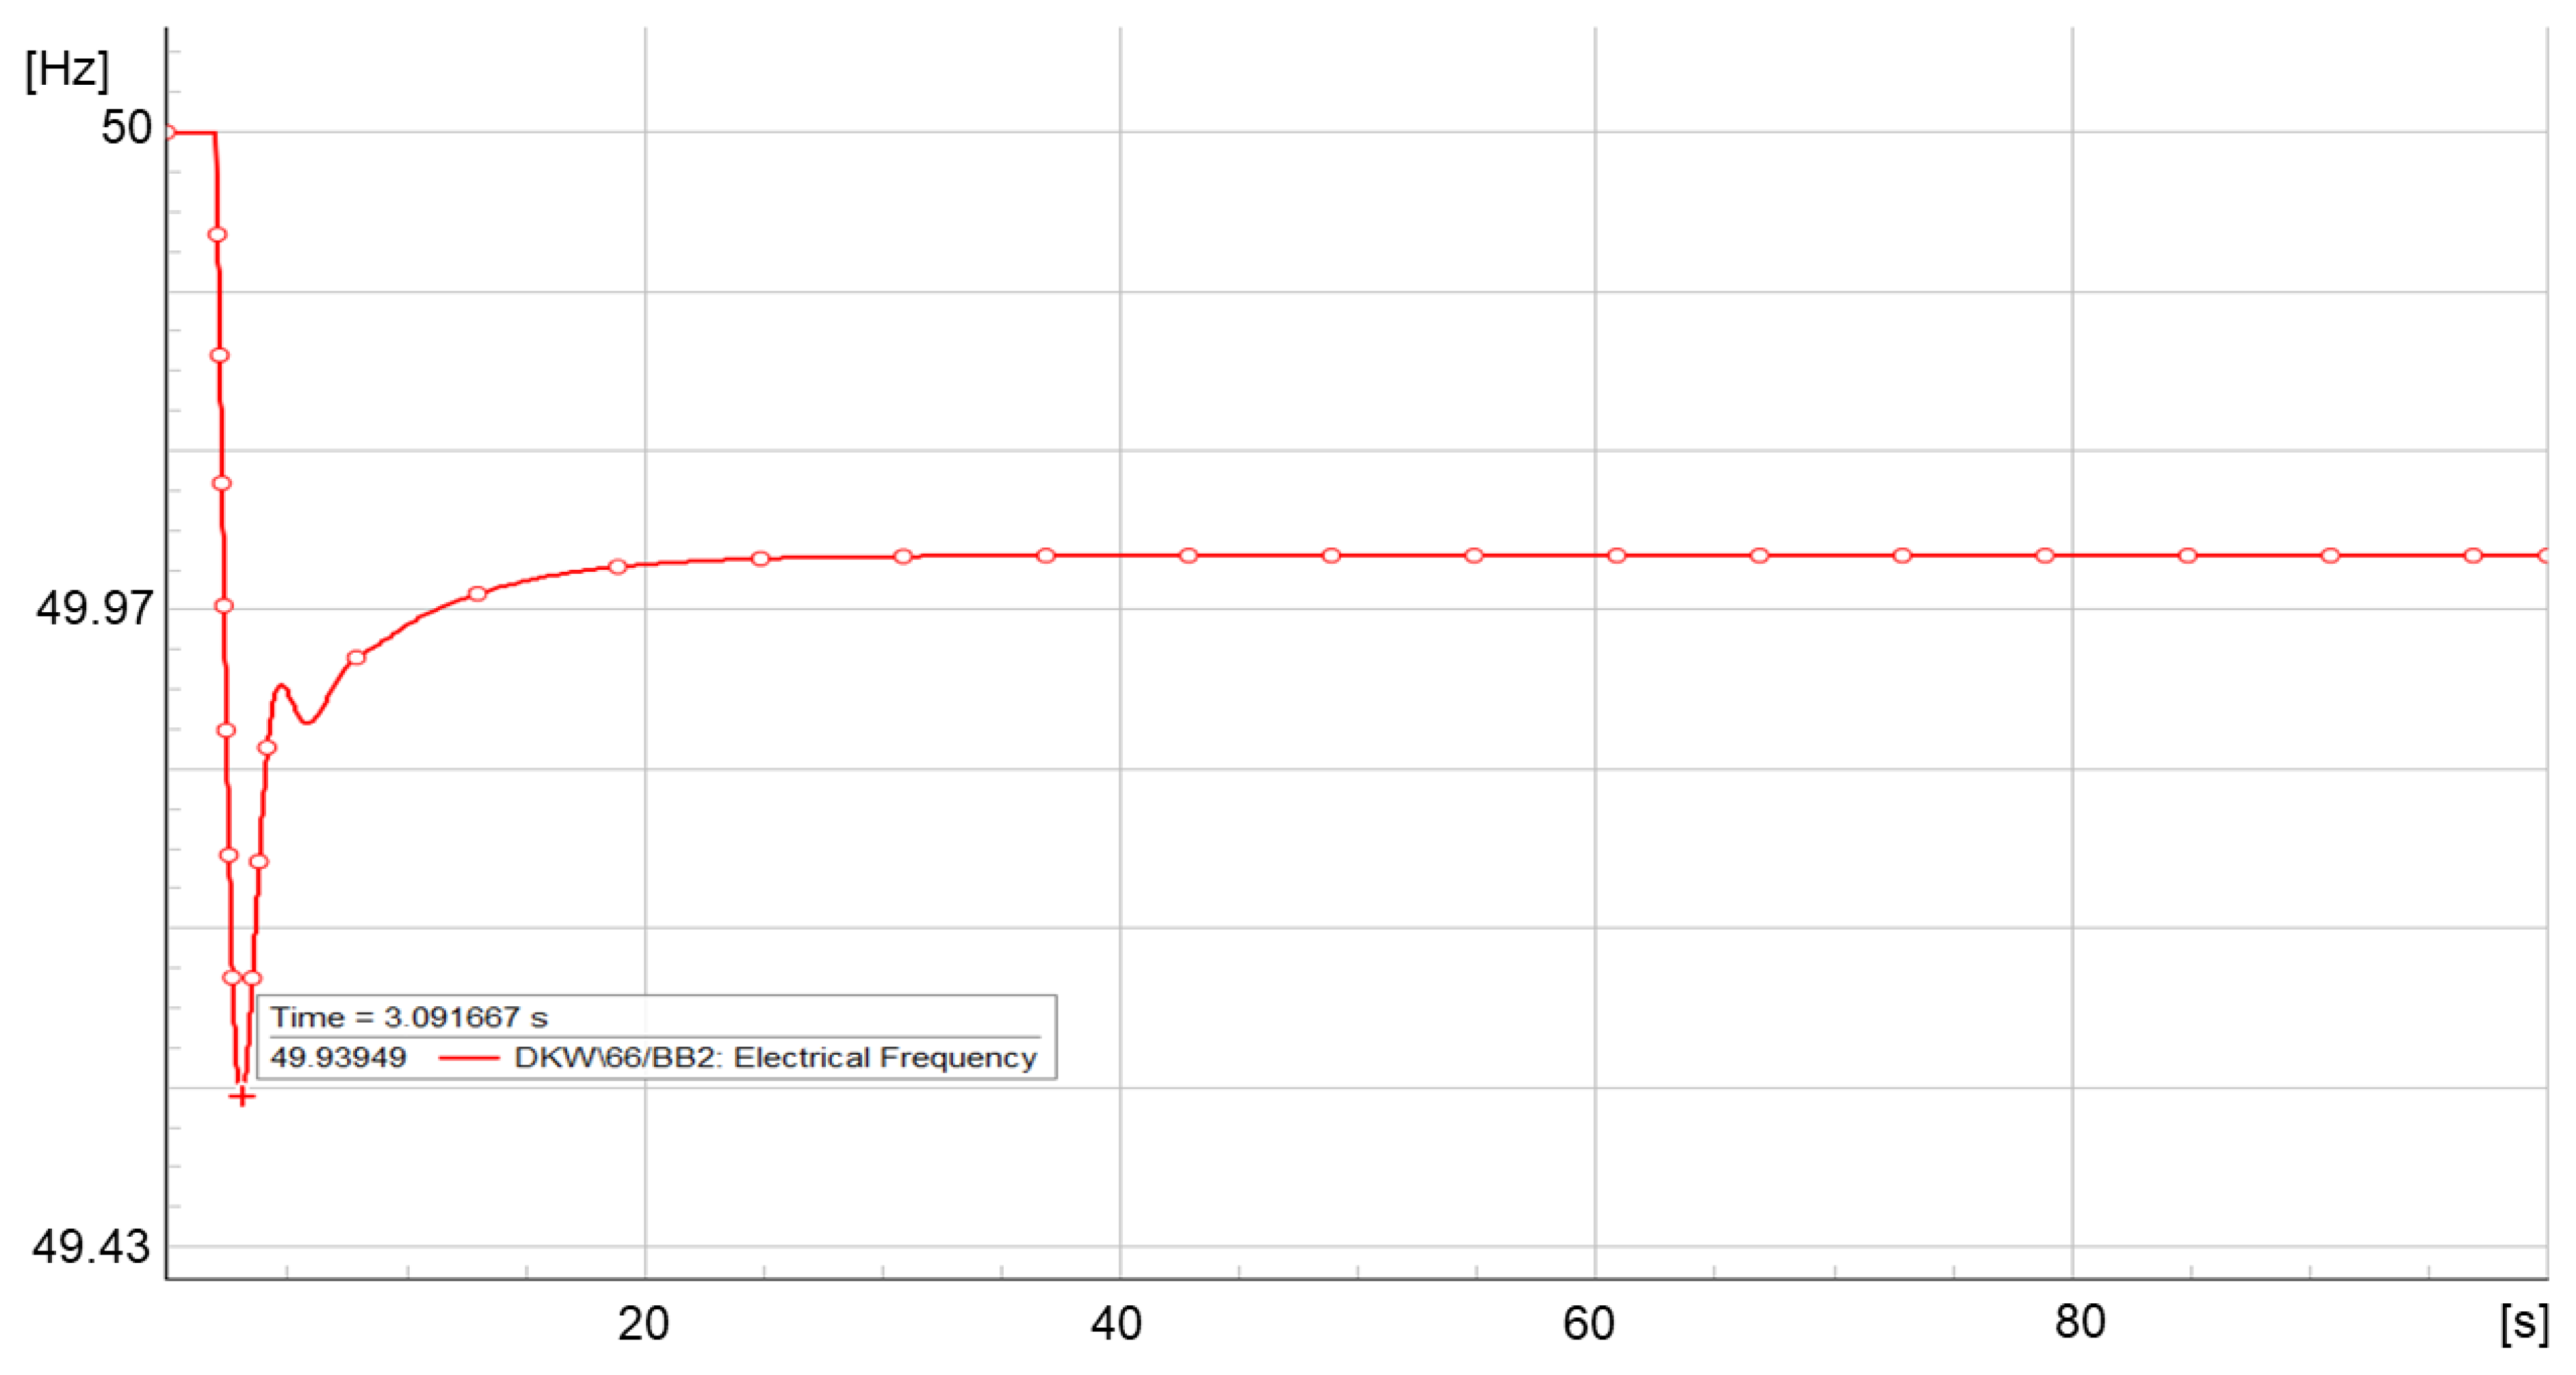
Figure 9 and
Figure 10 illustrate the frequency response during disturbance events. Specifically,
Figure 9 depicts a frequency event triggered by the sudden disconnection of EVs, whereas
Figure 10 represents a frequency event following an abrupt loss of generation.
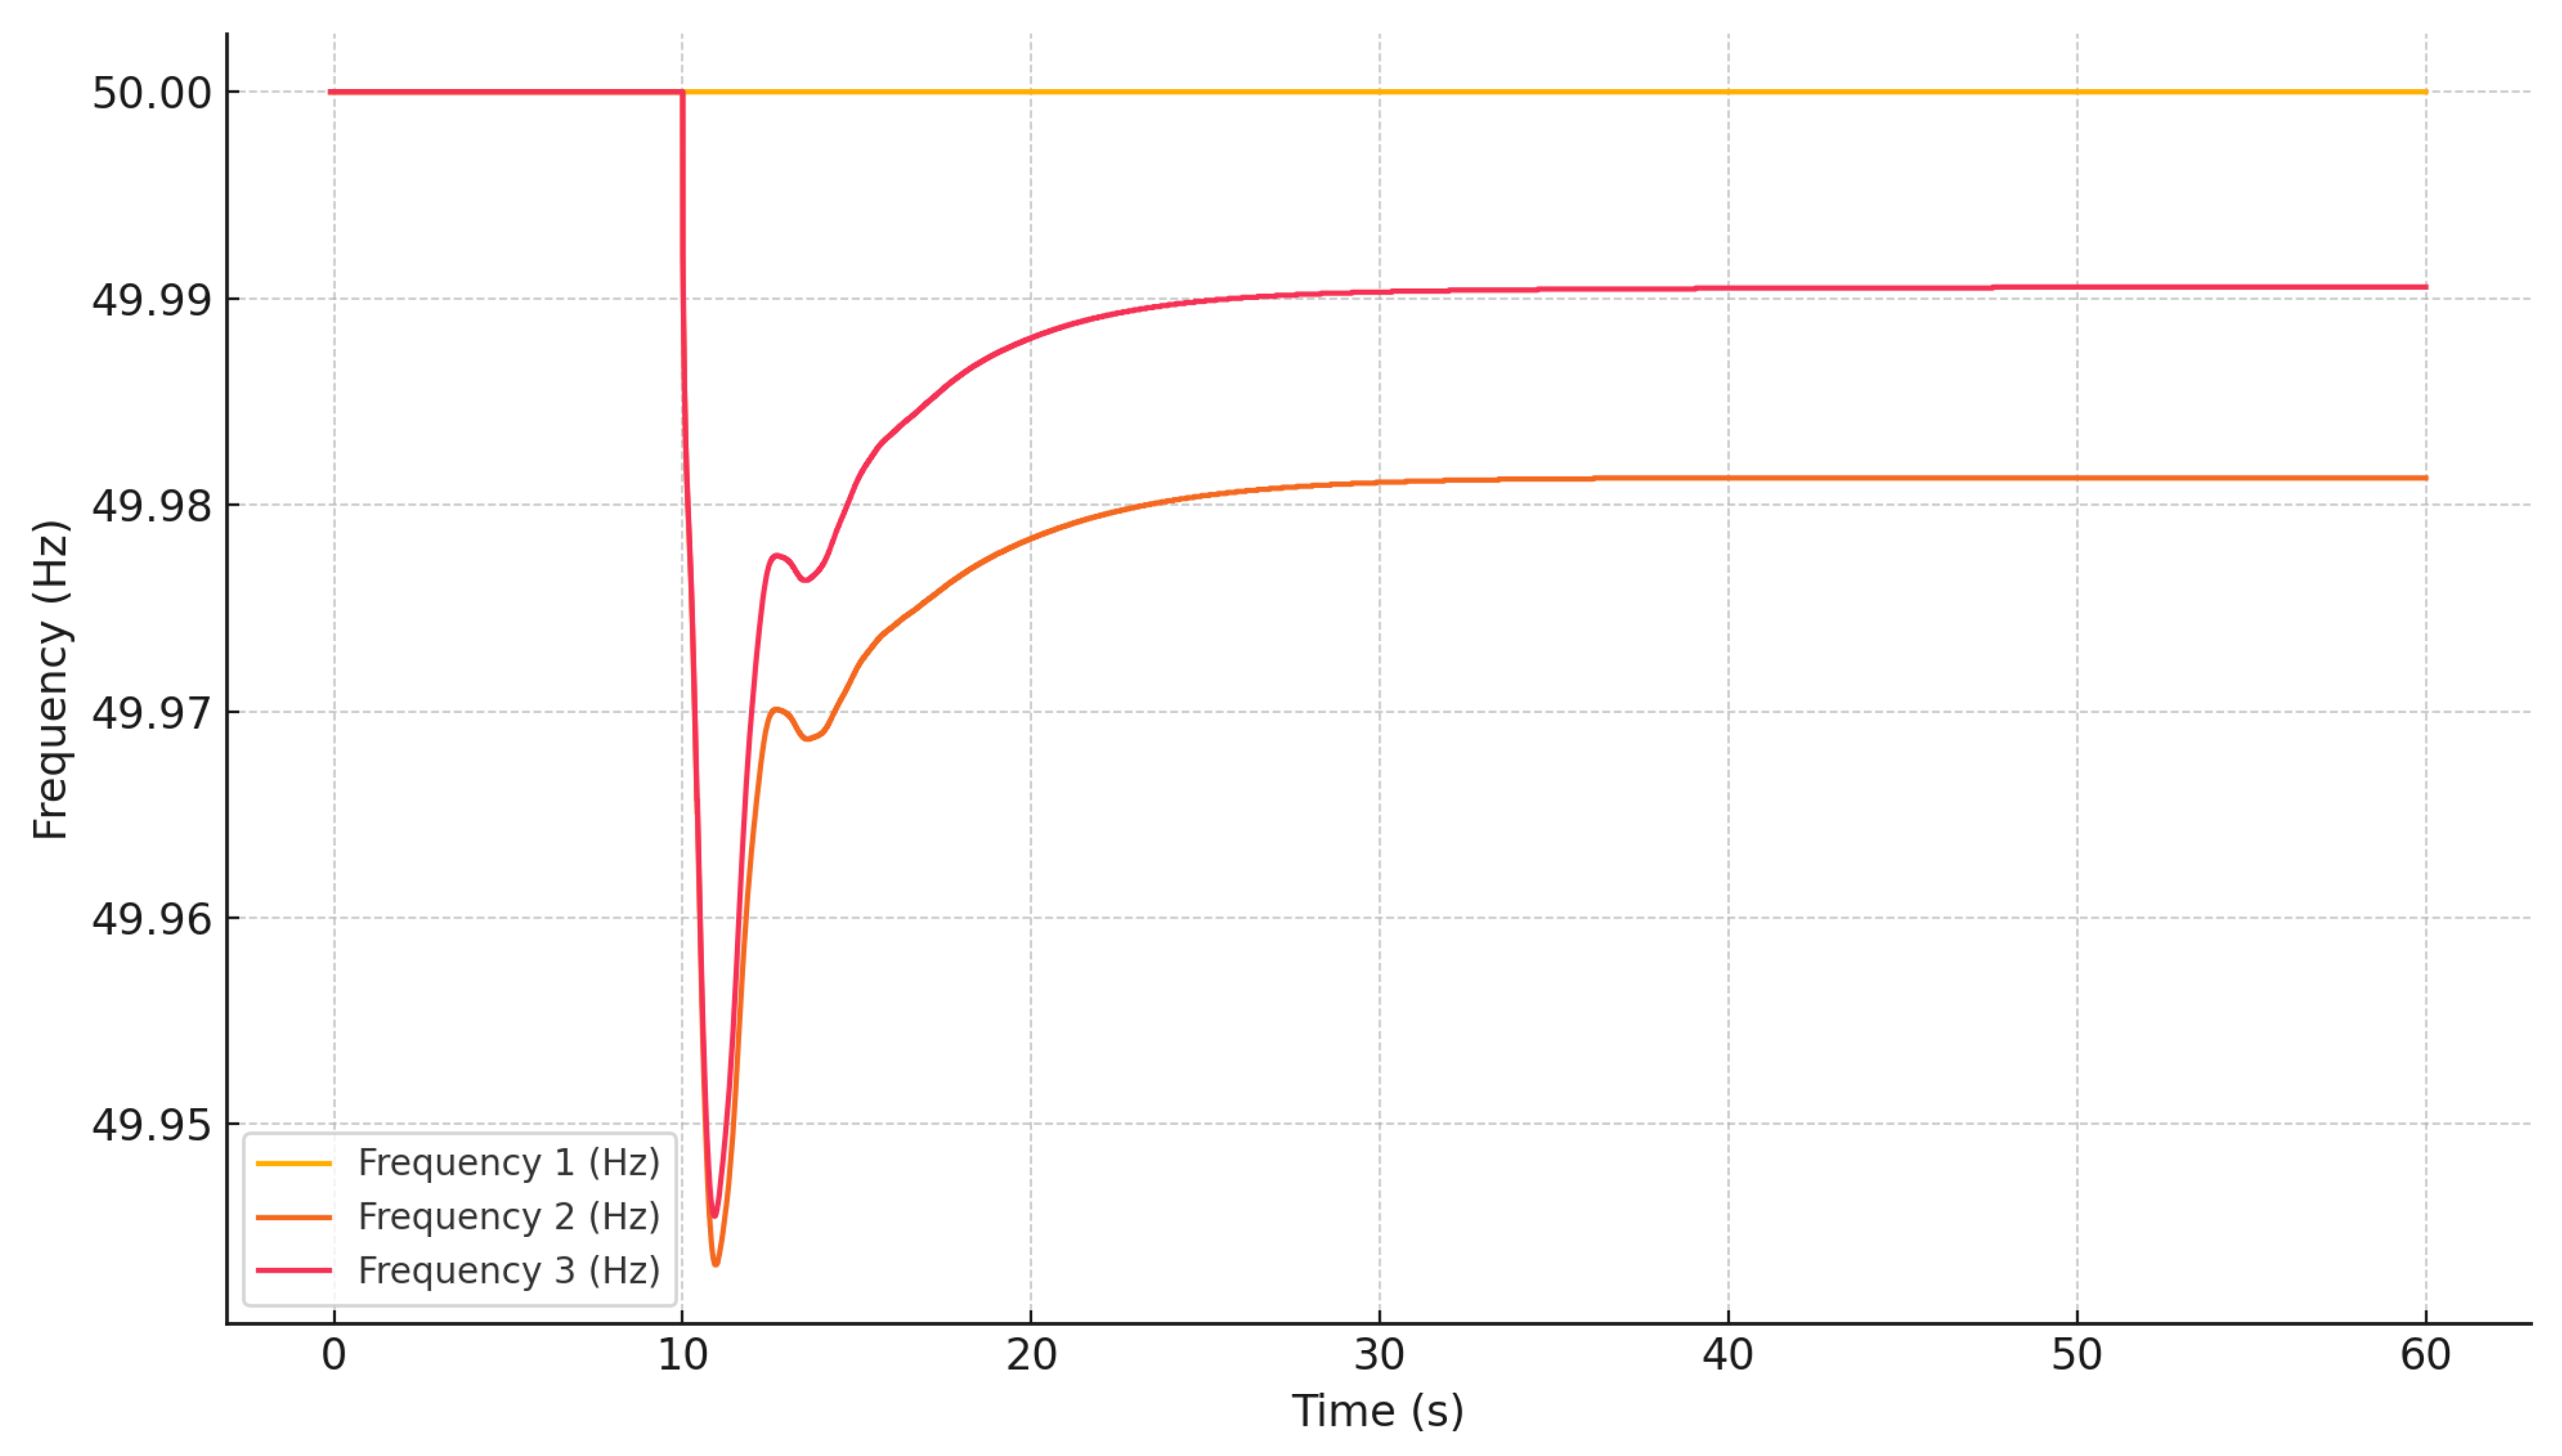
Figure 11 illustrates the frequency response of a power system under different conditions. Frequency 1 represents the system without any fault and remains stable at 50 Hz, reflecting the ideal operating behavior. In contrast, Frequency 2 shows the system’s response to a fault without any inertial support, resulting in a sharp and prolonged frequency dip that highlights the system’s vulnerability and lack of resilience. Frequency 3, however, includes an inertial response provided by electric vehicles or battery energy storage systems (BESSs) leading to a noticeably smaller frequency drop and faster recovery.
4. Conclusions
This study assessed the impact of electric vehicle (EV) penetration on the frequency stability of Curaçao’s power network. By conducting a series of simulations, various levels of EV participation were examined in scenarios of minimum, average, and peak demand. The key findings highlight both the potential risks and benefits associated with EV integration into the power grid.
The results indicate that increasing EV penetration can significantly affect frequency stability, particularly during simultaneous EV disconnection events. The observed rise in the RoCoF and frequency zenith values suggests a weakening of the grid’s ability to withstand frequency disturbances, especially under high EV penetration scenarios. These findings emphasize the importance of implementing robust control mechanisms and demand management strategies to counteract potential instability.
Conversely, the study also found that in scenarios involving generation loss, a higher EV presence—when effectively regulated—can enhance system inertia. The increase in frequency nadir values and the reduction in the RoCoF in these cases suggest that a well-regulated EV integration strategy, potentially incorporating vehicle-to-grid (V2G) technology, could enhance frequency stability by acting as a controllable energy resource.
To facilitate large-scale EV adoption while preserving power system stability, it is essential to implement coordinated charging strategies, enhance grid flexibility, and establish advanced regulatory frameworks. Future research should explore the dynamic behavior of EV charging infrastructure under real-time conditions and assess the role of smart grids in optimizing frequency response to contingencies. We would also highlight, for future research, areas such as incorporating more detailed EV models, adaptive frequency control mechanisms, effect of ultra-fast charger and stochastic analyses to enhance the accuracy of frequency impact assessments.


 ,
, 


