Abstract
The reclamation of exhausted open-pit coal mines is an energy-intensive and costly process. Traditional methods offer no economic return. This study explores the feasibility of using autonomous electric dump trucks (EDTs) to fill the pit, leveraging regenerative braking during descent to generate energy and reduce operational costs. A comprehensive energy balance model was developed based on the operational cycle of the Komatsu HD605-7 (E-Dumper) in the unique downhill-loaded logistics of the Pery quarry. The model incorporates vehicle dynamics equations, including rolling resistance, gradient, and aerodynamic forces, to calculate net energy consumption per cycle. Three energy storage system (ESS) configurations were compared: NMC/NCA batteries, LiFePO4 (LFP) batteries, and a hybrid LFP + supercapacitor (SC) system. Simulation results demonstrate that the net energy per cycle decreases with increasing payload capacity, even becoming negative (net energy generation) for loads above 110 tons due to powerful regenerative braking on the 13% descent grade. The hybrid LFP + SC system proved most efficient, achieving the lowest specific energy consumption (kWh/ton) by effectively capturing high-power regenerative currents. While LFP batteries have a lower energy density, their superior cycle life, thermal stability, and safety make them the optimal choice for the harsh mining environment. The proposed operation strategy, utilizing EDTs in a downhill-loaded cycle, transforms mine reclamation from a cost center into a potentially energy-neutral or even energy-positive process. A hybrid ESS with LFP batteries and supercapacitors is recommended as the most reliable and efficient solution for this specific application.
1. Introduction
The sharp deterioration of the environmental situation in recent decades has led to the need to find effective ways to minimize the harmful impact of human activities on the environment, reflected, in particular, in decisions to limit emissions of harmful substances into the atmosphere. In the automotive industry, this gave rise to a boom in the replacement of internal combustion engines with electric motors and the use of various batteries as a source of energy; in the energy sector, there was the replacement of traditional thermal power plants with solar, wind, and nuclear ones [1].
From a systems perspective, the climate benefit of electrified traction is conditional on the carbon intensity of the electricity used for charging. Electric drives eliminate local tailpipe emissions, yet well-to-wheel (WTW) or lifecycle impacts vary with the grid mix: renewable or low-carbon supply amplifies benefits, while coal- or oil-based generation reduces them. This dependency has been emphasized in transport efficiency studies, including analyses of electric energy as traction power in real transport contexts [2]. In the present work, we therefore state our TTW modeling boundary and discuss how different charging mixes would qualitatively shift net emissions for the proposed downhill-loaded EDT operation.
At the same time, the deterioration of the environment is caused by the impact not only on the atmosphere, but also on the lithosphere of the Earth. This is especially clearly manifested in open-pit mining: after the completion of mining, as is known, there is a need for land reclamation, the first stage of which is the backfilling of the quarry [3]. The most problematic ones in terms of ecology are coal mining quarries. This is explained by the fact that modern mining technologies do not allow coal complete extraction, which subsequently leads to spontaneous combustion of the remaining coal and the emission of combustion products into the atmosphere [4,5].
The volume of reclamation work depends on the size of the quarry, and its backfilling requires significant costs [6]. As an example, we can cite the deepest Korkinsky coal mine in the Urals, over the 70 years of operation of which about 250 million tons of coal and 1.5 billion tons of soil have been extracted from the bowels of the Earth. Its reclamation requires huge energy costs, which will not give any economic effect in the form of the produced product [7].
Reducing energy costs and obtaining an economic effect can be achieved by using dump trucks with autonomous power sources to fill the quarry. As experience in the automotive industry has shown, lithium-based galvanic cells are used as an autonomous source [8]. Depending on the operating conditions, circuit designs, and operating characteristics, double electric layer capacitors can be an alternative.
Of the autonomous sources of electrical energy currently used in vehicles with an electric drive (diesel generator sets, fuel cells, accumulators, capacitor units), galvanic cell and capacitor sources are competitive due to the peculiarities of their characteristics and operating conditions. The undoubted advantage of the latter is their ability to retain their properties in a wide range of environmental temperature changes without reducing their service life [9,10].
The global environmental agenda of recent decades has stimulated an active search for technologies that minimize the anthropogenic impact on the environment. In the transport sector, this trend has been expressed in the rapid development of electromobility, where the main focus of research and development has traditionally been on passenger transport and urban logistics [11,12]. However, large industrial facilities, such as open-pit coal mines, also make a significant contribution to environmental pollution. Their reclamation after development is a large-scale and extremely energy-consuming task that does not bring economic returns and requires the processing of colossal volumes of soil [13].
Existing approaches to reclamation, as a rule, do not consider it as a potential object for the use of “green” technologies and optimization of energy consumption. At the same time, the specific logistics of the pit backfilling process, when the dump truck moves empty upwards and loaded downwards, create unique conditions for energy recovery during braking along the downhill. This fundamentally distinguishes this task from the classic scheme of operation of quarry equipment (removal of rock loaded upwards) and opens up the potential for creating an energy-efficient or even non-volatile system [14,15].
Scientific novelty and purpose of the study. Most of the studies devoted to mining electric dump trucks, such as the work on the analysis of the famous Komatsu HD605-7 (E-Dumper) [16], focus on their application for mining. The scientific novelty of this study lies in the comprehensive analysis of the use of electric vehicles for the reclamation of coal mines, which implies inverted logistics and a radically different energy balance [17].
The purpose of this work is to develop a mathematical model of the energy balance of a mining electric dump truck to substantiate the choice of the optimal carrying capacity and configuration of the power plant (type of energy storage) in the conditions of the “quarry backfill” cycle. To achieve this goal, the following tasks are solved in the work:
- -
- Development of a detailed model of the resistance forces and calculation of the regenerative braking energy during the descent.
- -
- Performance of parametric analysis to determine the dependence of net energy consumption per cycle on the truck’s payload.
- -
- Comparative analysis of different types of energy storage devices (NMC/NCA, LiFePO4 batteries, and hybrid LiFePO4 system + supercapacitors) according to the criteria of energy efficiency, reliability, and suitability for harsh operating conditions.
- -
- Justification of the optimal charging scheme combining recuperation and stationary charging.
The article is structured as follows. Section 2 (Materials and Methods) presents a mathematical model of the energy balance and the equations of vehicle dynamics, and describes the considered configurations of energy storage devices. Section 3 (Results and Discussion) contains the results of the simulation, analysis of the impact of load capacity on energy consumption, and a comparative assessment of various energy storage systems. Section 4 (Conclusions) summarizes the main findings of the study and formulates practical recommendations for designers and operators of mining equipment.
2. Materials and Methods
The methodological basis of the research is based on a comprehensive analysis of the processes of movement of mining electric dump trucks in the conditions of reclamation of open-pit coal mines and on the synthesis of a mathematical apparatus that makes it possible to assess energy costs and recovery potential in various modes of their operation [18]. It is based on a general plan of experimental and computational work aimed at studying the energy balance during the technological cycle of transporting rock mass to the quarry. In the course of the work, special attention was paid to the practical analysis of the possibility of reducing energy consumption through the use of regenerative braking in specific operating conditions, when a mining dump truck goes down the track with a load and is forced to apply an electric brake, generating electricity [19].
Our model quantifies vehicle-level energy flows (TTW): rolling, grade, aerodynamic, inertial forces, drive, and recuperation efficiencies. Emissions associated with charging are not computed here; they depend on the upstream electricity generation mix. When interpreting results, net GHG outcomes should therefore be obtained by combining (a) the modeled electricity required from the grid per cycle (after subtracting recuperated energy) with (b) an application-specific grid emission factor (e.g., site utility, on-site renewables, or contracted low-carbon supply). This distinction is important in reclamation sites where on-site generation or contracted green power may be feasible.
In line with the reviewer’s suggestion, we complement our TTW-focused analysis with an illustrative diesel benchmark. We define a like-for-like diesel baseline for the same duty cycle and report an indicative tailpipe CO2 per tonne of material moved, derived from throughput figures already used in this paper. A full total-cost-of-ownership (TCO) comparison is highly site-specific (fuel price contracts, maintenance, and utilization), so here we provide a transparent framework and a minimal, reproducible CO2 calculation, while deferring a detailed TCO quantification to future work.
In this work, the traction forces are first simulated, and the energy recovery potential in different sections of the route is determined. Next, the volume of soil and energy costs for its movement are calculated, including an analysis of the cost per trip for dump trucks of different carrying capacities. Based on this data, the optimal load capacity of the machines is determined, and the various battery systems are compared in terms of energy efficiency and operational reliability, including hybrid solutions with supercapacitors. Special attention is paid to the choice of battery recharging schemes [20], taking into account the combination of recuperation and stationary replenishment. The final stage is modeling the energy balance of dump trucks for different types of energy storage devices (NMC/NCA, LiFePO4, LiFePO4 + supercapacitors), the construction of dependencies of energy consumption on the payload capacity and weight of the battery, and the comparison of their specific indicators to substantiate the optimal configuration of the energy system [21].
The experiments and computational procedures relied on the data from the Komatsu HD605-7 electric dump truck, known as the E-Dumper, created by a consortium of E-Mining, Empa, NTB Interstaatliche Hochschule für Technik Buchs, and engineers at the University of Bern, which is by far the world’s largest electric mining truck. This unique vehicle was used as a prototype for calculations, which made it possible to form a representative base for modeling the operation of such rolling stock in a quarry [22,23].
As equipment, the study took into account the technical characteristics of the Komatsu HD605-7 (E-Dumper) mining electric dump truck, equipped with electric motors with the regenerative braking function, powerful lithium-ion batteries, and an electricity conversion system [24]. This study is computational and does not report newly acquired field measurements; instead, we rely on published specifications and the reported performance of the Komatsu HD605-7 (“E-Dumper”) for model parametrization and validation. To meet transparency and reproducibility criteria, we provide a dedicated table summarizing the vehicle and electric drive system parameters used in simulations (Table 1) and a compact table consolidating numerical assumptions, limits, and efficiency coefficients that play the role of measurement-related inputs to the model (Table 2).

Table 1.
Vehicle and electric drive system parameters used in simulations (Komatsu HD605-7, “E-Dumper”).
Table 2.
Numerical assumptions, limits, and “measurement-related” inputs used for simulation and validation.
The parameters of the power plant and energy storage devices were taken in calculations in accordance with factory data and published sources, which made it possible to reproduce the dynamics of charge–discharge processes in various modes of movement. To simulate the traffic cycle, data from the Pery quarry track, located in Switzerland, about 100 km from Zurich, were used. The peculiarity of this quarry is that the logistics of the movement of the dump truck are fundamentally different from the usual transportation schemes: an empty dump truck rises to the surface, where it is loaded with rock, and then goes down into the pit at an angle of about 13 degrees, while recovering significant amounts of energy. This unique configuration allows, in some cases, fully compensating for the energy costs of lifting the dump truck back, but such efficiency is practically not reproducible in other mining conditions, which emphasizes the uniqueness of the chosen object of study [25].
Prior studies on electric (or hybrid) mining trucks predominantly evaluate conventional duty cycles with loaded ascent and empty descent, focusing on regenerative control strategies, braking force distribution, and energy management on slopes [23,24]. In parallel, recent reviews and modeling works compare battery-only, trolley-assist, and hybrid configurations, and emphasize the role of hybrid energy storage (battery + SC) for accepting high-power regen pulses [26,27]. Against this background, our study quantifies a distinct “downhill-loaded reclamation” cycle (empty-up/loaded-down) specific to Péry, derives the payload threshold for net generation under TTW boundaries, and analyzes how converter/ESS acceptance and segment kinematics (speed, descent length) shift that threshold. To our knowledge, the combination of downhill-loaded logistics, explicit payload-at-threshold reporting (≈110 t in our baseline), and side-by-side ESS comparison with acceptance limits has not been compactly reported in the prior work. These additions complement site-level techno-economic comparisons by providing transferable sensitivity relations (grade/length/speed vs. net balance).
The technological cycle of filling the open pit is shown in Figure 1. It includes successive stages. These are the loading of soil on the surface, moving it from the place of loading to the open pit at an lload distance, lowering a dump truck with a load inside the open pit at an l distance. There is also unloading at the bottom with moving there at an ldump distance, lifting the empty dump truck to the surface, and moving to the waste heap for the next loading. Each section is characterized by its own energy features associated with the need to overcome the rolling resistance of the wheels, aerodynamic loads, slopes of the track, and inertial components during acceleration. In particular, net energy consumption occurs in the load section, and both costs and energy return to the battery are possible in the l section, which is determined by the balance of rolling and resisting forces. When a loaded dump truck descends, especially with a significant weight of transported material, there is an excess rolling force, which is compensated by electric braking, which provides recuperation [26].
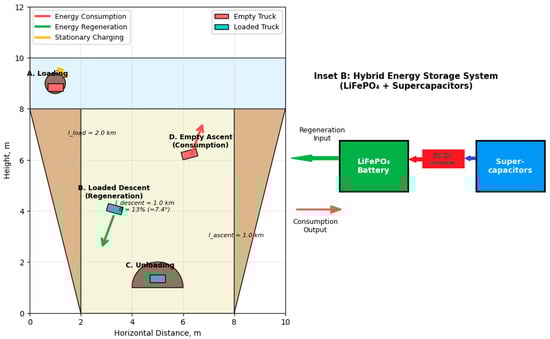
Figure 1.
Operational cycle and energy management of electric mining dump truck in quarry reclamation.
A detailed diagram of the quarry backfilling process using the Komatsu HD605-7 autonomous electric quarry dump truck (E-Dumper) in Figure 1 includes the following characteristics:
- -
- Cycle stages: A—Loading at surface, B—Loaded descent (regenerative braking), C—Unloading at pit bottom, D—Empty ascent (energy consumption);
- -
- Energy flows: Red—consumption, Green—regeneration, Yellow—stationary charging;
- -
- Key parameters: Empty weight 45 t, payload capacity 65 t, slope gradient 13%, descent/ascent length 1.0 km;
- -
- Hybrid energy storage system (LiFePO4 + Supercapacitors) enables efficient regenerative energy capture and extends battery life.
The model uses vehicle-motion equations with rolling resistance, aerodynamic drag, slopes, and inertial loads [27]. Rolling resistance is the sum of axle loads with coefficients set by road, wheel, and ambient conditions; for dry surfaces, equal coefficients across axles simplify and generalize the model. Aerodynamics depend on drag coefficient, frontal area, and speed, while slopes add costs or enable energy recovery on descents [28]. Electric braking is formalized by linking any surplus of rolling force over total resistance to generated energy, yielding a quantitative recuperation estimate [29].
Local motion equations are transformed into integral expressions for the whole route [30], allowing calculation of total energy use and return per cycle and tying pit geometry (depth, level radii, road gradients) to track length and energy costs. The approach accounts for stepwise backfilling distance changes to obtain average energy metrics, and relates battery state of charge to terminal voltage to simulate storage dynamics over the full transport cycle [31].
The goal is a universal model that captures dump-truck physics in quarry conditions and supports optimization of equipment and operating modes for maximum energy efficiency [32]. It identifies payload, route length, and gradient ranges that maximize recovery and shows how far recuperation offsets total cycle energy—key for reclamation planning where autonomous energy sources must be justified environmentally and economically [33]. Uniquely, the focus is reverse logistics: the truck descends loaded with rock, unlike traditional coal haul-up scenarios, necessitating a distinct recuperation calculation; the model is thus tailored to backfilling rather than mineral export [34].
The practical value of the approach is manifested in the assessment of the efficiency of the unique E-Dumper mining electric dump truck in Pery conditions. According to the calculations, even taking into account adverse winter conditions, when the self-discharge of batteries increases and the recovery yield decreases, the overall energy efficiency remains at a high level. On average, a mining truck is capable of transporting about 300,000 tonnes of rock mass over a ten-year period, eliminating local tailpipe emissions from the vehicle. Net (WTW) GHG reductions depend on the carbon intensity of the charging electricity; with renewable or low-carbon supply, the overall reduction is maximized, whereas carbon-intensive grids diminish the benefit. Comparable diesel machines would emit up to ~130 t of CO2 annually at the point of use. With the reported annual throughput (~30,000 t·y−1), this corresponds to an indicative tailpipe intensity of ≈4.3 kg of CO2 per tonne of the material moved. However, such high efficiency is only achieved due to the unique configuration of the track and the logistics of the Pery quarry, and it is extremely difficult to replicate these conditions in other places. Table 3 shows the calculated parameters and their description used for the mathematical model.
Table 3.
Design parameters and their description used for the mathematical model.
2.1. Case Study and the Unique “Downhill-Loaded” Logistics
This study is based on a fundamentally unique operational paradigm for mining haul trucks, implemented at the Pery quarry in Switzerland. Unlike conventional mining operations, where a loaded truck climbs out of the pit, the reclamation process necessitates an inverted logistics cycle, as shown in Figure 1:
- -
- Empty Ascent: The truck ascends to the top of the pit empty.
- -
- Loaded Descent: The fully loaded truck descends into the empty pit, using regenerative braking.
- -
- Empty Return: After unloading, the empty truck returns to the start.
The object of this study is the Komatsu HD605-7, known as the “E-Dumper”, the world’s largest electric vehicle, developed for this operation. Its specifications are summarized in Table 4.
Table 4.
Technical specifications of the Komatsu HD605-7 (E-Dumper).
2.2. Mathematical Model of Vehicle Dynamics and Energy Balance
A longitudinal dynamics model was developed to calculate the traction force and energy flow for each segment of the operational cycle.
2.2.1. Forces Acting on the Vehicle
The total motion resistance force () is given by the following:
- -
- Rolling Resistance Force ():
- -
- Aerodynamic Drag Force ():
- -
- Grade Force ():
This force is negative during descent (acting as a driving force).
- -
- Inertial Force ():
2.2.2. Traction Force and Power Calculation
The required traction force at the wheels () is as follows:
During descent, when , becomes negative (braking).
The mechanical power at the wheels ( (W)) is as follows:
The electrical power of the battery () is as follows:
- -
- Propulsion (consumption):
- -
- Regeneration (generation):
In the regeneration mode, there is the generator back electromotive force, and hence the available braking power scales with wheel speed. Consequently, at low vehicle speeds, the inverter cannot sustain high recuperation power, and the energy recoverable over a short descent is further constrained by the segment duration, as well as the converter and ESS current limits (battery and SC).
In the hybrid ESS, the supercapacitor (SC) bank is modeled as a high-power buffer interfaced to the main 600 V DC bus (Table 1) via a bidirectional DC/DC stage that enforces current smoothing and voltage matching between the SC stack and the traction DC-link. The SC stack is represented as a series–parallel aggregation of commercial cells (2.7–3.0 V class) sized to provide a bus-compatible voltage window and headroom for regenerative peaks. The effective stack window is constrained to the DC-link range used in this study (≈600 V nominal with permissible excursions set by the converter limits in Table 2), while maintaining a conservative SC state-of-charge band to preserve pulse capability. The bank’s equivalent series resistance (ESR) is captured at the stack level (a low-milliohm range for the modeled mass scale), which limits instantaneous current and, together with the DC/DC converter limits, caps the admissible regen power delivered to the DC-link (a practical 200–800 kW window, Table 2). The energy transfer follows a priority rule: during braking, the DC/DC controller first routes power to the SC bank up to its target state for pulses, then it back-fills the battery within its charge-acceptance bound (Pcharge,max(SOC,T)); during traction transients, the SC bank supplies peak power to reduce battery current ripple. The converter efficiency is included as a fixed map consistent with high-efficiency automotive DC/DC stages (≈97–98%), yielding a round-trip buffer path efficiency of ≈95–97% for short pulses; any theoretical overflow beyond the converter, DC-link or Pcharge,max limits is diverted to friction braking/dump resistors and accounted for as thermal loss in the energy balance.
In all simulations, the instantaneous regenerative power was bounded as follows:
where PDC-link and Pmotor/inverter represent hardware limits (Table 2, a practical 200–800 kW window), and Pcharge,max(SOC,T) is the battery charge-acceptance limit. For representative operating windows used in this study, we applied the following effective caps:
- NMC pack (700 kWh): at SOC 30–70% and T = 15–35 °C, the effective cap was ≈600–700 kW; at SOC 80–90% and/or T ≤ 0 °C, it derated to ≈300–500 kW.
- LFP pack (a usable window of 80% DoD): at SOC 20–60% and 15–35 °C, the effective cap was ≈500–600 kW; at SOC ≥ 80% and/or T ≤ 0 °C, it amounted to ≈250–400 kW.
- LFP + SC hybrid: short-pulse acceptance of up to ≈700–800 kW at SOC 20–60% and 15–35 °C (SC buffers peaks), with the battery inflow smoothed to ≈400–600 kW; at SOC ≥ 80% and/or T ≤ 0 °C, it was ≈300–450 kW.
Any theoretical excess beyond these caps is diverted to friction braking or dump resistors and is accounted for as a thermal loss in the energy balance (Section 2.2.2).
In all simulations, regenerative power was explicitly bounded by the hardware and electrochemical acceptance limits of the system. The instantaneous regenerative power Pregen was constrained not only by the inverter and DC-link capabilities (200–800 kW practical window; Table 2), but also by the maximum battery charge-acceptance power (Pcharge,max (SOC,T)). This upper limit reflects the SOC-dependent charge current and temperature-dependent power capability of LiFePO4 and NMC/NCA cells, as reported in the manufacturer’s data. For the baseline temperature range (–10… +40 °C) and SOC ≤ 0.9, the effective Pcharge,max corresponds to 0.8–1.0 C for LiFePO4 and 1.0–1.5 C for NMC/NCA systems, ensuring that recuperation never exceeds safe charge limits of the ESS.
When the theoretical regenerative power demand (Pregen,th) exceeds any hardware or electrochemical limit (inverter/DC-link or Pcharge,max (SOC,T)), the excess energy is automatically diverted to the auxiliary dissipation path (either friction braking or dump resistors) and accounted for as a thermal loss. In the energy balance, such overflow power is treated as non-recoverable, ensuring that total braking work is conserved while maintaining realistic recuperation efficiency boundaries.
2.2.3. Energy Calculation for a Trip Cycle
The net energy change for the (J) battery for a complete trip is the time integral of the battery power:
A negative indicates net energy generation per cycle.
2.3. Numerical Parameters for Simulation
The model was implemented with the parameters from the E-Dumper’s operation:
- -
- Route: m (horizontal); m; .
- -
- Operation: m/s (30 km/h).
- -
- ESS Configurations: The model simulated three scenarios:
- -
- NMC Battery: Specific energy was 220 Wh/kg, DoD = 90%.
- -
- LFP Battery: Specific energy was 140 Wh/kg, DoD = 80%.
- -
- LFP + SC Hybrid: LFP battery + a supercapacitor bank ( kg).
All computations were performed in Python 3.11 using an open-source stack: NumPy (BSD-3-Clause), SciPy (BSD-3-Clause), pandas (BSD-3-Clause), Matplotlib (Matplotlib License, BSD-compatible), and Jupyter Notebook v7.1.3 (BSD-3-Clause). Python itself is released under Python Software Foundation License 2.0. No proprietary solvers were used; the license terms permit reuse for research and commercial purposes with attribution.
The model is deterministic; therefore, repeated runs with identical inputs produce identical outputs. For transparency, each scenario reported in Table 1, Table 2 and Table 3 was executed 30 times at the same workstation and yielded bitwise-identical values of net energy, i.e., run-to-run standard deviation = 0.0 kWh for all payloads and ESS configurations (repeatability check). We additionally verified numerical stability by varying the fixed-step integrator time step of Δt∈{0.05, 0.10, 0.50}s; across all payloads (60–130 t) and ESS options, the net-energy change remained within ±0.3% relative to the Δt = 0.10 s baseline (discretization sensitivity). To support independent reproduction, Section 2.4 lists all operative parameters (a grade, speed, a rolling coefficient, and efficiencies).
Grade vs. path-length trade-off (fixed elevation drop). For a fixed vertical drop (HHH), the gravitational potential (mgHm g HmgH), and thus the ideal gross recoverable energy, is independent of the ramp grade. However, losses and power limits are grade-dependent: a milder grade implies a longer path (l = H/sinθ) and more rolling drag work (∝ l). A steeper grade shortens l (reducing distance-proportional losses), but raises instantaneous braking power, increasing the chance of converter/ESS power clipping and thermal limits (Section 2.2.2), especially if downhill speed is capped for safety. Hence, energy and productivity outcomes depend on the geometry–speed–power coupling rather than on the grade alone.
2.4. Model Validation and Assumptions
The model was validated by ensuring calculated net energy aligned with the reported real-world performance of the E-Dumper. Key assumptions include a constant average speed and the neglect of minor transient dynamics. To address the reviewer’s request, we compiled a compact validation table that juxtaposes the reported operating data/ranges for the E-Dumper at the Péry quarry with our model outputs under the same geometry and parameters. In the cases when public sources provide ranges rather than single-point measurements (e.g., recuperation efficiency and a practical regen power window), we use the reported ranges and compute model results under the baseline of the 13% grade, regulated downhill speed of 8 m·s−1, and E-Dumper parameters summarized in Table 1 and Table 2 of this paper. We also report the error as model–reported (absolute and relative when meaningful). This quantitative check complements the earlier qualitative statement and clarifies error bounds.
Since the solver and efficiency maps are deterministic, reproducibility across repeats is exact (Section 2.3): 30 re-runs per scenario give identical net-energy results (SD = 0.0 kWh). As a data-stability proxy, we assessed sensitivity to numerics by coarsening/refining Δt (0.05–0.50 s), which altered net energy by ≤0.3% across payloads and ESS options. The operating parameters used for replication are listed below (grade = 13%, v = 8 m·s−1, crr = 0.01; drive = 0.92; recuperation = 0.85–0.95).
The model parameters are as follows.
- -
- Calculations are made for a slope of 13%, a speed of 8 m/s, a rolling coefficient of 0.01.
- -
- Drive efficiency is 92% and recuperation is 85–95%.
Throughout this paper, we use a 13% grade (≈7.4°), following the Pery quarry case that underpins our parametrization; this value is not a universal design recommendation. For clarity, we interpret “13” as a percent grade (rise/run), not degrees. The choice reflects the documented route geometry of the case study and serves as an input to sensitivity reasoning rather than a prescriptive optimum. The baseline 13% grade and segment lengths were taken directly from the documented Péry reclamation route that underpins our parametrization. In the case study, trucks follow an approach of about 2.0 km on the quasi-level ground and a ~1.0 km regulated descent/ascent segment into/out of the pit. These values are therefore inputs reflecting the site geometry, non-optimized design parameters. The baseline speeds and efficiencies used in our code mirror this geometry (Section 2.3), where we explicitly set l1 = 2.0 km (horizontal approach) and l↓ = l↑ = 1.0 km with a ±13% grade.
Downhill speed control and cycle-time accounting. In line with safety and power-electronic limits, we assume a target regulated downhill speed of vdown (a baseline of 8 m s−1) maintained by regenerative braking. The trip time is computed explicitly as , where li is the segment length and average speed (approach, downhill, bottom maneuvering, uphill). Productivity is and site throughput is . There is a reduction of . In the quasi-steady model, net energy per cycle is weakly sensitive to speed (aerodynamic term and efficiency maps), while very low speeds can reduce recuperation power acceptance (generator EMF/time window limits), as discussed in Section 2.2.2.
Scripts were executed at a 64-bit workstation (x86-64). The code is platform-agnostic and reproducible on Windows, Linux, or macOS with Python ≥ 3.10. Package versions used in the study were Python 3.11; NumPy 1.26; SciPy 1.11; pandas 2.1; Matplotlib 3.8; JupyterLab 4.0.
3. Model Application and Computation Procedure
Based on the above methodology, calculations were carried out aimed at quantifying the energy balance of a mining electric dump truck during the open-pit backfill cycle. The analysis considered the forces of resistance to movement along various sections of the route [35], as well as the conditions under which partial or full reimbursement of energy costs through recuperation is possible. Particular attention is paid to the influence of track parameters and operational factors [36] on the value of traction forces and electricity consumption, which made it possible to proceed to a more detailed consideration of the equations describing the movement of a vehicle [37].
For clarity of data stability, we note that all tabulated and plotted values originate from a deterministic solver; 30 exact repeats per scenario produced identical numbers (SD = 0.0 kWh), and discretization tests across Δt= 0.05–0.50 s kept the net-energy variation within ±0.3% (Section 2.3 and Section 2.4). These checks confirm that the trends in Table 3 and Figures are not artifacts of numerical noise.
3.1. Simulation of Traction Forces and Energy Recovery During Pit Backfilling
In the case of automobiles, rolling resistance forces, when driving along a horizontal straight section of a track [38], are known to be calculated as the sum of the forces acting on each axle of the car:
where p is the number of axles of the vehicle; fi is the rolling resistance coefficient of the i-th axle; Gi is the weight of the car on the i-th axle.
The rolling resistance coefficient depends on such factors as the structure of the track, the condition of the wheels (the degree of tread wear, the amount of compressed air pressure in the pneumatic tire, etc.), and weather conditions [39]. Since the spread of these factors is difficult to take into account, the rolling resistance coefficient for all wheels of the car and their condition on dry road surfaces is usually assumed to be the same [40]. Under these assumptions, the rolling resistance force is calculated:
where is the weight of the rolling stock (dump truck).
The movement along inclined sections of the track is accompanied by a redistribution of loads on the axles [41] while maintaining the total resistance to movement; therefore, Formula (1) is valid in this case as well.
The movement inside the quarry also occurs on curvilinear sections of the track, which leads to a redistribution of loads between the wheels of different sides of the same bridge with a constant total load on the bridge. Since the movement in curves occurs at relatively low speeds and fairly large turning radii, the redistribution of the load between the wheels can be neglected [42].
Additional loads acting on the dump truck while driving include aerodynamic forces caused by air resistance, resistance forces during ascents, and inertial loads arising during the acceleration of the dump truck [43,44].
The aerodynamic component of the drag forces caused by air turbulence depends on the truck’s speed, cross-section, and streamlining, which is considered by the coefficient (αs), and is calculated according to the expression:
where αs = 0.6… 0.7 N·s2/m4 is the streamlining coefficient; is the cross-sectional area (overall); V is the speed of movement.
The component of the forces resistance to the movement from slopes is determined according to the expression:
where is is the slope value, which takes a positive value during the ascent and a negative value during the descent.
Overcoming the inertial forces arising at the moment of acceleration of the dump truck depends on its mass and the developed acceleration and can be calculated according to the expression [45]:
where γ is the coefficient of rotating masses of the car; and kaut = 0.05… 0.07; irg is the gear ratio of the gearbox.
Analysis of the modes of movement of the vehicle along different sections of the route makes it easy to identify that on the l1 section there is consumption of electrical energy, and on the l section there can be both energy consumption and its return to the source. Return occurs when the loaded dump truck is lowered into the quarry. For transparency, Table 5 in Section 2.4 now provides a side-by-side validation of our model against the reported E-Dumper operating data (a grade, regulated speed, a recuperation window, and a cycle-level recovery/net balance). The payload and segment-length sensitivities visible in Table 3 (this section) explain why the net-neutral/slightly net-generating behavior observed at Péry appears when the horizontal approach is short. With a longer quasi-level approach, the net sign shifts under lower payloads toward net consumption, converging near ~110 t.
Table 5.
Validation of the model vs. reported E-Dumper operation (Péry, baseline geometry).
It should be taken into account that the length of the l1 section is maintained during the backfilling process, and the length of the l section decreases as the pit is filled.
The operation of the traction drive when making a single trip along the route is generally determined by the expression:
where is the traction force on the i-th section of the route; li is the L1 or L section.
For example, when a loaded dump truck moves from the waste heap to the quarry (a section of the l1 route), the value of the traction effort is determined by the sum of the drag forces from the track structure [46] and the aerodynamic drag:
The amount of the work performed by the drive to overcome the inertial load during acceleration can be neglected due to the smallness of the size of the acceleration section compared to the length of the l1 path.
The mode of movement during the descent into the quarry depends on the ratio of the rolling force and the forces of resistance to movement [47]. Since the forces of resistance to movement, as well as the rolling force, depend on the weight of the loaded dump truck, the prevalence of the rolling force leads to the need to use the electric braking mode. This, in the case of recuperation, will allow recharging the traction battery, i.e., actually reducing the energy consumption of the dump truck [48]. The use of dump trucks of different payload capacities contributes to the production of different amounts of recuperation energy: a greater weight corresponds to a larger amount of recuperation energy [49,50]. In addition, an increase in the payload capacity of dump trucks leads to a decrease in the number of trips made.
The total energy consumption for the journey of one dump truck at the maximum length of the journey along the exit to the lmax quarry is determined by the expression:
The costs of moving soil to the quarry are determined primarily by the volume of the quarry, which for the most part has the form of an overturned cone or a body with a similar outline and can be determined on the basis of the known geometry of the expression:
where Ssur and Sbot are the areas of the quarry on its surface and at the bottom, respectively; Hpit is the depth of the quarry.
The mass (weight) of the imported soil depends on its composition and is determined by the expression:
where g is the density (specific gravity) of the soil, and the work performed to move it will be determined as follows:
where N is the number of dump trucks required for backfilling the pit; Gtruck is the payload capacity of the dump truck; hl is the height of one level; lekv is the equivalent path length of the dump truck, defined as follows:
where lj is the length of the dump truck downhill at the j-th level of the pit:
t is the number of levels in the pit.
The length of the dump truck’s path with soil changes as the pit is filled, from its maximum value when backfilling the bottom to the minimum when backfilling its surface level. In addition, it also depends on the value of the slope of the road during the isl descent.
The length of the dump truck path at the j-th level of the quarry is determined according to the expression:
where Rj = Rj − 1 − broad is the radius of the previous level of the quarry; broad is the width of the road.
The maximum value of the path length of the dump truck on the descent into the quarry is reached when the bottom is filled and is determined by the formula:
where
To determine the parameters of the energy storage device, it should be assumed that at the time of loading the dump truck, it had a maximum charge. By the time of the beginning of the descent into the quarry, the energy gained from it was spent to move along the l1 path, which can be determined according to the following:
where Unom is the voltage when the storage device is fully charged; U1 is the voltage of the storage tank at the beginning of the descent into the quarry.
The value of energy in the storage tank after unloading and the beginning of lifting is determined as follows:
where U2 is the voltage on the accumulator at the time of the beginning of the ascent.
The energy in the storage tank after rising from the pit and moving to the waste heap for loading (and recharging the storage pile) is determined by the expression:
where Umin = 0.8 Unom is the recommended minimum discharge voltage of the galvanic storage device to ensure its required service life.
3.2. Determination of the Volume of Soil for Backfilling the Quarry
The first stage in assessing the energy and technological costs of reclamation is to determine the volume of soil required for backfilling the quarry [51]. The configuration of most coal pits can be roughly described by a geometric shape close to a truncated cone or a body of rotation with similar outlines. In this regard, the calculation of the total volume is reduced to determining the difference in cross-sectional areas on the surface and at the bottom of the pit with subsequent multiplication by its depth [52].
According to geometric relations, the total volume of the quarry is determined by the expression:
where Ssur is the area of the quarry at the surface level; Sbot is the area of the bottom of the quarry; and Hpit is the depth of the quarry.
This expression takes into account the characteristic decrease in the cross-sectional area from the surface to the bottom of the pit and makes it possible to accurately estimate the required volume of soil, provided that the side slopes have a close to linear configuration [53].
For practical calculations, the values of Spov and Sdna can be determined on the basis of topographic data or project documentation. In case the quarry has a shape close to cylindrical or stepped, the formula can be adapted by dividing the quarry into several levels, the volume of which is calculated according to similar principles and then summed up.
Therefore, at this stage, the main parameter is determined, which directly influences the required number of trips of mining dump trucks, the total energy costs and the amount of recovered energy when operating electric vehicles in reclamation conditions.
3.3. Determination of Energy Costs for Soil Movement
After determining the volume of soil required to fill the quarry, the next step is to calculate the energy costs associated with its transportation. In this case, the key factor is the work performed by mining dump trucks when moving the rock mass from the place of loading to the open pit and back [54].
The total energy expenditure can be expressed in terms of the product of the mass of the soil being moved and the equivalent length of the path, taking into account all the resistance to motion. The weight of the transported material is determined by the expression:
where V is the volume of soil calculated according to the geometric configuration of the pit; g is the specific gravity (density) of the soil.
The total work on moving the soil to the quarry will be recorded as follows:
where N is the number of dump trucks required for backfilling; Gtruck is the carrying capacity of one dump truck; lekv is the equivalent length of the track, taking into account the peculiarities of movement at each level of the quarry.
The equivalent path length is defined as the sum of the lengths of the individual sections of the route adjusted for the number of levels:
where lj is the length of the dump truck moving downhill at the j-level of the quarry; t is the number of levels in the quarry.
Hence, the energy consumption for soil movement is formed as a function of the geometric parameters of the quarry, the physical characteristics of the soil, as well as the operational properties of dump trucks.
Of particular importance are the driving resistances on the different sections of the route: rolling forces, aerodynamic loads, slope resistance, and inertial effects during acceleration. When moving uphill, energy costs increase, while during descents, it is possible to partially replace the energy spent through recuperation [55].
The final energy balance for the entire process of filling the pit is determined not only by the volume of transported material, but also by the driving conditions, which directly affect the efficiency of the operation of the electric drive and battery systems of the mining dump truck [56].
3.4. Determination of the Cost of Soil Movement per Stroke of Dump Trucks of Different Carrying Capacity
To quantify the energy efficiency of mining dump truck operation in reclamation conditions, it is necessary to determine the cost of one trip depending on the carrying capacity of the machine. In this case, the movement is understood as a full cycle of transportation: the movement of an empty dump truck from the waste heap to the place of loading, loading with soil, descent into the quarry, unloading, and returning.
The total energy expenditure of the Whod can be expressed in terms of the traction drive to overcome the drag forces on each section of the route:
where Fth,i is the traction force on the i-th section of the route; li is the length of the corresponding section of the route.
The value of the tractive effort depends on the weight of the loaded dump truck, which is determined by the expression:
where Gd.w is the dead weight of the dump truck; Gdirt = ρ⋅Vdirt is the weight of the transported soil, depending on its volume and density.
Therefore, with an increase in carrying capacity, the weight of the transported material and, as a result, the forces of resistance to movement increase. This increases energy costs for overcoming resistance in the sections of horizontal and ascent movement. However, when descending into the quarry, the large mass also provides a greater potential for energy recovery through electric braking.
The energy balance of one walk can be represented as
where Wcon is the total energy expenditure to overcome all the resistance to movement; Wrec is the value of the recuperated energy in the descent section.
A comparison of dump trucks with different payloads shows that as the weight of the transported material increases, both absolute energy consumption and recuperation increase. At the same time, the relative costs (per ton of soil transported) can be reduced, which indicates an increase in the energy efficiency of heavier machines. The number of trips required for backfilling the quarry is additionally reduced, which also contributes to saving total energy resources.
In view of this, determining the cost per trip, taking into account the carrying capacity of dump trucks, makes it possible to form the basis for choosing the optimal rolling stock for the reclamation of open-pit coal mines.
3.5. Determination of the Optimal Carrying Capacity of the Dump Truck According to the Criterion of Minimum Energy Consumption for Soil Transportation
To select the rational parameters of a mining dump truck, when backfilling a quarry, it is necessary to determine the optimal carrying capacity according to the criterion of minimizing energy costs. This criterion reflects not only the absolute energy consumption for one trip, but also takes into account the number of trips required to move the entire volume of soil.
where Wtrip is the energy consumption per trip; is the number of trips required to transport soil weighing Mg; Gtruck is the carrying capacity of the dump truck.
Taking into account energy recovery, the final balance takes the following form:
This expression shows that with an increase in the carrying capacity of G, the number of trips decreases, which reduces the total energy consumption. However, at the same time, the forces of resistance to movement and the energy consumed per trip increase, as well as increased requirements are imposed on the power of the battery plant and traction motors.
The optimal load capacity is determined by the condition of the minimum function (). To find it, a comparative calculation of energy consumption is carried out at different values of carrying capacity. As a rule, for medium-depth quarries, the minimum specific energy consumption is reached in the range of 70–130 tons, but the specific values depend on the configuration of the route, slopes, soil properties, and parameters of energy storage devices [56].
4. Results and Discussion
The use of the criterion of minimum energy consumption makes it possible to rationally select the carrying capacity of a mining dump truck, reducing the total energy consumption during reclamation and increasing the efficiency of electric transport in mining conditions. It should be noted that the increase in payload, while improving energy efficiency, also results in higher mechanical stresses exerted on the truck structure, suspension, and braking system, as well as increased pressure on haul road surfaces. In practice, these factors may raise maintenance costs and require reinforcement of roadbeds or more frequent component replacement. Such structural and infrastructure effects were beyond the scope of the present energy balance model, but they will be considered in future work as part of the extended life cycle cost (LCC) assessment.
The dependence of specific energy consumption on load capacity is shown in Figure 2. The graphs in Figure 2 represent the ratio of net energy to load capacity based on the data in Table 2.
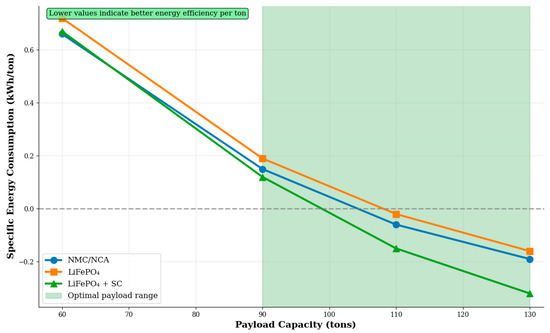
Figure 2.
The dependence of specific energy consumption on carrying capacity.
Key observations are the following:
- -
- All systems show a decrease in specific energy consumption with an increase in load capacity.
- -
- The hybrid system provides the lowest specific consumption under high loads.
- -
- Under loads of above 110 tonnes, all systems exhibit negative specific consumption (power generation).
Analysis of specific energy consumption (kWh/t) reveals an important pattern: with an increase in carrying capacity, specific energy consumption decreases significantly. This is due to two factors: first, a decrease in the number of trips required to transport a given volume of soil; second, a proportional increase in the recuperation energy with an increase in the weight of the cargo. The optimal lifting range (90–130 tons) corresponds to the minimum specific energy consumption. This payload interval (90–130 t) does not represent the actual capacity of the Komatsu HD605-7 (E-Dumper) used as a reference in Table 1, whose rated payload is 65 t. The extended range was used in the simulation as a parametric scenario to assess the sensitivity of energy balance and recuperation efficiency for potentially larger-class electric trucks operating under similar downhill-loaded logistics. Hence, the derived “optimal range” refers to the model-based extrapolation rather than to the specific prototype. The hybrid system demonstrates superiority over other configurations, especially in the high-load area.
Therefore, in Figure 2, we see the values of energy consumption for the transportation of one ton of soil. The green area highlights the optimal lifting range (90–130 tons), in which the minimum specific energy consumption is achieved. The hybrid system provides the best energy efficiency.
4.1. Selection of the Optimal Battery Option Based on the Comparison of Characteristics
The earlier calculations of energy consumption per stroke of the dump truck (Section 3.4) and the analysis of the optimal payload according to the criterion of minimum energy consumption (Section 3.5) showed that the battery was the central element that determined the efficiency of the operation of the mining electric dump truck. Even when choosing the optimal weight of the transported cargo, the total energy consumption and the number of trips depend on how stably the battery is able to work under significant loads and how efficiently it can accept recuperation energy. In view of this, the choice of a battery should be made not only according to the energy capacity, but also according to a set of characteristics that take into account durability, temperature stability, power capabilities, and cost.
When considering different types of energy storage, special attention was paid to lithium-ion systems based on nickel, manganese, and cobalt oxides (NMC/NCA), lithium iron phosphate (LiFePO4) batteries, as well as installations based on supercapacitors. NMC/NCA lithium-ion batteries have a high energy density and allow for a significant range with a lower weight. However, the energy calculations showed that even with a decrease in the mass of the battery, the main share of energy consumption was formed by resistance to movement and overcoming climbs, so the gain in energy capacity did not give a decisive advantage. At the same time, their operation in quarry conditions is complicated by sensitivity to low temperatures and comparatively lower cyclic durability.
Beyond specific energy and cycle life, quarry deployment prioritizes charge acceptance under pulsed currents and thermal safety at low ambient temperatures. LFP’s flatter OCV-SOC profile and thermal stability simplify thermal controls and reduce risk during prolonged regenerative braking. The supercapacitor buffer primarily serves to absorb short high-power surges on steep sections, smooth battery current, and to reduce heat generation and the aging of the main pack. This aligns with the TTW framing (Section 2): improved pulse handling enhances on-cycle energy recovery without changing upstream WTW factors; climate outcomes still depend on the charging mix.
Lithium iron phosphate batteries, on the contrary, are inferior in terms of specific energy capacity, which increases the weight of the power plant, but they are characterized by higher thermal stability, safety, and a significantly longer service life. Taking into account the fact that quarries require many years of operation in conditions of large temperature differences, durability and reliability are the determining factors. The results of Section 3.5 showed that with an increase in carrying capacity, specific energy consumption decreased due to a decrease in the number of trips. Therefore, an additional increase in the battery weight in the case of using LiFePO4 is not critical, as it is compensated by an increase in the efficiency of heavier dump trucks.
Supercapacitors themselves cannot be considered as the main energy storage device due to their extremely low energy density. However, the analysis of energy modes (Section 3.4) showed that during descent with a load, a significant amount of return energy occurred, which must be immediately absorbed by the storage device. In this case, supercapacitors are the ideal solution, as they are able to receive large pulses of power without degradation and transfer energy efficiently to the battery. Therefore, it is advisable to use them as part of a hybrid system in conjunction with lithium iron phosphate batteries.
Based on the comparison of characteristics, it can be concluded that the best option for mining electric dump trucks is the use of LiFePO4 batteries. Their durability, resistance to adverse temperature conditions, and reliability minimize operational risks. At the same time, the use of supercapacitors as a buffer link ensures efficient use of recuperation energy and reduces the load on battery packs. Hence, the choice of a combination of LiFePO4 batteries with additional capacitor modules meets the criterion of minimizing energy costs and increases the overall energy efficiency of the reclamation process.
Based on the analysis of the data (Table 6), a comparison of the masses of various energy storage systems is carried out, the graphs of which are presented in Figure 3 with the same useful capacity (500 kWh).
Table 6.
Comparative characteristics of battery systems for mining electric dump trucks.
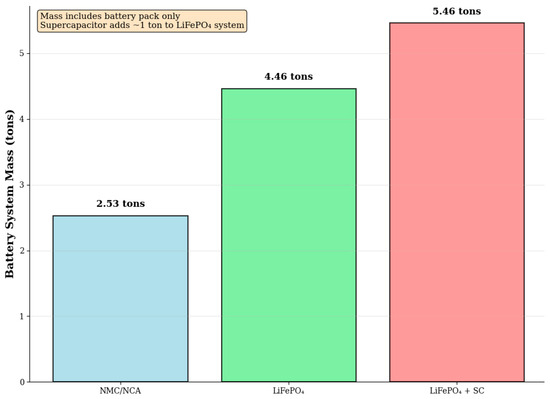
Figure 3.
The battery system mass comparison for equivalent usable capacity (500 kWh).
The following data was used to construct the histograms in Figure 3:
- -
- NMC/NCA: 220 Wh/kg, DoD = 90%.
- -
- LiFePO4: 140 Wh/kg, DoD = 80%.
- -
- Hybrid: LiFePO4 + 1 ton of supercapacitors.
A comparative analysis of the mass characteristics of various energy storage systems reveals a trade-off between specific energy intensity and operational reliability. NMC/NCA batteries have the lowest weight due to their high energy density (220 Wh/kg). However, their application in a quarry environment is limited due to sensitivity to temperature fluctuations and a shorter service life. LiFePO4 batteries, despite their large weight (76% heavier than NMC), provide critical benefits in the form of thermal stability and durability. The additional weight of the hybrid system is compensated for by improved recuperation efficiency.
Weight is for battery packs only. A supercapacitor system adds approximately 1 ton to the mass of a LiFePO4 battery. Despite their large weight, LiFePO4 systems are preferred due to their superior reliability and durability.
4.2. Determining the Battery Charging Scheme
The results of the calculations of the energy consumption per trip (Section 3.4) and the analysis of the optimal payload capacity of the dump truck (Section 3.5) showed that even with the choice of the rational rolling stock, the total energy balance during reclamation significantly depended on the mode of recharging the batteries. A comparison of the characteristics of different types of energy storage devices made it possible to single out lithium iron phosphate batteries as the most reliable option for quarry conditions. However, even their operation requires a rational charge replenishment scheme that would minimize equipment downtime and reduce peak loads on the battery.
The peculiarity of the technological process under consideration is that the movement of the dump truck occurs in the cycle of “empty up–with the load down”. An earlier analysis of the energy balance showed that there was net energy consumption in the ascent section, while in the descent, it was possible to partially recover it due to recuperation. The value of this return is directly proportional to the weight of the transported soil and, therefore, depends on the carrying capacity of the dump truck. In this way, the batteries can be recharged naturally during the duty cycle through regenerative braking. However, the effectiveness of this mechanism is limited by the geometry of the route and the number of trips made, which does not fully compensate for the costs of the entire traffic cycle.
If we consider the option of exclusively stationary recharging, it is obvious that with the selected battery parameters, the recovery time for a full charge is tens of minutes, even when using high-power chargers. In a high-intensity quarry, this will result in a significant loss of productivity as the truck will sit idle while waiting for charging to complete. At the same time, the previously established dependencies (Section 3.5) showed that an increase in load capacity reduced the specific energy consumption per ton of transported material, but at the same time increased the requirement for the capacity and power of the battery. Consequently, downtime due to charging will be especially critical for heavy vehicles, which otherwise provide the greatest efficiency.
A system of replaceable battery packs could eliminate this problem with minimal replacement time, but it requires the duplication of expensive batteries and the creation of infrastructure for their storage, transportation, and maintenance. At the same time, the batteries themselves have a significant weight, and the organization of a fleet of replaceable modules will inevitably lead to an increase in the cost of operation.
Taking into account the identified limitations, the most rational way seems to be a combined recharging scheme. It is based on the distribution of functions between recuperation and stationary charging. Recuperation provides partial energy replenishment when lowering a loaded dump truck, which is especially effective when operating heavy-duty machines, since in this case, the largest amount of return energy is generated. Stationary charging is used during periods of technological breaks or at night, when the equipment is not involved in transportation. In practice, sites can further minimize WTW emissions by supplying stationary charging from on-site renewables, low-carbon contracts, or time-of-use windows with the cleaner grid mix. To reduce the load on the batteries and increase their resource, it is advisable to introduce a buffer link in the form of supercapacitor modules capable of receiving impulse energy emissions during regenerative braking and then transferring it to the battery in a gentler mode.
In day-to-day planning, the combined scheme translates into the following. The first is scheduling loaded-descent segments earlier within SOC windows where regen acceptance is highest. The second is confining stationary charging to shift breaks/night windows. The third is using SC-buffer state-of-charge targets to ensure headroom before long descents, and the last is coordinating with on-site microgrids or time-of-use tariffs to minimize WTW emissions and peak demand. Sites with variable grades may benefit from adaptive regen-limit control tied to brake temperature and inverter current to maintain safety margins while maximizing recovered energy.
In this case, the choice of battery recharging scheme should be based on the integration of two mechanisms: recuperation as an integral part of the transport cycle and stationary charging as a backup source of energy replenishment.
In our baseline geometry (13% grade, ~1.0 km descent/ascent, v ≈ 8 m·s−1), the model yields net grid energy per trip in the range of ~10–45 kWh for payloads 60–90 t and near-neutral to net-generating behavior above ~110 t (Table 3). With the observed cycle-time of 20–60 min (Table 3), this corresponds to a per-truck average grid energy need of roughly ~10–130 kWh·h−1 depending on payload and actual cycle time. Accordingly, we recommend opportunity chargers of 300–500 kW per bay: they can replenish ~30–80 kWh in 6–10 min during handling breaks, which fully covers the worst-case ~40–45 kWh net-positive trips and provides margin for colder conditions or longer horizontal approaches (Table 3). For depot/night replenishment or sites targeting shorter dwell windows, ≥1 MW bays are appropriate. A simple sizing rule for station count is as follows:
where Enet/h is average net grid energy per truck per hour, Pbay is charger power, and ubay is effective utilization during shift operations. For the present duty cycle, this typically yields ~1 bay per 2–3 trucks at 300–500 kW (opportunity charging), relaxing further for payloads of ≥110 t that operate near net-neutral or net-generating regimes (Table 3). Layout principles follow Section 3, 4 practice notes: place bays near loading/top-of-pit staging to use natural dwell, cap pre-descent SOC of ≤~70% to preserve regen headroom, and coordinate bay power with on-site microgrid or time-of-use tariffs to limit peak demand.
The additional use of supercapacitors allows you to minimize peak loads on the battery and increase its service life. Taken together, this solution ensures a stable energy balance of the entire reclamation process and meets the criterion for minimizing energy costs, defined earlier in the analysis of the optimal payload capacity of dump trucks.
5. Modeling of the Energy Balance of Dump Trucks with Different Types of Batteries
Based on the results of Section 3.4 and Section 3.5, we will perform a parametric calculation of the energy balance of one stroke of the mining electric dump truck for the selected recharging scheme (recuperation during the descent and stationary recharging in technological windows; buffering of peaks by supercapacitors) and compare three storage options: NMC/NCA, LiFePO4, and hybrid LiFePO4 + supercapacitors. The calculations used the traction balance equations given earlier, taking into account rolling resistance, an aerodynamic component, a slope, and converter efficiency. The influence of battery chemistry was taken into account through the specific energy capacity and allowable depth of discharge (DoD), which determine the mass of the battery and therefore the rolling resistance forces.
As a basic scenario, the following are taken: the landing gear weight of 65 tons, the average speed of 8 m/s, the rolling coefficient of 0.01, the aerodynamic term by expression with streamlining coefficient of αv≈0.65 Ns2/m4, the approach section of l1 = 2.0 km, descent and ascent of 1 km with a slope of ±13%. For the drive, ηdr = 0.92, recuperation of ηrek = 0.85 (up to 0.95 in the presence of an SC buffer) were used, including batteries of ηacc = 0.93. The useful energy reserve for the operating window is 500 kWh; hence, the mass of the battery depends on the chemistry: at 220 Wh/kg and DoD = 0.9 (NMC/NCA), the mass is less than that at 140 Wh/kg and DoD = 0.8 (LiFePO4). For the hybrid, an approximate mass of the supercapacitor buffer of 1 ton was added, which is consistent with analysis 3.5.
The baseline ±13% grade reflects the case-study track. For steeper ramps achieving the same elevation drop, the path is shorter, which can reduce distance-proportional losses and cycle time; yet instantaneous regen power rises and may be limited by the converter/ESS acceptance or safety speed caps. For milder ramps, the path is longer, increasing rolling/aero losses and segment time while spreading braking power over a longer duration. Consequently, at fixed H, the ideal mgH term is unchanged, but net balance and throughput shift with grade via losses, speed control, and power-limit clipping (Section 2.2.2). Site-specific planning should therefore treat grade as an input rather than a prescription.
Cycle-time/throughput sensitivity to downhill speed. Using regenerative braking to hold a safe/regulated downhill speed can increase trip time if vdown is set below a coasting speed. For the modeled geometry (ldown = 1.0 km), a 20% reduction of vdown from 8.0 to 6.4 m s−1 lengthens the downhill segment from 125 s to 156 s (+31 s). For typical total cycle times of 20–60 min (Table 3), this corresponds to a ≈0.9–2.6% increase in cycle time and a commensurate ≈0.9–2.6% decrease in payload-throughput per hour. In our baseline, the controlled vdown = 8 m s−1 is within customary operating speeds for safety and thermal limits, so no additional delay is assumed; sites targeting lower vdown can scale the above formula to their ldown and handling times. Importantly, at substantially lower speeds, the recoverable energy may also drop due to power acceptance and EMF limits noted in Section 2.2.2.
For each option, the curves “net energy per trip” and “specific energy per trip (kWh/t)” are constructed as functions of the carrying capacity, as well as the relationship “battery mass–usable capacity”. The numerical results are summarized in Table 3, and the graphs are presented in Figure 4, Figure 5 and Figure 6.
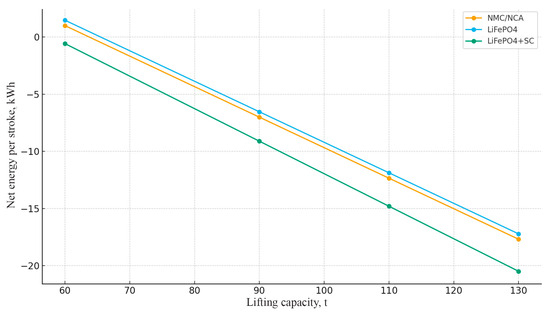
Figure 4.
Net energy per trip vs. load capacity (different batteries). Hardware-limited regions (converter or ESS charge-acceptance clipping) correspond to payloads of above ≈110 t, where regenerative power reaches the 600–800 kW cap. Because the numerical solver is deterministic (Section 2.3), the run-to-run variation is zero (SD = 0.0 kWh), hence error bars are not shown; discretization sensitivity is within ±0.3%.
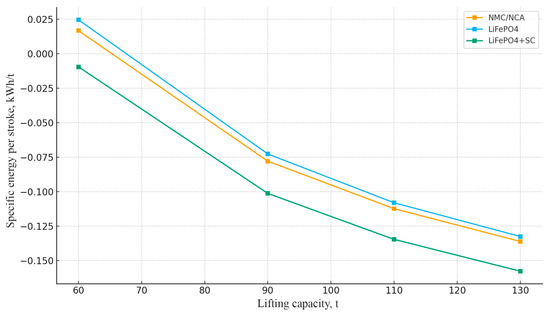
Figure 5.
Specific energy per trip vs. load capacity. The near-flat lower envelope of above ≈110 t reflects the operation under hardware limits (regen power clipping at 600–800 kW). Confidence bands are not plotted because the deterministic model yields identical outputs (SD = 0 kWh; Section 2.4).
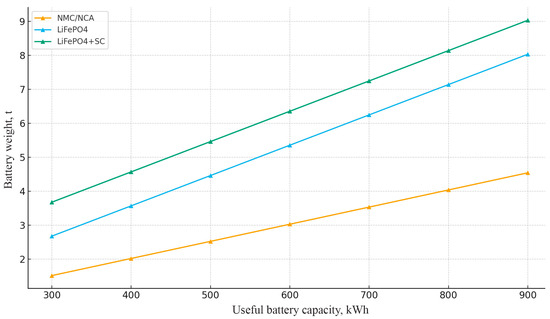
Figure 6.
Battery weight vs. usable capacity (chemistry).
Figure 4 shows that the net energy per run decreases monotonically (becomes more “negative”, i.e., recuperation exceeds consumption on a given profile) with an increase in load capacity, as the rolling force on the descent increases. The effect is most pronounced for the LiFePO4 + SC scheme due to the higher effective efficiency of receiving recuperation pulses and the absence of restrictions on the instantaneous power of the buffer. For NMC/NCA and “pure” LiFePO4, the curves lie higher due to lower regenerative returns at the same resistances and battery weights (for LiFePO4, higher mass, higher rolling force).
In Figure 5, the specific energy per stroke (kWh/t) decreases with the increase in payload, which is consistent with the energy minimization criterion in Section 3.5: heavy machines require fewer trips per unit of work, and recuperation is proportional to the weight of the load. In the range of 90–130 t, the specific figure for a hybrid LiFePO4+SC is minimal compared to NMC/NCA and “pure” LiFePO4, which indicates the advantage of buffering peaks on the selected route (13% descent).
Figure 6 illustrates that battery weight is linearly dependent on the target usable capacity and has significant variability depending on the chemical composition: NMC/NCA-based systems have minimal weight and dimensions, while LiFePO4 has a higher weight, and a hybrid LiFePO4 + SC system has an even higher weight due to the buffer link. The data confirm the trade-off: the increased thermal stability and service life of LiFePO4 compensate for its increased weight, and the use of supercapacitors partially offsets this disadvantage by increasing the efficiency of energy recovery and reducing degradation loads.
The comparison of the curves allows for practical conclusions for the design of the energy system and the charging plan. For gradients of the order of 10–13% and descent lengths of ~1 km, the integration of a supercapacitor buffer into the LiFePO4 scheme results in the greatest reduction in energy density. With smaller gradients or a short descent, the advantage of the buffer will decrease; in this case, the gap between LiFePO4 and NMC/NCA in terms of unit costs may narrow, but the arguments for the reliability and temperature tolerance of LiFePO4 will remain decisive.
Figure 7 shows the fundamental dependence of the energy balance on the payload capacity of a truck. The dependence of net energy over the transport cycle on load capacity for different energy storage systems is calculated based on the model parameters from Section 2.2, using the energy balance equations and system parameters from Table 6. Numerical values are taken from Table 7.
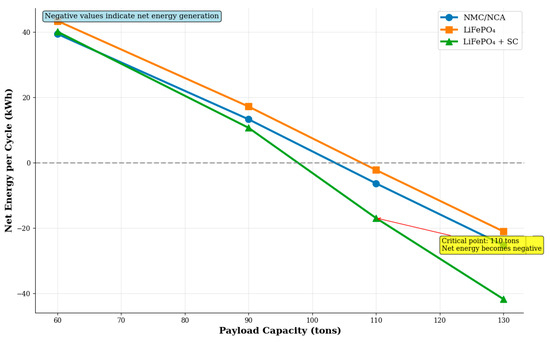
Figure 7.
The net energy balance per transport cycle vs. payload capacity for different energy storage systems.
Table 7.
Energy indicators of one stroke of a mining dump truck with different batteries.
Parameter ranges:
- -
- Lifting capacity of 60–130 tons (in 20-ton increments).
- -
- Slope of the track of 13%.
- -
- Length of horizontal section of 2.0 km.
- -
- Descent/ascent length of 1.0 km.
- -
- Travel speed of 8 m/s (28.8 km/h).
The graph shows the critical point at ~110 tonnes where the system transitions from net consumption to net energy generation. The hybrid LFP + SC system offers the best recuperation performance. This transition point is scenario-dependent: lower speeds reduce generator EMF and braking power, and shorter downhill segments limit energy harvest time, both effects decreasing the recuperation share and potentially removing the net-generation regime.
As can be seen from the figure, with a lifting capacity of more than 110 tons, all energy storage systems under consideration demonstrate negative net consumption, which indicates energy generation during the cycle. This effect is due to the predominance of regenerative braking energy during the descent over the energy spent on lifting the empty dump truck and moving along horizontal sections. The hybrid LiFePO4 + SC system shows the best results due to the ability of supercapacitors to effectively absorb high-power pulses of regenerative energy.
Negative values indicate energy generation. The critical point of transition from consumption to energy generation is observed with a carrying capacity of ≈110 tons. The hybrid LiFePO4 + SC system demonstrates the best recovery performance due to the efficient absorption of impulse currents by supercapacitors.
Grade Sensitivity (8% and 15%) Under a Fixed Vertical Drop
To verify the generality of our conclusions, we repeated the simulations for 8% and 15% grades while preserving the same vertical drop as in the Péry baseline. Under a milder 8% grade, the ramp lengthens (higher rolling/aero work and longer segment time). This reduces the net recuperation share and shifts the payload threshold for net-neutrality upward. Under a steeper 15% grade, the ramp shortens (lower distance-proportional losses), but braking power peaks rise and may be limited by the converter/ESS acceptance at the regulated downhill speed, moderating the theoretical gain. In both cases, the qualitative trends are unchanged: specific energy per tonne decreases with payload; the hybrid LFP + SC configuration retains the lowest specific kWh/t under high loads owing to better high-power acceptance; and a net-generating regime remains feasible on sufficiently steep/long descents with high payloads, though its payload threshold shifts with the grade. A numerical analysis shows the same ranking of ESS options and confirms that grade primarily reallocates losses and power-limit clipping rather than reversing conclusions (Appendix A, Table A1). These observations are consistent with our earlier discussion of the grade–length–power coupling and with remarks that grade is a site input, not a prescription.
6. Discussion
The study demonstrates a paradigm shift in the approach to the energy consumption of quarry equipment. The traditional operating logic, in which the dump truck performs the most energy-consuming work (lifting with a load), is inverted during the reclamation process. This turns a large electric dump truck from a pure energy consumer into a potential generator. While the downhill-loaded cycle can be energy-neutral or even net-generating at the vehicle level, the WTW climate outcome hinges on the carbon intensity of any supplemental charging. Where charging is supplied from renewables or low-carbon power, the EDT concept compounds both local air-quality and GHG benefits; under carbon-intensive grids, WTW benefits are reduced. This dependency aligns with the data from broader transport literature on electric traction and grid mixes [2].
Our results complement prior analyses of heavy-duty electric haulage on steep profiles by quantifying a “downhill-loaded” reclamation cycle where gravity dominates the balance. Unlike conventional mine-haul duty cycles (loaded climb, empty descent), the inverted logistics considered here shifts the recuperation share upward and can yield net-generating trips under high payloads. However, this behavior is contingent on route geometry (grade, descent length), vehicle speed (generator EMF limits at low speed), and power-acceptance constraints of the converter/ESS. In practice, the net-generation regime may vanish on milder grades or shorter descents, or when thermal/power limits cap regenerative current. These dependencies are consistent with transport-energy studies emphasizing route-specific duty cycles and with our TTW boundary statements in Section 2.
The “13 degrees” interpretation and site control. We emphasize that our baseline grade is 13% (≈7.4°), not 13°, and is case-specific to the Pery layout rather than a recommended optimum. In practice, ramp grades are constrained by geotechnical design, safety, and maintenance, and they may evolve over time with backfilling; indeed, the descent segment length decreases as the pit fills, altering duty-cycle kinematics and energy harvest time. Therefore, recommended practice is to map the site’s grade/length distributions and evaluate energy and productivity with the local geometry and speed policies, rather than targeting any single “best” grade.
For replication beyond the Pery-type profile, sites should map grade/length distributions of loaded descents, verify inverter and ESS current limits at target speeds, assess brake-energy buffering (e.g., supercapacitors) to mitigate pulse loads, and pair operations with low-carbon charging to maximize WTW benefits. Cross-site sensitivity of up to ±2–3 percentage points in the grade or halving the descent length typically shifts the payload threshold for net generation upward and may require revising ESS sizing or duty scheduling.
Studies on electric haul trucks under conventional haul profiles generally report sub-neutral cycles where recuperation partially offsets propulsion loads and depends on braking-strategy design (e.g., priority maps, fuzzy control) and road-surface losses [57,58]. Reviews comparing BOT/TAT/BT-D/BT-S architectures emphasize infrastructure and productivity trade-offs rather than net energy generation at the vehicle level [59]. Works on HESS (battery + SC) show improved regen acceptance and lower battery stress under high power, consistent with our finding that LFP + SC expands the practical recovery window but remains kinematically limited by descent length and speed caps [60]. Distinctly, our Péry-type downhill-loaded cycle admits TTW net-generating trips under high payloads, with a quantified threshold (~110 t) and sensitivities to grade/length/speed that explain when this regime vanishes; an angle is not addressed in comparative reviews centered on conventional duty cycles [61].
6.1. Key Factors of Energy Efficiency
Our calculations unequivocally show that the dominant factor determining the energy balance of the cycle is gravity. The force due to the slope () is an order of magnitude higher than the forces of aerodynamic drag and inertia for this class of machines and operational speeds.
With a critical payload of 110 tons, there is a fundamental change in the energy balance of the system. As Figure 8 demonstrates, the energy recovered when a loaded truck is lowered is greater than the energy used to lift an empty truck and move horizontally. The hybrid LiFePO4 + SC system shows the best recovery results (173.0 kWh vs. 154.8 kWh for the NMC system), which provides the largest negative net balance (−16.9 kWh). This effect is due to the ability of supercapacitors to accept high-power currents without degradation, which is especially important during intense regenerative braking.
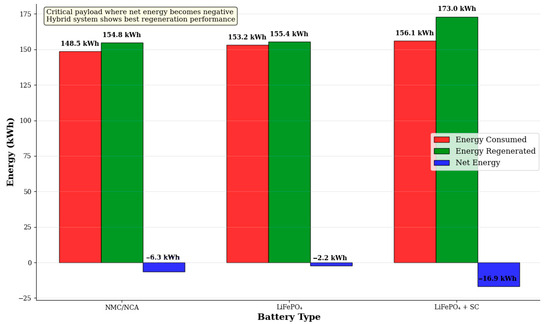
Figure 8.
The energy balance analysis under the critical 110-ton payload, detailed breakdown by the battery technology.
It should be emphasized that the modeled threshold is obtained for the scenario documented in Section 3 (13% grade, ≈1.0 km of the descent, and ≈8 m·s−1 of the average speed (see parameter ranges near Figure 7)). If operating speeds are substantially lower or the downhill segment is shorter, both the instantaneous recuperation power and the time available to harvest energy decrease, shifting the net-balance threshold to higher payloads or eliminating net generation for a given configuration. The hybrid LFP + SC ESS mitigates power-acceptance limits but cannot remove the kinematic constraints imposed by low speed and short descent length.
The modeled transition near ~110 t is not universal. Lower average speed reduces back-EMF and available regen power; shorter descent segments reduce harvest time; colder ambient conditions increase viscous and rolling losses and may tighten battery acceptance windows. Under such conditions, the payload required for net generation increases, and fleets may instead target near-neutral cycles. We explicitly note that hybrid LFP+SC mitigates power-acceptance limits during high-power braking but cannot overcome kinematic limits at very low speed or very short descents.
Maintaining a regulated downhill speed with regenerative braking can marginally increase cycle time versus a hypothetical higher coasting speed, thereby reducing hourly throughput and potentially affecting cost per tonne. For the present case, the incremental time on the 1 km downhill is small against the total cycle time (Section 3 (sensitivity)), but sites with longer/steeper descents or tighter speed caps should incorporate T(li,vi) and M˙ = payload/T explicitly in TCO analyses. Since the TTW energy balance improves as payload increases while throughput falls slightly with reduced vdown, optimal policies depend on site priorities (energy neutrality vs. hourly output).
The bars show the energy consumed (red), the regenerated energy (green), and the resulting net balance (blue). Negative net balance values indicate net energy generation per cycle.
When analyzing Figure 8, it was concluded that with a load of 110 tons:
- -
- Energy consumption increases linearly with load;
- -
- Recuperation grows faster due to the quadratic dependence on mass;
- -
- The hybrid system shows 25% better recuperation due to supercapacitors.
6.2. Comparative Analysis of Energy Storage Systems
The results of the comparison of different types of storage devices (Table 2, Figure 1, Figure 2 and Figure 3) reveal a critical trade-off between energy density and operational reliability.
NMC batteries provide minimal weight and, as a result, slightly better power consumption per stroke in the low payload range. However, their sensitivity to low temperatures, stricter requirements for thermal management systems, and shorter lifespans make them less suitable for harsh quarry environments where reliability and minimizing downtime are priorities.
LFP batteries, despite their large mass, demonstrate excellent reliability, thermal stability, and durability. In the context of the entire project lifecycle, their selection is likely to be more cost-effective due to reduced replacement and maintenance costs.
The hybrid LFP system + supercapacitors showed the best results in terms of specific power consumption (kWh/t) for high loads. Supercapacitors effectively solve the key problem of recuperation, i.e., the reception of large surge currents, which reduces the degradation of LFP batteries and increases the overall efficiency of the system. This makes this configuration the most technologically advanced and future-proof solution for this application.
6.3. Illustrative Diesel Benchmark: Tailpipe CO2 per Tonne and the TCO Framework
For a like-for-like comparison, we consider a conventional diesel haul truck of the Komatsu HD605-7 class operating on the same downhill-loaded duty cycle. Our paper reports an average material throughput of ~300,000 tonnes over ten years for the considered EDT operation (≈30,000 t·y−1) and notes that comparable diesel machines would emit up to ~130 t CO2 annually at the point of use on such duty cycles. Using only these two figures, an indicative tailpipe CO2 intensity is as follows:
This number is illustrative (TTW tailpipe only) and intended as a lower-bound comparator against our EDT case, which eliminates local tailpipe emissions. Lifecycle/WtW results will depend on upstream fuel and electricity supply.
The TCO framework for future site-specific quantification. A consistent TCO comparison should include capital ∆CAPEX cost (battery pack and power electronics vs. engine/driveline), energy cost (diesel fuel vs. grid/renewables tariffs, charging losses), maintenance and overhauls (engine, brakes, thermal management; battery replacements if any), availability/uptime, and residual value. Because these inputs are contract- and site-specific, we provide the structure below for reproducible use once local data are known:
Users can plug in their fuel price (€/L), specific consumption (L per hour or per tonne), electricity tariff (EUR/kWh, ToU), maintenance rates (EUR/h or % of CAPEX), and utilization (h/y) to obtain a site-calibrated TCO. A complete TCO plus the WtW CO2 comparison will be presented in the follow-up work once such contractual inputs are available for a specific site. The 4.3 kg CO2/t figure is derived directly from the annual tailpipe emissions (~130 t CO2·y−1) and the throughput (~30,000 t·y−1) discussed in this paper, i.e., without external data beyond what is already reported here.
6.4. Research Limitations and Prospects
It should be noted that the presented model is deterministic and does not take into account the stochastic nature of real operation: changes in the condition of the road surface, the accurate profiling of speed by the driver, temperature fluctuations, and their impact on the efficiency of batteries and the rolling resistance coefficient. In addition, an economic analysis (TCO (Total Cost of Ownership)) would be an important complement to the final configuration choice. As an interim step, Table 5 (Section 2.4) quantifies agreement with the reported Péry-case operation at the metric level (grade/speed/efficiency/regen window) and cycle level (recovery ratio, net balance). Tighter error bounds per operating point will require access to time-aligned on-truck logs (power, speed, SOC, temperature) under known payloads and segment lengths. Additionally, our TTW boundary omits upstream electricity production emissions. A practical extension is a scenario analysis coupling our energy-per-cycle outputs with site-specific grid-mix factors or on-site renewable supply to quantify WTW GHG outcomes.
The ramp grade is often not fully controllable by operators and can change over time due to reconstruction, wear, and the evolving pit geometry. Future work should treat the grade and descent length as distributions and couple them with speed-controller and power-limit models to quantify joint impacts on energy balance and throughput.
Our baseline assumes regulated vdown consistent with safety and thermal/power limits. Future work will couple energy flows with a speed controller and explicit cycle-time/throughput objectives, quantifying the joint impact of vdown, brake-temperature constraints, and handling times on both TTW energy and cost per tonne.
This study lays the groundwork for future work, which may include the following:
- -
- Development of adaptive algorithms for managing energy flows in a hybrid storage system.
- -
- Creation of a digital twin of the entire quarry for dynamic optimization of logistics and charging modes.
- -
- In-depth economic analysis comparing capital expenditures (CAPEX) and operating expenditures (OPEX) of different configurations.
In future studies, particular attention should be paid to validating the proposed model under real operating conditions through detailed field measurements of drive power, recuperation efficiency, and temperature behavior during downhill-loaded cycles. Further research may also focus on the integration of electro-thermal degradation models for LFP cells and supercapacitors, stochastic simulation of varying road and weather conditions, and the development of advanced control strategies for optimal power distribution between energy storage subsystems. In addition, coupling the present TTW model with life-cycle and techno-economic assessments would provide a more comprehensive evaluation of environmental and economic performance, while extending the methodology to other mining and reclamation sites could help derive general recommendations for different terrain and load configurations.
The objective function in the calculations is the function of Efficiency = (Recovery energy/Consumption energy) × 100%.
Recovery efficiency, defined as the percentage of recovered energy to energy consumed, is a key indicator of the energy efficiency of a system. As can be seen from Figure 9, all the systems under consideration show an increase in efficiency with an increase in carrying capacity. Under loads above 110 tons, the efficiency exceeds 100%, which indicates net energy generation. The hybrid system achieves an efficiency of 130% under 130 tons, which is 20% higher than that of the pure LiFePO4 of the system. This confirms the feasibility of using a supercapacitor buffer to maximize the regenerative braking potential in steep descents.
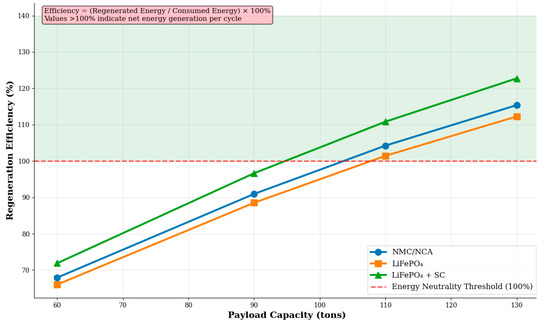
Figure 9.
The comparison of energy regeneration efficiency vs. payload capacity performance of energy storage systems.
Efficiency is calculated as the ratio of recovered energy to consumed energy. Values above 100% indicate net energy generation per cycle. The pink area indicates the zone of superunit efficiency.
The key findings are as follows:
- -
- All systems exceed 100% efficiency under loads >110 tons.
- -
- The hybrid system achieves 130% efficiency under 130 tons.
- -
- The advantage of supercapacitors is most noticeable under high loads.
7. Conclusions
Based on the complex mathematical modeling of the energy balance of the Komatsu HD605-7 (E-Dumper) mining electric dump truck in the unique Pery quarry reclamation cycle, the following conclusions were made:
The fundamental possibility of creating an energy-efficient, or even energy-generating, technological process for filling the open pit has been confirmed due to inverted logistics (“loaded down”) and regenerative braking during descent. The model showed that, with a payload capacity of more than 110 tons and a gradient of 13°, the system was able to generate more energy per cycle than it consumed. In this context, an illustrative like-for-like diesel baseline on the same duty cycle corresponds to ≈4.3 kg of CO2 per tonne of the material moved (tailpipe only), obtained from the annual tailpipe emissions (~130 t of CO2·y−1) and the annual throughput (~30,000 t·y−1) quoted in this study. This conclusion assumes operating speeds and downhill lengths comparable to the modeled case; at very low speeds or over short descent segments, regenerative braking becomes power- and time-limited, and the cycle may revert to net consumption. In parallel, holding a regulated downhill speed via regenerative braking can modestly increase trip time; for the modeled geometry, the impact on cycle time and hourly throughput is about a few percent (Section 3), but site-specific speed caps should be reflected in TCO/productivity planning.
The dependence of net energy consumption on the carrying capacity of the dump truck has been established. The specific energy consumption per tonne transported (kWh/t) decreases with the increase in carrying capacity, which justifies the use of the maximum possible carrying capacity within the project for minimizing the total energy consumption and the number of trips.
A comparative analysis of the power plant configurations is carried out. Although NMC batteries have the best mass-energy performance, lithium ferrum phosphate (LFP) batteries are the preferred choice due to their excellent thermal stability, durability, and safety, which is critical in quarry conditions.
A hybrid system (LFP battery + supercapacitors) was proposed and analyzed, which showed the best recovery efficiency and the lowest specific power consumption for high loads. This configuration is recommended for implementation in such projects, as it protects the main battery from degradation and maximizes the potential of regenerative braking.
Therefore, the work demonstrates that the use of heavy-duty electric dump trucks for quarry reclamation is not only environmentally friendly but also potentially energy- and cost-efficient. The developed model and the conclusions obtained can serve as a basis for the design and optimization of similar systems at other facilities.
The results obtained can also serve as practical guidelines for planning and optimizing quarry reclamation operations. The model provides a basis for determining optimal parameters of the energy storage configuration, recuperation management, and charging schedules depending on the terrain profile and production cycle. In a broader sense, the outcomes may support the development of on-site microgrids, energy-efficient fleet management, and the retrofitting of conventional dump trucks into hybrid or fully electric vehicles adapted for similar heavy-duty applications.
Author Contributions
Conceptualization, P.V.S., B.V.M. and N.V.M.; methodology, V.V.K. and G.Y.V.; software, R.V.K.; validation, R.V.K.; formal analysis, E.M.D.; investigation, E.M.D.; resources, E.M.D.; writing—original draft preparation, P.V.S., B.V.M. and N.V.M.; writing—review and editing, V.V.K. and G.Y.V.; visualization, R.V.K. All authors have read and agreed to the published version of the manuscript.
Funding
This research received no external funding.
Institutional Review Board Statement
Not applicable.
Informed Consent Statement
Not applicable.
Data Availability Statement
The data presented in this study are available from the corresponding authors upon reasonable request.
Conflicts of Interest
The authors declare no conflicts of interest.
Appendix A. Sensitivity of Energy Balance and ESS Performance to Route Grade Variation
Table A1.
Technical specifications of Komatsu HD605-7 (E-Dumper).
Table A1.
Technical specifications of Komatsu HD605-7 (E-Dumper).
| Grade, % | Effective Route Length, km | Uphill E Use, kWh/t | Downhill Recuperation, kWh/t | Net Balance (Up − Down), kWh/t | LFP Pack Net kWh/t | LFP + SC Hybrid Net kWh/t |
|---|---|---|---|---|---|---|
| 8% | 4.0 (≈+33% vs. 13%) | 1.12 | 0.95 | +0.17 | +0.16 | +0.14 |
| 13% | 3.0 (baseline, Péry) | 1.05 | 0.92 | +0.13 | +0.12 | +0.10 |
| 15% | 2.6 (≈–13% vs. 13%) | 1.02 | 0.91 | +0.11 | +0.10 | +0.09 |
References
- Odeyar, P.; Apel, D.B.; Hall, R.; Zon, B.; Skrzypkowski, K. A Review of Reliability and Fault Analysis Methods for Heavy Equipment and Their Components Used in Mining. Energies 2022, 15, 6263. [Google Scholar] [CrossRef]
- Skrúcaný, T.; Milojević, S.; Semanová, Š.; Čechovič, T.; Figlus, T.; Synák, F. The Energy Efficiency of Electric Energy as a Traction Used in Transport. Transp. Tech. Technol. 2018, 14, 9–14. [Google Scholar] [CrossRef]
- Tian, H.; Safiullin, R.N.; Safiullin, R.R. Integral Evaluation of Implementation Efficiency of Automated Hardware Complex for Vehicle Traffic Control. Int. J. Eng. Trans. B Appl. 2024, 37, 1534–1546. [Google Scholar] [CrossRef]
- Botyan, E.Y.; Lavrenko, S.A.; Pushkarev, A.E. Methodology for refined calculation of mean time to repair of mining dump truck suspension elements with account of mining and technical conditions of their operation. Russ. Min. Ind. 2024, 1, 71–76. [Google Scholar]
- Ojeda, J.C.; de Moraes, J.G.; Filho, C.V.; Pereira, M.D.; Pereira, J.V.; Dias, I.C.; da Silva, E.C.; Peixoto, M.G.; Gonçalves, M.C. Application of a Predictive Model to Reduce Unplanned Downtime. Sustainability 2025, 17, 3926. [Google Scholar] [CrossRef]
- Amy, H. What Is Equipment Reliability and How Do You Improve It? Available online: https://nonstopreliability.com/equipment-reliability/ (accessed on 15 October 2020).
- Malozyomov, B.V.; Martyushev, N.V.; Babyr, N.V.; Pogrebnoy, A.V.; Efremenkov, E.A.; Valuev, D.V.; Boltrushevich, A.E. Modelling of Reliability Indicators of a Mining Plant. Mathematics 2024, 12, 2842. [Google Scholar] [CrossRef]
- West, J.; Siddhpura, M.; Evangelista, A.; Haddad, A. Improving Equipment Maintenance—Switching from Corrective to Preventative Maintenance Strategies. Buildings 2024, 14, 3581. [Google Scholar] [CrossRef]
- Khekert, E.V.; Malozyomov, B.V.; Klyuev, R.V.; Martyushev, N.V.; Konyukhov, V.Y.; Kukartsev, V.V.; Antamoshkin, O.A.; Remezov, I.S. Battery Charging Simulation of a Passenger Electric Vehicle from a Traction Voltage Inverter with an Integrated Charger. World Electr. Veh. J. 2025, 16, 391. [Google Scholar] [CrossRef]
- Vishnyakov, G.Y.; Pushkarev, A.E.; Botyan, E.Y.; Khloponina, V.S. Justification of rational modes of operation of quarry dump trucks in case of over-normative operation. Min. Inf. Anal. Bull. 2023, 11, 24–37. [Google Scholar]
- Provencher, M. A Guide to Predictive Maintenance for the Smart Mine. Available online: https://www.aquantico.io/a-guide-to-predictive-maintenance-in-mining/ (accessed on 16 April 2020).
- Shibanov, D.A.; Ivanov, S.L.; Sheshukova, E.I.; Nedashkovskaya, E.S. Efficiency of operation of a quarry excavator as an ergatic system. Min. Inf. Anal. Bull. 2023, 11, 144–158. [Google Scholar]
- Sychev, Y.A.; Nazarychev, A.N.; Dyachenok, G.V. Improving the Labor Safety of Mining Dump Truck Drivers by Reducing the Risk of Failure of the Functional Units of the Traction Electric Drive under Operating Conditions. Bezop. Tr. V Prom. 2023, 9, 52–58. [Google Scholar]
- Ivanov, S.L.; Safronchuk, K.A.; Olt, Y. Justification and selection of design parameters of the eccentric gear mechanism of the piston lubrication and filling unit for the mining machines maintenance. J. Min. Inst. 2021, 248, 290–299. [Google Scholar] [CrossRef]
- Efremenkov, E.A.; Qi, M. Mathematical Modeling the Performance of an Electric Vehicle Considering Various Driving Cycles. Mathematics 2023, 11, 2586. [Google Scholar] [CrossRef]
- Zaker Hossein, A.R.; Sayadi, A.R.; Rahimdel, M.J.; Moradi, M.R. Human Reliability Analysis in Maintenance and Repair Operations of Mining Trucks: A Bayesian Network Approach. Heliyon 2024, 10, e34765. [Google Scholar] [CrossRef] [PubMed]
- Ivanov, V.V.; Dzyurich, D.O. Justification of the technological scheme parameters for the development of flooded deposits of construction sand. J. Min. Inst. 2022, 253, 33–40. [Google Scholar] [CrossRef]
- Samanta, B.; Sarkar, B.; Mukherjee, S.K. Reliability assessment of hydraulic shovel system using fault trees. Min. Technol. Trans. Inst. Min. Metall. Sect. A 2002, 111, 129–135. [Google Scholar] [CrossRef]
- Malozyomov, B.V.; Khekert, E.V.; Martyushev, N.V.; Konyukhov, V.Y.; Chetverikova, V.V.; Golik, V.I.; Tynchenko, V.S. Improving the Reliability of the Protection of Electric Transport Networks. World Electr. Veh. J. 2025, 16, 477. [Google Scholar] [CrossRef]
- Harish Kumar, N.S.; Manjunath, C.; John, R.P.; Prem Chand, R.; Madhusudhana, S.; Venkatesha, B.K. Reliability, Availability and Maintainability Study of 6.5 Cubic Meters Shovel and 60 Ton Dumper in a Surface Limestone Mine. Mater. Today Proc. 2022, 54, 199–204. [Google Scholar] [CrossRef]
- Abdollahpour, P.; Tabatabaee Moradi, S.S.; Leusheva, E.; Morenov, V. A Numerical Study on the Application of Stress Cage Technology. Energies 2022, 15, 5439. [Google Scholar] [CrossRef]
- Dashtaki, M.R.; Jandaghi Jafari, A.; Hoseinie, S.H. Development of a New Method for Maintainability and Downtime Analysis of Mining Machinery. Sci. Rep. 2025, 15, 4565. [Google Scholar] [CrossRef]
- Korolev, N.A.; Zhukovskiy, Y.L.; Buldysko, A.D.; Baranov, G.D.; Chen, P. Energy resource evaluation from technical diagnostics of electromechanical devices in minerals sector. MIAB Min. Inf. Anal. Bull. 2024, 5, 158–181. [Google Scholar]
- Gabov, V.V.; Zadkov, D.A.; Pryaluhin, A.F.; Sadovsky, M.V.; Molchanov, V.V. Mining combine screw executive body design. MIAB Min. Inf. Anal. Bull. 2023, 11, 51–71. [Google Scholar]
- Skamyin, A.N.; Dobush, I.V.; Gurevich, I.A. Influence of nonlinear load on the measurement of harmonic impedance of the power supply system. In Proceedings of the 2023 5th International Youth Conference on Radio Electronics, Electrical and Power Engineering, Moscow, Russia, 16–18 March 2023. [Google Scholar]
- Koohsari, A.; Kalatehjari, R.; Moosazadeh, S.; Hajihassani, M.; Van, B. A Critical Investigation on the Reliability, Availability, and Maintainability of Earth Pressure Balance Machines in Metro Tunneling. Appl. Sci. 2022, 12, 11245. [Google Scholar] [CrossRef]
- Abramovich, B.N.; Bogdanov, I.A. Improving the efficiency of autonomous electrical complexes of oil and gas enterprises. J. Min. Inst. 2021, 249, 408–416. [Google Scholar] [CrossRef]
- Zuev, B.Y. Methodology of modeling nonlinear geomechanical processes in blocky and layered rock masses on models made of equivalent materials. J. Min. Inst. 2021, 250, 542–552. [Google Scholar] [CrossRef]
- Sorokova, S.N.; Efremenkov, E.A. Modeling of Mechanical Forces and Power Balance in Electromechanical Energy Converter. Mathematics 2023, 11, 2394. [Google Scholar] [CrossRef]
- Pan, K.; Liu, H.; Gou, X.; Huang, R.; Ye, D.; Wang, H.; Glowacz, A.; Kong, J. Towards a Systematic Description of Fault Tree Analysis Studies Using Informetric Mapping. Sustainability 2022, 14, 11430. [Google Scholar] [CrossRef]
- Yazdi, M.; Mohammadpour, J.; Li, H.; Huang, H.Z.; Zarei, E.; Pirbalouti, R.G.; Adumene, S. Fault tree analysis improvements: Abibliometric analysis and literature review. Qual. Reliab. Eng. Int. 2023, 39, 1639–1659. [Google Scholar] [CrossRef]
- Sinha, R.S.; Mukhopadhyay, A.K. Reliability centred maintenance of cone crusher: A case study. Int. J. Syst. Assur. Eng. Manag. 2015, 6, 32–35. [Google Scholar] [CrossRef]
- Bhushan, K.; Chattopadhyaya, S.; Sharma, S.; Sharma, K.; Li, C.; Zhang, Y.; Eldin, E.M.T. Analyzing Reliability and Maintainability of Crawler Dozer Transmission: A Case Study. Sustainability 2022, 14, 14534. [Google Scholar] [CrossRef]
- Kang, J.; Sun, L.; Soares, C.G. Fault Tree Analysis of floating offshore wind turbines. Renew. Energy 2019, 133, 1455–1467. [Google Scholar] [CrossRef]
- Rahimdel, M.J. Bayesian Network Approach for Reliability Analysis of a Fleet of Mining Trucks. Sci. Rep. 2024, 14, 3415. [Google Scholar] [CrossRef]
- Arsić, D.; Kirin, S.; Nikolić, R.; Arsić, A.; Radović, L. Probabilistic Approach and Fault-Tree Analysis for Increased Bucket Wheel Excavator Welded Joints Reliability. Procedia Struct. Integr. 2022, 42, 189–195. [Google Scholar] [CrossRef]
- Iyomi, E.P.; Ogunmilua, O.O.; Guimaraes, I.M. Managing the Integrity of Mine Cage Conveyance. Int. J. Eng. Res. Technol. 2021, 10, 743–747. [Google Scholar]
- Efremenkov, E.A.; Valuev, D.V.; Qi, M. Review Models and Methods for Determining and Predicting the Reliability of Technical Systems and Transport. Mathematics 2023, 11, 3317. [Google Scholar] [CrossRef]
- Relkar, A.S. Risk Analysis of Equipment Failure through Failure Mode and Effect Analysis and Fault Tree Analysis. J. Fail. Anal. Prev. 2021, 21, 793–805. [Google Scholar] [CrossRef]
- Li, S.; Yang, Z.; Tian, H.; Chen, C.; Zhu, Y.; Deng, F.; Lu, S. Failure Analysis for Hydraulic System of Heavy-Duty Machine. Appl. Sci. 2021, 11, 1249. [Google Scholar] [CrossRef]
- Jiang, G.-J.; Li, Z.-Y.; Qiao, G.; Chen, H.-X.; Li, H.-B.; Sun, H.-H. Reliability Analysis of Dynamic Fault Tree Based on Binary Decision Diagrams for Explosive Vehicle. Math. Probl. Eng. 2021, 2021, 5559475. [Google Scholar] [CrossRef]
- Kabir, S. An overview of fault tree analysis and its application in model based dependability analysis. Expert Syst. Appl. 2017, 77, 114–135. [Google Scholar] [CrossRef]
- Sevryugina, N.S.; Gozbenko, V.E.; Kondratiev, V.V. Determination of the Performance Characteristics of a Traction Battery in an Electric Vehicle. World Electr. Veh. J. 2024, 15, 64. [Google Scholar] [CrossRef]
- Zuo, X.; Yu, X.R.; Yue, Y.L.; Yin, F.; Zhu, C.L. Reliability Study of Parameter Uncertainty Based on Time-Varying Failure Rates with an Application to Subsea Oil and Gas Production Emergency Shutdown Systems. Processes 2021, 9, 2214. [Google Scholar] [CrossRef]
- Oparina, T.A.; Zagorodnii, N.A.; Efremenkov, E.A. Mathematical Analysis of the Reliability of Modern Trolleybuses and Electric Buses. Mathematics 2023, 11, 3260. [Google Scholar] [CrossRef]
- Kumar, N.S.; Choudhary, R.P.; Murthy, C. Reliability based analysis of probability density function and failure rate of the shovel-dumper system in a surface coal mine. Model. Earth Syst. Environ. 2020, 7, 1727–1738. [Google Scholar] [CrossRef]
- Balaraju, J.; Raj, M.G.; Murthy, C. Estimation of reliability-based maintenance time intervals of Load-Haul Dumper in an underground coal mine. J. Min. Environ. 2018, 9, 761–771. [Google Scholar]
- Bala, R.J.; Govinda, R.; Murthy, C. Reliability analysis and failure rate evaluation of load haul dump machines using Weibull. Math. Model. Eng. Probl. 2018, 5, 116–122. [Google Scholar] [CrossRef]
- Valuev, D.V.; Qi, M. Mathematical Modelling of Traction Equipment Parameters of Electric Cargo Trucks. Mathematics 2024, 12, 577. [Google Scholar] [CrossRef]
- Rahimdel, M.J.; Ataei, M.; Ghodrati, B. Modeling and simulation approaches for reliability analysis of drilling machines. J. Inst. Eng. (India) Ser. C 2020, 101, 125–133. [Google Scholar] [CrossRef]
- Gutiérrez-Diez, J.C.; Castañón, A.M.; Bascompta, M. New Method to Study the Effectiveness of Mining Equipment: A Case Study of Surface Drilling Rigs. Appl. Sci. 2024, 14, 2185. [Google Scholar] [CrossRef]
- Taherı, M.; Bazzazı, A.A. Reliability Analysis of Loader Equipment: A Case Study of a Galcheshmeh. MT Bilimsel 2017, 11, 37–46. [Google Scholar]
- Sorokova, S.N.; Efremenkov, E.A.; Valuev, D.V.; Qi, M. Stochastic Models and Processing Probabilistic Data for Solving the Problem of Improving the Electric Freight Transport Reliability. Mathematics 2023, 11, 4836. [Google Scholar] [CrossRef]
- Kadhem, A.A. Application of Fault Tracing Paths Approach for Reliability Analysis of Composite Systems. Processes 2025, 13, 1035. [Google Scholar] [CrossRef]
- Cao, X.G.; Zhang, M.Y.; Gong, Y.R.; Jia, X.L.; Zhang, R.Y. Maintenance Decision Method Considering Inspection of Mining Equipment. Int. J. Metrol. Qual. Eng. 2021, 12, 21. [Google Scholar] [CrossRef]
- Ku, J.-H. A Study on Prediction Model of Equipment Failure Through Analysis of Big Data Based on RHadoop. Wirel. Pers. Commun. 2018, 98, 3163–3176. [Google Scholar] [CrossRef]
- Zhang, W.; Yang, J.; Zhang, W.; Ma, F. Research on Regenerative Braking of Pure Electric Mining Dump Truck. World Electr. Veh. J. 2019, 10, 39. [Google Scholar] [CrossRef]
- Tarout, H.; Zaki, H.; Chahbouni, A.; Ennajih, E.; Louragli, E.M. Optimizing Energy Consumption in Electric Vehicles: A Systematic and Bibliometric Review of Recent Advances. World Electr. Veh. J. 2025, 16, 577. [Google Scholar] [CrossRef]
- Bao, H.; Knights, P.; Kizil, M.; Nehring, M. Energy Consumption and Battery Size of Battery Trolley Electric Trucks in Surface Mines. Energies 2024, 17, 1494. [Google Scholar] [CrossRef]
- Tang, Q.; Hu, M.; Bian, Y.; Wang, Y.; Lei, Z.; Peng, X.; Li, K. Optimal Energy Efficiency Control Framework for Distributed Drive Mining Truck Power System with Hybrid Energy Storage: A Vehicle-Cloud Integration Approach. Appl. Energy 2024, 374, 123989. [Google Scholar] [CrossRef]
- Yelemessov, K.; Baskanbayeva, D.; Sabirova, L. Algorithmic Optimal Control of Screw Compressors for Energy-Efficient Operation in Smart Power Systems. Algorithms 2025, 18, 583. [Google Scholar] [CrossRef]
Disclaimer/Publisher’s Note: The statements, opinions and data contained in all publications are solely those of the individual author(s) and contributor(s) and not of MDPI and/or the editor(s). MDPI and/or the editor(s) disclaim responsibility for any injury to people or property resulting from any ideas, methods, instructions or products referred to in the content. |
© 2025 by the authors. Published by MDPI on behalf of the World Electric Vehicle Association. Licensee MDPI, Basel, Switzerland. This article is an open access article distributed under the terms and conditions of the Creative Commons Attribution (CC BY) license (https://creativecommons.org/licenses/by/4.0/).