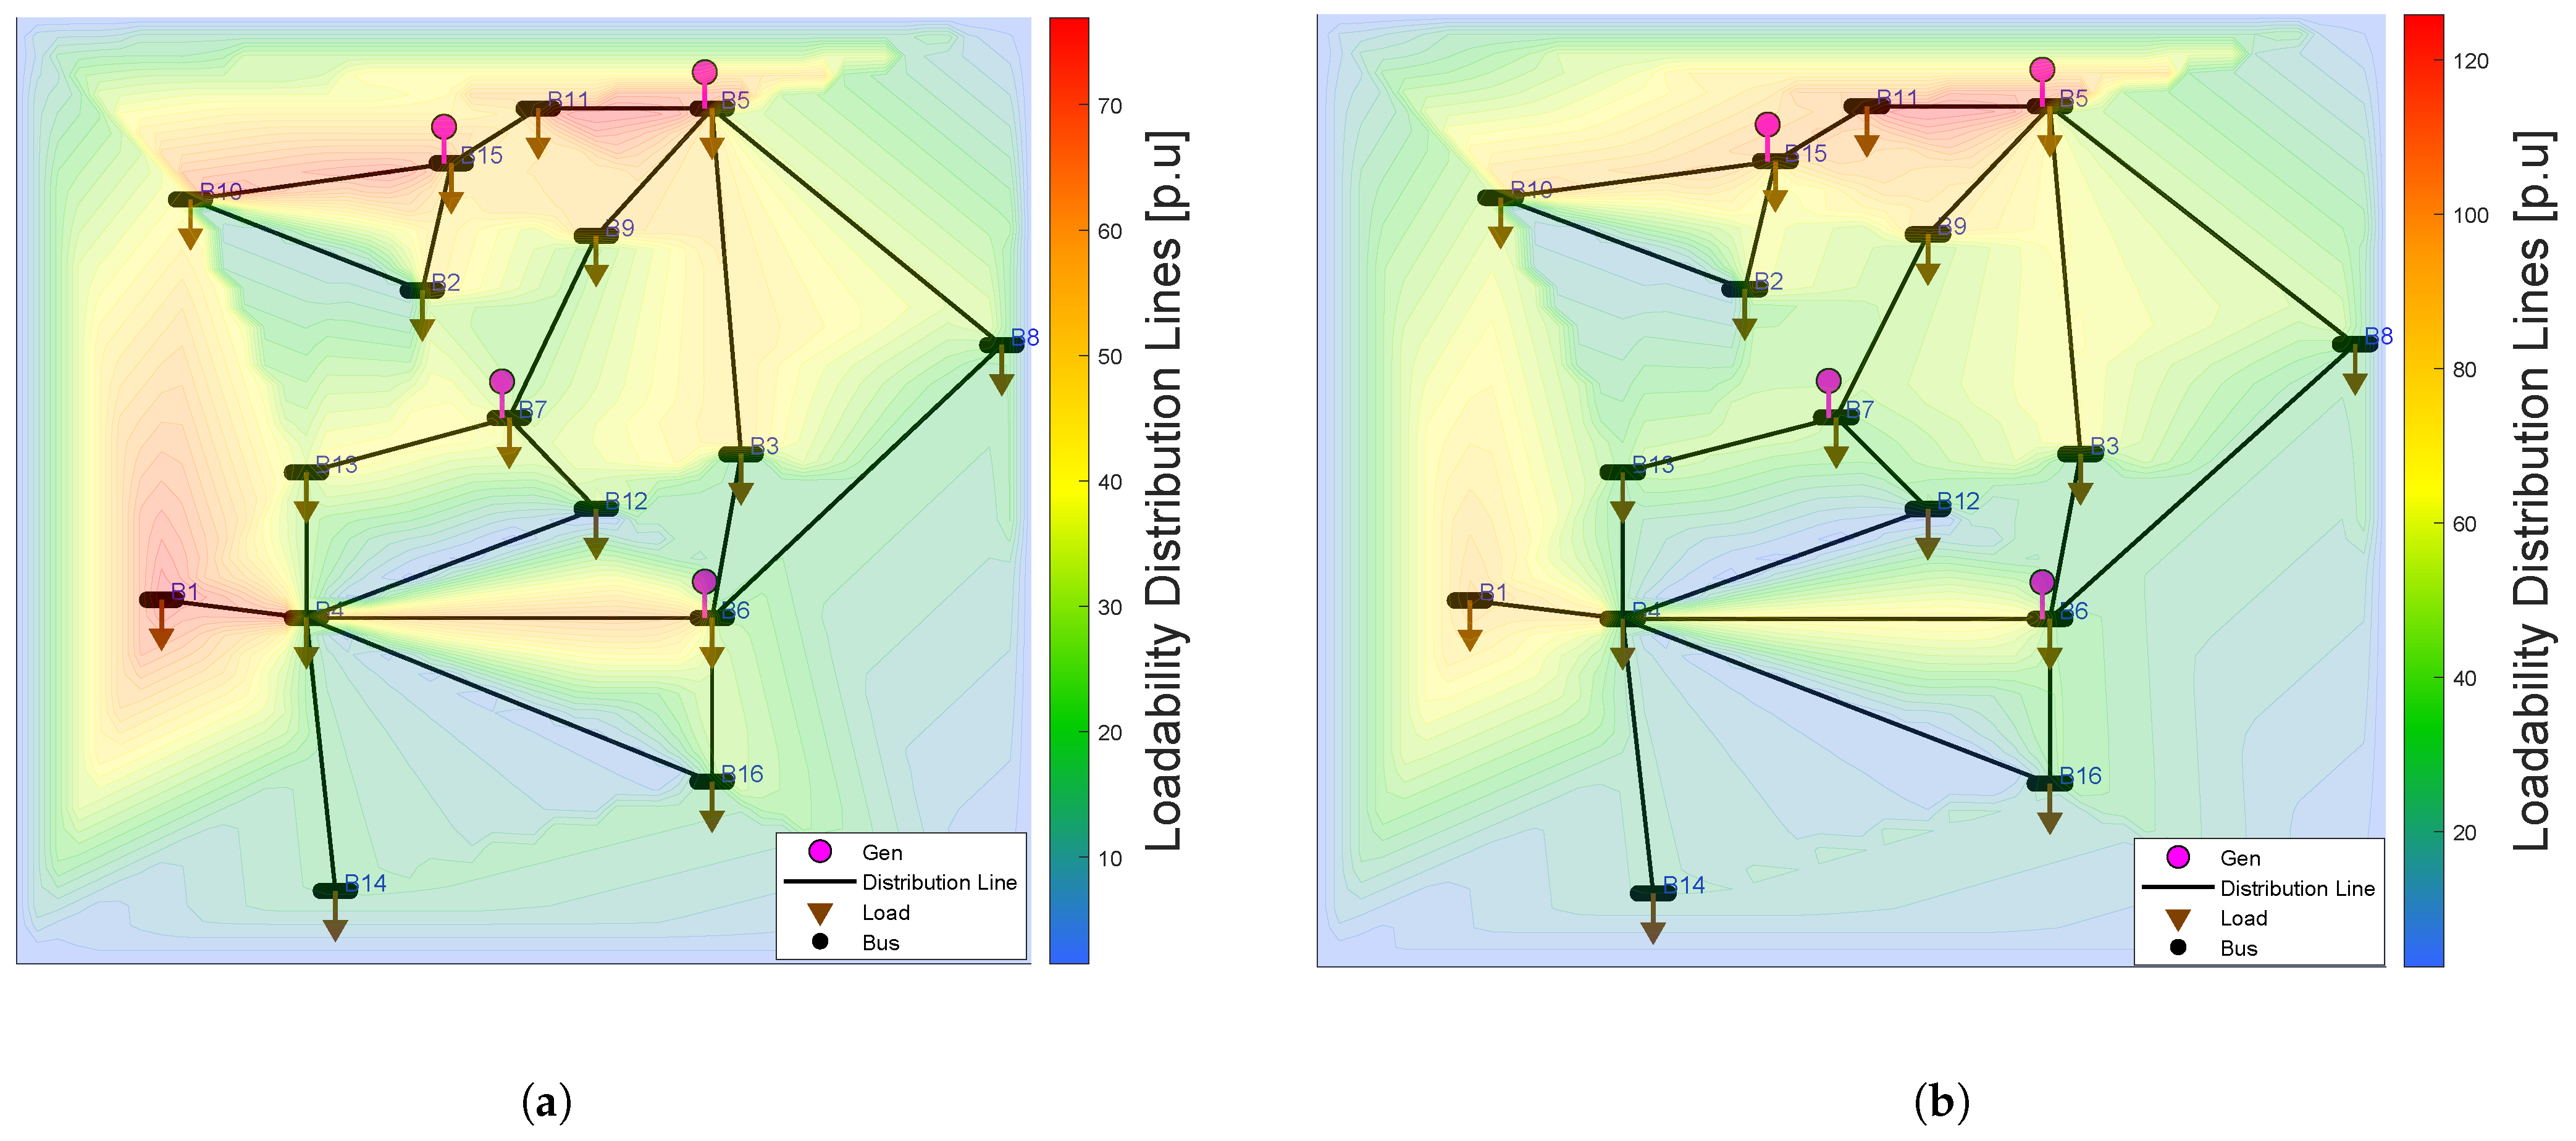
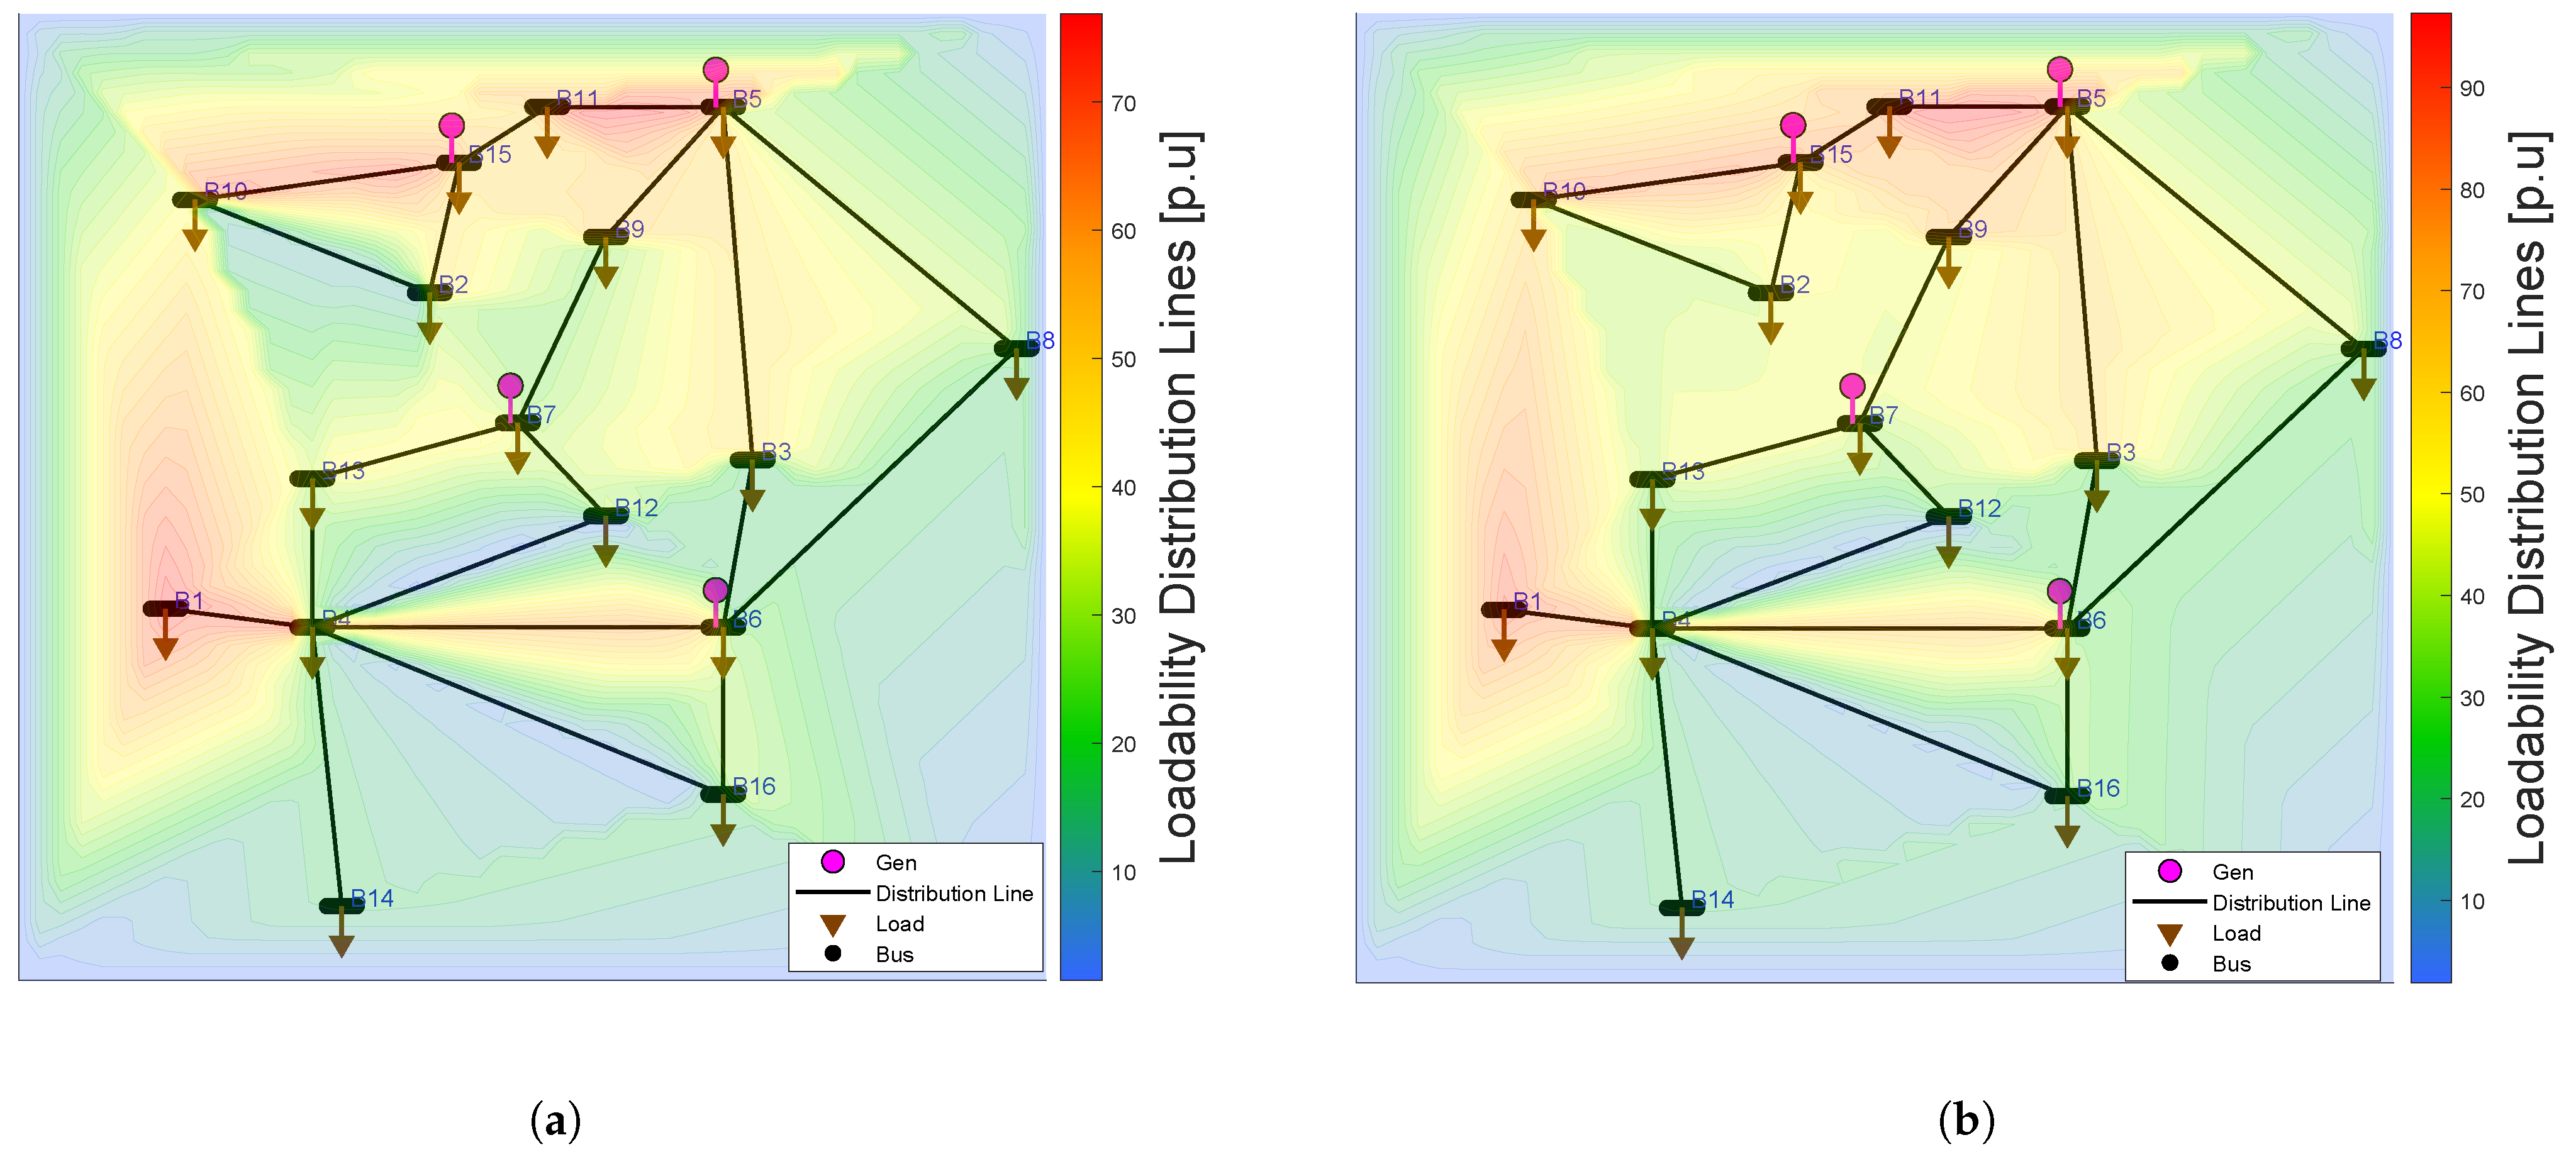
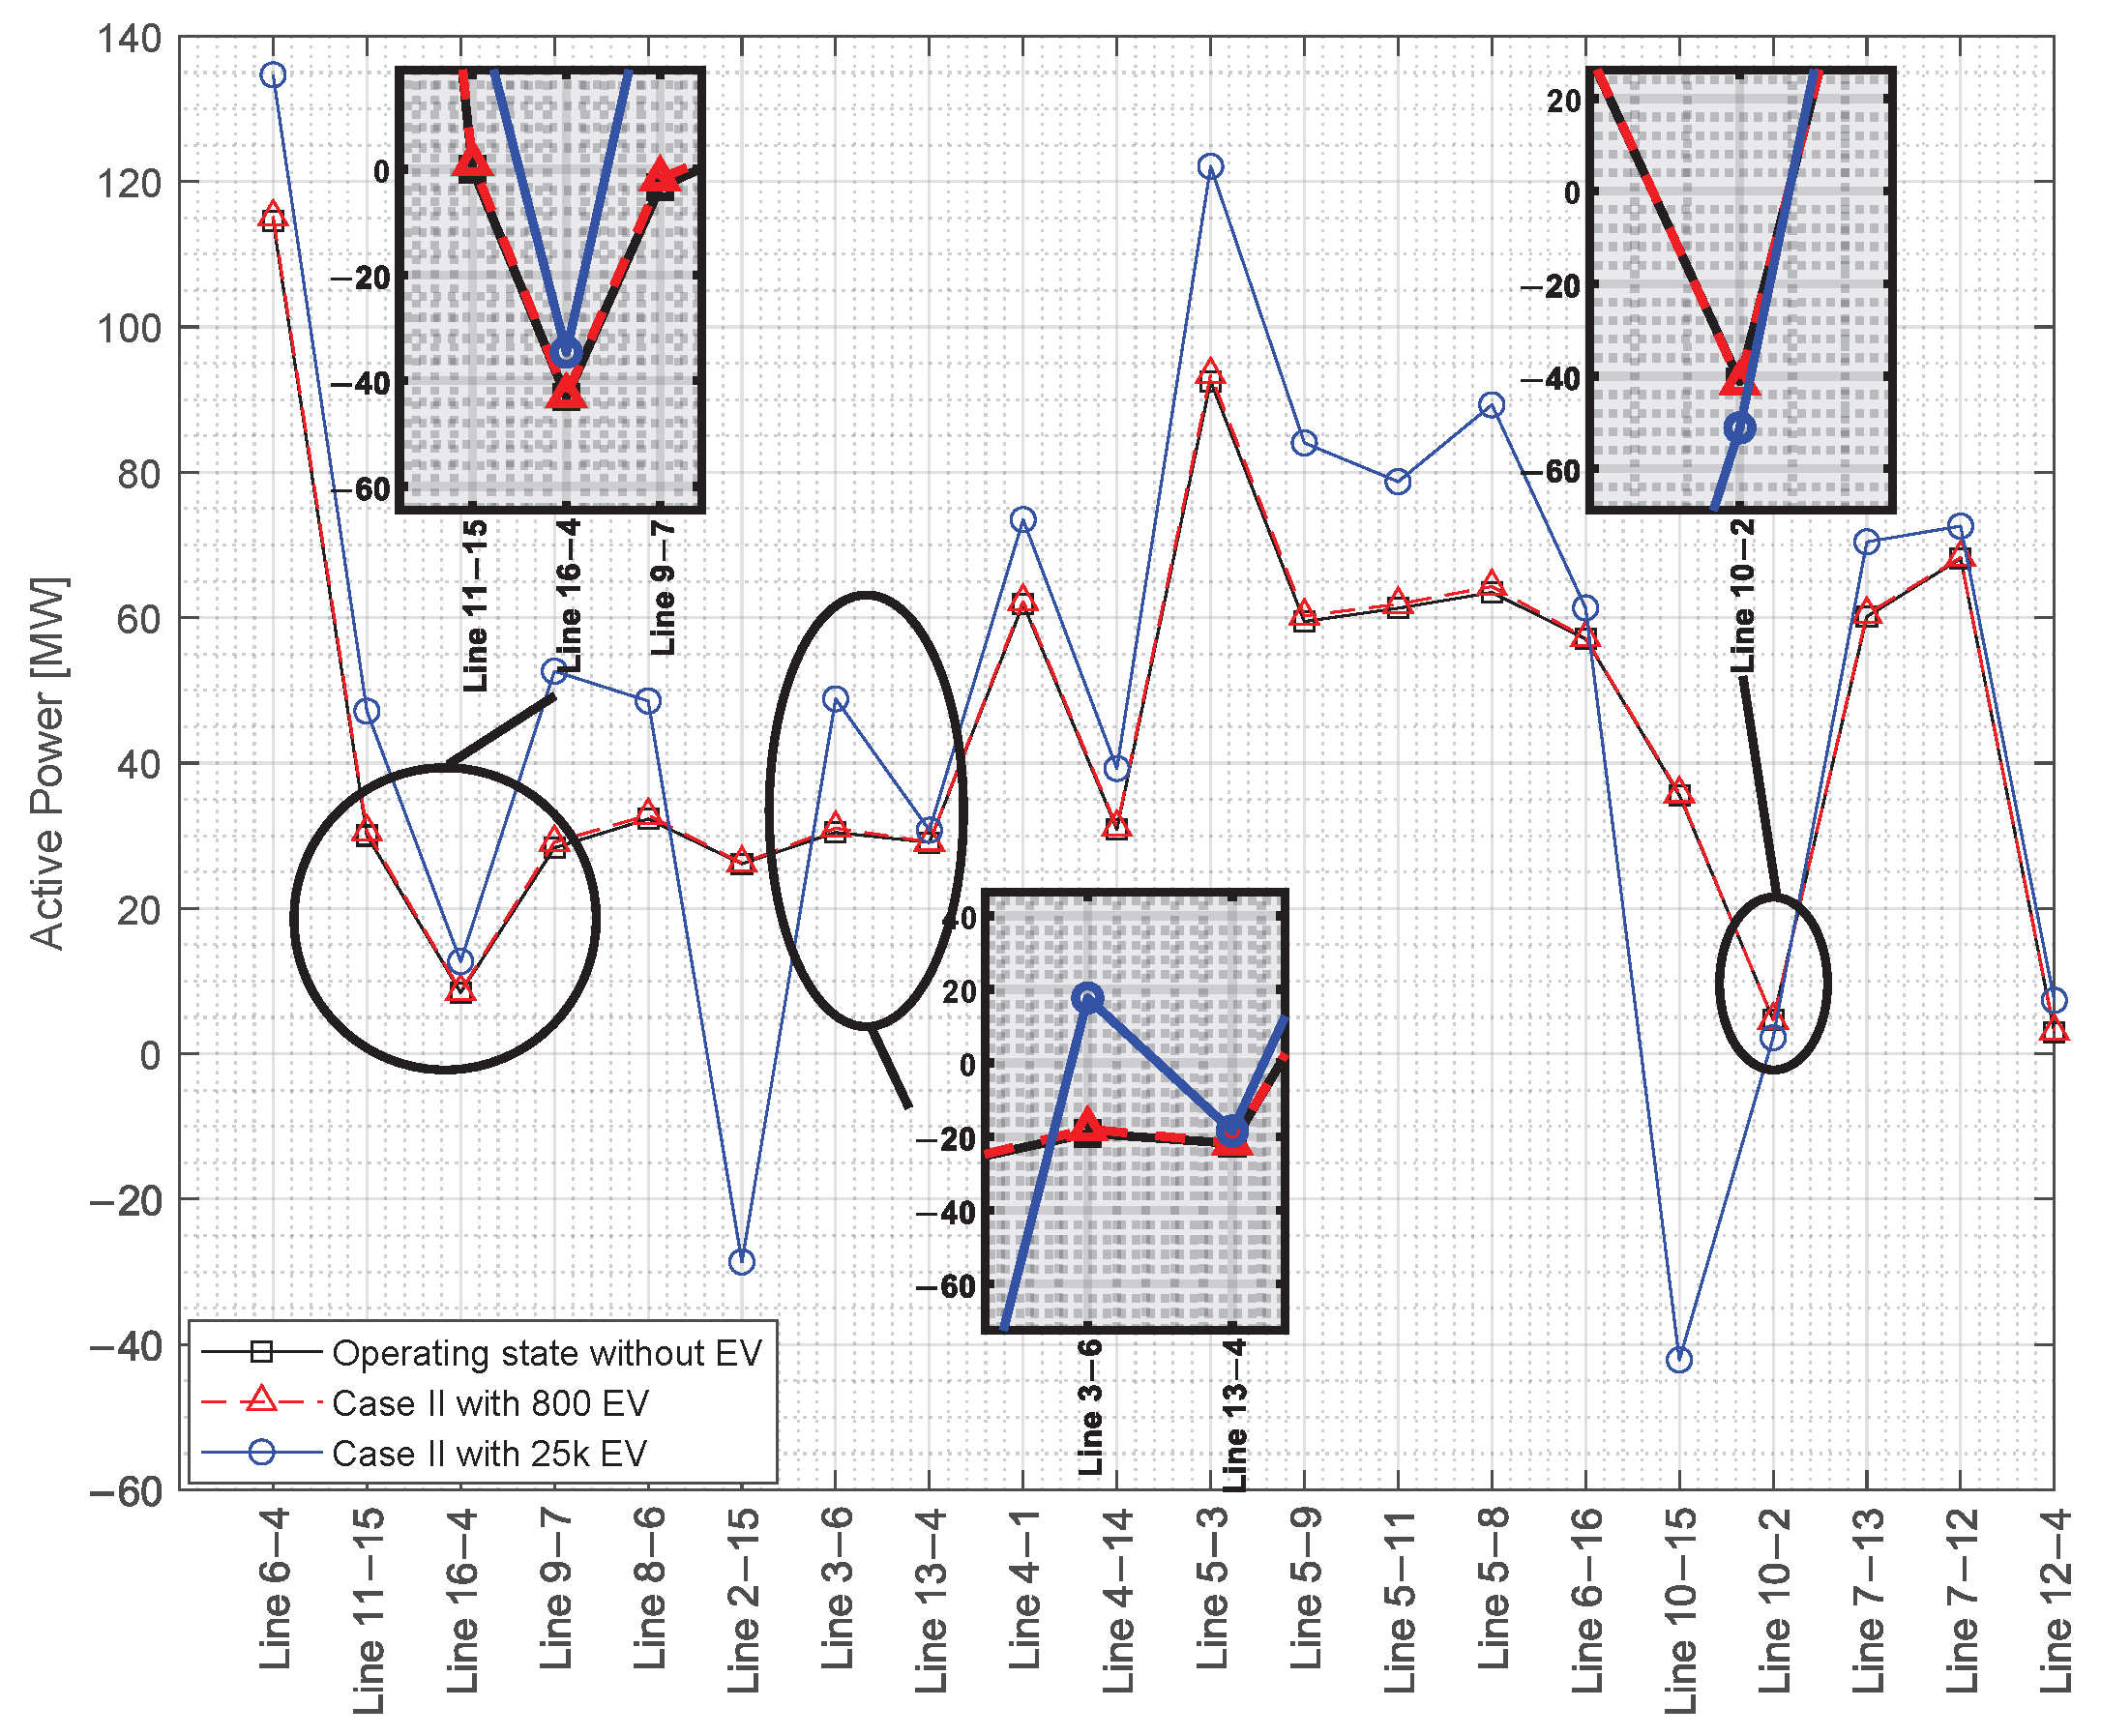
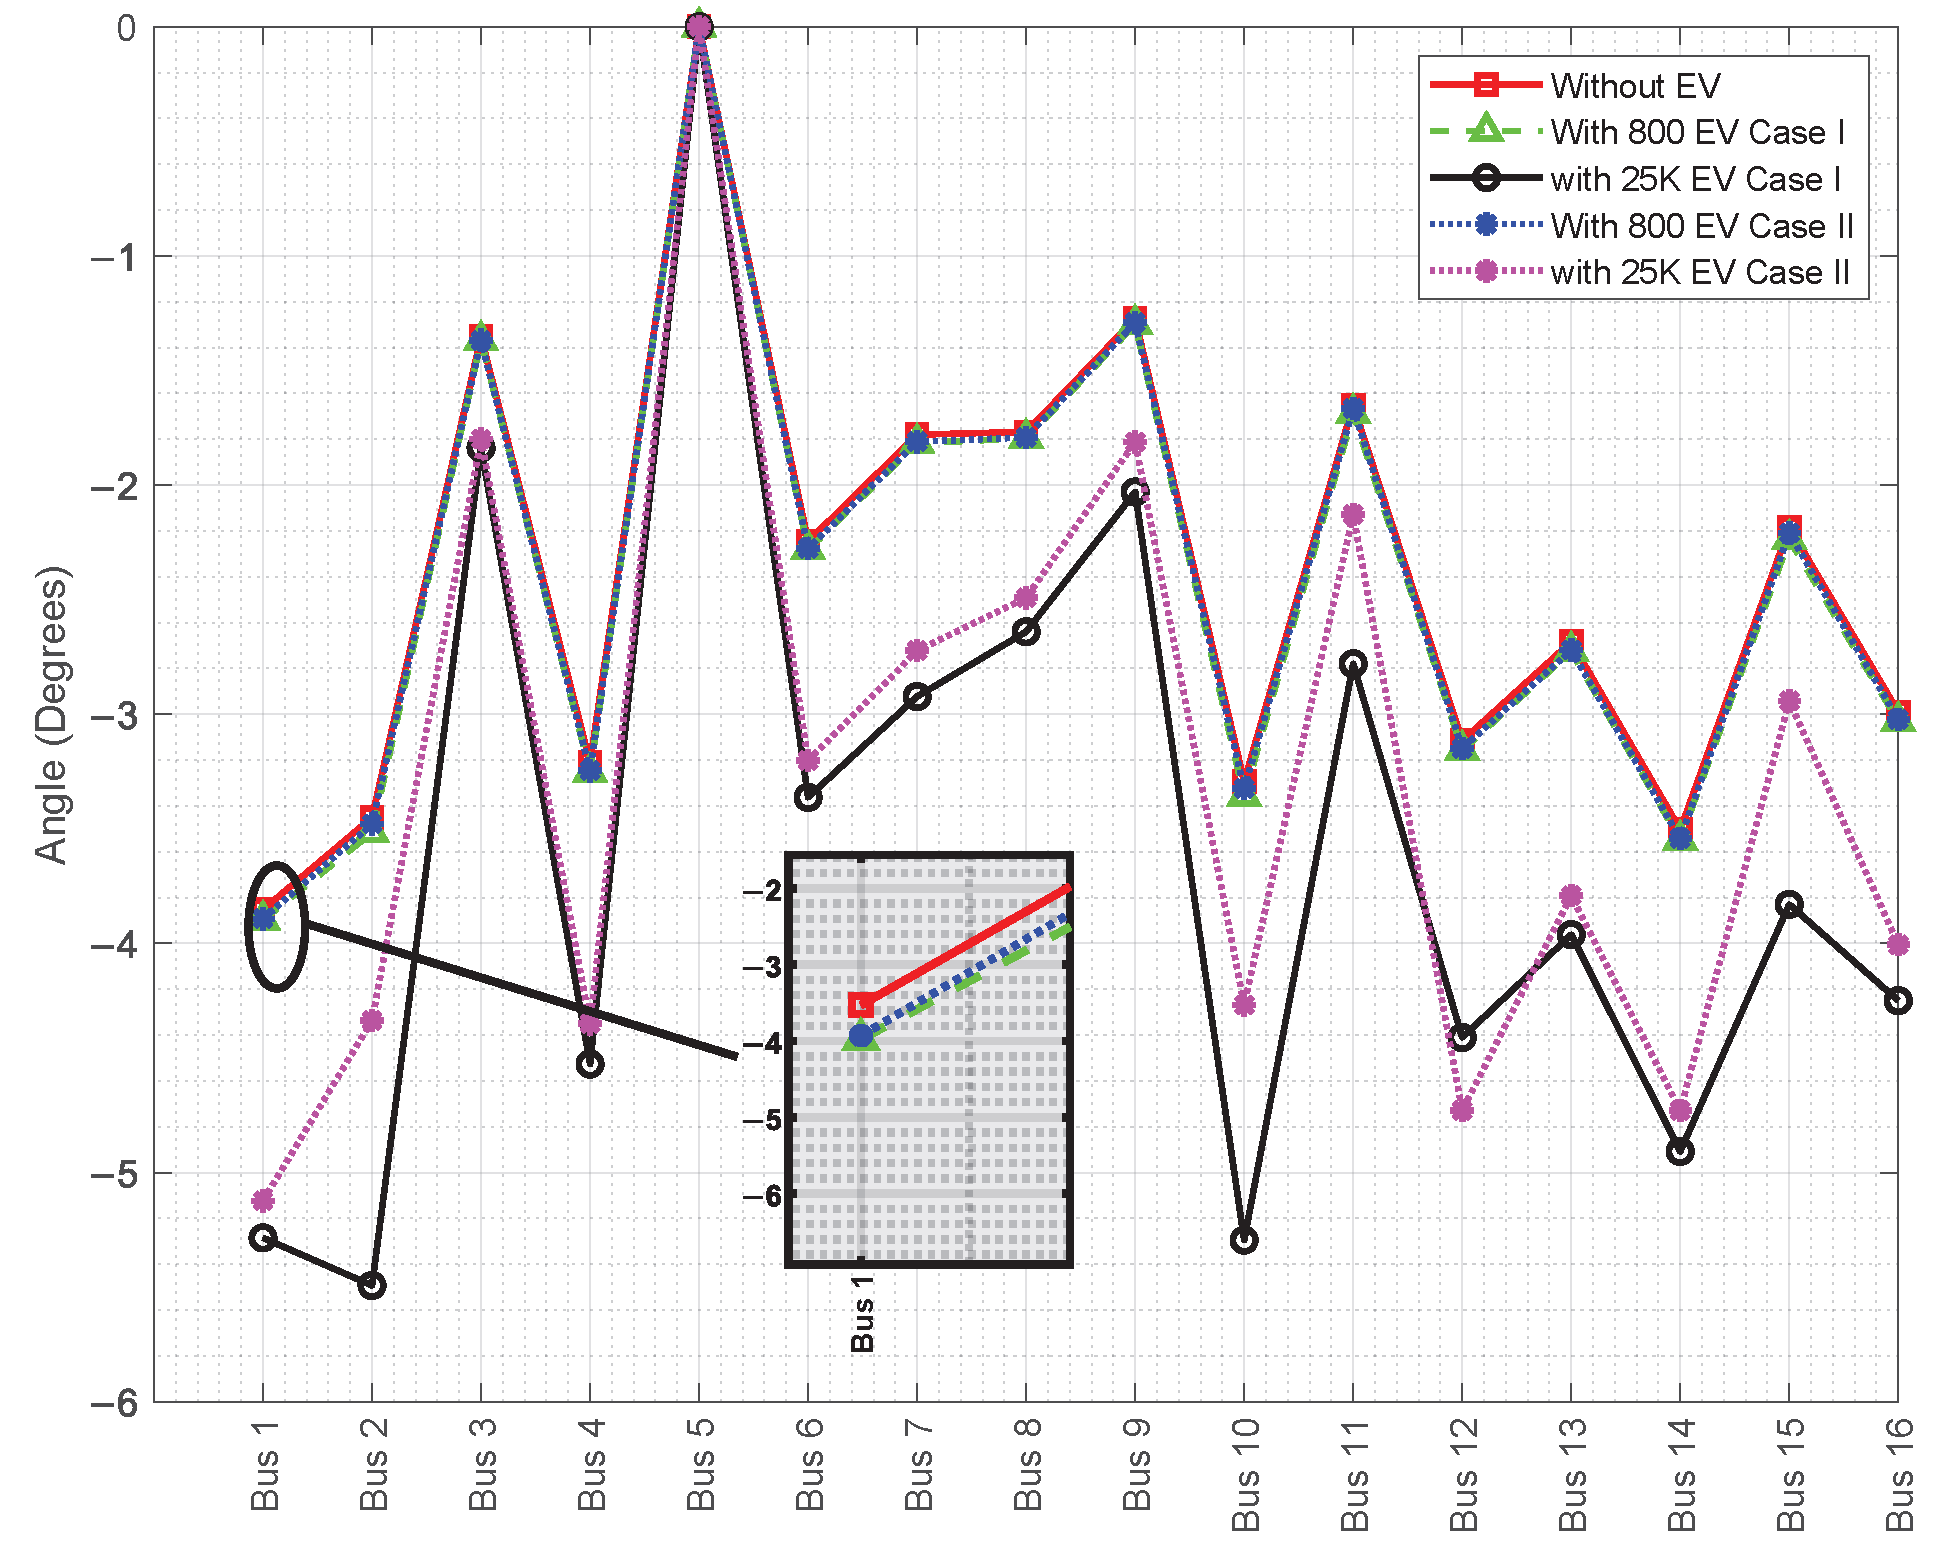
The methodology employed to assess the loadability of distribution lines under the massive integration of electric vehicles (EVs) is characterized by its comprehensive and probabilistic approach. The study integrates three key aspects: accurate modeling of battery behavior during EV charging to determine the required power; simulation of the inherent randomness in system operation using the Monte Carlo method to incorporate the electrical demand generated by EVs; and analysis of the system’s load capacity through the power flow (PF) technique.
2.2.1. EV Modeling
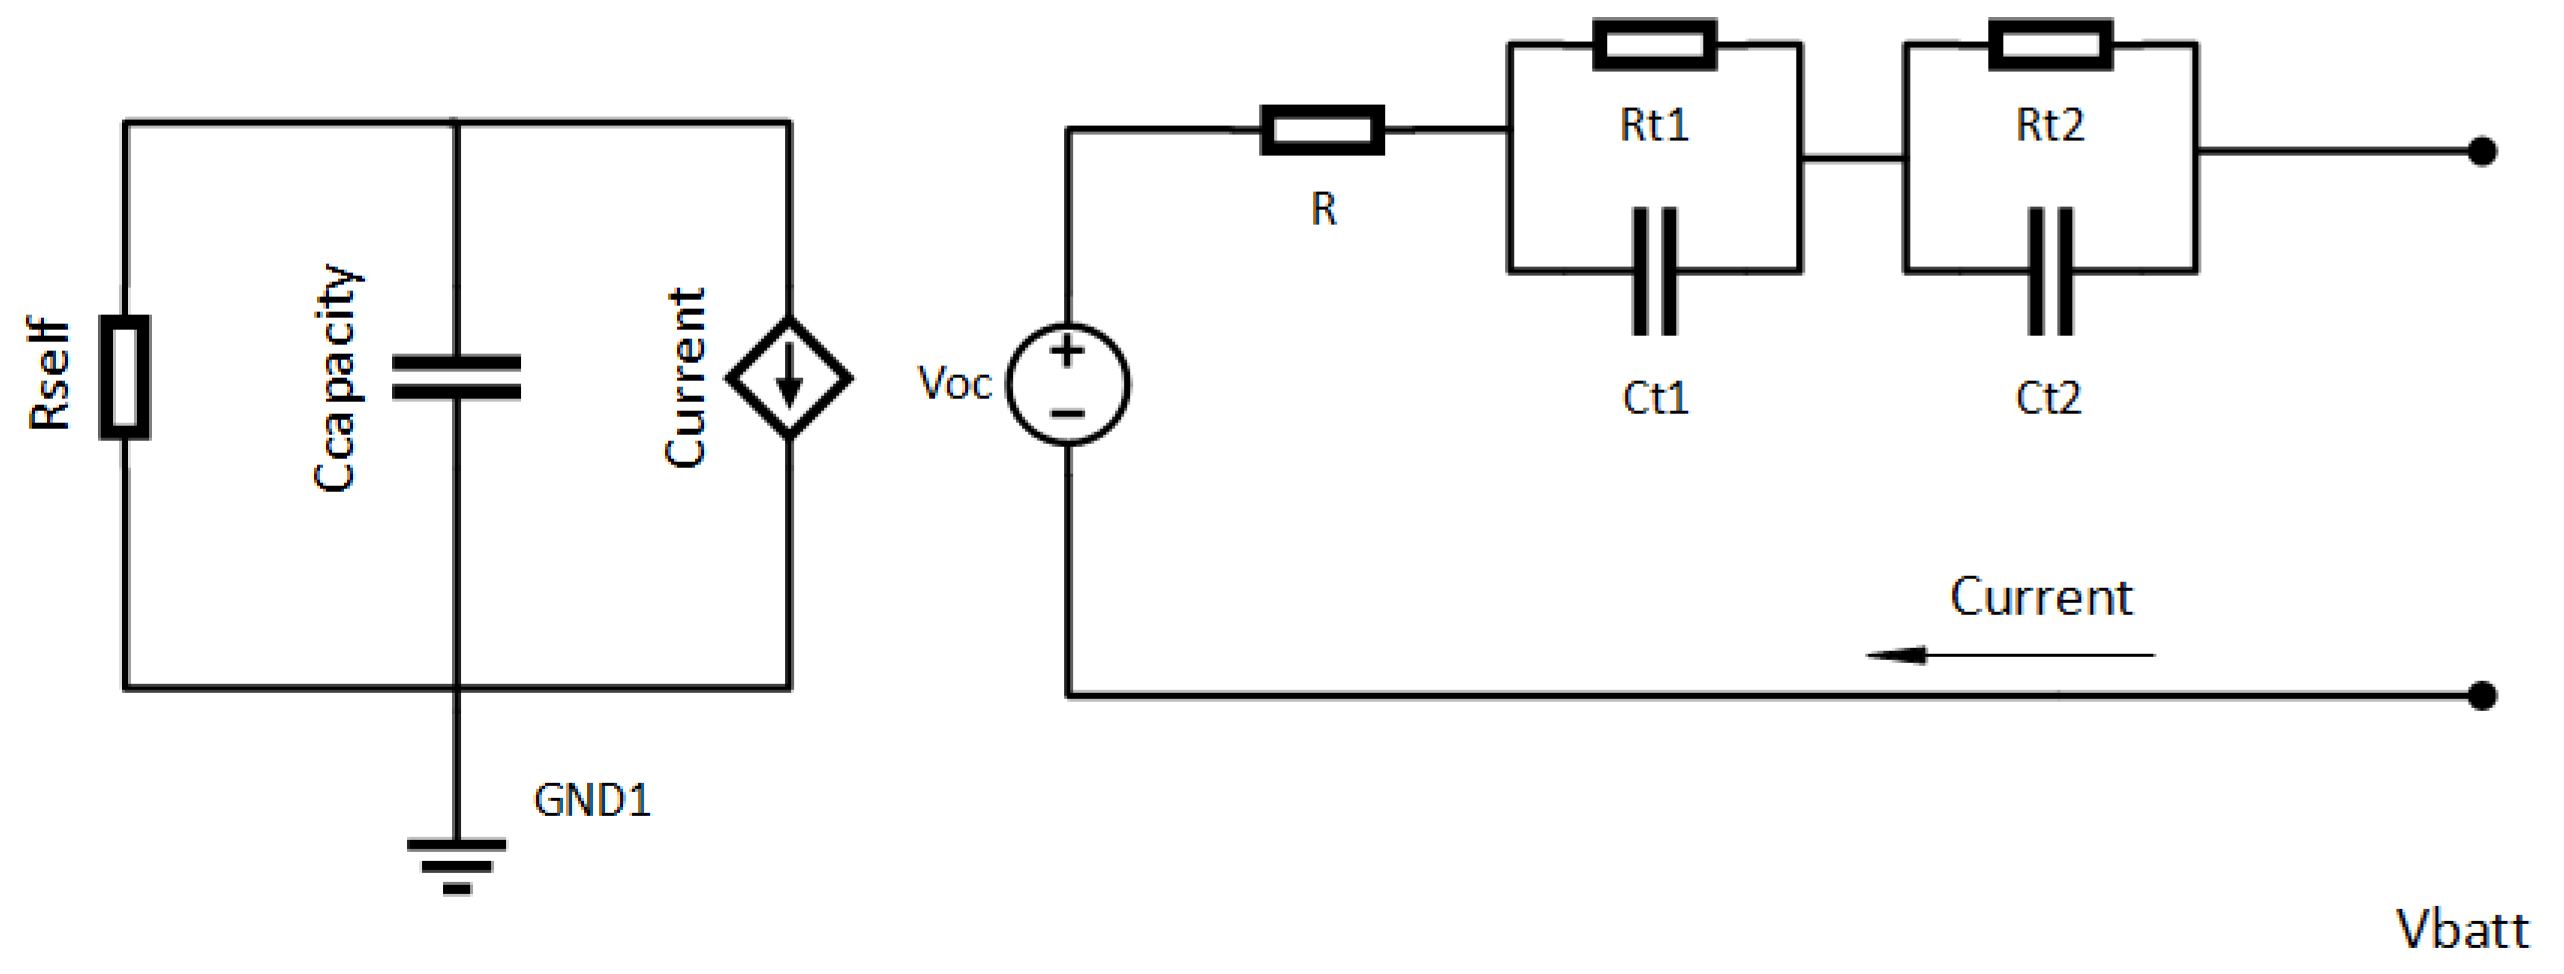
The modeling of lithium-ion batteries for electric vehicles (EVs) was carried out using the approach proposed by [
40,
41], which is widely accepted in the literature for its ability to represent the nonlinear relationship between voltage and state of charge (SOC). For the application in this study, the base parameters reported in [
41] were simulated and validated, and the model was subsequently extended to various vehicle brands by adjusting key parameters according to the technical specifications of each manufacturer; the model is shown in
Figure 1. Since the objective of this work is to evaluate the overall behavior of the distribution system under massive EV penetration, this modeling approach is considered appropriate and representative of the battery technology currently available on the Ecuadorian market.
The technical specifications of the batteries used in the Nissan, Kia, Renault, and BYD EV models were obtained from manufacturer-provided data and are presented as follows:
Nissan: 24 kWh Li-NMC battery, with 192 cells (2 in parallel, 96 in series), nominal voltage of 3.8 V, and capacity of 66.2 Ah.
Kia: 30 kWh LiPB/Li-NMC battery, with 192 cells (2 in parallel, 96 in series), nominal voltage of 3.75 V, and capacity of 75 Ah.
Renault: 33 kWh Li-NMC battery, with 192 cells (48 modules, 96 in series), nominal voltage of 3.5 V, and capacity of 80 Ah.
BYD: 80 kWh LFP (lithium iron phosphate) battery, with 324 cells (324 in series, 1 in parallel), nominal voltage of 3.2 V, and capacity of 200 Ah.
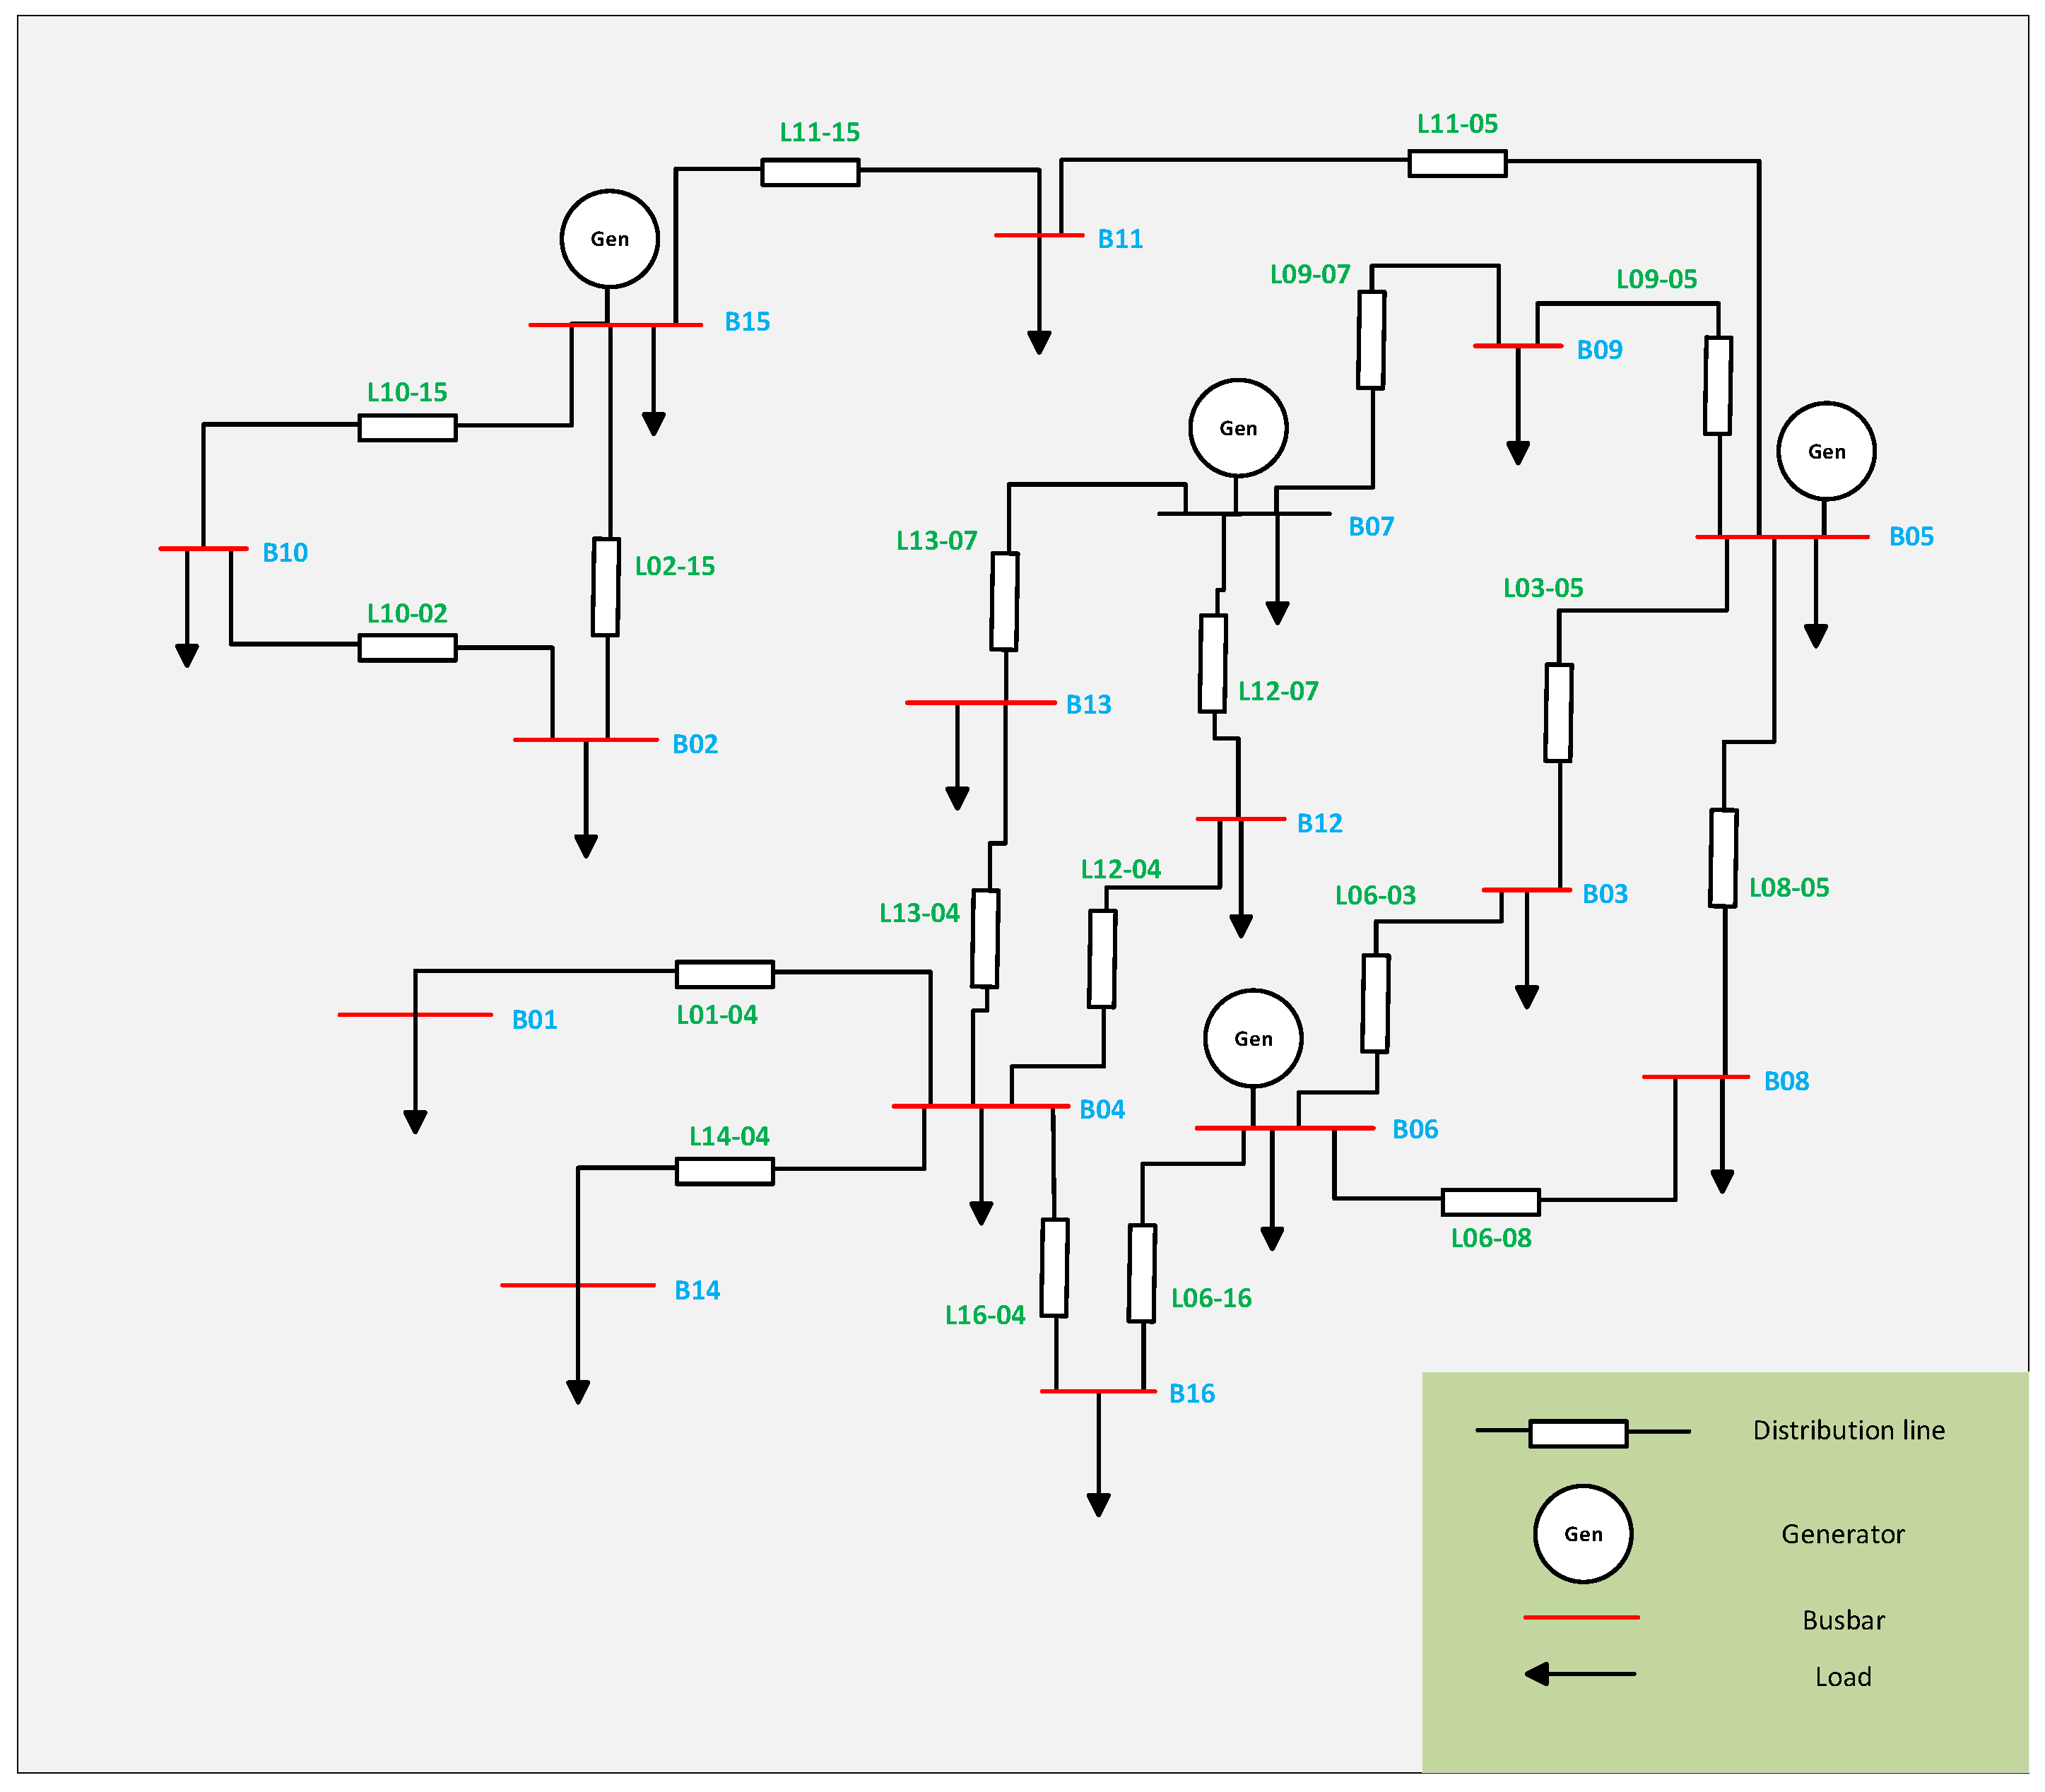
The allocation of electric vehicles to the brands (Nissan, Kia, Renault, and BYD) was based on their current market share in Ecuador—46.82% for Nissan, 23.96% for Kia, 21.91% for Renault, and 7.29% for BYD—according to official data from the national electric vehicle registry. These brands were selected because, together, they represent the majority of the Ecuadorian EV fleet. Although these proportions may evolve with the adoption of new models featuring higher battery capacities, this study aims to reflect the current operational state of the 138 kV distribution system under the present conditions. Initially, the average number of EVs per brand was estimated using these probabilities to account for the spatial uncertainty of each EV within the system. These specifications, including battery type, voltage level, current capacity, number of cells, and other technical parameters, are fundamental for modeling. A significant advantage of the model is its flexibility to adapt to different lithium-ion battery types; by adjusting its parameters, it can accurately simulate the behavior of a variety of EV batteries used in the Ecuadorian market.
To estimate the SOC, calculations were performed with a total of n = 14,000 iterations, modeled using a mixed probability distribution. This distribution assigns the SOC through the following expression:
With a 60% probability, the SOC is uniformly selected within the interval [20%, 50%].
With a 40% probability, the SOC is uniformly selected within the interval [51%, 79%].
The probability density function of the SOC was expressed in Equation (
1):
Equation (
1) probabilistically assigns initial SOC values, reflecting the variability of EV charging-level conditions.
The probabilistic assignment of the initial state of charge (SOC) is based on usage habits observed in the Ecuadorian context, where electric vehicle users tend to connect their units to charging stations when the battery level is in the low or medium ranges; that is, EVs are more likely to be charged when the is below 50%. Additionally, this behavior is influenced by factors such as the limited availability of charging infrastructure in certain urban areas and the desire to maintain sufficient driving autonomy. Based on operational data and mobility patterns, a higher probability was assigned to SOC values between 20% and 50%. This approach reflects real-world usage conditions and is considered a valid approximation for planning scenarios in regions with low charging station density.
Once the
assignment is completed, the models proposed by [
40,
41] are applied, according to the following mathematical expressions formulated below.
Equation (
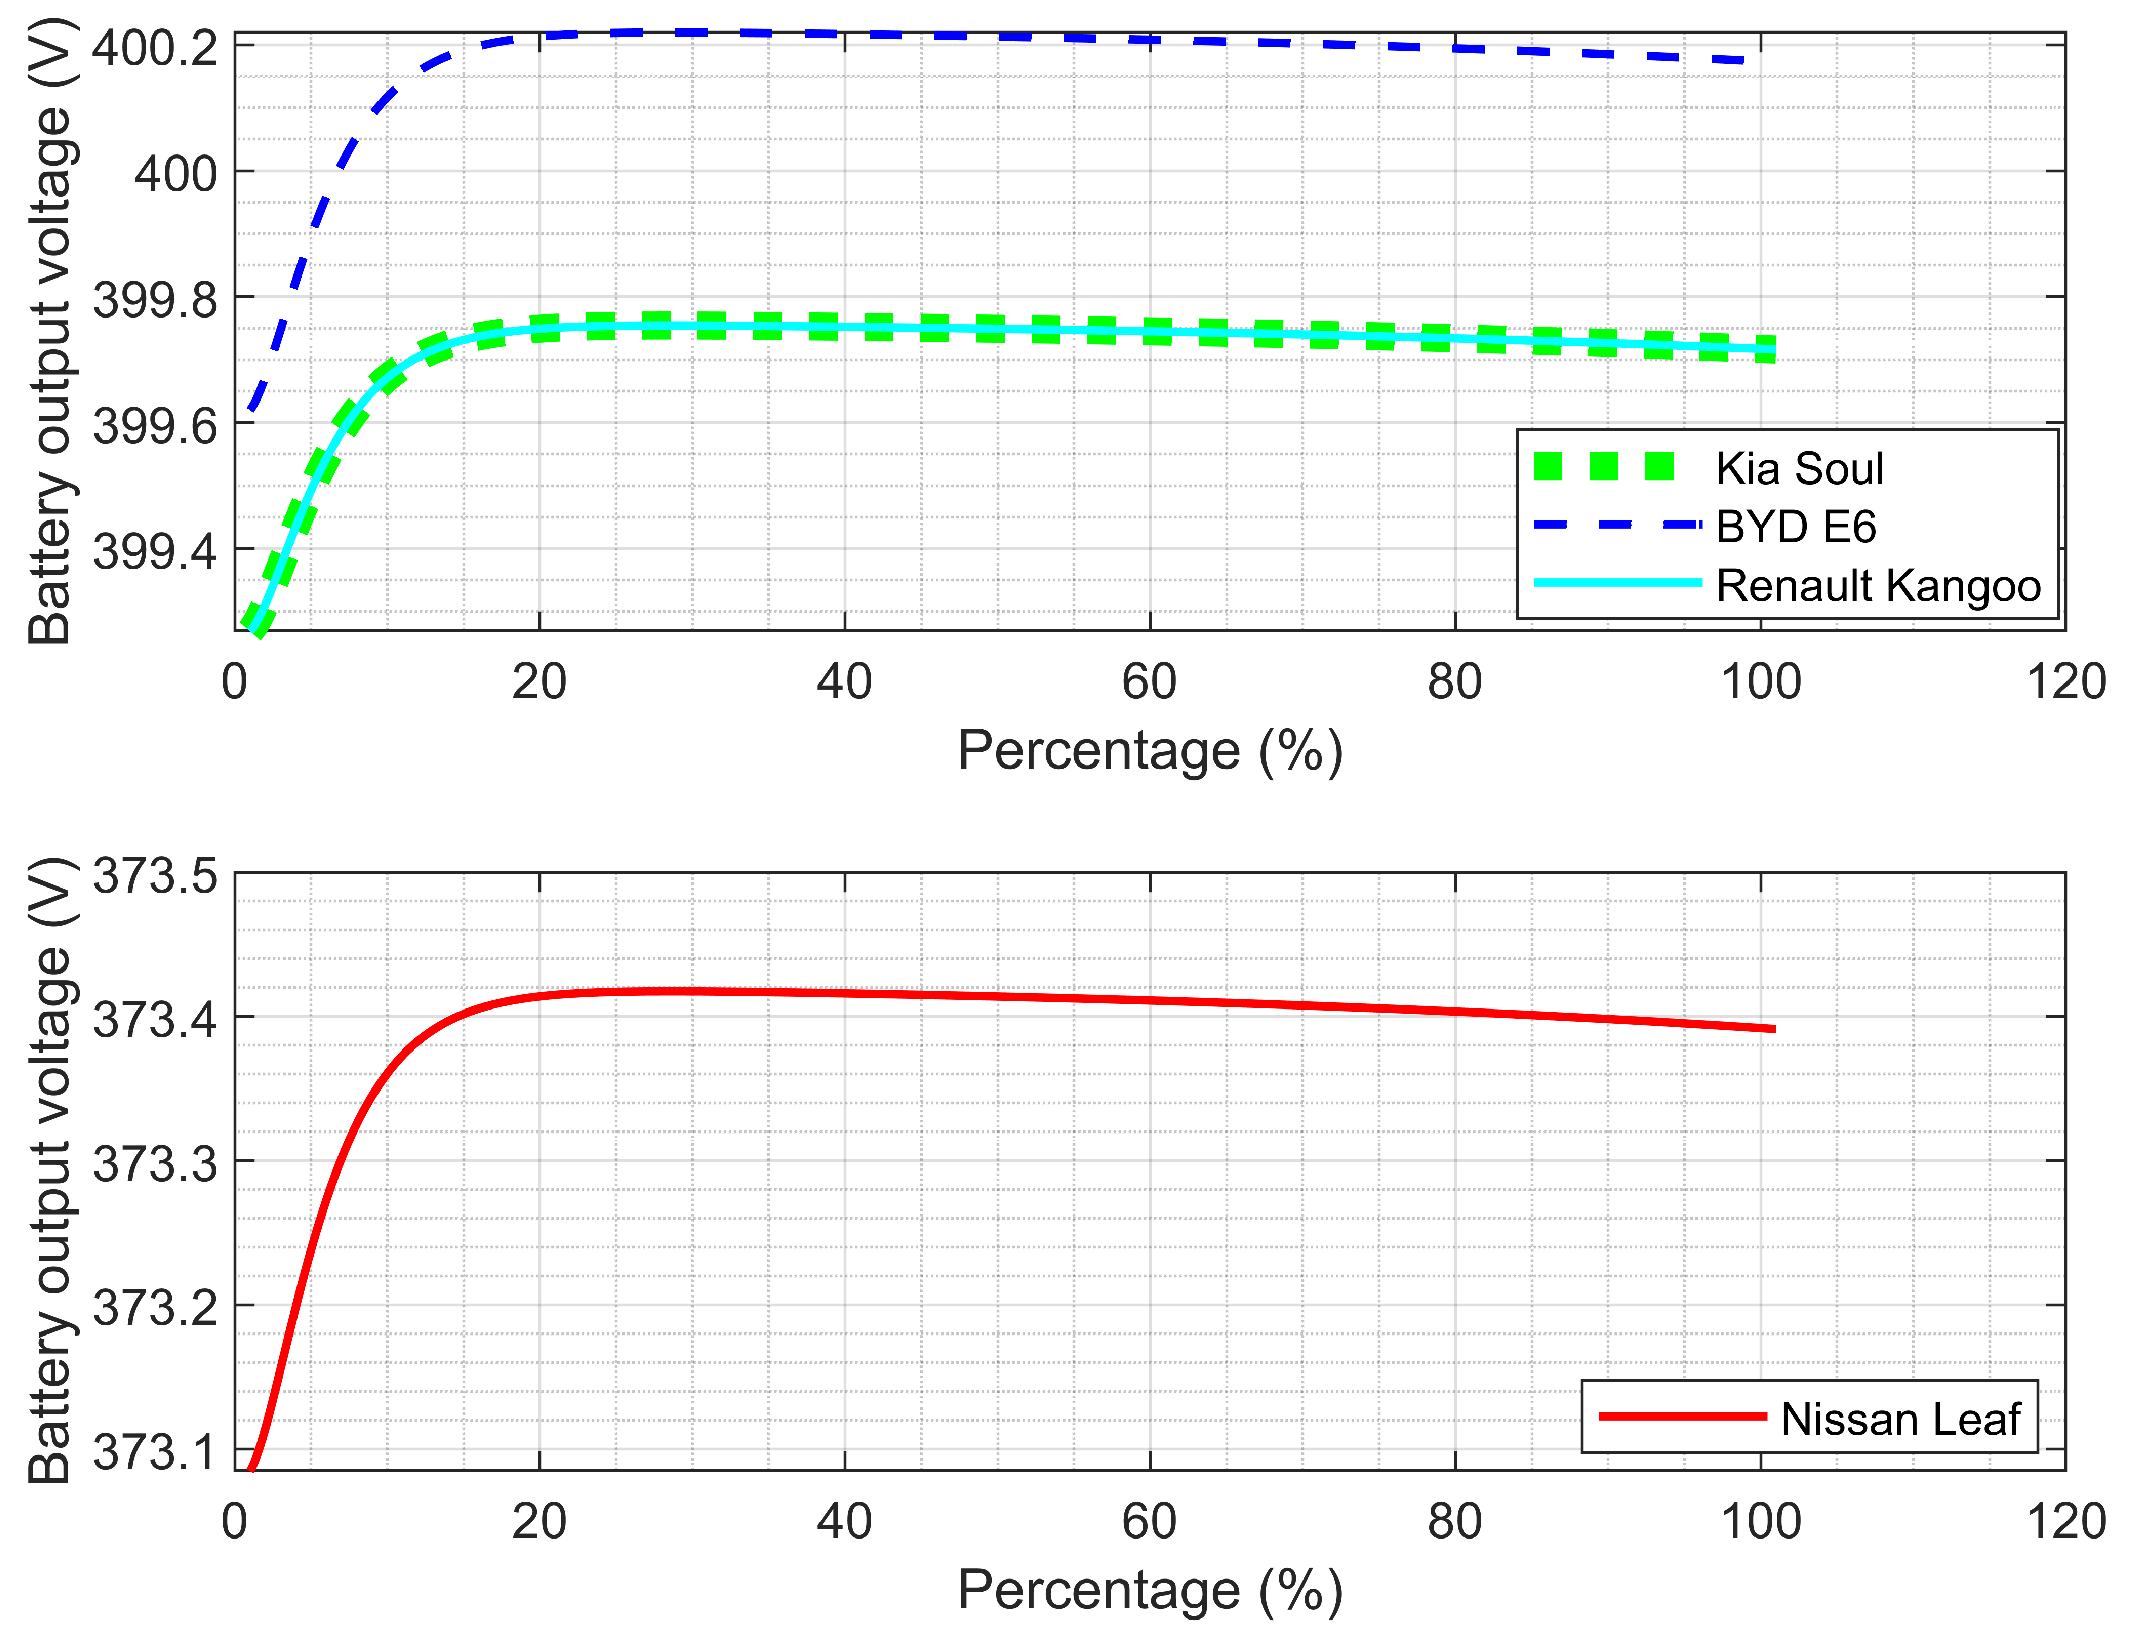
2) models the open-circuit voltage of the battery (
) as a function of the state of charge (
) expressed as a percentage. This represents the battery voltage in an unconnected state, considering the exponential behavior during charging as a function of
, in addition to a polynomial behavior that captures the nonlinear voltage variation as the SOC increases. The coefficients (−1.031, 3.685, etc.) are derived from experimental data, as reported in [
40,
41].
Equation (
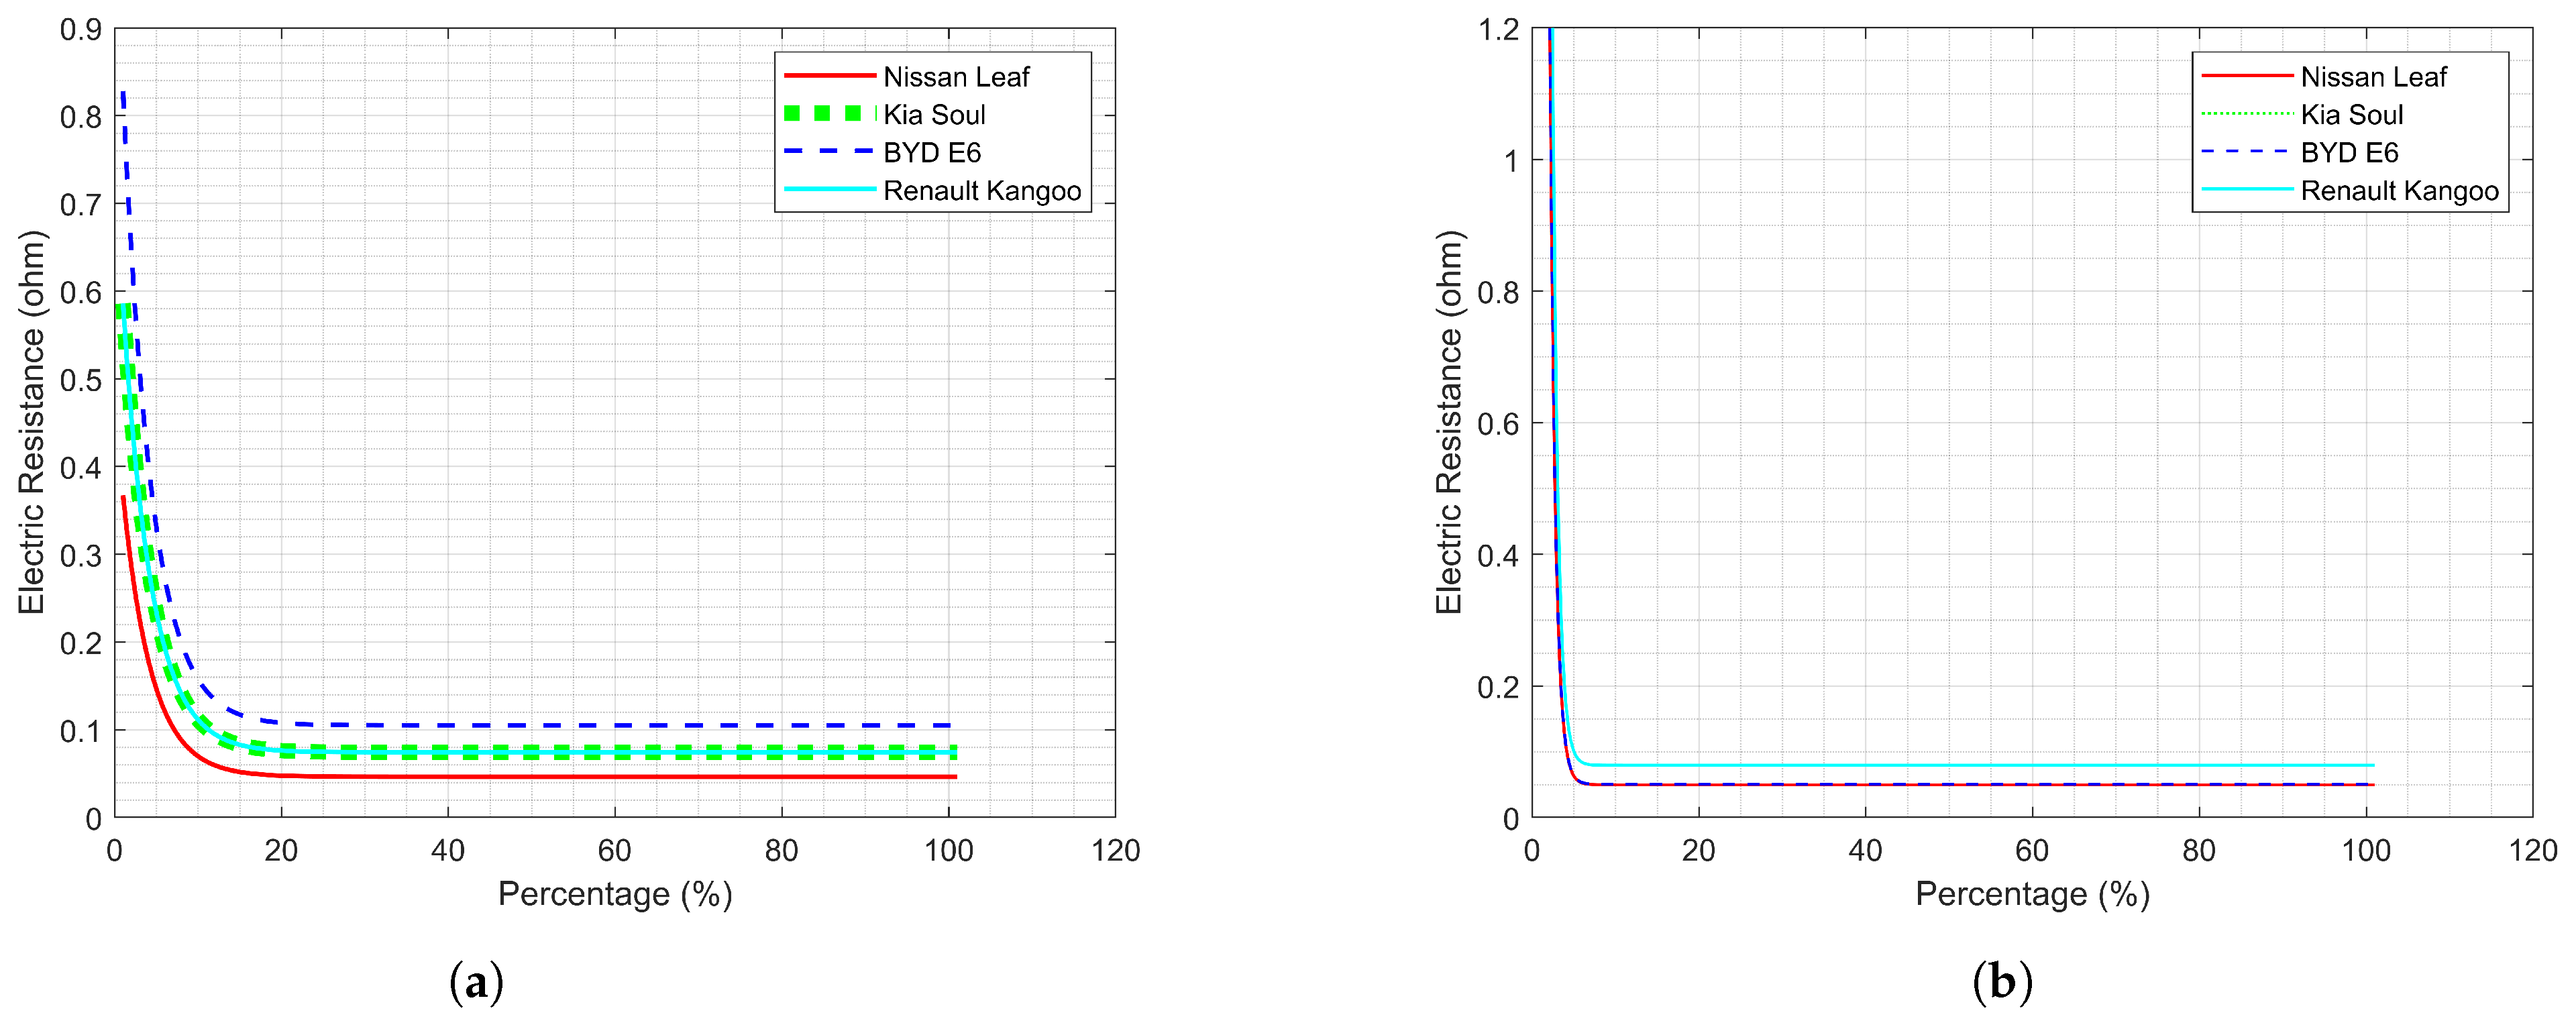
3) defines the series resistance (
) of the battery, which depends on the SOC percentage. The exponential nature of the formula reflects a reduction in internal resistance as the battery charges, with an additional base value of 0.0746 ohms representing the battery’s baseline resistance. This enables the modeling of energy losses during charging and discharging processes.
Equation (
4) models the internal resistance
, which is part of the parallel circuit representing the short-term transient response. The exponential term decreases with increasing
, allowing the incorporation of the resistance behavior as it reduces while the battery charges, alongside a constant value that ensures a minimum resistance level. Equation (
5) represents the capacitance
associated with
. The negative exponential term suggests an initial increase in capacitance with rising
, enabling the adjustment of the constant capacitance value to stabilize the model. This captures the battery’s transient charge storage capacity.
Equation (
6) represents the resistive component of the long-term transient response. The exponential term decreases rapidly with increasing
, indicating very low resistance at high
percentages, while the constant term represents the residual resistance at minimal
levels, affecting the long-term voltage dynamics. Equation (
7) models the capacitance in parallel associated with
. The negative exponential term indicates an increase in capacitance with rising
, and the constant term reflects the long-term charge storage capacity of the battery.
From Equation (
8) to Equation (
11), the calculation of the EV battery voltage is represented. Equation (
8) calculates the voltage across the series resistance, representing the voltage drop due to the battery’s internal resistance. Equation (
9) defines the voltage
across the
circuit, determined by the integral of the product of
and
divided by
, multiplied by the charging current. This represents the short-term transient contribution to the total voltage, modeling the dynamic response of the battery. Similarly,
is calculated in Equation (
10) through the
, defined by the integral of
and
divided by
, multiplied by the charging current. This captures the long-term transient contribution, accounting for slow relaxation effects in the battery. Finally, Equation (
11) represents the algebraic sum of all voltages calculated in the previous equations, adjusted by a correction term that accounts for the impact of SOC on resistance and open-circuit voltage. This final term ensures that the model accurately reflects the battery’s real-world operating conditions under load.
2.2.2. EV Demand Distribution in the EEQ System
The analysis of EV demand distribution was conducted for two specific cases. The first case is a homogeneous scenario, where the power demand of EVs is evenly distributed across all the busbars of the system. In contrast, the second case is a non-homogeneous scenario, utilizing the Monte Carlo method to assign EVs to different busbar in the system, which is critical for reflecting the variability in EV demand. This procedure generated multiple scenarios that were processed to obtain statistically significant results.
The assignment of EVs to the brands (Nissan, Kia, Renault, and BYD) was based on their market shares, defined as 46.82% for Nissan, 23.96% for Kia, 21.91% for Renault, and 7.29% for BYD, according to EV registration data in Ecuador. Initially, the average number of vehicles per brand was estimated using these probabilities; however, to account for uncertainty in spatial distribution, a Monte Carlo simulation was implemented to randomly assign each vehicle to a specific busbar within the system.
The simulation was executed with 1000 iterations. This number was defined based on a sensitivity analysis, which showed that from around 800 iterations onward, the results began to stabilize, with variations of less than 1% in the standard deviation. This choice ensures robustness in the results. In each iteration, EVs are assigned to the busbars using a binomial distribution, where the probability of assignment is weighted inversely to the distance of each busbar from the main load centers.
Equation (
12) represents the random variable
r, to assign each EV to a specific brand (Nissan, Kia, Renault, or BYD), a random variable
r was generated using the Monte Carlo method, following a continuous uniform distribution within the interval [0, 1]. This approach introduces stochastic variability in the assignment process, reflecting the randomness observed in real-world scenarios, while maintaining consistency with the market share percentages reported by Ecuador’s national electric vehicle registry. The allocation is performed based on intervals defined by the cumulative participation values of each brand: when
r falls within a specific range, the corresponding brand is assigned. This probabilistic method provides a more realistic representation of the progressive integration of electric vehicles into the national power system.
Equation (
13) defines the stochastic allocation scheme for assigning each electric vehicle to a specific brand (Nissan, Kia, Renault, or BYD), using a random variable
r generated through a continuous uniform distribution in the range [0, 1]. The intervals of
r are directly linked to the market share of each manufacturer, based on official data from Ecuador’s national electric vehicle registry. This formulation allows for a realistic representation of the uncertainty inherent in the technology adoption process, avoiding deterministic rules and instead introducing controlled variability in the allocation. For example, if
, and the cumulative interval for Kia is 0.4682 to 0.7080, the EV is assigned to Kia.
Equations (
15)–(
23) describe the stochastic assignment of EV by brand and the corresponding calculation of total power demand per battery type at each busbar in the distribution system. Once the brand assignment probability is determined, the distribution of EVs across the busbar is carried out based on the total number of EV and the energy requirements of each model. These formulations integrate both the spatial allocation—guided by probabilistic methods—and the specific power consumption associated with each EV type, considering technical parameters such as voltage differential and charging current. This approach allows for a more realistic estimation of nodal demand under large-scale EV penetration scenarios.
It is important to highlight that the voltage
used in the power Equations (
16), (
18), (
20) and (
22) does not correspond to a constant or nominal value, but rather represents the voltage differential that occurs during the battery-charging process, from the initial state of charge (
) to the final state of charge (
). This dynamic value captures the actual variation of voltage as a function of
and is expressed by Equation (
14):
where:
Equation (
15) calculates the number of Nissan electric vehicles allocated to a specific busbar
n. This is achieved by evaluating, for each EV in the total population, whether it belongs to busbar
n and whether the random variable
r falls within the probability range associated with the Nissan brand. The function
ensures that only vehicles assigned to busbar
n are counted, while
ensures brand-based classification.
Equation (
16) computes the total power demand
associated with Nissan EV at busbar
n. This is calculated by multiplying the number of Nissan EVs at that busbar (
) by the battery charging current
and the voltage differential
, which represents the change in battery voltage between the initial and final state of charge (
and
). Unlike a fixed or nominal voltage,
captures the dynamic behavior of the battery during the charging process, as described in Equation (
14). This formulation links the probabilistic brand and spatial assignment of EVs to their electrical impact on the network, enabling a more accurate estimation of nodal power consumption based on battery-specific characteristics.
where:
From Equation (
17) to Equation (
22), the same procedure applied for Nissan is extended to the remaining EV brands (Kia, Renault, and BYD). In each case, the number of EVs assigned to a given busbar is estimated based on the probabilistic allocation method, and the total power demand is calculated by multiplying the voltage differential
derived from the variation in state of charge by the charging current specific to each battery model. These equations provide a brand-specific estimation of energy demand at each busbar, integrating both the quantity of vehicles assigned and their corresponding electrical characteristics.
Equation (
23) calculates the total power demand at each busbar by summing the individual power contributions from all EV brands assigned to that busbar. This aggregated value represents the complete electrical load generated by electric vehicle charging and serves as a key input for the power flow analysis. It is essential for evaluating the operating conditions of the distribution network, particularly for assessing line loadability and identifying potential overloads under different EV penetration scenarios. Although the battery model used in this study reflects a dynamic behavior, since the voltage depends on the initial and final state of charge (
), it is important to clarify that no temporal progression is explicitly simulated. The power demand per vehicle is calculated based on the voltage differential associated with the
change, but the process is considered as a single charging event under maximum load conditions, rather than as a time-dependent simulation. As such, the battery model contributes to a more realistic estimation of nodal demand, without requiring a full temporal charging profile.
2.2.3. Loadability of the Distribution System
Loadability was evaluated as the percentage increase in distribution line power relative to the rated power before EV integration. This calculation was performed for each line of the 138 kV EPS (Electric Power System), considering both homogeneous and non-homogeneous scenarios at different EV penetration levels. The analysis focused on identifying lines most sensitive to EV integration, accounting for loadability effects, the power transmitted through each line, and demand variations at individual busbars.
For the loadability calculation, a power flow analysis was performed using the Newton–Raphson method. This method was selected due to its quadratic convergence characteristics and ability to handle nonlinear, multi-node systems. The primary objective was to determine system parameters while accounting for the additional demand generated by EVs.
Equation (
24) computes the active power injected at each busbar, considering both line impedance and nodal voltage levels. This equation represents the total power contribution from all inter-busbar connections. Equation (
25) determines the reactive power injection at each busbar, following a similar formulation to Equation (
24). This calculation captures the reactive component of line power flow, which is influenced by the specific characteristics of each transmission line.
Equations (
26) and (
27) represent the power mismatch between the generated power minus the nodal power demand and the specified active power injection at the busbar. This variance is used to evaluate the convergence of the Newton–Raphson method, where values approaching zero indicate the system has reached a steady-state condition.
Equation (
28) represents the system of linear equations that need to be solved iteratively by the Newton–Raphson method. This equation updates the state variables to bring the system closer to convergence. The state variables are the angles and voltages of the system. Equation (
29) represents the linearized terms of the Jacobian matrix, which contains the partial derivatives of the active and reactive power with respect to the phase angles for the case of
H and
M and the voltage magnitudes for the case of
N and
L. This matrix is used to linearize the system of power flows.
Equation (
30) calculates the loadability of a distribution line, defined as the percentage of the line’s power flow relative to its maximum transfer capacity (
). This equation allows us to determine the utilization level of distribution lines and represents a critical value for identifying potential overloads. Additionally, a critical loadability threshold of 90% is considered, meaning that when this value is exceeded, the line is assumed to be operating under overload risk conditions. This threshold was used as a reference to analyze the system’s behavior under different levels of EV penetration.
For the loadability and system operation analysis, technical limits for voltage and angle were established. In particular, a voltage operating range of ±5% relative to the nominal value of 1 p.u. was considered. Likewise, an operational limit of ±40 degrees was set for the phase angles, ensuring stable system operation under both normal and high-load conditions. These criteria were used to verify the validity of the results obtained across the different simulated scenarios.
The proposed methodology is summarized in Algorithm 1, which outlines the complete workflow of the simulation model, from data input to the loadability analysis. Each step of the algorithm corresponds to a methodological stage described in the manuscript: input data (Step 1), dynamic EV battery modeling using dependent parameters (Step 2), stochastic brand assignment via Monte Carlo simulation (Step 3), nodal EV demand estimation based on voltage differential and charging current (Step 4), and finally, power flow and loadability analysis using Newton-Raphson and contingency-based metrics (Step 5).
| Algorithm 1 OST with loadability analysis and contingency rankings |
- Step: 1
Input data Powers, Reactances, Resistances. Generators: , Transmission línes: R, X, SIL Electrical demand: Pd, Qd - Step: 2
EV modeling SOC assigned - Step: 3
EV assigned assigning each EV an r value for each busbar - Step: 4
EV demand - Step: 5
Loadability analysis
|
