Abstract
Given the rising importance of cost-effective solutions in battery research, this study employs an accessible testing approach using low-cost, sensor-equipped platforms that enable broader research and educational applications. It presents a comparative evaluation of lithium-ion battery degradation under two charging strategies: static charging (constant current at 1.2 A) and dynamic charging (stepped current from 400 mA to 800 mA) over 200 charge–discharge cycles. A custom-built, low-cost test platform based on an ESP32 microcontroller was developed to provide real-time monitoring of voltage, current, temperature, and internal resistance, with automated control and cloud-based data logging. The results indicate that static charging provides greater voltage stability and a lower increase in internal resistance (9.3%) compared to dynamic charging (30.17%), suggesting reduced electrochemical stress. Discharge time decreased for both strategies, by 6.25% under static charging and 18.46% under dynamic charging, highlighting capacity fade and aging effects. Internal resistance emerged as a reliable indicator of degradation, closely correlating with reduced runtime. These findings underscore the importance of selecting charging profiles based on specific application needs, as dynamic charging, while offering potential thermal benefits, may accelerate battery aging. Furthermore, the low-cost testing platform proved effective for long-term evaluation and degradation analysis, offering an accessible alternative to commercial battery cyclers. The insights gained contribute to the development of adaptive battery management systems that optimize performance, lifespan, and safety in electric vehicle applications.
1. Introduction
The rapid advancement of electric vehicles (EVs) has revolutionized modern transportation by promoting cleaner mobility and reducing reliance on fossil fuels [1,2]. At the heart of EV technology lies the lithium-ion battery (LIB), valued for its high energy density, long cycle life, and stable electrochemical performance. LIBs typically store between 150 and 250 Wh/kg, making them well-suited for applications that demand compact and lightweight energy storage solutions [3,4]. However, their elevated cost, driven largely by the limited availability of critical raw materials and complex manufacturing processes, presents ongoing economic and sustainability challenges. Ensuring battery safety, efficient energy delivery, and timely replacement is critical to the effective design and operation of electric vehicles [5]. This cost-effective monitoring strategy can significantly benefit resource-constrained research environments, fostering more widespread battery evaluation and innovation. Moreover, proper powertrain sizing particularly of the battery system is essential to ensure sufficient range, safety, and usability in electric vehicles designed for elderly users, who may require consistent and predictable performance [6]. In off-road electric vehicles, accurate battery dimensioning becomes even more critical due to demanding terrain conditions, where energy consumption spikes and robustness are paramount [7].
To sustain battery performance over time, robust safety and monitoring systems are essential. Battery management systems (BMSs) play a central role in this regard, continuously monitoring key parameters such as state of charge (SoC), state of health (SoH), temperature, and individual cell voltage. Well-designed BMS architectures, supported by predictive algorithms, are vital for extending battery life and preventing safety hazards, including overcharging, thermal runaway, and internal short circuits. Furthermore, a clear understanding of the physical and chemical mechanisms of LIB degradation is fundamental to optimizing charging strategies, defining replacement schedules, and developing effective recycling protocols [8].
Battery aging is influenced by a variety of factors, including the current rate, SoC, and operating temperature. Recent studies have shown that, under moderate current rates (up to 5C) and controlled temperatures between 20 °C and 30 °C, capacity fade is not significantly affected by the current rate [9]. This suggests that temperature management may be more critical than current alone in influencing degradation. Additionally, charging current and cut-off voltage significantly impact battery aging. Exceeding critical thresholds, such as a 1C current rate or a 4.2 V cut-off voltage, can accelerate degradation. Adjusting these parameters during the later stages of battery life can mitigate capacity loss and resistance growth [10].
Extensive research has been devoted to understanding how different charging regimes and environmental conditions affect battery degradation. Valverde et al. (2023) demonstrated that high C-rate charging accelerates capacity loss, with 2C-charged cells degrading nearly twice as fast as 1C-charged cells over 400 cycles [11]. Clerici et al. (2024) linked cell swelling and deformation to SoC and SoH, proposing these as physical indicators of degradation [12]. Likewise, Guo et al. (2022) explored the impact of strategies such as delayed charging and vehicle-to-grid (V2G) operation, reporting that delayed charging could reduce capacity loss by up to 13.5% [13,14]. These findings reinforce the value of charging profile optimization to extend battery lifespan and operational sustainability.
An accurate SoH assessment is also critical for effective battery maintenance. Techniques involving random constant-current segments have proven effective for real-time SoH estimation [15]. Machine learning models built on such data enable reliable predictions, even under the variability of real-world EV charging patterns. Recent work shows that even small segments with narrow voltage windows can yield high-accuracy SoH estimations, aiding predictive maintenance strategies [15].
As degradation directly impacts energy storage and delivery, research has increasingly focused on linking charging profiles to SoH indicators. Studies have demonstrated that features such as constant voltage (CV) charging duration and statistical metrics like Shannon entropy can significantly enhance SoH estimation accuracy [15,16]. Moving toward predictive maintenance, Belmajdoub et al. (2024) reviewed advanced SoC and SoH estimation techniques based on Kalman filters and intelligent algorithms for real-time BMS applications [17]. Zhang et al. (2024) proposed a set-based framework for end-of-discharge (EOD) and remaining useful life (RUL) estimation using zonotopic observers, outperforming traditional probabilistic models under bounded-error conditions [18].
Recent efforts have also focused on early-stage cycle life prediction using data-driven models. Xiong et al. (2023) introduced a novel method leveraging voltage–capacity discharge curve features during early cycles to predict battery lifespan. Their area-based indicators, sensitive to early-stage degradation, such as the loss of active material at the delithiated negative electrode, showed strong correlation with overall life expectancy. The proposed model achieved an RMSE of 8.83%, outperforming SVM (14.33%) and BPNN (>40%) models [19].
A comparative study on 18650 commercial Li-ion cells (Sanyo UR18650E) by Ecker et al. (2014) highlighted differences between calendar and cycle aging. Calendar aging progressed linearly over time and was strongly influenced by high SoC levels due to degradation at the carbon electrode. Conversely, cycle aging was more severe during deep cycling and across voltage plateaus, leading to structural damage and altered discharge characteristics [20].
Thermal effects are another critical factor in battery aging. Chen et al. (2024) reported that insulation failure in LiFePO4 cells can cause thermal leakage, underlining the need for effective thermal management [21]. Sagaria et al. (2025) showed that V2G participation increases degradation by up to 14% over 10 years, though this may be offset by economic gains depending on infrastructure and energy flow [22]. Lindgren and Lund (2016) further confirmed that extreme temperatures, both high and low, negatively affect charging efficiency and capacity. For instance, charging efficiency at –10 °C can drop by 15%, whereas proper thermal regulation significantly improves battery lifespan [23].
Dubarry et al. (2024) proposed the analysis of voltage relaxation curves and their derivatives post-discharge as a diagnostic tool, suggesting second-derivative patterns as indicators of subtle aging. However, limitations remain in generalizing this method across chemistries and conditions [24].
To benchmark lithium-ion cell performance, Table 1 summarizes the cycle life and capacity specifications of commercial cells from major manufacturers. This highlights variability in design priorities, such as energy density, longevity, or thermal stability, across different cell chemistries and use cases.

Table 1.
Comparative cycle life of lithium-ion cells from different manufacturers.
A key contribution to this field comes from experimental platforms that enable low-cost, real-time monitoring. The present study introduces a cost-effective, sensor-integrated system based on the ESP32 microcontroller and INA219 current sensor. This setup distinguishes between static and dynamic charging strategies, revealing that while static charging improves cell balancing, it generates more heat. Conversely, dynamic charging maintains lower thermal loads but may lead to uneven cell degradation, findings consistent with prior research. Despite extensive studies on battery aging, few have comparatively examined static and dynamic charging profiles using low-cost, microcontroller-based platforms, highlighting an opportunity for accessible, replicable methodologies.
Recent advances in electric vehicle (EV) health monitoring have highlighted the importance of real-time battery diagnostics for enhancing operational safety, extending battery lifespan, and enabling adaptive control strategies. Low-cost external monitoring modules can complement traditional BMS by offering deeper insights into the degradation behavior, thermal response, and cell imbalance during real-world operation. In this context, the system proposed in this work provides a flexible and scalable solution for real-time battery analysis through wireless data acquisition and cloud-based monitoring. This approach not only supports academic and experimental applications but also represents a viable component for integration into future EV health management architectures, as demonstrated by You et al. (2016), who developed a data-driven method for state of health (SoH) estimation based on real-time operating data from EV battery systems [31].
Collectively, these studies provide a robust foundation for evaluating lithium-ion battery performance under varying charging profiles. They reinforce the importance of integrating experimental analysis with predictive modeling to improve battery lifespan, safety, and sustainability in electric mobility applications.
This study contributes a novel approach by developing and demonstrating a low-cost, customizable experimental platform for the comparative degradation analysis of lithium-ion batteries under static and dynamic charging regimes. Unlike prior investigations that typically rely on expensive cyclers, controlled laboratory chambers, or proprietary battery management systems, the setup presented here is designed to be accessible to smaller laboratories, educational environments, and early-stage research groups. The system integrates open-source hardware and software to collect real-time voltage, current, and temperature data while applying programmable charging profiles, allowing researchers to implement dynamic charging strategies without the need for industrial-grade infrastructure.
In addition, this work provides a side-by-side comparison of degradation behavior under static and dynamic charging profiles applied to 18,650 commercially available cells, filling a gap in the literature regarding the effect of fluctuating current rates on long-term capacity fade and internal resistance growth using simplified instrumentation. By emphasizing an affordable and replicable testing methodology, this study offers a foundation for future research that can progressively incorporate more advanced diagnostic techniques, diverse cell chemistries, and variable environmental conditions.
Likewise, this approach can be extended beyond laboratory settings to support the evaluation and optimization of battery systems in low-cost vehicles such as small utility vehicles, motorcycles, bicycles, and last-mile applications. This broader applicability underscores the platform’s potential to democratize battery research and contribute to practical improvements in sustainable transportation.
2. Materials and Methods
Figure 1 illustrates the methodology, beginning with the definition of a battery testing protocol that includes the design of two distinct charging profiles, static and dynamic, and the selection of a statistically meaningful number of charge–discharge cycles. A cloud-based data acquisition system supported the experiment, enabling long-term monitoring and analysis. A custom, low-cost testing platform was developed and fully automated through programmed control logic. All sensors were calibrated against high-accuracy reference equipment, specifically using the EBC-A40L Battery Tester (manufactured by ZKE Tech in Shenzhen, China; 5 V, 40 A high-current lithium battery charge and discharge capacity tester) to ensure accurate voltage and current measurements. Additionally, preliminary tests validated system repeatability, confirming data accuracy and measurement reliability.
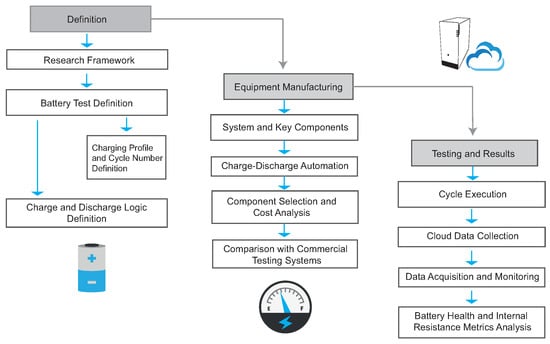
Figure 1.
Methodology overview.
After specifying and selecting the lithium-ion cells, tests were conducted under controlled ambient conditions. Each battery underwent complete charge and discharge cycles under both charging strategies. The setup monitored key parameters such as individual cell voltage, pack current, ambient and surface temperatures, power, and the state of charge (SoC). The data was then statistically validated and analyzed to extract degradation metrics. This methodology enabled a comparative evaluation of the evolution of the state of health (SoH) under static and dynamic charging strategies, providing insights into capacity fade, cell imbalance, and thermal effects. Ultimately, it supported evidence-based conclusions regarding optimal charging strategies for extending battery lifespan in electric vehicle applications.
2.1. Definition of Parameters and Experimental Design
This section outlines the key parameters and procedures that guided the experimental testing of lithium-ion battery packs under two different charging strategies. The primary goal was to assess the impact of static versus dynamic charging on the battery’s state of health (SoH) and degradation behavior over time. A combination of electrical (voltage, current, and power) and thermal (temperature) measurements was continuously monitored over 200 charge–discharge cycles. A custom-built monitoring system using low-cost sensors facilitated detailed performance tracking, enabling the analysis of capacity retention, voltage behavior, and internal resistance growth.
2.1.1. Battery Test Definition
The battery test was designed to simulate realistic charging and discharging conditions under a controlled laboratory environment. The aim was to compare static and dynamic charging strategies under identical ambient and load conditions. A custom-made, low-cost testing setup allowed the continuous logging of electrical and thermal parameters. Each pack was subjected to 200 complete charge–discharge cycles, representing early to mid-life degradation stages. Special attention was given to individual cell behavior, imbalance, and thermal effects to anticipate potential failure mechanisms or deviations in SoH.
2.1.2. Charging Profile Definition
In the static charging profile, the battery pack was charged using a constant current of 1.2 A until the terminal voltage reached 12.6 V. This was followed by a constant voltage (CV) phase at 12.6 V until the charging current dropped below 150 mA, simulating a full charge. Discharge was performed at a constant current of 1.2 A until the voltage dropped to 9.3 V. This strategy reflects a fast-charging scenario intended to induce observable thermal and degradation effects.
In the dynamic charging profile, charging began at 400 mA until the voltage reached 11.5 V. The current was then increased to 800 mA to accelerate the second phase of charging up to 12.6 V. As in the static case, a CV phase at 12.6 V followed, ending when the current tapered below 150 mA. Discharge was performed at a constant current of 900 mA down to 9.3 V. This approach aimed to reduce early-cycle stress by minimizing heat generation at low SoC levels while maintaining efficient charging near full capacity.
These current values were selected based on a combination of hardware constraints and practical behavior observed during preliminary testing. A static current of 1.2 A was the highest, and it was allowed by the integrated battery management system (BMS), even though the manufacturer specifies a fast-charging limit of 1.5 A. The dynamic profile range of 400–800 mA was chosen to minimize stress at low SoC and to reflect realistic current draw: at voltages around 11.5 V, the cells naturally exhibited current consumption between 600 and 700 mA. Thus, this profile emulates real-world variable charging conditions while remaining within the system’s safe operational limits.
2.1.3. Number of Cycles
Tests were performed on a 3S-configured lithium-ion battery pack composed of ITR 18650-2600P cells (manufactured by Zhejiang Tianneng Energy Technology Co., Ltd. in Huzhou, China), each with a nominal voltage of 3.7 V and a rated capacity of 2600 mAh. According to the manufacturer, these cells retain 80% capacity after 300 full cycles.
A total of 200 charge–discharge cycles were conducted for each charging profile. This number was chosen to capture early and mid-life degradation trends while avoiding excessive test duration. It allowed the identification of performance degradation patterns, such as voltage drops, increases in internal resistance, and capacity loss, without reaching the cells’ end-of-life threshold.
2.1.4. Charge and Discharge Logic
State-machine logic was implemented in the ESP32 microcontroller (manufactured by Espressif Systems in Shanghai, China) to automate the charge and discharge process:
- State 1—Fully Discharged: Pack voltage < 8.5 V;
- State 2—Discharging: Voltage between 8.5 V and 12.6 V, with current between −2000 mA and −150 mA;
- State 3—Charging: Voltage between 8.5 V and 12.6 V, with current between 150 mA and 2000 mA;
- State 4—Fully Charged: Voltage = 12.6 V and current < 150 mA.
This logic ensured consistent and safe transitions between charge and discharge states based on real-time sensor readings. In the static profile, charging transitioned directly from discharge to constant current (1.2 A). In the dynamic profile, the logic triggered a current increase from 400 mA to 800 mA when the voltage reached 11.5 V. Discharge limits were maintained at 1.2 A for static tests and 900 mA for dynamic tests.
2.1.5. Test Procedure
Each test cycle began with a discharge through a 10 resistive load until the cut-off voltage (9.3 V) was reached, followed by a short rest period. Charging was then applied according to the selected profile (static or dynamic). The ESP32 enforced safety constraints (voltage, current, and temperature) and logged data in real time to both microSD and cloud storage.
2.1.6. Cloud Data Collection
Sensor data, including voltage, current, temperature, and timestamps, was recorded and uploaded to a cloud platform every three minutes. This allowed remote monitoring, redundancy, and secure data storage. Post-processing was performed using Python 3.13 and MATLAB R2024b to analyze SoH trends, voltage behavior, and thermal profiles.
2.2. Battery Health and Internal Resistance Metrics
Assessing battery state of health (SoH) and internal resistance () is essential for evaluating performance and aging across extended cycling.
2.2.1. State of Health (SoH)
SoH quantifies the remaining capacity of a battery relative to its nominal capacity, and it is defined as
where
- : The measured capacity after n full cycles;
- : The manufacturer-specified capacity under standard conditions.
SoH is widely adopted in the literature for quantifying capacity fade and has been validated across multiple studies under varied operating conditions [31].
2.2.2. Internal Resistance ()
Internal resistance tends to increase with aging and negatively affects power delivery and thermal efficiency. It is calculated as
where
- : The open-circuit voltage (pre-load);
- : The voltage during load application;
- : Load current.
This method is widely used due to its simplicity and experimental applicability and is strongly associated with internal degradation processes such as SEI layer growth and lithium plating [32].
2.2.3. SoH Degradation Modeling
To project SoH evolution over time, two common models were applied:
- Linear Model:
- Exponential Model:
where
- : The initial SoH (typically 100%);
- n: The number of cycles;
- k: The linear degradation rate [%/cycle];
- : Exponential degradation constant [1/cycle]
These models are frequently used for battery lifespan prediction. While the linear model suits short-term degradation analysis, the exponential model better captures long-term cumulative effects [33].
3. Equipment and Manufacturing
To enable automated, low-cost battery testing, a modular and customizable platform was designed and implemented. The system is centered around an ESP32 microcontroller and supports programmable charge–discharge protocols, high-resolution data acquisition, and cloud-based monitoring.
3.1. System Architecture and Key Components
The core of the system consists of an ESP32 WROOM-32 module, which manages the entire testing process, including switching between charging and discharging states, reading sensor data, and logging results to the cloud. The battery pack comprises three ITR18650-2600P lithium-ion cells connected in a 3S configuration, which is protected and balanced by a standard 3S battery management system (BMS) [34].
Voltage is measured using an FZ0430 sensor (manufactured by Phoncoo Electronics in Shenzhen, China), while current and power are monitored through an INA219 sensor (manufactured by Texas Instruments in Dallas, TX, USA) [35,36]. Temperature is recorded via a GY-906 infrared sensor (manufactured by Melexis, Ypres, Belgium). An ADS1115 (manufactured by Texas Instruments in Dallas, TX, USA) analog-to-digital converter (ADC) ensures high-resolution data acquisition. Real-time system parameters are displayed on a 1.3-inch OLED screen.
Figure 2 presents the system architecture as a block diagram, showing the interactions between the power input, regulation modules (LM2577 and LM2596), sensors, relays, and the ESP32 controller.
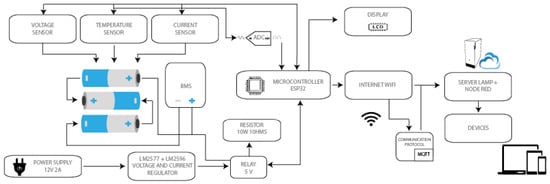
Figure 2.
Block diagram of the battery charge–discharge system.
3.2. Charge–Discharge Logic and Automation
The ESP32 controller was programmed to manage four operating states: charging, fully charged, discharging, and fully discharged. These states are determined in real time based on voltage and current thresholds.
In the static charging mode, a constant voltage of 12.6 V is supplied via an LM2577S regulator, delivering 1.2 A. In the dynamic charging mode, the system begins at 400 mA and increases to 800 mA once the pack voltage reaches 11.5 V.
Charging and discharging are controlled by 5V SPDT relays, with discharging performed through a 10 , 10 W power resistor. All system data is recorded every three minutes and transmitted wirelessly via MQTT to a MySQL database hosted on a LAMP server. Remote monitoring and data visualization are achieved through a Node-RED dashboard.
The battery testing system is built from a set of low-cost components arranged to enable automated cycling of a 3S lithium-ion battery pack. As shown in Figure 3, the internal layout connects all components in a compact and efficient configuration. The system is controlled by an ESP32 WROOM-32 microcontroller, which executes the charge–discharge logic by interpreting data from multiple sensors. A BMS-3S module protects and balances the three ITR18650-2600P cells, while voltage and current measurements are obtained using an FZ0430 voltage sensor and an INA219 current sensor, respectively. To enhance measurement precision, analog signals are digitized using an ADS1115 analog-to-digital converter. The battery surface temperature is monitored via a GY-906 infrared sensor. Charging is performed through an LM2577S boost converter, while discharging is routed through a 10 , 10 W power resistor using a 5V SPDT relay. A 1.3” I2C OLED display provides local feedback of system status. All data, including voltage, current, and temperature, is recorded every three minutes by the ESP32. A complete list of components used is provided in Table 2.
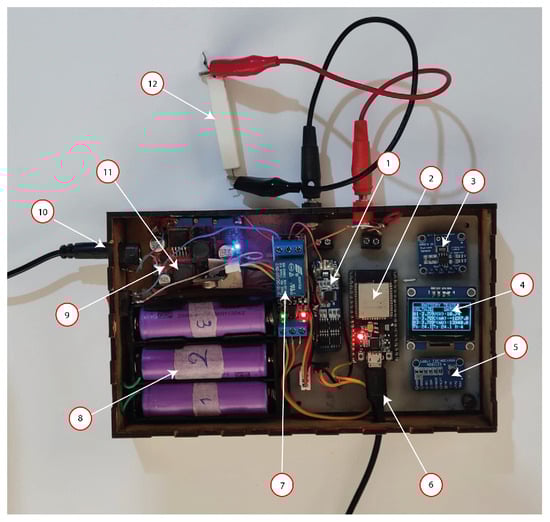
Figure 3.
Internal layout of the battery test system.
3.3. Cost Breakdown and Component Selection
The bill of materials (BOM) for the system is provided in Table 2, listing all components, models, and approximate costs in USD. The system was designed to be cost-effective without compromising accuracy or functionality.
Table 2.
Bill of materials for the battery testing system.
Table 2.
Bill of materials for the battery testing system.
| # in Figure 3 | Component | Model / Description | Cost (USD) |
|---|---|---|---|
| 1 | Battery Management System | BMS-3S | $4.50 |
| 2 | Microcontroller | ESP32 WROOM-32 | $12.00 |
| 3 | Current Sensor | INA219 | $7.50 |
| 4 | Display | OLED I2C 1.3” | $10.00 |
| 5 | Analog-to-Digital Converter (ADC) | ADS1115 | $6.00 |
| 7 | Relay | 5V SPDT Relay | $3.00 |
| 8 | Lithium Batteries | ITR18650-2600P | $7.50 |
| 9 | Voltage Regulator | LM2577S Boost Module | $10.00 |
| 10 | Power Supply | 12V DC (2A) | $5.00 |
| 11 | Temperature Sensor | GY-906 IR Sensor | $12.00 |
| 12 | Power Resistor | 10W, 10 | $0.75 |
| Voltage Sensor | FZ0430 | $2.50 |
3.4. Comparison with Commercial Testing Systems
Although the developed platform is not intended to replace industrial-grade cyclers, it offers an effective and low-cost alternative for small-scale research applications. Table 3 presents a comparative overview of the capabilities and costs of the custom-built system versus widely used commercial solutions from Arbin, Neware, and Chroma.
Table 3.
Cost and performance comparison of battery testing systems.
Such cost-effective setups democratize battery research, enabling more frequent and widespread studies without significant financial barriers, thus promoting broader academic and applied investigations.
3.5. Data Acquisition and Monitoring
A key feature of the developed system is its capability for real-time data acquisition and remote monitoring. All sensor data, including voltage, current, power, and temperature, was collected using an ESP32 microcontroller via I2C communication protocols. High-resolution analog signals were digitized by the ADS1115 analog-to-digital converter, ensuring stable and precise readings throughout each cycle.
The following parameters were continuously monitored:
- Individual cell voltages: V1, V2, and V3;
- Total pack voltage: Vbus;
- Charge/discharge current;
- Power output;
- Battery surface and ambient temperatures;
- Cycle duration and system state.
Each data point was automatically timestamped and tagged with a unique cycle identifier, enabling the structured chronological analysis of degradation patterns.
Measurements were recorded every three minutes. This sampling frequency was selected to balance resolution and storage efficiency, providing sufficient detail to track gradual changes in the state of health (SoH) without exceeding the storage capacity of the system.
All acquired data was transmitted wirelessly from the ESP32 to a MySQL database hosted on a LAMP server using the MQTT protocol. This cloud-based architecture supported remote access, redundancy, and real-time data visualization through an integrated Node-RED dashboard. Additionally, a built-in OLED display provided local feedback on key parameters, allowing for immediate on-site verification during testing procedures.
4. Results
This section presents the results obtained from 200 complete charge–discharge cycles of a lithium-ion battery pack under two distinct charging strategies: static and dynamic. Each configuration is evaluated in terms of voltage evolution, discharge duration, and key degradation indicators to provide insight into the aging behavior of the cells. The impact of constant versus adaptive charging currents is analyzed to determine their influence on capacity retention and terminal voltages.
4.1. Voltage Evolution During Static Charging at 1.2 A
This subsection examines voltage behavior over 200 cycles under a constant current charging profile of 1.2 A, highlighting trends associated with electrochemical degradation.
Figure 4 shows the voltage–time evolution during static charging. The initial voltage at the start of each charge cycle gradually declines, dropping from 11.40 V in cycle 1 to 11.15 V in cycle 200, a reduction of 2.19%. This decline is attributed to increasing internal resistance and early signs of capacity fade. Notably, the decline becomes more pronounced after cycle 80, indicating the onset of accelerated aging.
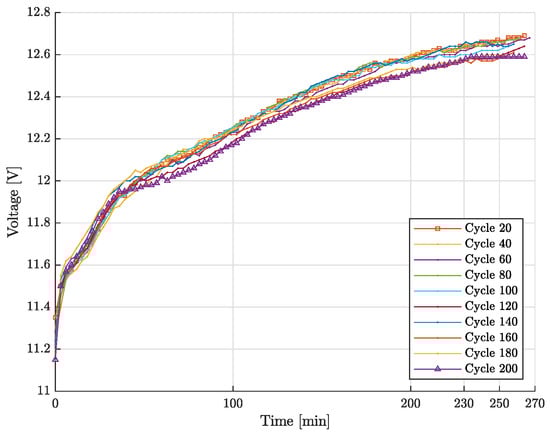
Figure 4.
Static charging voltage evolution (200 cycles, 1.2 A constant current).
In contrast, the final charging voltage remains relatively stable across cycles, decreasing slightly from 12.67 V to 12.59 V (a 0.63% drop). This consistency suggests that the battery management system (BMS) effectively regulates the charge process, maintaining terminal voltages within a safe and functional range.
4.2. Discharge Behavior After Static Charging at 1.2 A
This subsection analyzes the battery’s discharge characteristics at a constant current of 1.2 A following static charging, focusing on voltage trends and discharge duration.
As shown in Figure 5, the initial discharge voltage shows a slight increase from 11.07 V in cycle 1 to 11.15 V in cycle 200, an increase of approximately 0.72%. This could indicate improved electrode stabilization over repeated cycles; however, it has minimal impact on actual energy delivery.
Figure 5.
Static discharging voltage evolution (200 cycles, 1.2 A constant current).
In contrast, the final discharge voltage decreases gradually throughout the test. By cycle 180, terminal voltages fall below 8.90 V, reaching 8.81 V in cycle 200. These values remain within the safety limits defined by the BMS but suggest a declining energy reserve.
The most significant degradation indicator is the reduction in discharge time, which drops from 144 min in cycle 1 to 135 min in cycle 200. This 6.25% reduction in usable capacity confirms the progressive decline in electrochemical performance under static charging conditions.
4.3. Voltage Evolution During Dynamic Charging at 400 mA/800 mA
This subsection evaluates battery performance under a dynamic charging strategy, beginning at 400 mA and transitioning to 800 mA once a voltage threshold of 11.5 V is reached. This adaptive approach is intended to minimize stress at a low state of charge (SoC) while maintaining efficiency as the battery approaches a full charge.
As shown in Figure 6, the initial charging voltage decreases from 10.55 V in cycle 1 to 10.29 V in cycle 200, a reduction of 2.46%. This decline indicates rising internal resistance and mild electrochemical degradation, even under a moderated current strategy.
Figure 6.
Charge performance during dynamic charging (cycle 1 vs. cycle 200 at 400 mA/800 mA).
The final charging voltage also decreases slightly, from 12.45 V to 12.30 V (a 1.20% reduction), suggesting a gradual loss in the battery’s ability to reach its maximum voltage. This may reflect mild cell imbalance or cumulative impedance buildup.
4.4. Discharge Performance After Dynamic Charging at 900 mA
This subsection analyzes discharge behavior following dynamic charging, with discharge performed at a constant current of 900 mA.
As shown in Figure 7, the initial discharge voltage increases from 10.90 V in cycle 1 to 11.25 V in cycle 200, an increase of 3.21%. This may reflect surface charge accumulation during the adaptive charge process, although it does not translate into improved load performance. The final discharge voltage shows a slight decline, decreasing from 9.11 V to 8.92 V (a 2.08% drop). However, the most notable degradation marker is the reduction in discharge duration: from 195 min in cycle 1 to 159 min in cycle 200. This 18.46% decrease in runtime indicates accelerated capacity loss and aging under dynamic charging conditions.
Figure 7.
Discharge performance after dynamic charging (cycle 1 vs. cycle 200 at 900 mA).
4.5. Temperature Influence on Static and Dynamic Discharging
The temperature and current profiles for cycles 1 and 200 under static and dynamic discharging conditions are shown in Figure 8. In the static discharging profiles (Figure 8a,b), both temperature and current increase steadily over time. The temperature rise is more pronounced at cycle 200 compared to cycle 1, indicating potential cumulative heating effects or increased internal resistance as the battery ages.
Figure 8.
This figure shows the evolution of temperature and current over time for cycles 1 and 200 under static and dynamic discharge conditions. (a) Static discharging (cycle 1). (b) Static discharging (cycle 200). (c) Dynamic discharging (cycle 1). (d) Dynamic discharging (cycle 200).
In contrast, the dynamic discharging profiles (Figure 8c,d) exhibit stepwise changes in both current and temperature. These steps correspond to the imposed dynamic load profile, where current varies in discrete increments, causing corresponding changes in temperature. Notably, the maximum temperatures reached during dynamic discharging are lower than those observed during static discharging at equivalent cycles, suggesting that dynamic profiles may reduce peak thermal stress on the cell.
Comparing cycle 1 and cycle 200 in both static and dynamic conditions shows that, in terms of cycling, the temperature response tends to increase slightly, especially during static discharging. This behavior points to the accumulation of degradation mechanisms, such as increased impedance, leading to higher heat generation under the same electrical load. These observations emphasize the importance of managing thermal behavior during battery cycling, especially in static conditions, which may pose a higher risk of overheating as the battery ages.
During static discharging, the battery’s internal resistance remains relatively stable in early cycles, helping to limit heat generation and maintain thermal stability compared to dynamic discharging. However, as the battery ages, a moderate increase in internal resistance is observed, contributing to gradually higher heat output during discharge. This condition may favor degradation pathways such as SEI layer growth and electrode damage, ultimately affecting battery capacity and efficiency—although to a lesser extent than under dynamic discharging conditions.
In contrast, dynamic discharging induces abrupt variations in current and temperature, which are driven by the stepwise load profile. These fluctuations lead to thermal peaks and a more rapid increase in internal resistance, resulting in greater heat generation per cycle. This accelerated thermal and electrochemical stress promotes faster aging, including SEI layer thickening and structural damage within the cell.
While dynamic charging can help reduce average peak temperatures in some cycles and conditions, the repeated thermal and current transients contribute to a faster degradation process, ultimately shortening battery lifespan relative to static discharging.
Relation to SoH: In static discharging, internal resistance shows a clear positive correlation with state of health (SoH) loss. Higher internal resistance indicates greater electrochemical degradation, which aligns with a progressive SoH decline across cycles. The data confirm that the rise in resistance corresponds with the drop in SoH, reinforcing the role of internal resistance as a reliable aging indicator. Conversely, in dynamic discharging, internal resistance tends to increase more rapidly with cycling, correlating with a steeper decline in SoH. The variability in current and frequent thermal spikes accelerate degradation mechanisms such as SEI layer expansion and structural deterioration, resulting in more pronounced resistance growth and a faster reduction in SoH.
5. Discussion
This section analyzes the degradation patterns observed in lithium-ion batteries subjected to two different charging strategies: static and dynamic. The analysis focuses on voltage behavior, discharge duration, and trends in internal resistance. The goal is to interpret the experimental results (Section 4, Section 5, Section 6 and Section 7), contextualize the underlying aging mechanisms, and assess the performance implications of each strategy for real-world electric vehicle energy systems.
5.1. Comparison of Static vs. Dynamic Charging Profiles
This subsection compares the performance of cells charged with a constant current of 1.2 A (static) versus those charged dynamically, first at 400 mA and then at 800 mA. The analysis emphasizes voltage retention and degradation effects associated with each approach.
When comparing the dynamic charging profile (400 mA→800 mA) to static charging at 1.2 A, several notable differences arise. Both strategies exhibit a similar reduction in initial voltage, 2.19% for static (Figure 4) and 2.46% for dynamic (Figure 6), but dynamic charging consistently begins from a lower baseline (10.55 V vs. 11.40 V). This may be attributed to the lower initial current in the dynamic profile, which delays surface state of charge (SOC) buildup compared to the static approach.
Regarding the final voltage, the static profile shows better retention, with only a 0.63% drop compared to 1.20% in the dynamic strategy. This suggests that constant current charging may offer more stable electrochemical conditions or help prevent microtransients caused by current switching.
Nevertheless, dynamic charging could provide thermal and mechanical advantages during early cycles. The initial low current may reduce risks such as lithium plating or electrolyte decomposition. However, current transitions could introduce inefficiencies that, over time, contribute to accelerated aging.
5.2. Impact of Charging Strategy on Internal Resistance and Discharge Performance
The findings indicate that static charging might be preferable for vehicles with predictable usage patterns, ensuring stable battery health, while dynamic charging may suit vehicles requiring rapid, intermittent charges, albeit at the expense of quicker battery aging. This subsection compares the degradation behavior of cells subjected to static charging followed by a 1.2 A discharge versus dynamic charging followed by a 900 mA discharge. The discussion covers the evolution of discharge time and internal resistance over 200 cycles to assess how the charging strategy influences aging and energy delivery efficiency.
5.2.1. Static Charging with 1.2 A Discharge
Data from static discharge cycles (Figure 5) indicate a slight increase in initial voltage over time, from 11.07 V to 11.15 V, possibly due to surface charge buildup or minor variations in post-charge stabilization. More critically, the discharge time decreased by 6.25%, from 144 min in cycle 1 to 135 min in cycle 200, suggesting capacity loss despite stable terminal voltage.
As shown in Figure 9, internal resistance rose from 594.4 m to 650.0 m across the test, a 9.34% rise. The resistance remained relatively constant until cycle 120, after which it rose more sharply, consistent with aging mechanisms such as SEI layer thickening and structural degradation of electrode materials.
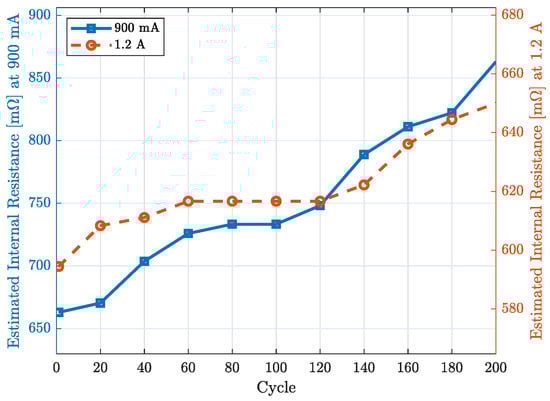
Figure 9.
Estimated internal resistance vs. cycle count at 900 mA and 1.2 A.
Internal resistance () was calculated using the voltage drop method (Equation (2)), based on the difference between open-circuit voltage () and load voltage (), which was normalized according to the discharge current. As resistance grows, the voltage drop under load increases, leading to earlier cutoff voltage and shorter discharge duration, even when usable charge remains. These losses may also generate additional heat, especially under higher-current conditions.
5.2.2. Dynamic Charging with 900 mA Discharge
In dynamically charged cells, the discharge duration declined more significantly, from 195 min in cycle 1 to 159 min in cycle 200, marking an 18.46% reduction (Figure 7). Although initial voltage slightly increased (from 10.90 V to 11.25 V), this did not translate into improved runtime, indicating internal degradation.
This behavior may stem from faster aging processes such as SEI layer growth, lithium plating during high-rate phases, and an uneven current distribution, which hinder ion transport and limit battery capacity.
Internal resistance data (Figure 9) supports this: Resistance increased from 662.96 m to 862.96 m over 200 cycles, a 30.17% rise. This rise directly correlates with the observed loss in discharge time, reinforcing the connection between increased impedance and aging.
Both capacity fade and resistance growth accelerate after cycle 120, suggesting a nonlinear degradation trend. As resistance increases, voltage losses during operation become more pronounced, narrowing the effective discharge window and causing the early termination of energy delivery, even when residual charge remains.
5.3. Modeling Battery Degradation Behavior
The degradation trend of lithium-ion cells subjected to a 1.2 A constant current discharge exhibits a linear pattern over the 200 test cycles. As shown in Figure 10, the state of health (SoH) initiates in 100%, and then progressively declines to 96.53%. This behavior suggests that early-stage rejuvenation phenomena can temporarily obscure the onset of degradation before sustained electrochemical aging becomes dominant.
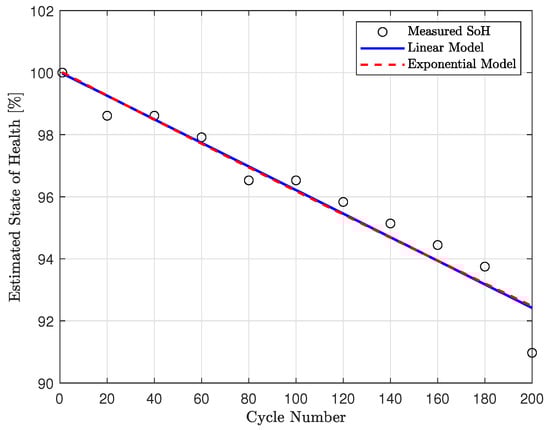
Figure 10.
Comparison of experimental and modeled SoH degradation across 200 discharge cycles at 1.2 A.
To quantitatively describe this trend, two mathematical models, which are outlined in Equations (3) and (4), were applied. The linear model assumes a constant rate of capacity loss, while the exponential model accounts for the acceleration typically observed in lithium-ion degradation. Both models were fitted to the experimental data using least squares regression.
The results indicate that the linear model provides a slightly better overall fit, as evidenced by its higher R2 and lower RMSE compared to the exponential model, as shown in Table 4. This reinforces the importance of selecting an appropriate modeling strategy based on the specific stage of the battery’s life. Furthermore, the observed SoH trajectory is consistent with other degradation indicators, namely reduced discharge time and increased internal resistance (see Equation (2)), validating the reliability of the experimental platform and emphasizing the need for robust battery life prediction tools.
Table 4.
R2 and RMSE for experimental and modeled SoH degradation across 200 discharge cycles at 1.2 A.
In contrast, under the 900 mA dynamic charging and discharging regime, the cell exhibits a more pronounced and progressive decline in health. As illustrated in Figure 11, the initial estimated SoH starts at 100% and decreases to 81.53% by the 200th cycle. This more substantial degradation highlights the cumulative impact of variable current input, which can induce non-uniform mechanical and thermal stresses, as well as accelerate microstructural fatigue within the electrodes.
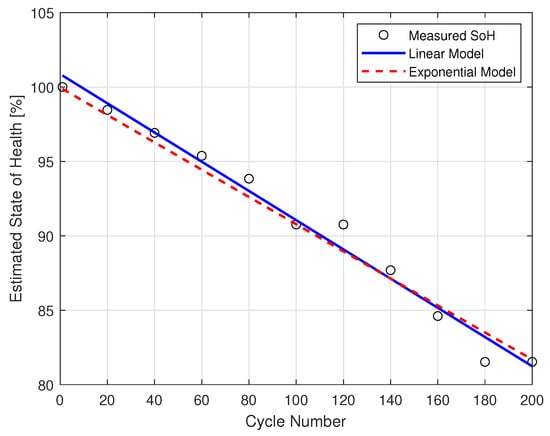
Figure 11.
Comparison of experimental and modeled SoH degradation across 200 discharge cycles at 900 mA.
To model this behavior, the same linear and exponential approaches (Equations (3) and (4)) were employed. While the linear model offers a reasonable approximation of average degradation rates, it fails to capture the accelerating capacity loss observed in the latter stages of testing. The exponential model, at first, aligns closely with the experimental data, but after cycle 100 it begins to diverge, underestimating the severity of degradation.
In this scenario, the results also indicate that the linear model provides a slightly better overall fit, as evidenced by its higher R2 and lower RMSE compared to the exponential model, as shown in Table 5.
Table 5.
R2 and RMSE for experimental and modeled SoH degradation across 200 discharge cycles at 900 mA.
The persistent divergence between both models underscores the complex dynamics of lithium-ion battery degradation under dynamic conditions. These findings are further substantiated by parallel increases in internal resistance and voltage decline, reinforcing the predictive value of the exponential model and confirming the robustness of the experimental setup.
While effective, the low-cost setup has limitations including potentially lower precision and less robust thermal management compared to industrial-grade systems. These factors should be considered when interpreting results for critical applications.
Ultimately, these results highlight the need for adaptive battery management systems (BMSs) capable of dynamically responding to evolving degradation patterns. Such systems could play a key role in extending battery lifespan and maintaining performance across a wide range of operating conditions.
6. Conclusions
This study evaluated the aging behavior of lithium-ion cells over 200 charge–discharge cycles using two distinct charging strategies: static charging at a constant 1.2 A and dynamic charging with a stepped profile (400 mA→800 mA). The results clearly indicate progressive degradation manifested in reduced discharge duration, increasing internal resistance, and voltage decline. The main findings are summarized below:
- 1.
- Static charging outperformed dynamic charging in voltage retention and resistance control.The static profile exhibited a smaller voltage drop over 200 cycles (12.67 V→12.59 V; 0.63%) compared to the dynamic profile (12.45 V→12.30 V; 1.20%). Internal resistance increased by only 9.3% under static conditions, while dynamically charged cells experienced a much steeper 30.17% rise, reflecting faster electrochemical aging.
- 2.
- Capacity fade was significantly greater under dynamic charging.The discharge time decreased from 144 to 135 min (–6.25%) for statically charged cells, but it dropped more sharply from 195 to 159 min (–18.%) under the dynamic strategy. This highlights the impact of alternating current levels, which likely accelerate SEI formation and introduce current-induced stress.
- 3.
- Internal resistance is a reliable indicator of degradation.Resistance growth correlated closely with reduced runtime and earlier voltage cutoffs in both cases. For example, in dynamic discharge at 900 mA, resistance increased from 662.9 m to 862.9 m, consistent with degradation phenomena such as lithium plating, increased impedance, and the loss of active material.
- 4.
- The initial voltage rise is not indicative of improved performance.Despite slight increases in initial voltage over time (e.g., 10.90 V→11.25 V in the dynamic case), discharge performance deteriorated. This reinforces that surface voltage alone does not reliably reflect retained capacity or health status.
- 5.
- Charging profile selection must balance application-specific trade-offs.Static charging offers superior long-term stability and voltage consistency, making it preferable for applications that prioritize energy availability and predictable performance. While dynamic charging may reduce thermal stress in early cycles, it risks accelerating degradation without careful control. Smart battery management systems should dynamically adapt current profiles to optimize performance and minimize wear.
- 6.
- The low-cost testing platform enabled reliable long-term monitoring.A major contribution of this work is the development of a modular, ESP32-based automated testing system. It provided consistent and accurate real-time logging of key parameters (voltage, current, and temperature) and allowed the safe implementation of both charging profiles. Cloud-based data acquisition supported the comprehensive post-analysis, making this platform a scalable and effective solution for academic and applied battery research.
- 7.
- Degradation modeling confirms the nonlinear SoH decline and supports predictive diagnostics.SoH trends under both charging strategies were successfully modeled using linear and exponential approaches. The exponential model (Equation (4)) showed a consistently better fit, particularly beyond cycle 120, where aging effects intensified. This supports the need for adaptive and predictive battery health monitoring tools that align with the real-world aging behavior of lithium-ion cells.
Final remark: This study reinforces the importance of integrating degradation-aware charging strategies and predictive diagnostics based on internal resistance trends. For applications such as electric vehicles—where battery longevity, reliability, and safety are essential—optimizing charge profiles to balance energy efficiency and lifecycle performance is critical for future energy storage system design.
Future studies should also focus on extending this methodology to higher-capacity cells and diverse form factors representative of current EV battery packs. Additionally, incorporating variable ambient and internal temperature profiles will be essential to validate these findings under conditions that closely replicate real-world electric vehicle operation.
Limitations of the Study
Despite the robustness of the experimental setup, several limitations should be acknowledged. First, this study was restricted to a specific lithium-ion cell type (ITR 18650-2600P) and a 3S configuration, which may limit the generalization of the results to other chemistries or formats. Second, all tests were conducted at a constant ambient temperature (22 °C), without assessing thermal variations or environmental stressors. Third, the discharge protocol involved fixed current rates, which do not fully replicate real-world dynamic load conditions. Additionally, internal resistance was estimated using the voltage drop method, which, while effective for trend analysis, lacks the resolution provided by more advanced techniques such as electrochemical impedance spectroscopy (EIS). Future studies could integrate higher-resolution electrochemical methods, such as electrochemical impedance spectroscopy (EIS), to validate internal resistance findings, alongside broader environmental and cell-type evaluations. Lastly, the estimation of the state of health (SoH) was based on indirect indicators such as runtime and resistance, without direct integration of capacity measurements. These limitations suggest avenues for future research to enhance the precision and applicability of the findings.
7. Limitations and Future Work
While this study provides valuable insights into the degradation behavior of lithium-ion cells subjected to static and dynamic charging strategies, several important limitations should be acknowledged regarding the scalability and applicability of the findings.
First, the experiments were conducted using ITR 18650 cylindrical cells with a nominal capacity of 2600 mAh. In contrast, contemporary electric vehicles typically employ cells with much higher capacities, such as Tesla’s 4680 cylindrical cells (26.5 Ah) [40] or BYD’s Blade prismatic cells (138–202 Ah) [41]. Scaling up cell capacity significantly affects heat generation, internal resistance growth, current distribution, and the overall dynamics of degradation mechanisms like lithium plating and electrolyte decomposition. Larger cells also exhibit different thermal mass and heat dissipation characteristics, which can influence the rate and uniformity of aging. While the relative performance trends observed here—such as the higher resistance growth and capacity fade under dynamic charging—are likely to be qualitatively similar in larger cells, the absolute degradation rates and thermal responses may differ considerably. Future work will incorporate higher-capacity automotive-grade cells and a range of form factors to validate the scalability of these results and to refine predictive degradation models that can inform practical battery management strategies.
Second, the testing environment maintained a constant ambient temperature of approximately 22 °C. Temperature is a well-established factor in lithium-ion battery degradation, influencing internal resistance, reaction kinetics, SEI layer growth, and safety performance. In real-world EV applications, cells are exposed to a wide range of thermal conditions due to variations in climate, operating load, and vehicle cooling systems. Elevated temperatures can accelerate aging processes, while low temperatures can increase impedance and promote lithium plating during charging. The absence of temperature variation in this study limits the direct applicability of the results to real-world operational scenarios. Consequently, future investigations will incorporate controlled thermal cycling and dynamic temperature profiles to assess the combined effects of charging protocols and environmental conditions on battery aging.
In addition, expanding the scope of the research to include diverse cell chemistries, configurations (e.g., pouch and prismatic formats), and higher C-rate charging/discharging regimes will provide a more comprehensive understanding of degradation dynamics. Such work will contribute to developing adaptive battery management systems capable of optimizing performance and longevity across a variety of use cases and operating conditions.
Author Contributions
Conceptualization, D.S.P.-B., J.d.D.C.-N. and L.S.-P.; methodology, B.P.A.-R., J.d.D.C.-N. and I.F.S.-L.; software, D.S.P.-B. and I.F.S.-L.; validation, D.S.P.-B., B.P.A.-R. and I.F.S.-L.; formal analysis, D.S.P.-B. and L.S.-P.; investigation, B.P.A.-R., J.d.D.C.-N. and B.A.C.-A.; resources, D.S.P.-B. and E.A.L.-C.; data curation, D.S.P.-B. and I.F.S.-L.; writing—original draft preparation, D.S.P.-B., J.d.D.C.-N. and B.A.C.-A.; writing—review and editing, D.S.P.-B., L.S.-P. and E.A.L.-C.; visualization, D.S.P.-B. and L.S.-P.; supervision, D.S.P.-B. and E.A.L.-C.; project administration, D.S.P.-B. and E.A.L.-C. All authors have read and agreed to the published version of the manuscript.
Funding
This research received no external funding.
Data Availability Statement
All data supporting the reported results are fully included within this article.
Conflicts of Interest
The authors declare no conflicts of interest.
Abbreviations
The following abbreviations are used in this manuscript:
| ADC | Analog-to-Digital Converter |
| BMS | Battery Management System |
| CV | Constant Voltage |
| EV | Electric Vehicle |
| EIS | Electrochemical Impedance Spectroscopy |
| ESP32 | Espressif Systems 32-bit Microcontroller |
| FS | Full Scale |
| IR | Internal Resistance |
| LIB | Lithium-Ion Battery |
| LAMP | Linux-Apache-MySQL-PHP (web server stack) |
| mAh | Milliampere-hour |
| MQTT | Message Queuing Telemetry Transport |
| OCV | Open Circuit Voltage |
| OLED | Organic Light-Emitting Diode |
| RUL | Remaining Useful Life |
| SEI | Solid Electrolyte Interphase |
| SOC | State of Charge |
| SOH | State of Health |
| USB | Universal Serial Bus |
| V2G | Vehicle-to-Grid |
References
- Wang, Y.; Tian, J.; Sun, Z.; Wang, L.; Xu, R.; Li, M.; Chen, Z. A comprehensive review of battery modeling and state estimation approaches for advanced battery management systems. Renew. Sustain. Energy Rev. 2020, 131, 110015. [Google Scholar] [CrossRef]
- Lipu, M.S.; Miah, M.S.; Jamal, T.; Rahman, T.; Ansari, S.; Rahman, M.S.; Ashique, R.H.; Shihavuddin, A.S.; Shakib, M.N. Artificial Intelligence Approaches for Advanced Battery Management System in Electric Vehicle Applications: A Statistical Analysis towards Future Research Opportunities. Vehicles 2024, 6, 22–70. [Google Scholar] [CrossRef]
- Niu, H.; Zhang, N.; Lu, Y.; Zhang, Z.; Li, M.; Liu, J.; Song, W.; Zhao, Y.; Miao, Z. Strategies toward the development of high-energy-density lithium batteries. J. Energy Storage 2024, 88, 111666. [Google Scholar] [CrossRef]
- Khan, F.M.U.; Rasul, M.G.; Sayem, A.S.; Mandal, N. Maximizing energy density of lithium-ion batteries for electric vehicles: A critical review. Energy Rep. 2023, 9, 11–21. [Google Scholar] [CrossRef]
- IEA. Trends in Electric Vehicle Batteries—Global EV Outlook 2024—Analysis; IEA: Paris, France, 2024. [Google Scholar]
- Jaramillo, F.X.R.; Benavides, D.S.P.; Reyes, J.I. Powertrain Sizing and Methodology Development for a Neighborhood Electric Vehicle for a Paraplegic and Elderly Person. In Proceedings of the 2023 International Symposium on Electromobility (ISEM), Nuevo Leon, Mexico, 26–28 October 2023; pp. 1–8. [Google Scholar] [CrossRef]
- Tapia, P.; Tramacere, E.; Puma-Benavides, D.S.; Galluzzi, R.; Zambrano-Leon, V.D.; Jima-Matailo, J.C.; Llanes-Cedeño, E.A. Comparative Analysis of MacPherson and Double Wishbone Suspensions for an Electric Off-Road Vehicle Retrofit. World Electr. Veh. J. 2025, 16, 228. [Google Scholar] [CrossRef]
- Amer, M.M.; Shouman, M.A.; Salem, M.S.; Kannan, A.M.; Hamed, A.M. Advances in thermal management systems for Li-Ion batteries: A review. Therm. Sci. Eng. Prog. 2024, 53, 102714. [Google Scholar] [CrossRef]
- Barcellona, S.; Piegari, L. Effect of current on cycle aging of lithium ion batteries. J. Energy Storage 2020, 29, 101310. [Google Scholar] [CrossRef]
- Gao, Y.; Jiang, J.; Zhang, C.; Zhang, W.; Ma, Z.; Jiang, Y. Lithium-ion battery aging mechanisms and life model under different charging stresses. J. Power Sources 2017, 356, 103–114. [Google Scholar] [CrossRef]
- Valverde, A.; Quintero, V.; Jaramillo, F.; Perez, A.; Orchard, M. Understanding the Effect on the State of Health of a Lithium-ion Battery Caused by Charging at a High Current Rate. IFAC-PapersOnLine 2023, 56, 11930–11935. [Google Scholar] [CrossRef]
- Clerici, D.; Martelli, S.; Mocera, F.; Somà, A. Mechanical characterization of lithium-ion batteries with different chemistries and formats. J. Energy Storage 2024, 84, 110899. [Google Scholar] [CrossRef]
- Guo, J.; Li, Y.; Pedersen, K.; Stroe, D.I. Lithium-ion battery operation, degradation, and aging mechanism in electric vehicles: An overview. Energies 2021, 14, 5220. [Google Scholar] [CrossRef]
- Guo, J.; Yang, J.; Cao, W.; Serrano, C. Evaluation of EV battery degradation under different charging strategies and V2G schemes. IET Conf. Public 2019, 2019, 1–7. [Google Scholar] [CrossRef]
- Deng, Z.; Hu, X.; Xie, Y.; Xu, L.; Li, P.; Lin, X.; Bian, X. Battery health evaluation using a short random segment of constant current charging. iScience 2022, 25, 104260. [Google Scholar] [CrossRef] [PubMed]
- Chen, J.; Chen, D.; Han, X.; Li, Z.; Zhang, W.; Lai, C.S. State-of-Health Estimation of Lithium-Ion Battery Based on Constant Voltage Charging Duration. Batteries 2023, 9, 565. [Google Scholar] [CrossRef]
- Belmajdoub, N.; Lajouad, R.; El Magri, A.; Boudoudouh, S. State of charge and state of health estimation of a lithium-ion battery for electric vehicles: A review. IFAC-PapersOnLine 2024, 58, 460–465. [Google Scholar] [CrossRef]
- Zhang, S.; Puig, V.; Ifqir, S. Set-based Estimation of Battery End of Discharge for Electric Vehicles. IFAC-PapersOnLine 2024, 58, 132–137. [Google Scholar] [CrossRef]
- Xiong, W.; Xu, G.; Li, Y.; Zhang, F.; Ye, P.; Li, B. Early prediction of lithium-ion battery cycle life based on voltage-capacity discharge curves. J. Energy Storage 2023, 62, 106790. [Google Scholar] [CrossRef]
- Ecker, M.; Nieto, N.; Käbitz, S.; Schmalstieg, J.; Blanke, H.; Warnecke, A.; Sauer, D.U. Calendar and cycle life study of Li(NiMnCo)O2-based 18650 lithium-ion batteries. J. Power Sources 2014, 248, 839–851. [Google Scholar] [CrossRef]
- Chen, H.; Liu, Y.; Qu, Z.; Yang, K.; Zhang, M.; Hui, D.; Zhang, Q.; Du, G.; Su, J. Experimental research on thermal runaway characterization and mechanism induced by the shell insulation failure for LiFePO4 Lithium-ion battery. J. Energy Storage 2024, 84, 110735. [Google Scholar] [CrossRef]
- Sagaria, S.; van der Kam, M.; Boström, T. Vehicle-to-grid impact on battery degradation and estimation of V2G economic compensation. Appl. Energy 2025, 377, 124546. [Google Scholar] [CrossRef]
- Lindgren, J.; Lund, P.D. Effect of extreme temperatures on battery charging and performance of electric vehicles. J. Power Sources 2016, 328, 37–45. [Google Scholar] [CrossRef]
- Fernando, A.; Kuipers, M.; Angenendt, G.; Kairies, K.P.; Dubarry, M. Voltage relaxation characterization methods in lithium-ion batteries. Meas. Energy 2024, 3, 100013. [Google Scholar] [CrossRef]
- Panasonic NCR18650B 3400 mAh 18650 Li-ion Battery Cell, 2025. Available online: https://www.orbtronic.com/batteries-chargers/panasonic-3400mah-18650-li-ion-battery-cell-ncr18650b (accessed on 18 April 2025).
- 18650 Battery Store. Panasonic NCR18650GA 3450mAh 10A Battery. 2025. Available online: https://www.18650batterystore.com/products/panasonic-ncr18650ga-ga6 (accessed on 18 April 2025).
- LG Chem. INR18650 MJ1 3500mAh Lithium-ion Rechargeable Cell Specification; LG Chem: Seoul, Republic of Korea, 2016; Available online: https://power.tenergy.com/content/datasheet/30708_datasheet.pdf (accessed on 18 April 2025).
- Sony Energy Devices Corporation. US18650VTC6 Lithium-ion Rechargeable Battery Technical Information; Sony Energy Devices Corporation. Available online: https://www.alldatasheet.com/datasheet-pdf/download/1643878/SONY/US18650VTC6.html (accessed on 18 April 2025).
- Samsung SDI Co., Ltd. INR21700-50E Lithium-ion Rechargeable Cell Specification; Samsung SDI Co., Ltd.: Seoul, Republic of Korea, 2017; Available online: https://batteryservice.bg/wp-content/uploads/2018/12/INR21700-50E.pdf (accessed on 18 April 2025).
- Samsung SDI Co., Ltd. Specification of Product for Lithium-ion Rechargeable Cell Model ICR18650-26J (Version 3); Samsung SDI Co., Ltd.: Seoul, Republic of Korea, 2020; Available online: https://www.tme.eu/Document/e4bea4d25cc8f7b90147bc416cf6083d/ICR18650-26J3.pdf (accessed on 18 April 2025).
- won You, G.; Park, S.; Oh, D. Real-time state-of-health estimation for electric vehicle batteries: A data-driven approach. Appl. Energy 2016, 176, 92–103. [Google Scholar] [CrossRef]
- Schuster, S.F.; Bach, T.; Fleder, E.; Müller, J.; Brand, M.; Sextl, G.; Jossen, A. Nonlinear aging characteristics of lithium-ion cells under different operational conditions. J. Energy Storage 2015, 1, 44–53. [Google Scholar] [CrossRef]
- Waag, W.; Käbitz, S.; Sauer, D.U. Experimental investigation of the lithium-ion battery impedance characteristic at various conditions and aging states and its influence on the application. Appl. Energy 2013, 102, 885–897. [Google Scholar] [CrossRef]
- Shenzhen Global Technology Co. Data Sheet BMS-20A-3S-S & BMS-20A-3S-EFJ. Available online: https://www.mantech.co.za/datasheets/products/BMS-20A-3S-S_SGT.pdf?srsltid=AfmBOoodewXBLI2iNCIspG9JiubKepgLDeyZ3TupGUq0L2kXP1W3QYhx (accessed on 16 April 2025).
- Ada, L. Adafruit INA219 Current Sensor Breakout. 2012. Available online: https://learn.adafruit.com/adafruit-ina219-current-sensor-breakout (accessed on 16 April 2025).
- Isaac. Measure Voltage, Current and Power with the INA219 Sensor. 2024. Available online: https://en.hwlibre.com/measure-voltage%2C-current-and-power-with-the-ina219-sensor/ (accessed on 16 April 2025).
- Arbin Instruments. RBT Series—Regenerative Battery Test System; Arbin Instruments: College Station, TX, USA, 2023; Available online: https://www.arbin.com/battery-test-equipment/battery-test-product-series/rbt-series/ (accessed on 29 April 2025).
- Neware Technology Limited. CT-9002 High Precision Battery Testing System; Neware Technology Limited: Tucson, AZ, USA, 2023; Available online: https://www.msesupplies.com/products/neware-ct-9002-high-precision-battery-testing-system (accessed on 29 April 2025).
- Chroma Systems Solutions, Inc. Battery Reliability Test System Model 17010H; Chroma Systems Solutions, Inc.: Foothill Ranch, CA, USA, 2023; Available online: https://www.chromausa.com/product/battery-reliability-test-system-17010h/ (accessed on 29 April 2025).
- Battery Design. Tesla 4680 Cell. 2023. Available online: https://www.batterydesign.net/tesla-4680-cell/ (accessed on 4 July 2025).
- Electrios Consultants. BYD Blade Teardown; Electrios Consultants: Hongkong, China, 2022; Available online: https://electrios.com/blog_post/byd-blade-teardown/ (accessed on 4 July 2025).
Disclaimer/Publisher’s Note: The statements, opinions and data contained in all publications are solely those of the individual author(s) and contributor(s) and not of MDPI and/or the editor(s). MDPI and/or the editor(s) disclaim responsibility for any injury to people or property resulting from any ideas, methods, instructions or products referred to in the content. |
© 2025 by the authors. Published by MDPI on behalf of the World Electric Vehicle Association. Licensee MDPI, Basel, Switzerland. This article is an open access article distributed under the terms and conditions of the Creative Commons Attribution (CC BY) license (https://creativecommons.org/licenses/by/4.0/).