Article

Systematic Evaluation of Possible Maximum Loads Caused by Electric Vehicle Charging and Heat Pumps and Their Effects on Common Structures of German Low-Voltage Grids

Department of Engineering, RheinMain University of Applied Sciences, 65428 Russelsheim am Main, Germany
*
Author to whom correspondence should be addressed.
World Electr. Veh. J. 2024, 15(2), 49; https://doi.org/10.3390/wevj15020049
Submission received: 9 January 2024 / Revised: 1 February 2024 / Accepted: 1 February 2024 / Published: 3 February 2024

Abstract

:
In this paper, we present a comprehensive assessment of the effects of residential loads, electric vehicles (EVs), and electric heat pumps (HPs) on low-voltage (LV) grids in urban, suburban, and rural areas of Germany. Firstly, real data are used to determine the typical structures for each LV grid region. Secondly, nine scenarios are defined with different levels of EV and HP penetration. Thirdly, the Low Voltage Load Flow Calculation in the DIgSILENT PowerFactory is performed for all scenarios while taking the simultaneity factor (SF) for each load type into consideration to calculate the minimum voltage and maximum loadings of transformer and lines in each grid; this allows for the grid’s potential bottlenecks to be identified. The network simulations are carried out with the consideration of charging powers of 11 kW and 22 kW in order to evaluate how an increasing EV load in the future may affect the grid’s parameters. To the best of our knowledge, no study in the literature has simultaneously addressed all of the aforementioned topics. The results of this study provide a useful framework that distribution system operators (DSOs) may apply to anticipate the forthcoming challenges and figure out when grid reinforcement will be required.

1. Introduction

Germany has to expedite the decarbonization of each sector in order to reach the target of greenhouse gas neutrality by 2045 [1,2]. For the transportation and heating sectors, the German government has established the goals of having at least 15 million registered battery electric vehicles (BEVs), 1 million public charging stations, and 6 million HPs by 2030 [3,4]; the energy demand is predicted to rise from 560 TWh in 2021 to 750 TWh by 2030 mainly as a result of these sectors being more electrified [5]. A total of 20,507 fast-charging points and 85,072 slow-charging points in operation were registered with the German Federal Network Agency as the public charging infrastructure until 1 September 2023 [6]. However, it is expected that charging of EV at home will become more widespread in the upcoming years. In the autumn, 2023, the German government started offering grants of up to 10,200 EUR to EV owners for buying and setting up a photovoltaic system (PV), a private EV charger (with a minimum charging power of 11 kW), and a battery storage system (BSS) in an effort to further promote the development of the home charging infrastructure [7,8]. Furthermore, the power system must be able to transfer the expected maximum load values of the additional EV charging and HPs. In this respect, the potential grid bottlenecks must be investigated while taking into account various region types, typical LV network topologies, and SFs, as not all loads function simultaneously.
In the recent years, several research papers have addressed the crucial topic of the early detection of potential problems resulting from the integration of EVs and HPs into LV grids. Thormann et al. [9] examined the effects of six different load types (HPs, EVs, electrical water heaters, etc.) on the thermal overload of transformers/feeders, as well as the voltage of four LV grids (urban-city center, urban-city outskirts, suburban, and rural). For this purpose, load flow calculations were applied to two static load approaches that took SF into consideration and a time series-based load approach. Sudhoff et al. [10] employed a linear optimization model with the use of power prices to minimize the load and feed-in peaks of typical German urban, suburban, and rural LV networks. Several scenarios were defined that included both the significant and moderate integration of PVs, EVs, HPs, and BSS in the grids; however, no studies have been conducted on SF, voltage stability, or line/transformer overloadings. Bernards et al. [11] suggested an approach that incorporated copulas and fast linear load flow models in a real Dutch LV network in order to simulate the uncertainty of adopting new technologies, generate load profiles (EV, HP, and PV), and analyze their effects on the voltage and line loading; but, the loading of the transformer and SF have not been addressed. To effectively and economically accommodate the adoption of loads, such as EVs and HPs, in the urban grids, Wintzek et al. [12] proposed novel strategies for grid planning and dimensioning under the consideration of SFs. However, the grid’s bottlenecks (such as voltage and line/transformer overloadings) were not studied during the simulation of this work. According to several adoption scenarios for HP, EV, and PV in the years 2035 and 2050, Gupta et al. [13] estimated the effects of these technologies on a Swedish LV grid using a geographic information system (GIS)-based model; load flow calculations were performed to identify the voltage deviation and thermal overloading while considering SFs. An asymmetric power flow calculation was used in ref. [14] to assess how EVs, plug-in hybrid electric vehicles (PHEVs), HPs, and PVs affected the voltage unbalance and stability of an LV grid in a village; three scenarios were established, each with a distinct percentage of these loads in the years 2030, 2035, and the present. In ref. [15], a static load flow calculation for a real-world urban LV grid in the city of Cologne was utilized to explore the influence of various EV, HP, and PV penetration levels on the voltage and line/transformer loadings; a load shape generator in Python was used to produce the load profiles of homes with and without these technologies. In a real urban LV grid, Oliyide et al. [16] investigated the transformer/line overloadings, voltage deviations, and losses caused by HP and EV for the years 2020 and 2030, while taking different penetration levels and seasonal load profiles into account; this analysis made use of the power system simulation software GridLab-D. Srithapon et al. [17] presented a practical algorithm based on AC optimal power flow to lessen the burden (i.e., voltage violation and line overloading) on a modified IEEE European LV grid that included PV, HP, EV, thermal energy storage, and space heating. In two real, typical Dutch LV grids, Bhattacharyya et al. [18] performed load flow calculations to determine line/transformer overloadings and the under-voltage brought on by penetrations of EVs and HPs in the future. The network analysis tool GAIA was employed to carry out the grid simulations, and the case studies took into account the hourly (day/night) and seasonal (summer/winter) load profiles. Sengor et al. [19] presented a variety of voltage constraint-oriented management algorithms to identify potential under-voltage problems caused by the widespread use of HPs, EVs, PVs, and BSS and, eventually, increase the grid’s hosting capacity; the investigation was conducted in a real MV/LV grid located in Ireland, considering different penetration levels of these loads. Damianakis et al. [20] evaluated the influence of diverse grid regions (urban, suburban, and rural), seasons (winter/summer), and both singular and combined EV–HP–PV penetrations on the voltage deviations and line/transformer overloadings in six real Dutch LV networks. Oliyide et al. [21] ran power flow simulations using GridLAB-D for a real urban LV grid in Great Britain to look into the impact of seasonal variation and HP–EV penetrations on the voltage profiles and line/transformer loadings for the years 2020, 2030, 2040, and 2050. In ref. [22], parameters, such voltage stability, line/transformer loadings, and demand profiles, were assessed in relation to various EV and HP integrations into five real LV grids in the UK over the winter season, to reflect the worst-case scenario. However, the SF was overlooked in Refs. [14,15,16,17,18,19,20,21,22].
This study presents a thorough evaluation of typical LV network structures to provide information on the network compatibility and any potential weaknesses that may arise due to the increasing load demands in the future, in order to assess whether each grid’s bottleneck reaches its acceptable limit. The following is an outline of the paper’s main contributions:
  • The specification of typical LV grid parameters for urban, suburban, and rural regions in Germany with respect to the real grid data, such as the number of feeders and residential units, cable lengths, and cross-sections;
  • The identification of any possible grid effects brought on by household loads and various EV and HP penetration levels utilizing the Low Voltage Load Flow Calculation in DIgSILENT PowerFactory [23], while taking into account their SFs.
The remainder of this work is organized as follows: the research questions, the typical grid topologies, and the concept of SF are described in Section 2. The case studies and simulation results are demonstrated and discussed in Section 3. Finally, the paper is concluded in Section 4.

2. Materials and Methods

2.1. Research Questions and Constraints

The main inquiries under investigation in this study are as follows:
  • Where do new loads (such as EVs and HPs) contribute the most to a relative increase in the peak load? Why are LV grids our main concern?
  • What proportion of EVs and HPs can a typical LV grid structure handle before unfavorable operating conditions arise? Which grid structure and region are the most resilient and which ones are most vulnerable to the penetration of these loads?
  • The unacceptable threshold values appear first in which grid topologies?
The magnitude of the voltage at the end of the feeders and the thermal overloading of the lines and transformers were investigated under various case studies (Section 3.1) in order to provide answers to the issues raised above.
The voltage at the LV level has to remain within the range of 400 V ± 10%, according to the standard DIN EN 50160 [24]; however, since in our simulations the voltage at the transformer terminal was fixed to 400 V (equivalent to 1 p.u.), the maximum voltage deviation was assumed to be ±5% (0.95 p.u. and 1.05 p.u.). It is advisable to avoid loading cables and transformers beyond 50%, as these levels are regularly reached (e.g., every working day); this minimizes losses and provides a certain amount of redundancy. However, since the grid calculations in this study were conducted using the maximum simultaneous power (Section 2.3) that only happens rarely (e.g., once a year), loss considerations are less relevant and redundancy limitations can be tolerated for these exceptional cases; thus, it is acceptable for the lines and transformers to have the maximum short-term thermal overloadings of 100% and 120%, respectively [25,26].

2.2. Grid Topologies

Using network data from the grid operator Syna GmbH (Frankfurt am Main, Germany) [27], we identified the typical grid structures for different regions (i.e., urban, suburban, and rural areas) [28], leading to the development of representative LV grids, the parameters of which are displayed in Table 1, Table 2 and Table 3.
According to Syna’s statistical evaluation, a transformer with a rated power of 630 kVA typically supplies 6 to 10 feeders, each having a length of 210 m to 290 m, and 7 to 9 house connections (3 residential units each) in an urban grid. Given these constraints, we proposed an urban grid with a total of 65 house connections (195 residential units) and 8 feeders, the specifications of which are listed in Table 1. Feeders 1 to 3 represent relatively simple structures that make use of a common cable type NAYY 4 × 150 mm2 with varying cable lengths and numbers of house connections in order to assess the impact of scaling. Afterwards, Feeder 4 is defined with an identical length and house connections to Feeder 3 but a higher cross-section (NAYY 4 × 240 mm2) to evaluate the effect of cable sizing. Feeders 5 and 6 depict another common grid topology having a common node at the length 100 m (H-configuration); 3 house connections are attached to the first 100 m of both feeders; then, 4 and 6 house connections are connected to Feeders 5 and 6 after the common node, with corresponding lengths of 100 m and 200 m, respectively. Feeders 7 and 8 have cable cross-sections of 240 mm2, which distinguish them from Feeders 5 and 6.
The parameters of the suburban and rural grids in Table 2 and Table 3 are derived in the same manner. Through 9 feeders, the suburban and rural grids supply 171 and 112 residential units, respectively. In contrast to the urban grid, the suburban and rural grids commonly include 400 kVA MV/LV transformers and overhead lines with the conductor type NFA2X 4 × 70 mm2 (Feeder 5 in Table 2 and Table 3). To facilitate easier visual comprehension, single line diagrams of the urban, suburban, and rural grids used in the simulations are displayed in Figure 1, Figure 2 and Figure 3, respectively.
Various real-world LV feeders can be assigned to a feeder of one of these three representative LV grids; hence, it is possible to determine whether and where weak points exist in the operator’s own grid using the results that are subsequently presented in Section 3.

2.3. Simultaneity Factor and Low-Voltage Analysis

In order to systematically investigate the boundaries of the capacity and disturbances of typical LV grid topologies in Germany, it is necessary to determine the minimum voltages at all terminals, as well as the transformer and line maximum loadings for the moment of the expected grid peak load. The Low Voltage Load Flow Calculation in Digsilent PowerFactory software Version 2023 was employed for this purpose, enabling an accurate determination of the maximum power that is consumed by a defined cluster of grid customers. Since the power demand of the individual loads is at least partially stochastic, the SF for residential loads, EVs, and HPs must be taken into account to estimate the maximum simultaneous power:
P m a x n = n · P m a x 1 · g ( n )
where P m a x n is the maximum simultaneous power of n consumers, P m a x 1 is the maximum power of the individual consumer, and g ( n ) is the SF for n consumers of the considered type.
Accordingly, adding more loads of the same type to the grid reduces the likelihood that they will all be used at the same time.
It is necessary to define the g ( n ) and P m a x 1 of each load type in order to carry out the Low Voltage Load Flow Calculation for realistic peak loads. The calculations in this study made use of the following values.

2.3.1. Residential Load

The predefined Coincidence Definition object “Household partially-electric” from the PowerFactory library, which refers to a house without electric heating and an electric water heating system, was used to represent the residential load. In this case, the P m a x 1 was set to 8 kW, and the g ( n ) was computed as follows [23]:
g n = g + 1 g ( n + 1 A ) B
where g   is the SF for an infinite number of households ( g = 0.2), A is the end of constant part (A = 1), and exponent B is equal to 0.75.

2.3.2. EV Load

In October 2021, the Network Technology/Network Operation Forum at VDE (VDE FNN) published a comprehensive study with a focus on calculating the SF for EV charging at private charging stations due to its significant importance for the safe grid operation [29]. In this paper, we applied the SF values from the VDE FNN study for private charging stations at households in urban, suburban, and rural regions.
In Germany, private charging stations usually have a charging power of 11 kW (3 × 16 A at 230 V), which is suitable for a wide range of EVs. Also, some private chargers have an output of 22 kW (3 × 32 A at 230 V) to facilitate faster charging processes. Hence, the P m a x 1 was set to 11 kW as basic scenarios and 22 kW to demonstrate possible future increases in the EVs charging power as well.

2.3.3. Electric HP Load

The P m a x 1 was assumed to be 7 kW. Furthermore, the HP coincidence curve from the PowerFactory library was used to define the g ( n ) .
Based on the characteristics of the SFs and the predominance of EV charging at private chargers, the highest relative load growth caused by the roll-out of electromobility, as well as HPs, is expected to occur in the LV network of residential areas. Additionally, the stochastic behavior of consumers subjects the “last mile” (i.e., the individual cables) to the most severe conditions, since the SF increases with a decreasing number of units considered. For this reason, the LV network is the focus of the simulations and analysis in this paper, which are detailed in Section 3.

3. Results

In this study, the simulation results were produced using Digsilent PowerFactory software. The urban, suburban, and rural LV grids were developed in accordance with the specifications provided in Section 2.2. Additionally, we made the assumption that each residential unit in all three grids could be equipped with a private charging point and an HP. Afterwards, the loads-related parameter settings were made according to Section 2.3. The network simulations were carried out for the following case studies.

3.1. Case Studies

The penetration level of each individual load type can be specified through the Low Voltage Load Flow Calculations. To investigate how the HPs and charging of EVs might affect the three grid regions, the scenarios in Table 4 were taken into account.
The initial grids prior to the deployment of EVs and HPs were represented by Scenario #1. Afterwards, Scenarios #2 to #5 looked into the capacity of the grids with four levels of EV penetration. Our principal focus was to analyze the grids with the integration of EVs; however, as HP is an important new load in the future, four levels of HPs were also incorporated into the grids, in addition to the EVs in Scenarios #6 to #9. Regarding Germany, HPs are continuously replacing the existing natural gas and oil heating systems as part of the targeted decarbonization program. The country requires 15 million BEVs and 6 million HPs by 2030 to fulfill the 2030 climate protection target, which means that the EV penetration is 2.5 times higher than HP penetration; this estimate formed the basis for the definition of Scenarios #6 to #9.
It should be noted that the Low Voltage Load Flow Calculations for Scenarios #2 to #9 were carried out twice in order to satisfy the assumption that the P m a x 1   for EV charging was 11 kW and 22 kW (Section 2.3.2) and assess the impact of various charging powers on the grids’ potential bottlenecks. In this context, we are aware that the widespread use of a charging power of 22 kW is rather unlikely from today’s perspective.

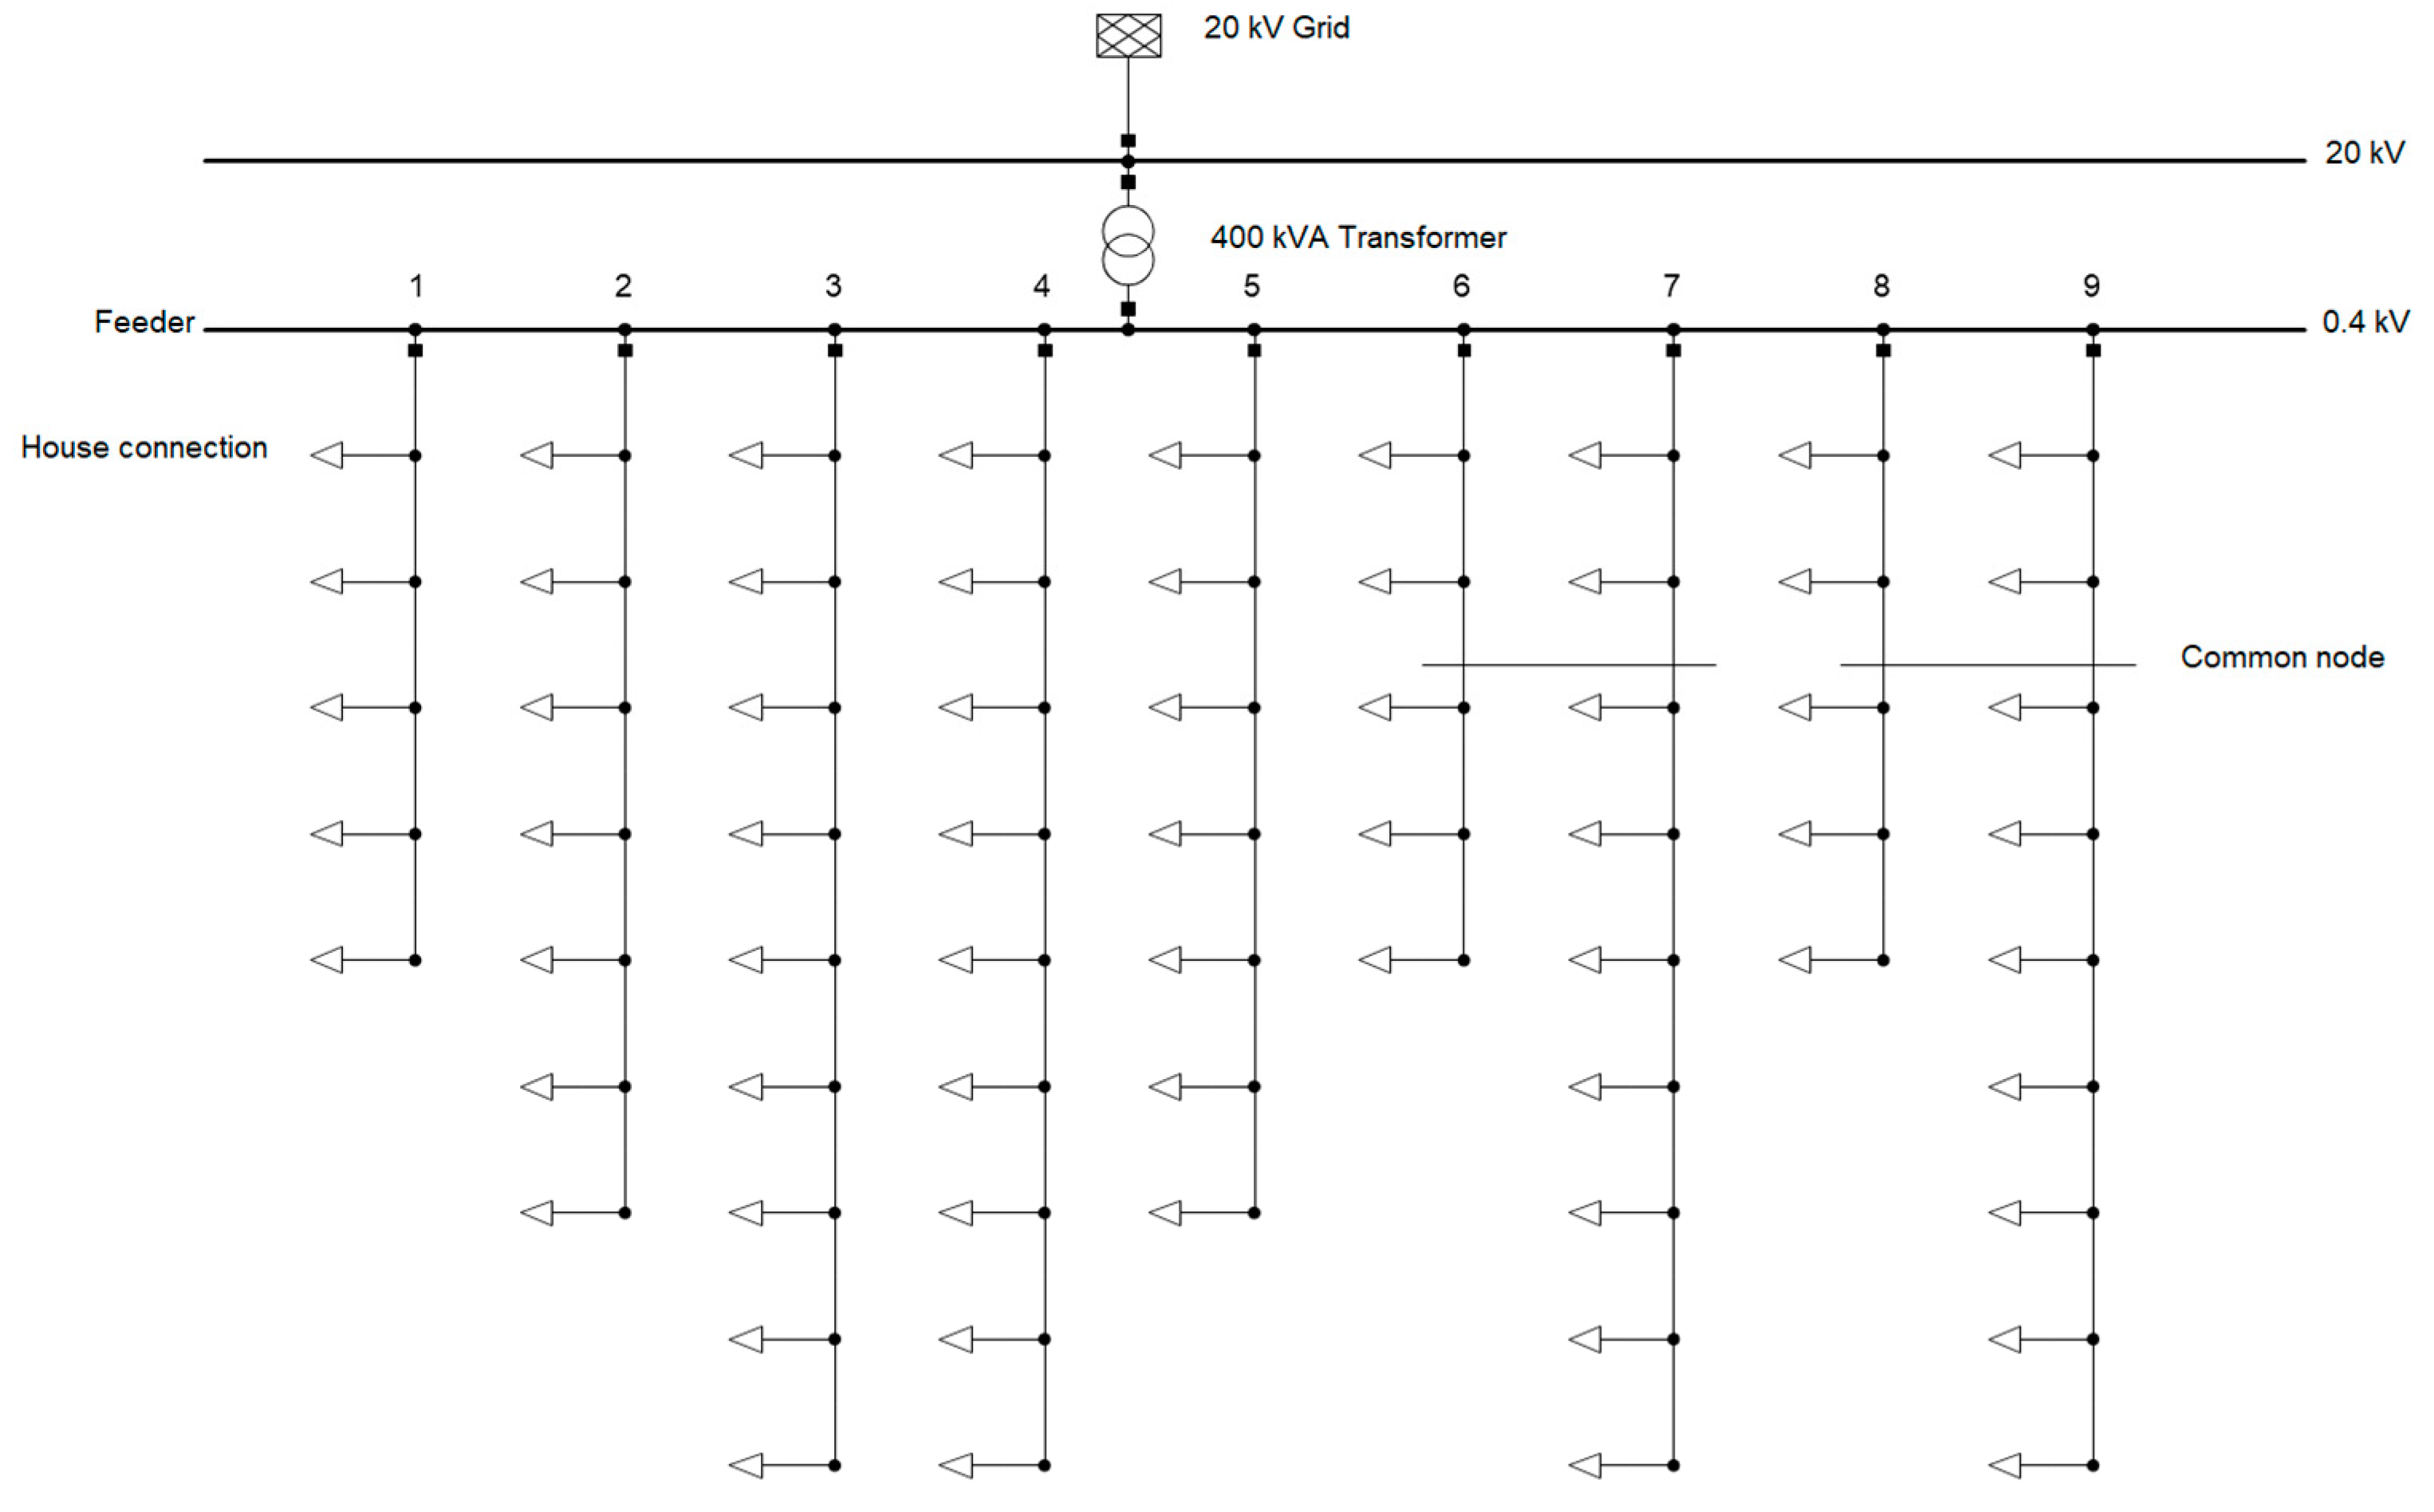
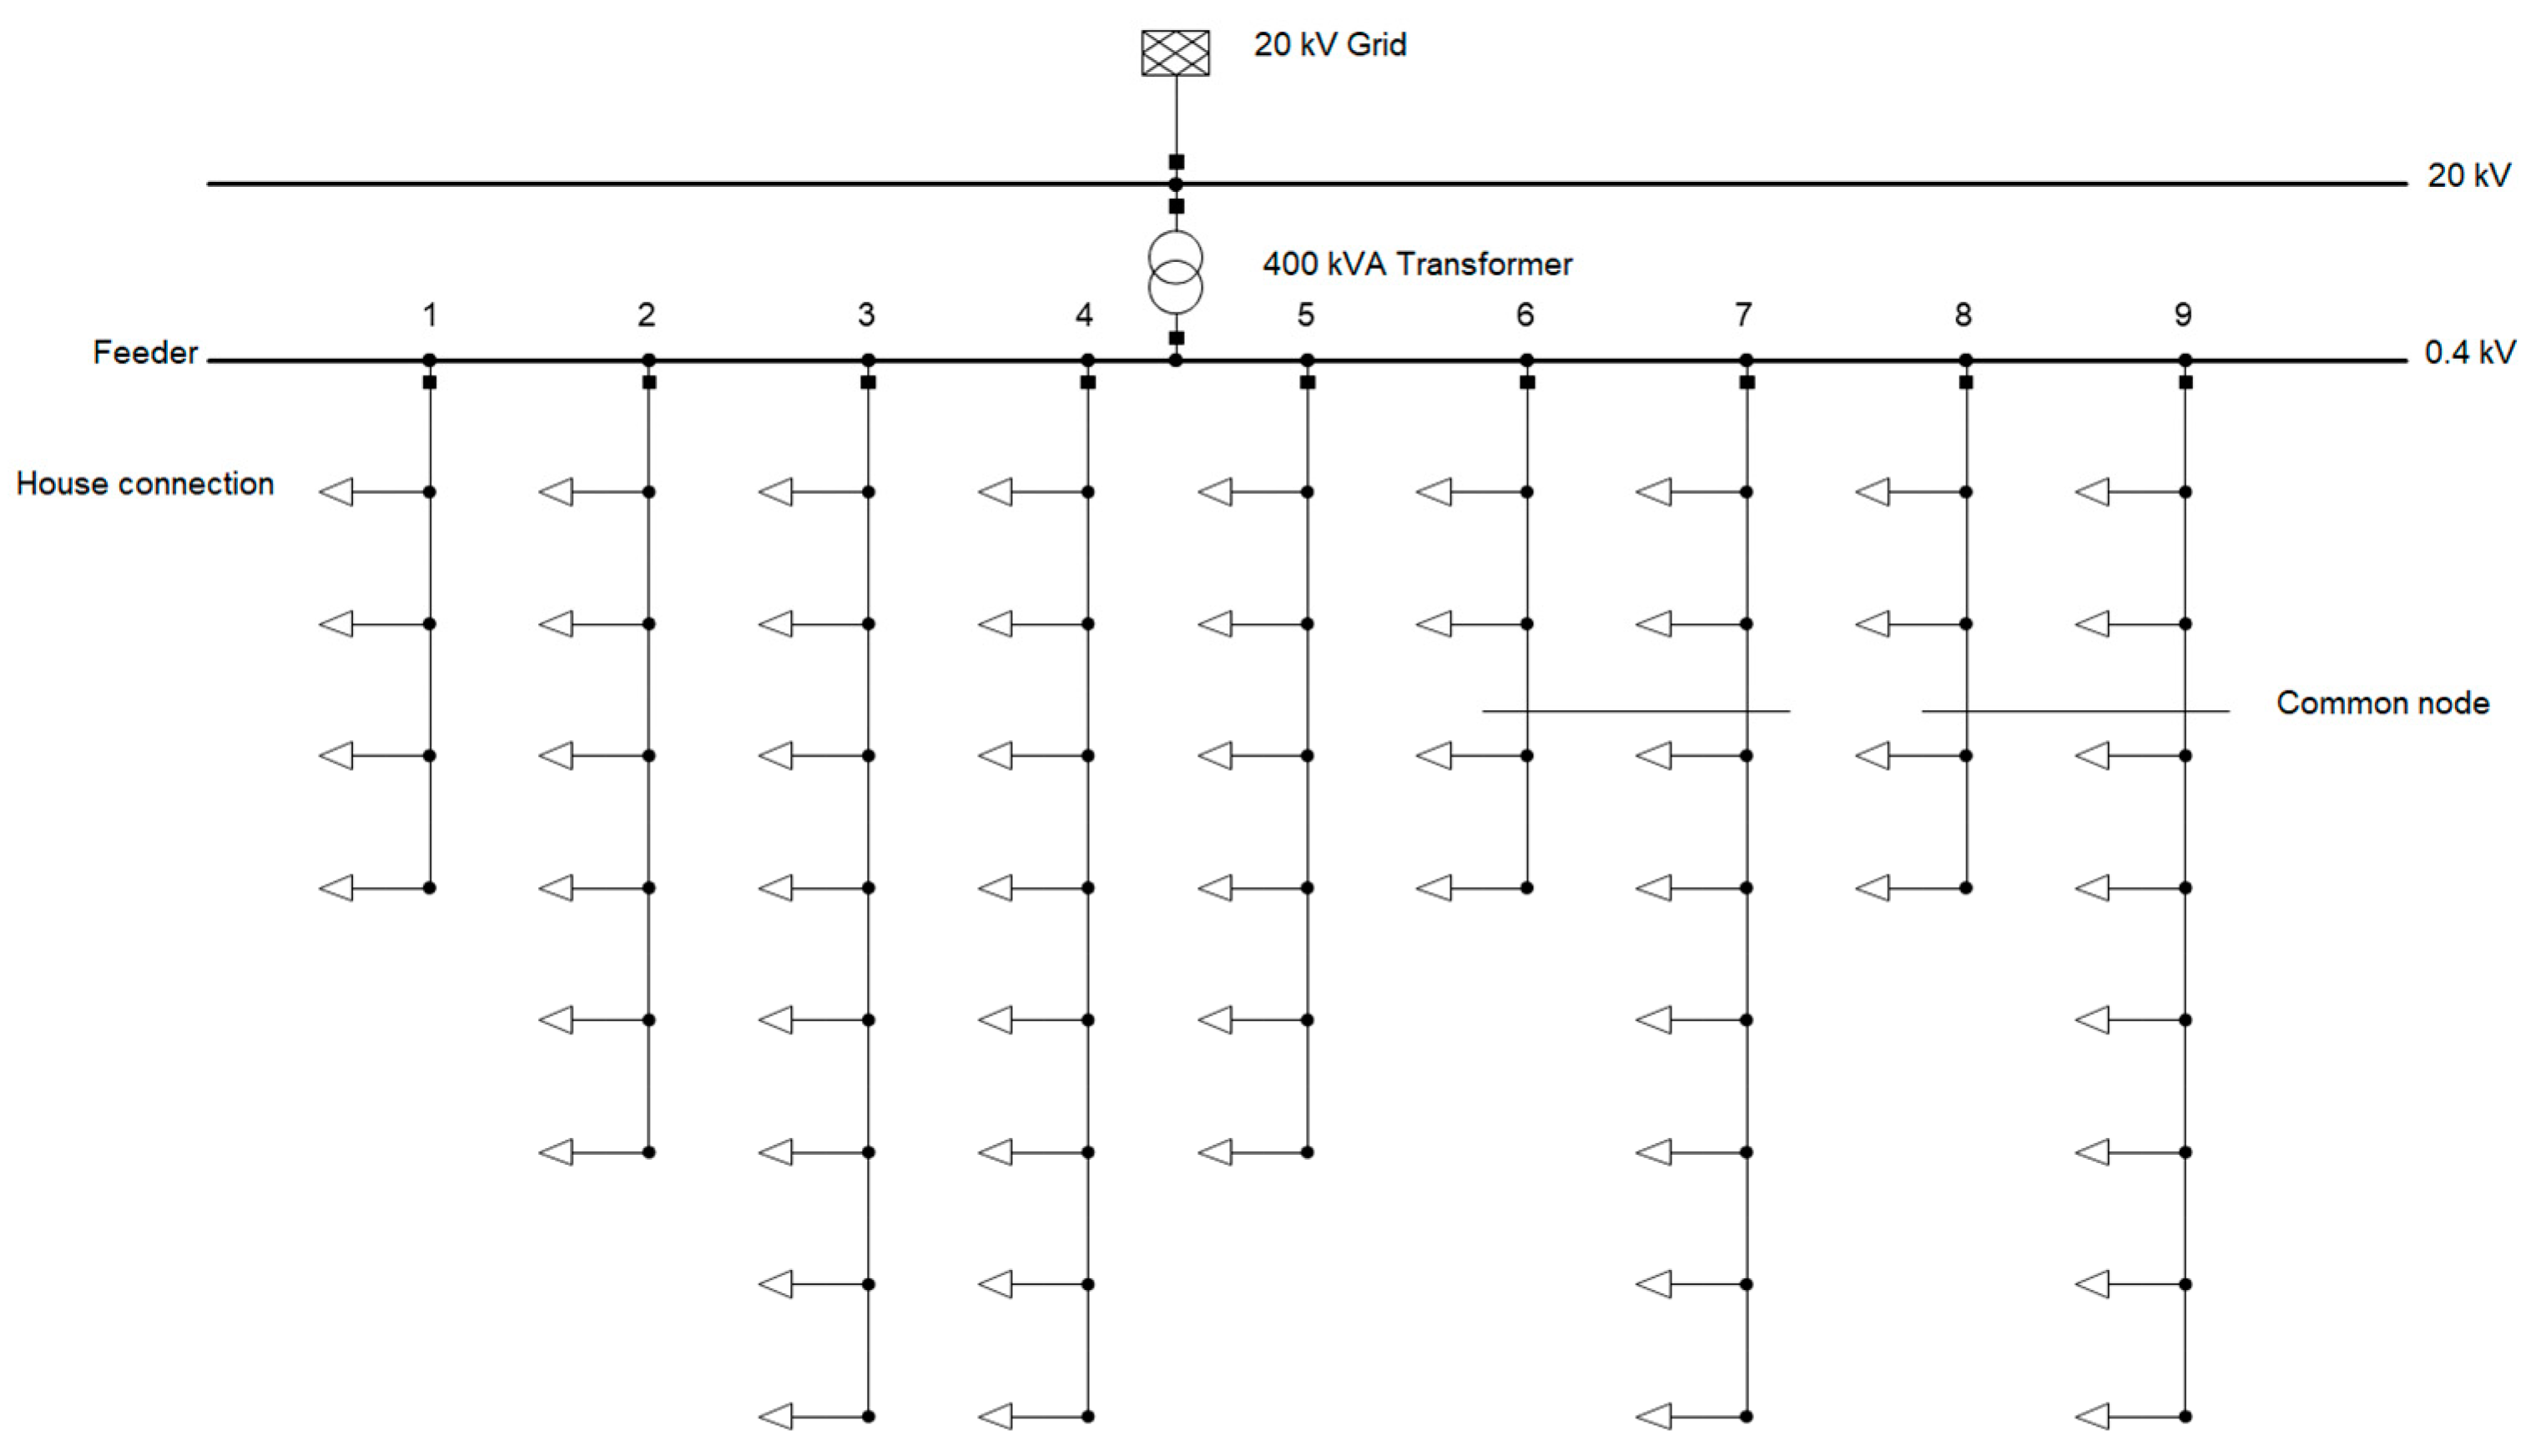
3.2. Simulation Results

This section examines the effects of each scenario on grids in urban, suburban, and rural regions. It is crucial to first display the grids’ parameters without the penetration of HPs and EVs through Scenario #1 in order to further evaluate the implications of these additional loads for the LV grids. For Scenario #1, the outcomes of the Low Voltage Load Flow Calculations in the urban, suburban, and rural LV grids are depicted in Table 5, Table 6 and Table 7, respectively; they contain the values of maximum loading, minimum voltage at the final terminal, and total active power for each feeder, while solely considering the residential loads.
Equations (1) and (2) and the assumptions in Section 2.3.1 were used to determine the total load values in the aforementioned tables. For instance, as shown in Table 5, the total load in Feeder 1 was 47.3 kW, which was calculated by multiplying 21 residential loads (n = 21), the SF value of 0.28 (g(21)), and 8 kW ( P m a x 1 ). In an H-configuration, such as Feeders 5 and 6, the value of n was equal to the total number of residential loads connected to both feeders (i.e., n = 48 in this example).
The voltage and the maximum loading values along the feeders were given special attention in order to evaluate the performance of grid structures. A comparison of the Feeders 1 to 3 (150 mm2 cables) in Table 5, Table 6 and Table 7 revealed the effect of increasing the number of loads and the length of the main lines. When Feeders 1 and 2 were contrasted in Table 7, it can be observed that increasing the number of house connections by 50% and the feeder’s length by 43% (100 m) could result in a 25% rise in the maximum loading; however, there was a slight reduction in voltage. The maximum loading was increased by 55% when comparing Feeders 1 and 3, while the voltage was decreased from 0.986 p.u. to 0.977 p.u. as a result of doubling the number of house connections and extending the feeder by 86% (200 m). Furthermore, to demonstrate how much the grid’s parameters are enhanced when a cable with a larger cross-section is employed, a comparison was made between Feeders 3 and 4 (150 mm2 and 240 mm2 cables); in this regard, the maximum loading was reduced by 24% for each of the three grids, and the voltage rose by 0.005 p.u., 0.007 p.u., and 0.007 p.u. for the urban, suburban, and rural grids, respectively, based on the data in the tables above.
In some German suburban and rural grids, the use of LV overhead lines with a cross-section of 70 mm2 is common. The effect of using overhead lines instead of underground cables can be observed by comparing the results of Feeder 2 (150 mm2 cable) with Feeder 5 (70 mm2 overhead line), since both were subjected to the same total load; Table 6 and Table 7 show that, under the same conditions, the use of an overhead line (70 mm2) resulted in a 32% increase in the maximum loading and a 0.01 p.u. drop in voltage compared to the cable (150 mm2).
According to the findings of the Low Voltage Load Flow Calculations, the feeders with an H-configuration had the identical values for their variables. The minimum voltage was provided by the longest feeder (such as Feeders 6 and 8 in Table 5), and the maximum loading was determined by taking the highest loading value observed along both feeders. Feeders 1 and 3 were compared with Feeders 6 and 7 in Table 6 as an example in order to assess the impact of utilizing the H-configuration; Feeders 1 and 6 and Feeders 3 and 7 had the same number of house connections and lengths, and their cable cross-sections were 150 mm2. As can be seen in Table 6, Feeder 3 alone had a maximum loading and voltage of 28.37% and 0.971 p.u., respectively. On the other hand, more consumers led to a lower SF when two feeders were coupled in an H-configuration; this increased the voltage to 0.972 p.u. and reduced the maximum loading to 23.63% in Feeders 6 and 7. Finally, use of the 240 mm2 cables for Feeders 8 and 9 resulted in even better conditions (i.e., 17.83% maximum loading and 0.98 p.u. voltage).
Transformer overloading is another potential bottleneck in the LV grid, which mainly relies on the network’s total load. Considering the power factor of 1 for the residential loads [23], the total load in the urban, suburban, and rural grids was 335.9 kVA, 296.7 kVA, and 200 kVA, respectively. Consequently, Table 8 shows the maximum loading of the transformer in each grid for Scenario #1. With a maximum loading of 74.67%, the 400 kVA transformer in the suburban grid had the highest value among the three grids.
Answers to the Questions 2 and 3 in Section 2.1 can be found by analyzing the data in Figure 4, Figure 5, Figure 6, Figure 7, Figure 8, Figure 9 and 
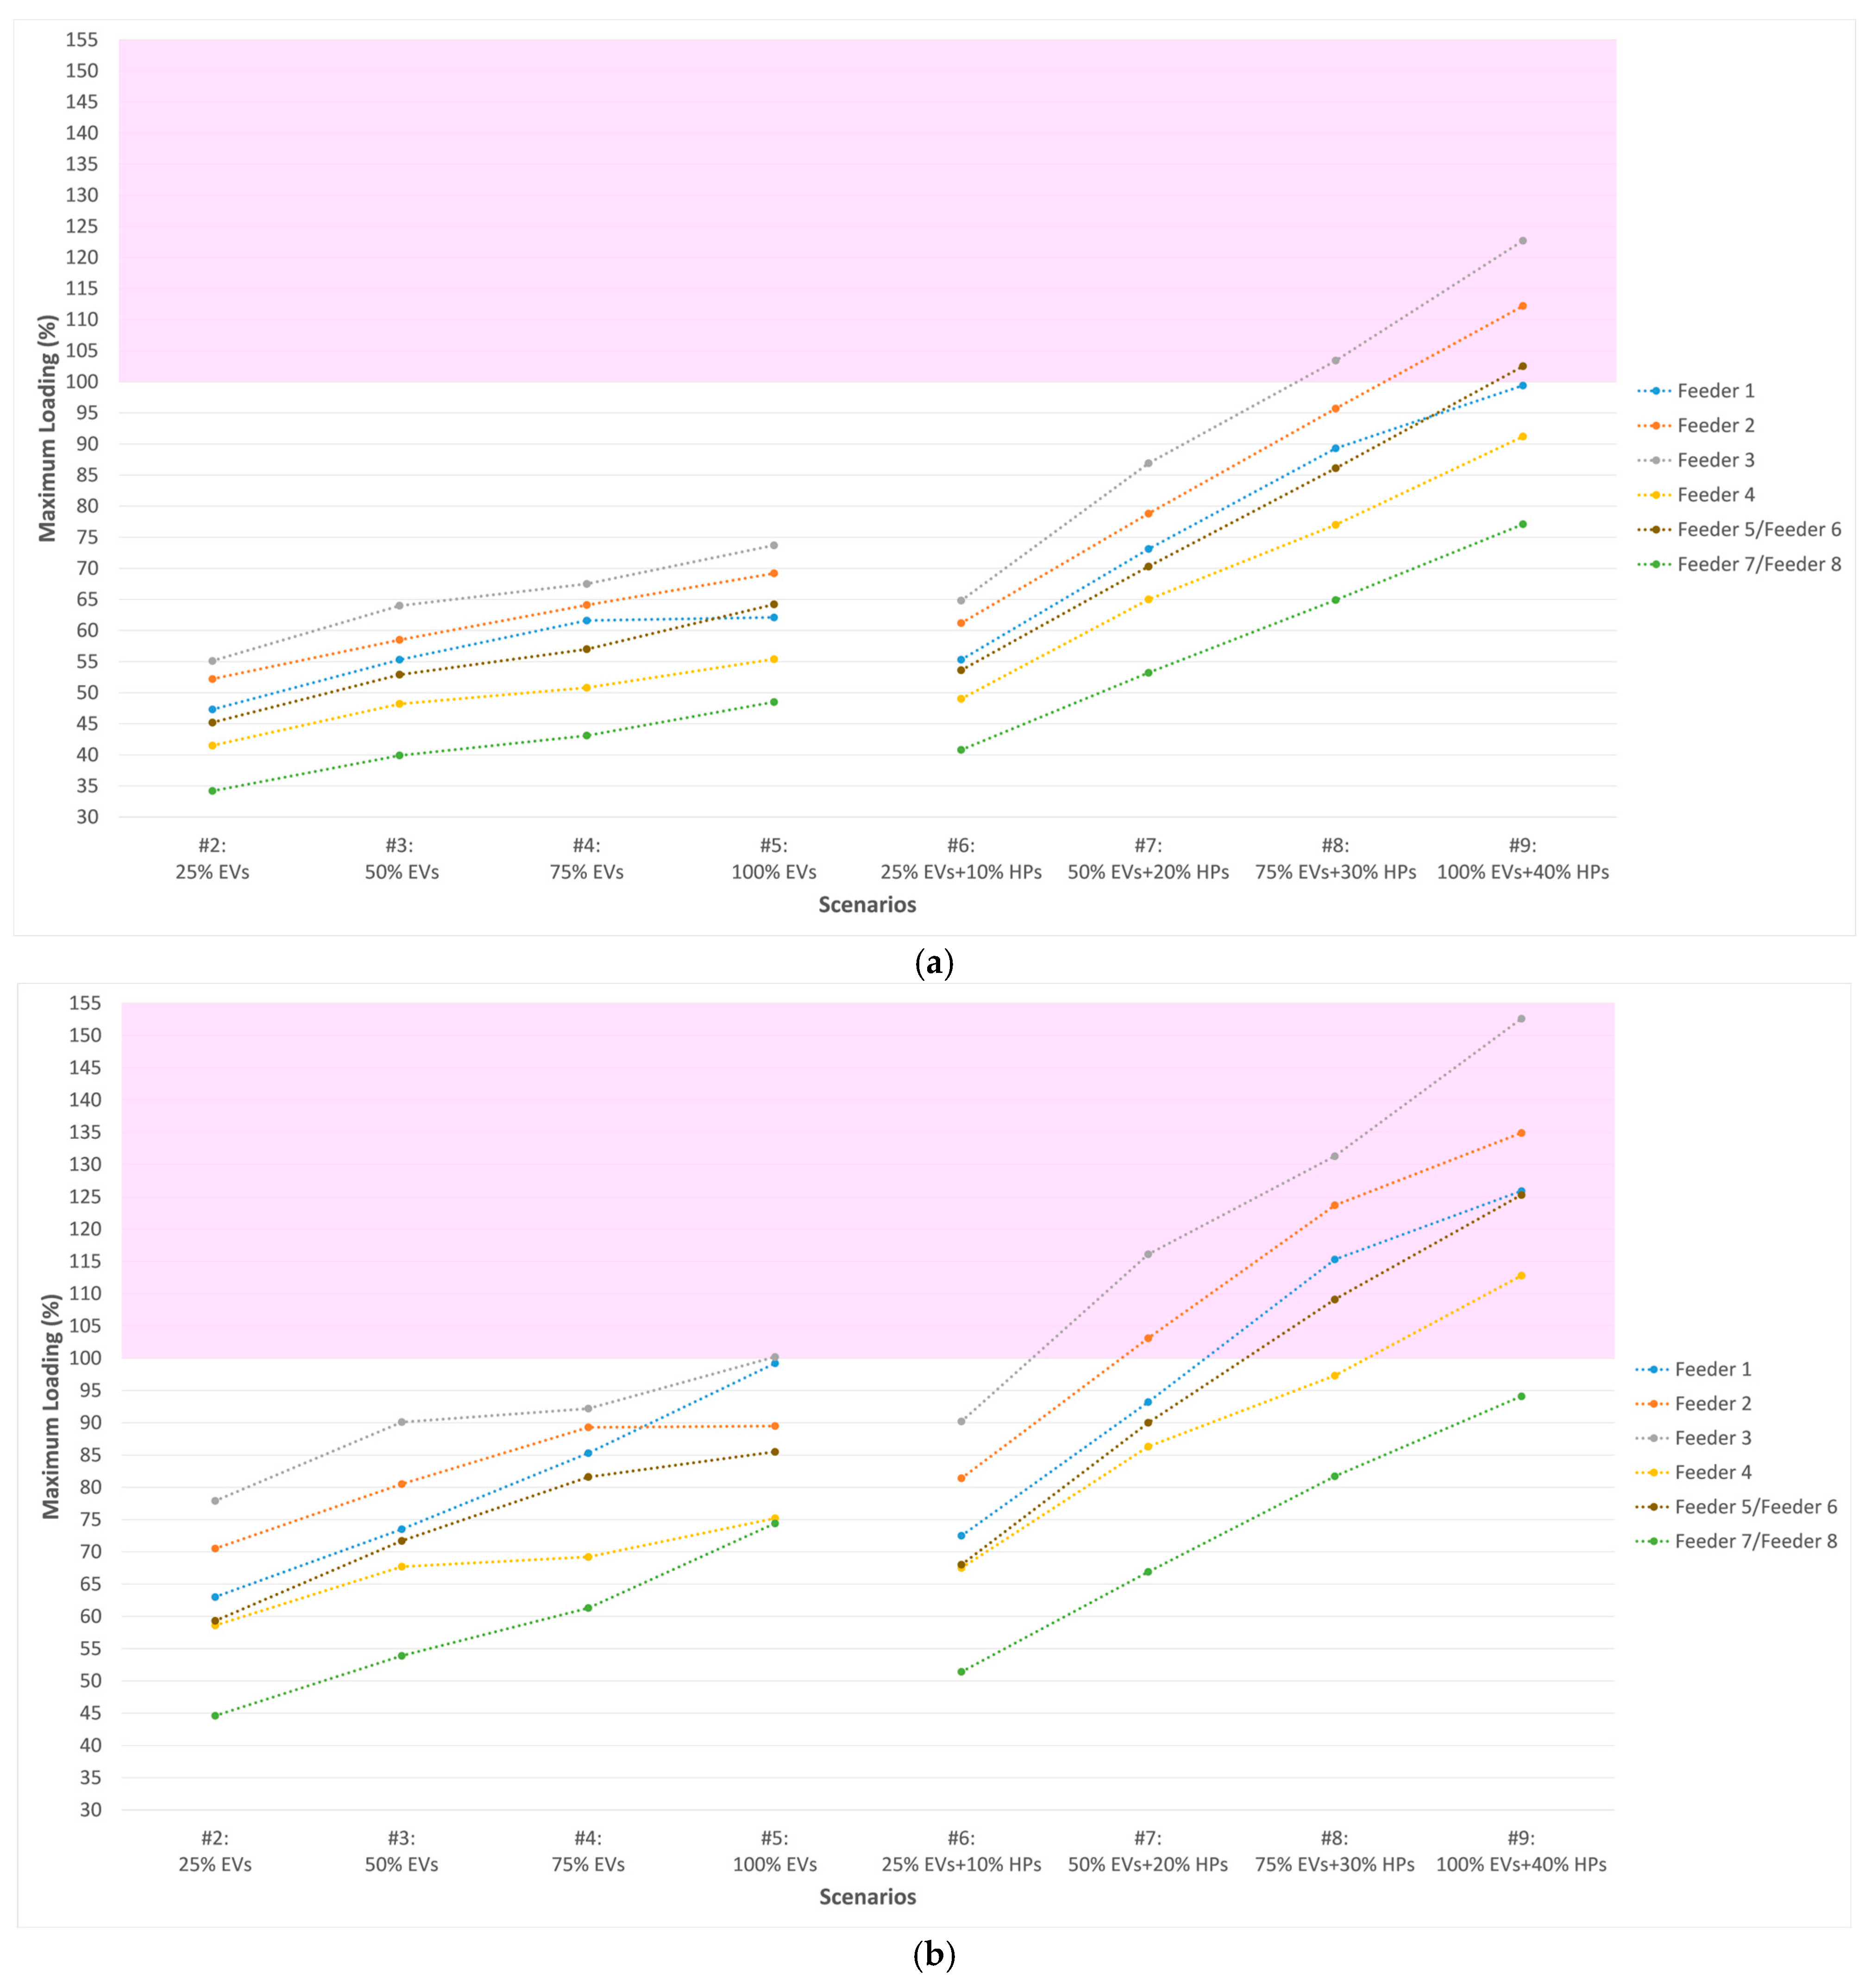
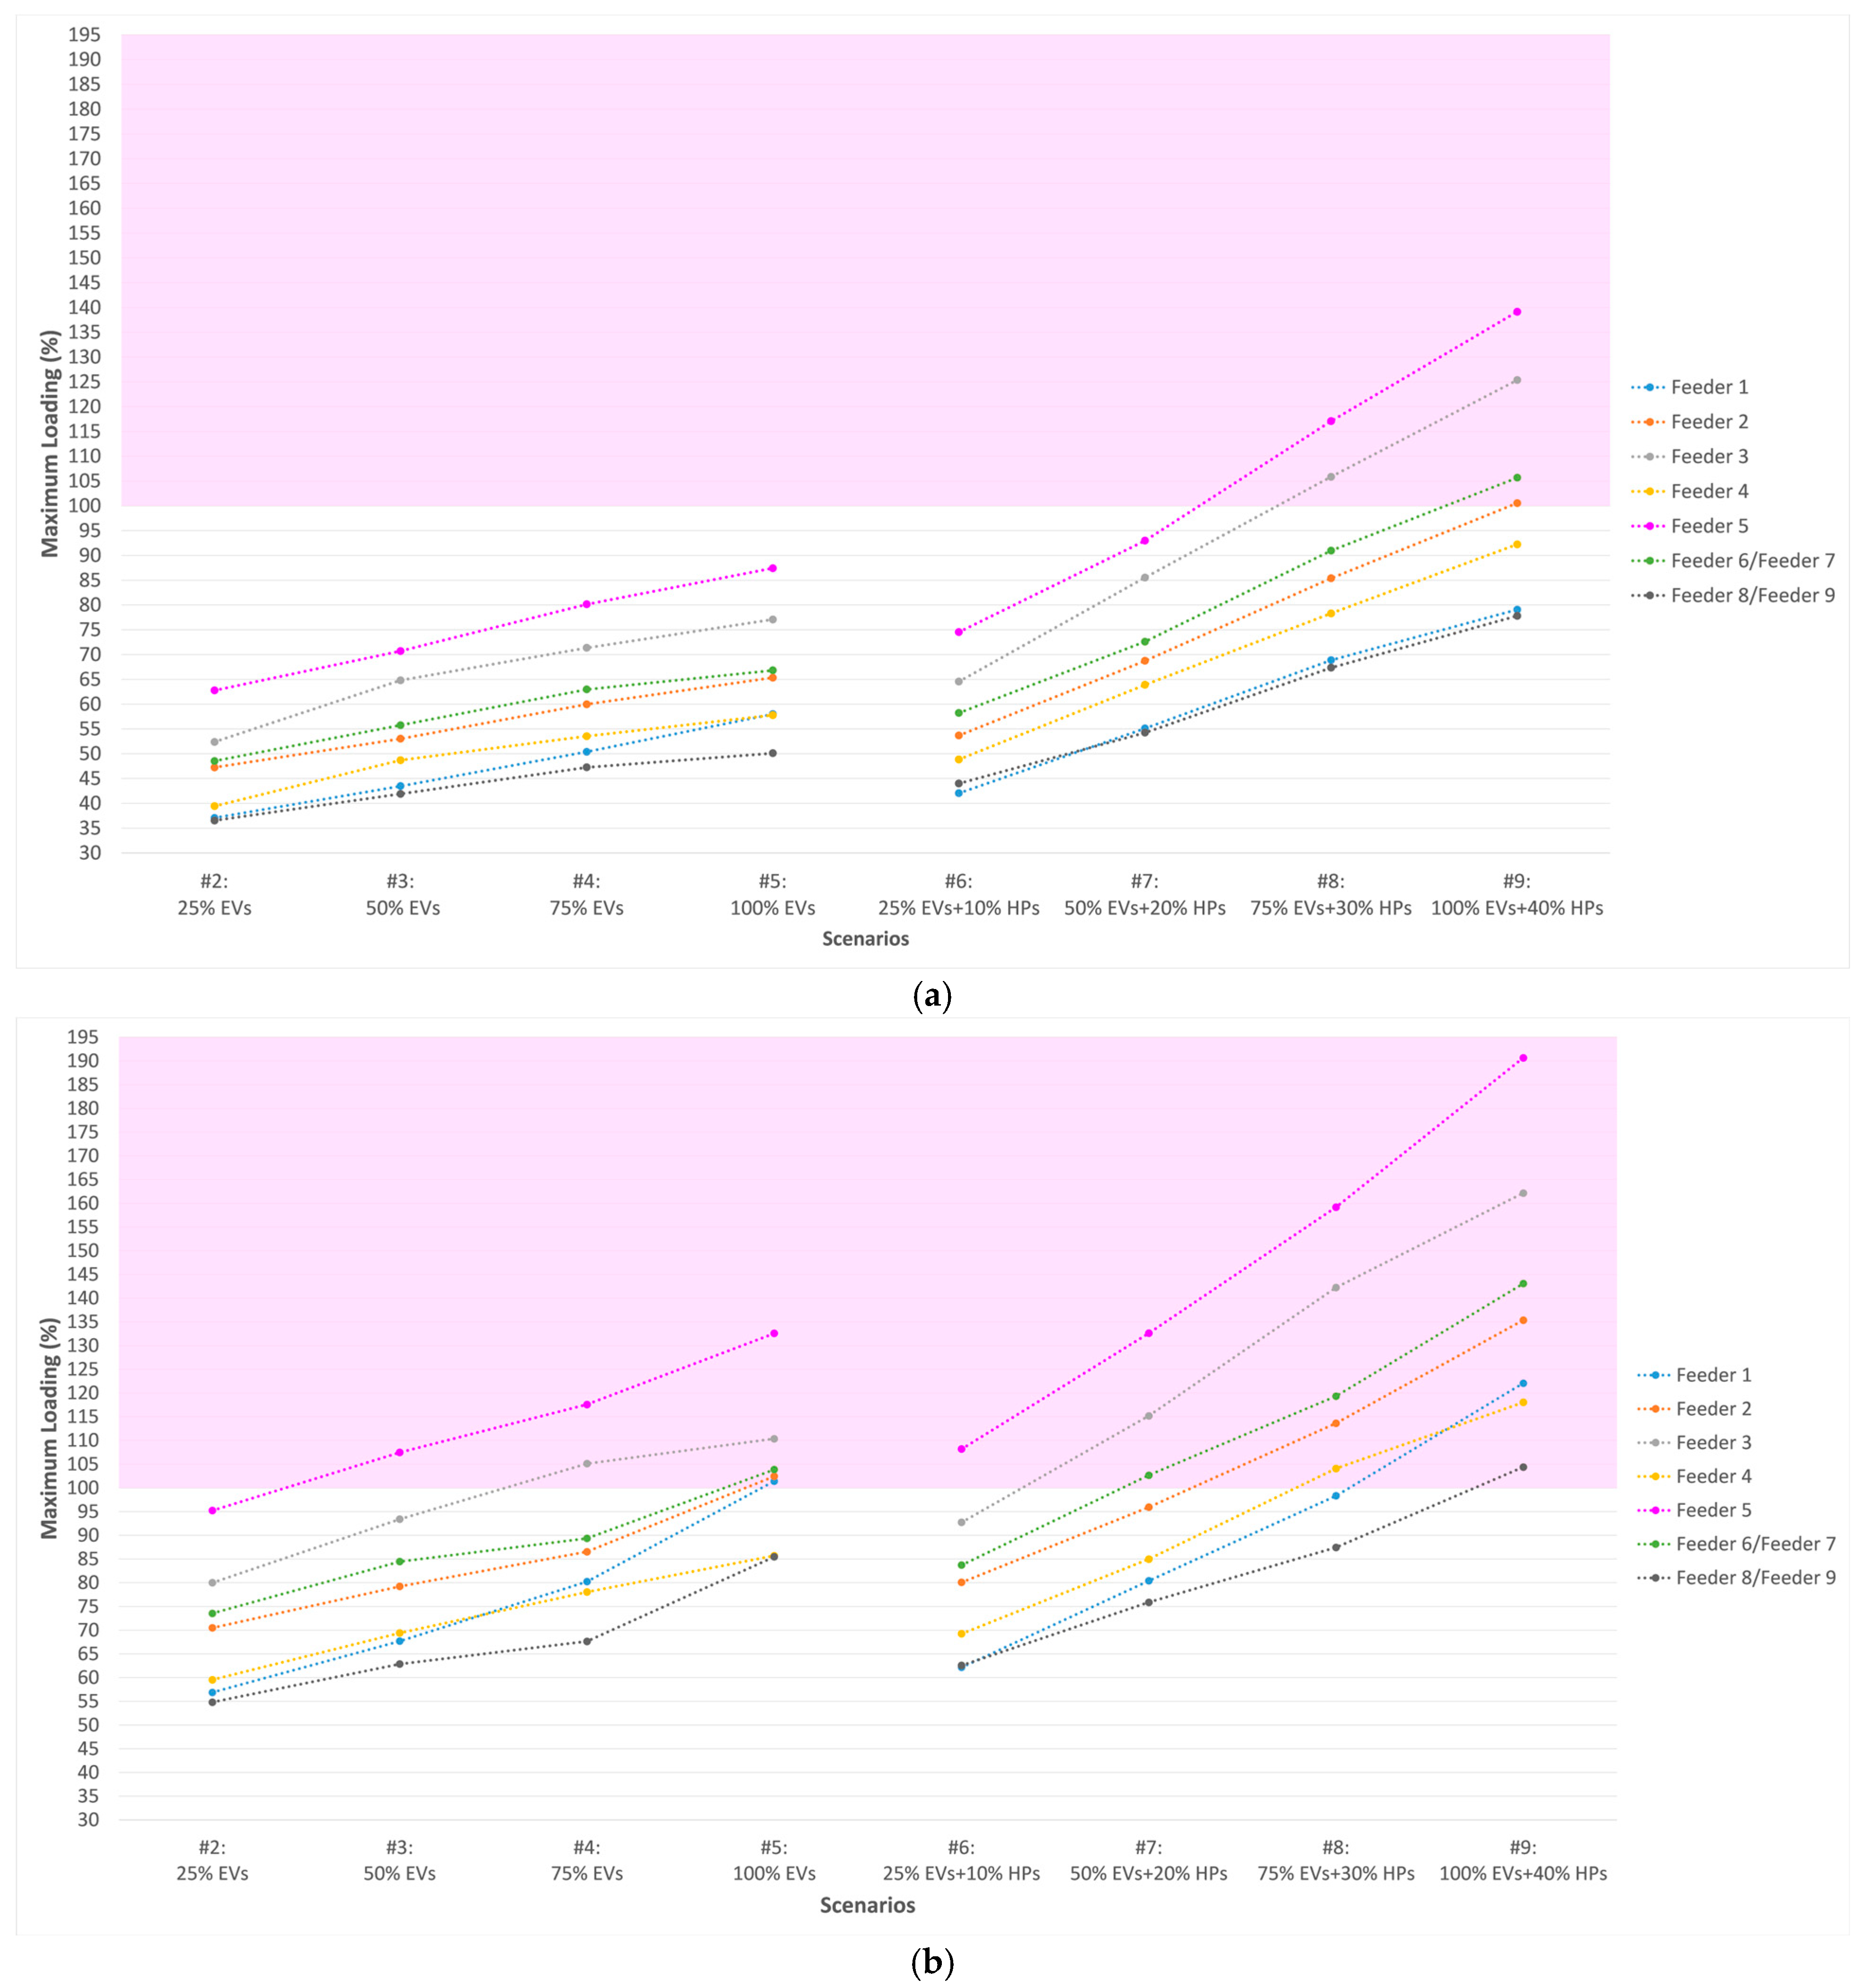
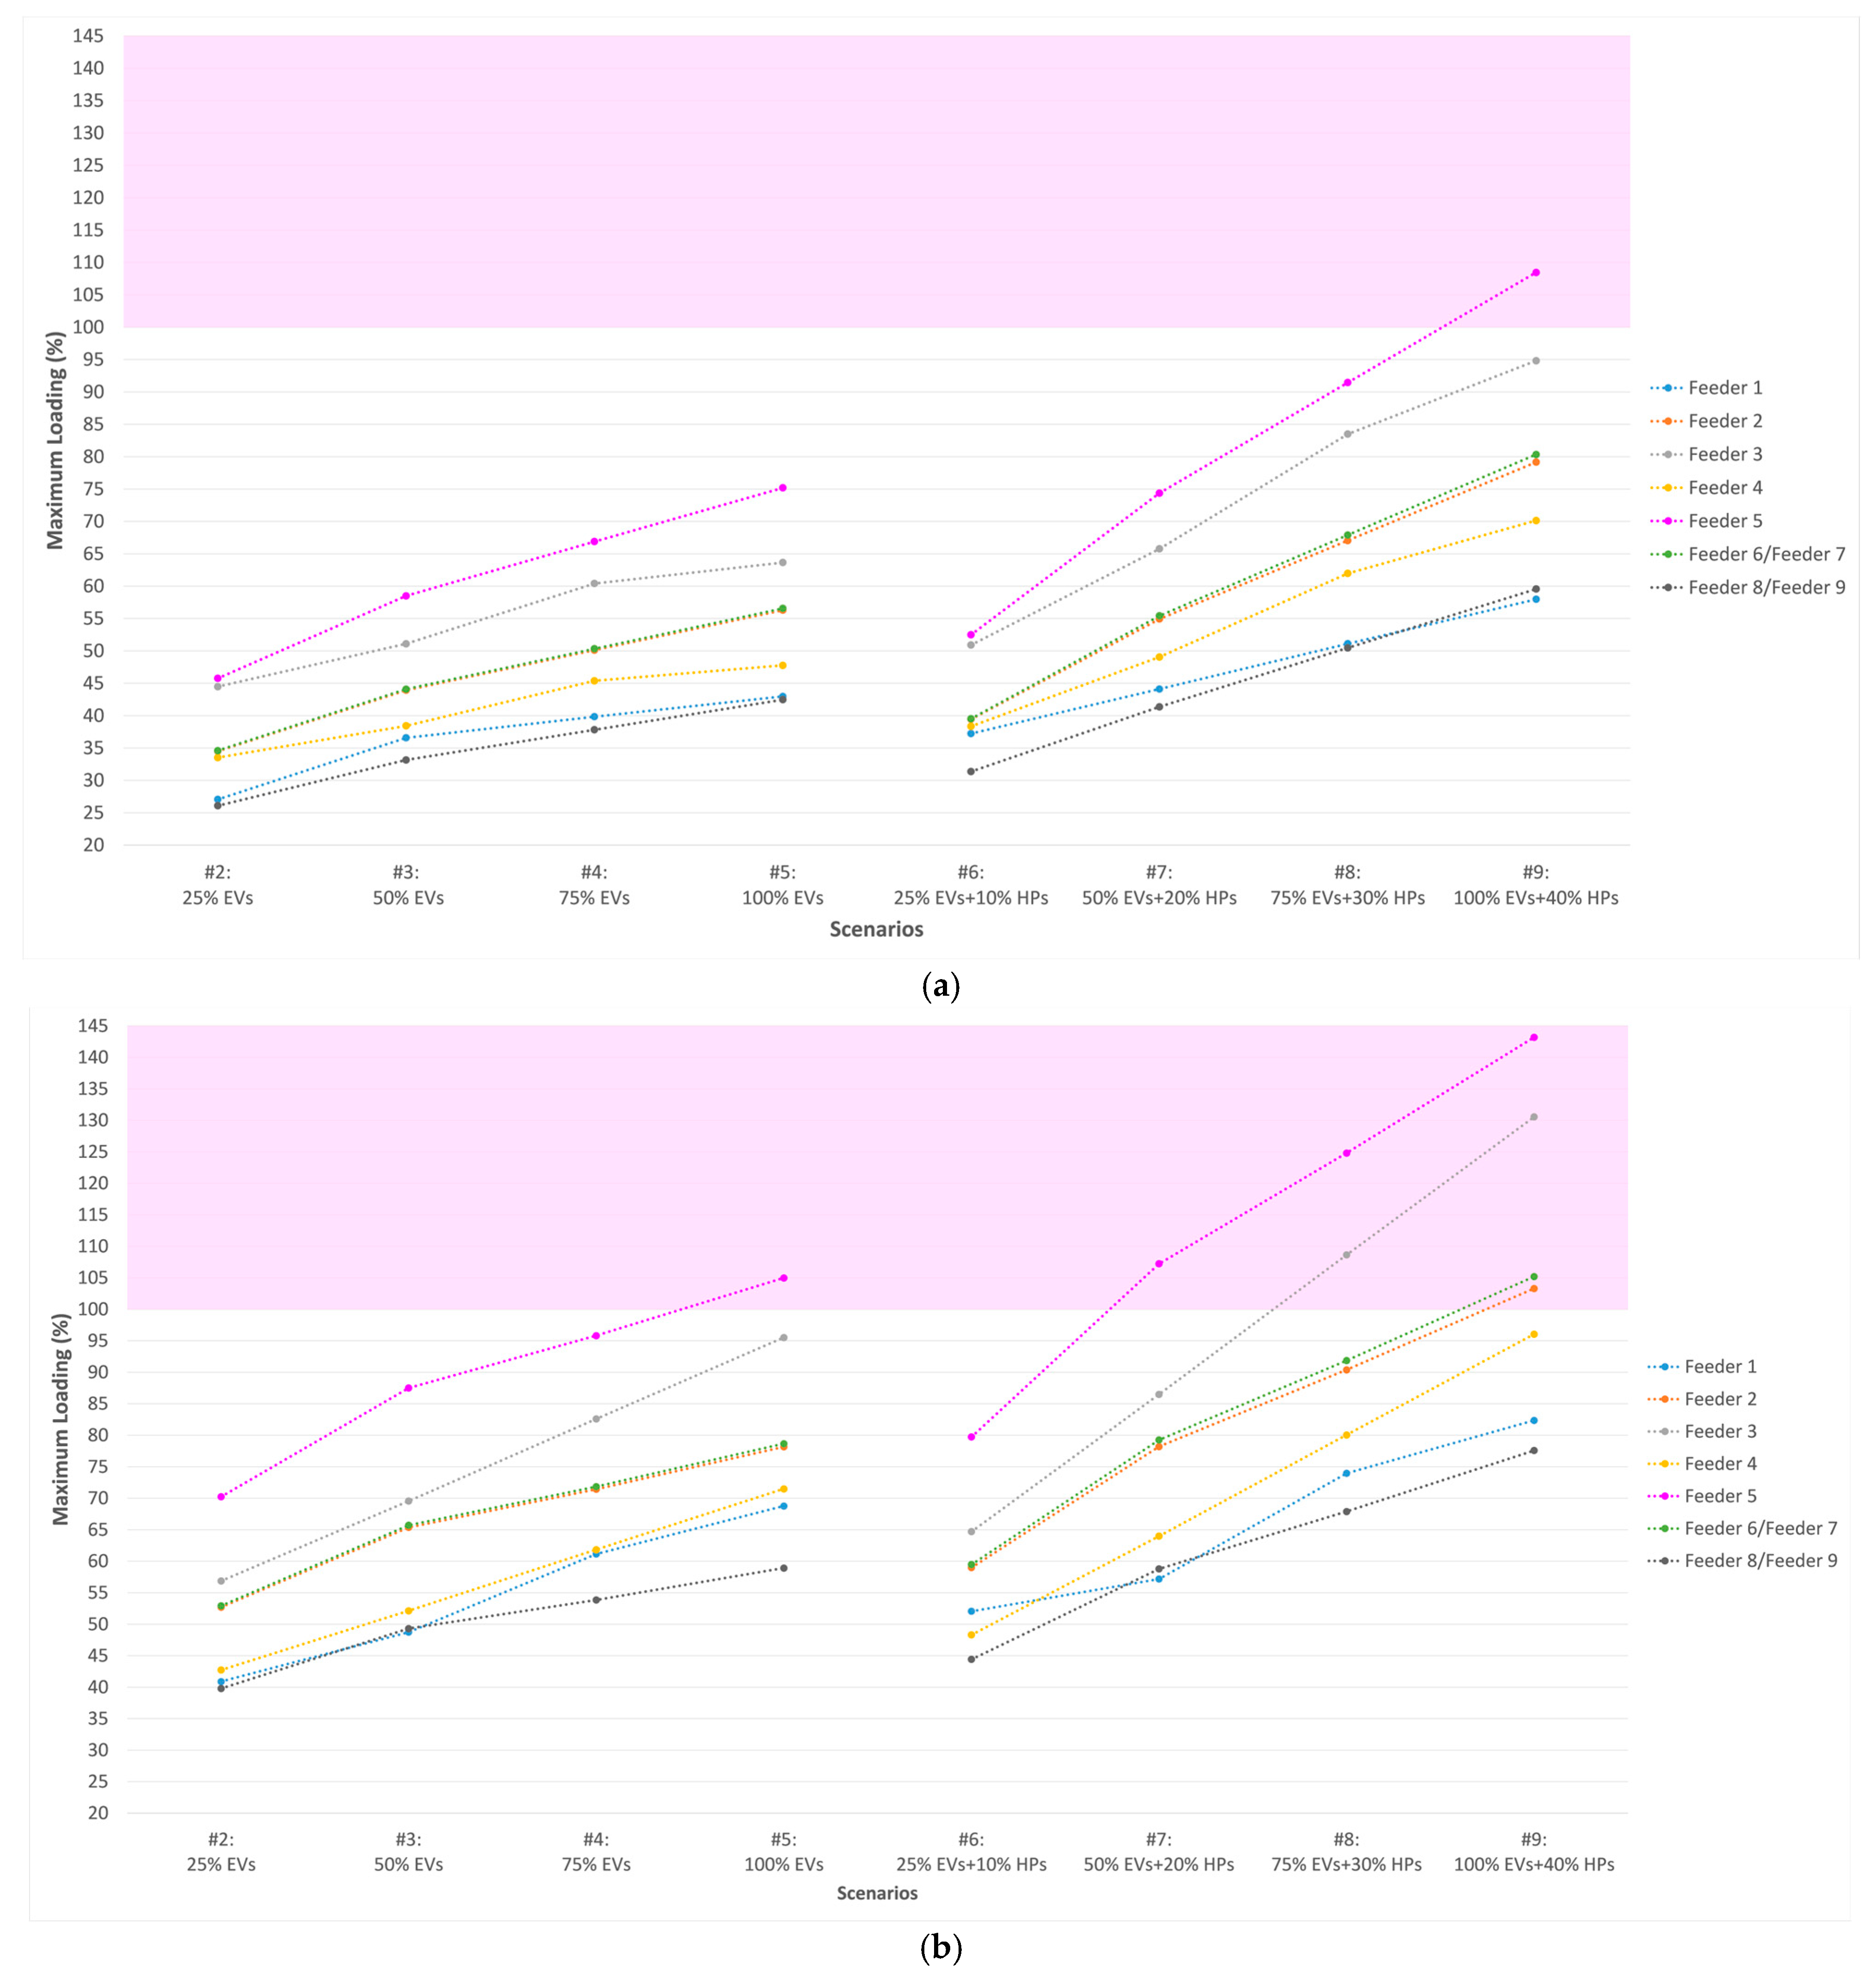
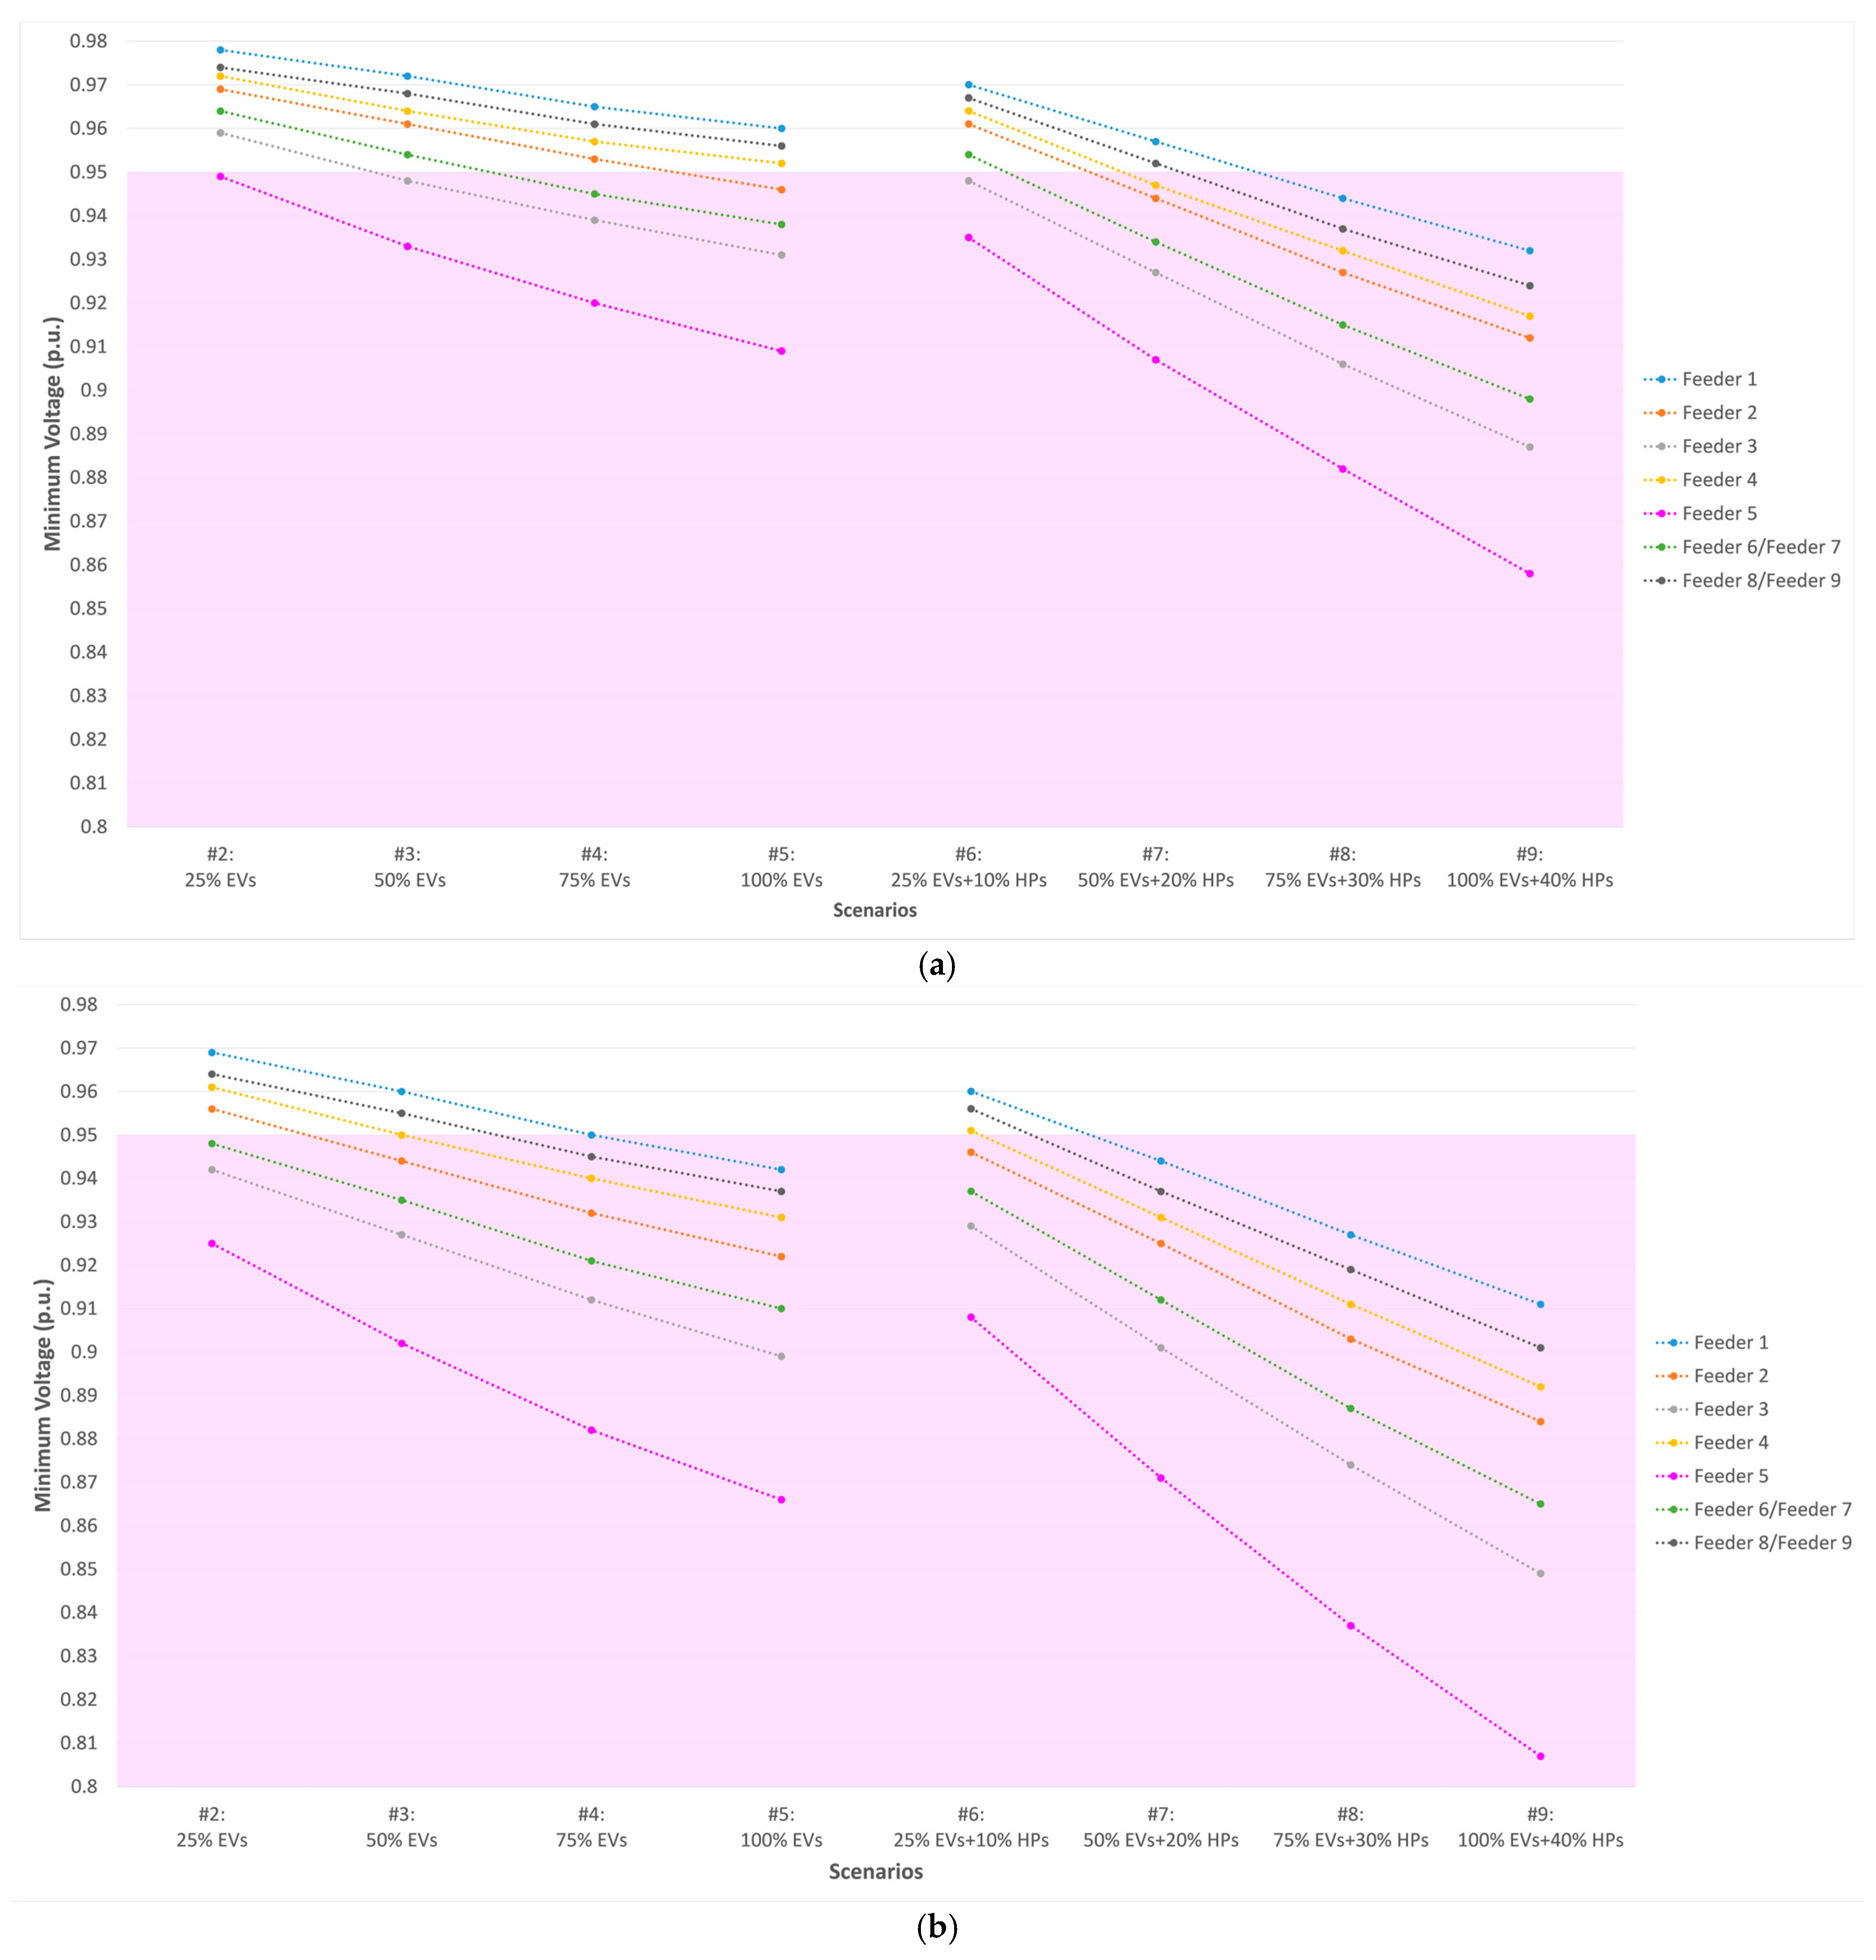
Figure 10. For this purpose, we initially divided the scenarios into two major categories: (1) Scenarios #2 to #5 (with EV penetration only); (2) Scenarios #6 to #9 (with EV and HP penetrations). Then, every transformer and feeder in each type of grid—urban, suburban, and rural—was monitored. Taking into account two charging rates for EVs, the values of the maximum line loading, minimum voltage, and transformer maximum loading in each of the two main categories of scenarios were recorded and utilized to create Figure 4, Figure 5, Figure 6, Figure 7, Figure 8, Figure 9 and Figure 10; these values were connected with dotted lines to make it easier to visually follow the behavior of feeders and transformers throughout the scenarios. We did not consider any penetration levels that fell between our predefined scenarios.
The minimum threshold of 0.95 p.u. for the voltage magnitude at the last terminals of feeders, as well as the maximum loading limits of 100% and 120% for the line and transformer, respectively, are indicated by the pink highlights.
The following provides a summary of the main findings derived from Figure 4, Figure 5, Figure 6, Figure 7, Figure 8, Figure 9 and Figure 10 and outlines the information of grid bottleneck violations based on the EV and HP penetration levels for each grid region:
  • Urban grid
The voltage drop and loading of a feeder are greatly influenced by its length, conductor cross-section, connected loads, and use of the H-configuration. As Figure 4 and Figure 5 illustrate, Feeder 3 was the weakest structure in all scenarios, having the longest length, the greatest number of house connections, and a cable cross-section of 150 mm2. In contrast, Feeders 7–8 (H-configuration) and Feeder 4 were the strongest ones owing to the use of cables with a larger cross-section (240 mm2). In the remaining feeders with 150 mm2 cables, Feeders 1, 2, and 5–6 (H-configuration) were in the order of the highest voltage values as a result of reducing the number of consumers and cable lengths (Figure 5). This sequence was different when it comes to maximum line loading; Figure 4 depicts how the four factors that affect line loading combined to arrange Feeders 2, 1, and 5–6 in the highest maximum loading order in the majority of the scenarios.
Upon closer inspection, with the exception of Feeder 3’s voltage of 0.945 p.u. in Scenario #5, there was no violation in the grid’s bottlenecks up to a penetration of 100% EVs (i.e., Scenarios #2 to #5) when the power of 11 kW was utilized for EV charging, as seen in Figure 4a, Figure 5a and Figure 10. The maximum loadings in Scenario #5 were observed in the transformer and Feeder 3 at 100.9% and 73.7%, respectively, indicating that there was no danger of thermal overloading. More under-voltage problems started when 50% EVs+20% HPs (i.e., Scenario #7) were incorporated into the urban grid; feeders with a cable cross-section of 240 mm2 and Feeder 1 (150 mm2 cable) were the only ones that did not go beyond the 0.95 p.u. minimum limit in Scenario #7. For Scenarios #8 and #9, none of the configurations were useful to maintain the voltage within the permissible range. The state of line loading was better than the voltage. The first line overloading occurred in Scenario #8 for Feeder 3 (Figure 4a). In Scenario #9 (100% EVs+40% HPs), Feeders 2 and 5–6 (both 150 mm2 cables) were overloaded as well.
When 22 kW chargers were used instead of 11 kW chargers, the total loads of EVs increased, resulting in grid bottleneck violations at lower penetration levels of EVs and HPs, as can be seen in Figure 4b, Figure 5b and Figure 10. Regarding the transformer, the first overloading was observed in Scenarios #7 with 22 kW and #8 with 11 kW chargers.
The urban grid example was used to clarify how to read and analyze the data presented in the figures. To prevent readers from being overwhelmed by the sheer volume of data, only the highlights for the suburban and rural grids are provided below.
  • Suburban and rural grids
Drawn from Figure 6, Figure 7, Figure 8, Figure 9 and Figure 10, Table 9 and Table 10 summarize the weakest and strongest structures for each bottleneck in the suburban and rural LV grids, respectively; these are based on the first occurrence of violations in each of the two main groups of scenarios (with EV penetration and with EV and HP penetrations). For instance, Feeder 5 (70 mm2 overhead line) had the highest values of maximum line loading compared to the other feeders in the suburban grid, as shown in Figure 6; therefore, it was recognized as the weakest structure in terms of line loading in Table 9, which experienced the first overloading in Scenario #8 with 11 kW chargers, as well as in Scenarios #3 and 6 with 22 kW chargers. Feeder 1 in suburban and rural grids was less adversely affected by under-voltage than the other feeders due to its shorter length, fewer loads, and relatively high cable cross-section (150 mm2).
To sum up, the DSOs might first discover that their grid topologies match or closely resemble one of our specified structures. Afterwards, the results of this investigation assist them in finding out the proportion of new loads that their existing structures can tolerate, as well as in estimating how their grids will behave in the event that upgrades are made. Using conductors with a higher cross-section as a grid upgrade solution typically leads to an improved voltage profile and reduced thermal line loading. Assuming the identical feeder lengths, an H-configuration with a cable cross-section of 240 mm2 is the most reliable structure and is ideal when a large number of loads are connected to the feeder; in our study, it was overloaded only once at the penetration of 100% EVs+40% HPs in the suburban grid, when EVs were charged with a power of 22 kW. However, this configuration was unable to keep the voltage within its specified boundaries in several scenarios; in this context, employing a voltage-regulated distribution transformer (VRDT) can be an effective strategy. Replacing the transformer with one of higher rated power or connecting transformers in parallel is another upgrade option. This bottleneck is particularly problematic in the suburban grid, which could only handle 25% penetration of EVs with a power of 11 kW; under the other scenarios, the transformer maximum loading went over the 120% threshold.

4. Conclusions

The performance of real typical LV grids in German urban, suburban, and rural areas in relation to the penetration of residential loads, EVs (with two charging rates), and HPs was examined in this paper while considering their SFs. We conducted a systematic investigation using the Low Voltage Load Flow Calculation in DIgSILENT PowerFactory for a basic scenario without new loads (EVs and HPs) and eight scenarios with varying penetration levels of these loads. For the first time in the literature, the findings of this study provide DSOs with a systematic overview, since they are able to identify at what load and where in their structures critical effects are to be expected that require action by assigning their topologies to one of our three representative LV grids. The voltage and line/transformer loadings were used to compare the behavior of the three grid regions. In this regard, Table 11 summarizes the most resilient and most vulnerable LV grids for each grid’s bottleneck in accordance with the simulation findings.
The suburban grid suffered the most from the EV and HP penetrations since all of the bottlenecks went beyond their acceptable thresholds more quickly than those in the other grid regions. On the contrary, the urban grid proved to be the most resilient network in cases of voltage violation and transformer overloading due to its ability to handle a greater percentage of loads compared to the other grids. Finally, the rural grid ranked second on the list because it experienced the least problem of line overloading. Furthermore, the results indicated that voltage stability was the primary problem in integrating new loads into all three grid regions.
It is challenging to predict, with precision, when (or in what timeframe) such critical penetration is likely to be attained since it depends on a variety of factors, such as political goals and decisions, infrastructure development, the advancement of EV technologies and their prices, user acceptance, etc. On the other hand, since German distribution network planning is based on medium- to long-term estimations of the transmitted electrical power, most of the existing networks were not designed to supply the extra energy required for EV charging procedures and HPs. Hence, it is imperative that DSOs have pre-planned strategies and solutions in place for when network-related problems occur.

Author Contributions

Conceptualization, P.F. and V.P.; Data curation, P.F. and V.P.; Formal analysis, P.F.; Investigation, P.F.; Methodology, P.F.; Project administration, V.P. and B.S.; Resources, P.F.; Software, P.F.; Supervision, V.P. and B.S.; Validation, V.P.; Visualization, P.F.; Writing—original draft, P.F.; Writing—review an editing, P.F., V.P. and B.S. All authors have read and agreed to the published version of the manuscript.

Funding

This paper was developed as part of the accompanying scientific research of the project “Electric City Russelsheim: Development of a low-energy charging infrastructure for the city of Rus-selsheim am Main” and thus funded by the “Immediate Clean Air Program 2017–2020” of the German Federal Ministry for Economic Affairs and Climate Action [grants number FKZ: 01MZ18008B].

Data Availability Statement

All data generated or analyzed during this study are included in this published article.

Acknowledgments

The authors would like to thank Syna GmbH and especially M. Eng. Rebecca Hentrich for providing evaluated LV grid data.

Conflicts of Interest

The authors declare no conflicts of interest.

References

  1. The German Federal Government. Intergenerational Contract for the Climate. Available online: https://www.bundesregierung.de/breg-de/themen/klimaschutz/climate-change-act-2021-1936846 (accessed on 9 January 2024).
  2. The German Federal Ministry for the Environment, Nature Conservation, Nuclear Safety and Consumer Protection. Greenhouse Gas Emissions Fell 8.7 Percent in 2020. Available online: https://www.bmuv.de/en/pressrelease/greenhouse-gas-emissions-fell-87-percent-in-2020 (accessed on 9 January 2024).
  3. The German Federal Government. Not Moving Less, but Moving Differently. Available online: https://www.bundesregierung.de/breg-de/themen/klimaschutz/eenergie-und-mobilitaet/nachhaltige-mobilitaet-2044132 (accessed on 9 January 2024).
  4. Fraunhofer IWES/IBP. Heat Transition 2030—Key Technologies for Reaching the Intermediate and Long-Term Climate Targets in the Building Sector; Agora Energiewende: Berlin, Germany, 2017. [Google Scholar]
  5. The German Federal Ministry for Economic Affairs and Climate Action. Our Electricity Market for the Energy Transition. Available online: https://www.bmwk.de/Redaktion/DE/Dossier/strommarkt-der-zukunft.html (accessed on 9 January 2024).
  6. The German Federal Network Agency. Electromobility: Public Charging Infrastructure. Available online: https://www.bundesnetzagentur.de/DE/Fachthemen/ElektrizitaetundGas/E-Mobilitaet/start.html (accessed on 9 January 2024).
  7. The German Federal Government. New Subsidies for Charging Infrastructure. Available online: https://www.bundesregierung.de/breg-de/suche/ladeinfrastruktur-foerderung-2199410 (accessed on 9 January 2024).
  8. EnBW Energie Baden-Württemberg, AG. Wallbox Funding in 2023/24: Here’s How. Available online: https://www.enbw.com/blog/elektromobilitaet/laden/foerderung-fuer-wallboxen-was-wie-gefoerdert-wird/ (accessed on 9 January 2024).
  9. Thormann, B.; Kienberger, T. Evaluation of grid capacities for integrating future e-mobility and heat pumps into low-voltage grids. Energies 2020, 13, 5083. [Google Scholar] [CrossRef]
  10. Sudhoff, R.; Schreck, S.; Thiem, S.; Niessen, S. Achieving grid-friendly operation of renewable energy communities through smart usage of electric vehicle charging and flexibilities. In Proceedings of the CIRED Porto Workshop 2022: E-Mobility and Power Distribution Systems, Porto, Portugal, 2–3 June 2022; pp. 103–107. [Google Scholar] [CrossRef]
  11. Bernards, R.; Van Westering, W.; Morren, J.; Slootweg, H. Analysis of energy transition impact on the low-voltage network using stochastic load and generation models. Energies 2020, 13, 6097. [Google Scholar] [CrossRef]
  12. Wintzek, P.; Ali, S.A.; Kotthaus, K.; Wruk, J.; Zdrallek, M.; Monscheidt, J.; Gemsjäger, B.; Slupinski, A. Application and evaluation of load management systems in urban low-voltage grid planning. World Electr. Veh. J. 2021, 12, 91. [Google Scholar] [CrossRef]
  13. Gupta, R.; Pena-Bello, A.; Streicher, K.N.; Roduner, C.; Farhat, Y.; Thöni, D.; Patel, M.K.; Parra, D. Spatial analysis of distribution grid capacity and costs to enable massive deployment of PV, electric mobility and electric heating. Appl. Energy 2021, 287, 116504. [Google Scholar] [CrossRef]
  14. Helm, S.; Hauer, I.; Wolter, M.; Wenge, C.; Balischewski, S.; Komarnicki, P. Impact of unbalanced electric vehicle charging on low-voltage grids. In Proceedings of the 2020 IEEE PES Innovative Smart Grid Technologies Europe (ISGT-Europe), The Hague, The Netherlands, 26–28 October 2020; pp. 665–669. [Google Scholar] [CrossRef]
  15. Birk, S.; Brosig, C.; Waffenschmidt, E.; Schneiders, T. Influence of Sector Coupling in Future Inner City Low Voltage Grids. In Proceedings of the 2018 7th International Energy and Sustainability Conference (IESC), Cologne, Germany, 17–18 May 2018; pp. 1–8. [Google Scholar] [CrossRef]
  16. Oliyide, R.O.; Marmaras, C.; Fasina, E.T.; Cipcigan, L.M. Low carbon technologies integration in smart low voltage network. In Proceedings of the 2017 IEEE 15th International Conference on Industrial Informatics (INDIN), Emden, Germany, 24–26 July 2017; pp. 462–467. [Google Scholar] [CrossRef]
  17. Srithapon, C.; Månsson, D. Predictive control and coordination for energy community flexibility with electric vehicles, heat pumps and thermal energy storage. Appl. Energy 2023, 347, 121500. [Google Scholar] [CrossRef]
  18. Bhattacharyya, S.; Wijnand, M.; Slangen, T. Estimating the future impact of residential EV loads on low voltage distribution networks. In Proceedings of the CIRED Porto Workshop 2022: E-Mobility and Power Distribution Systems, Porto, Portugal, 2–3 June 2022; pp. 128–132. [Google Scholar] [CrossRef]
  19. Sengor, I.; Mehigan, L.; Zehir, M.A.; Cuenca, J.J.; Geaney, C.; Hayes, B.P. Voltage constraint-oriented management of low carbon technologies in a large-scale distribution network. J. Clean. Prod. 2023, 408, 137160. [Google Scholar] [CrossRef]
  20. Damianakis, N.; Mouli, G.R.C.; Bauer, P.; Yu, Y. Assessing the grid impact of Electric Vehicles, Heat Pumps & PV generation in Dutch LV distribution grids. Appl. Energy 2023, 352, 121878. [Google Scholar] [CrossRef]
  21. Oliyide, R.O.; Cipcigan, L.M. The impacts of electric vehicles and heat pumps load profiles on low voltage distribution networks in Great Britain by 2050. Int. Multidiscip. Res. J. 2021, 11, 30–45. [Google Scholar] [CrossRef]
  22. Edmunds, C.; Galloway, S.; Dixon, J.; Bukhsh, W.; Elders, I. Hosting capacity assessment of heat pumps and optimised electric vehicle charging on low voltage networks. Appl. Energy 2021, 298, 117093. [Google Scholar] [CrossRef]
  23. DIgSILENT PowerFactory; Version 2023; DIgSILENT GmbH: Gomaringen, Germany, 2023.
  24. DIN EN 50160/A1:2016-02; Voltage Characteristics of Electricity Supplied by Public Networks. DIN e.V.: Berlin, Germany, 2016.
  25. DIgSILENT PowerFactory (Version 2023)–User Manual; DIgSILENT GmbH: Gomaringen, Germany, 2023.
  26. Wintzek, P.; Ali, S.A.; Monscheidt, J.; Gemsjäger, B.; Slupinski, A.; Zdrallek, M. Planning and Operating Principles for Urban Distribution Networks—Guide to Aligning Networks to Their Future Requirements; Bergische Universität Wuppertal and Siemens AG: Wuppertal, Germany, 2021. [Google Scholar]
  27. Fakhrooeian, P.; Hentrich, R.; Pitz, V. Maximum Tolerated Number of Simultaneous BEV Charging Events in a Typical Low-Voltage Grid for Urban Residential Area. World Electr. Veh. J. 2023, 14, 165. [Google Scholar] [CrossRef]
  28. German Federal Ministry of Transport and Digital Infrastructure (BMVI). Regional Statistical Spatial Typology for Mobility and Transport Research. Available online: https://bmdv.bund.de/SharedDocs/DE/Anlage/G/regiostar-raumtypologie.pdf?__blob=publicationFile (accessed on 9 January 2024).
  29. VDE FNN Study: Determination of Simultaneity Factors for Charging Processes at Private Charging Points; Forum Netztechnik/Netzbetrieb im VDE (FNN): Berlin, Germany, 2021.
Figure 1. Single line diagram of the typical German urban grid.
Wevj 15 00049 g001
Figure 2. Single line diagram of the typical German suburban grid.
Wevj 15 00049 g002
Figure 3. Single line diagram of the typical German rural grid.
Wevj 15 00049 g003
Figure 4. Comparison of maximum line loadings of urban grid feeders based on scenarios, considering the following: (a) 11 kW chargers; (b) 22 kW chargers.
Wevj 15 00049 g004
Figure 5. Comparison of minimum voltage of urban grid feeders based on scenarios, considering the following: (a) 11 kW chargers; (b) 22 kW chargers.
Wevj 15 00049 g005
Figure 6. Comparison of maximum line loadings of suburban grid feeders based on scenarios, considering the following: (a) 11 kW chargers; (b) 22 kW chargers.
Wevj 15 00049 g006
Figure 7. Comparison of minimum voltage of suburban grid feeders based on scenarios, considering the following: (a) 11 kW chargers; (b) 22 kW chargers.
Wevj 15 00049 g007
Figure 8. Comparison of maximum line loadings of rural grid feeders based on scenarios, considering the following: (a) 11 kW chargers; (b) 22 kW chargers.
Wevj 15 00049 g008
Figure 9. Comparison of minimum voltage of rural grid feeders based on scenarios, considering the following: (a) 11 kW chargers; (b) 22 kW chargers.
Wevj 15 00049 g009
Figure 10. Comparison of transformers maximum loadings in the urban, suburban, and rural grids for Scenarios #2 to #9 based on two EV charging rates.
Wevj 15 00049 g010
Table 1. Characteristics of feeders in a typical German urban LV grid.
FeederLength (m)House Connections (3 Units Each)Aluminum Conductor Cross-Section (mm2)
12007150
22508150
33009150
43009240
5100 + 1003 + 4 = 7150
6100 + 2003 + 6 = 9150
7100 + 1003 + 4 = 7240
8100 + 2003 + 6 = 9240
Table 2. Characteristics of feeders in a typical German suburban LV grid.
FeederLength (m)House Connections (2.6 Units Each) Conductor Cross-Section (mm2)
12005150
23007150
34009150
44009240
5300770
6100 + 1002 + 3 = 5150
7100 + 3002 + 7 = 9150
8100 + 1002 + 3 = 5240
9100 + 3002 + 7 = 9240
Table 3. Characteristics of feeders in a typical German rural LV grid.
FeederLength (m)House Connections (2 Units Each)Conductor Cross-Section (mm2)
12304150
23306150
34308150
44308240
5330670
6100 + 1302 + 2 = 4150
7100 + 3302 + 6 = 8150
8100 + 1302 + 2 = 4240
9100 + 3302 + 6 = 8240
Table 4. Case studies for the Low Voltage Load Flow Calculations.
ScenarioResidential Loads Penetration Level (%)EV Penetration Level (%)HP Penetration Level (%)
#110000
#2100250
#3100500
#4100750
#51001000
#61002510
#71005020
#81007530
#910010040
Table 5. The maximum loading, voltage, and total load of feeders in the urban LV grid for Scenario #1.
Scenario #1Max. Loading (%)Min. Voltage (p.u.)Total Load (kW)
Feeder 125.40.98247.3
Feeder 228.30.98152.6
Feeder 331.10.97857.8
Feeder 423.50.98457.8
Feeder 5270.98093.6
Feeder 6270.98093.6
Feeder 720.40.98593.6
Feeder 820.40.98593.6
Table 6. The maximum loading, voltage, and total load of feeders in the suburban LV grid for Scenario #1.
Scenario #1Max. Loading (%)Min. Voltage (p.u.)Total Load (kW)
Feeder 117.740.98233
Feeder 222.620.97842
Feeder 328.370.97152.6
Feeder 421.410.97852.6
Feeder 529.920.96542
Feeder 623.630.97275
Feeder 723.630.97275
Feeder 817.830.9875
Feeder 917.830.9875
Table 7. The maximum loading, voltage, and total load of feeders in the rural LV grid for Scenario #1.
Scenario #1Max. Loading (%)Min. Voltage (p.u.)Total Load (kW)
Feeder 113.320.98624
Feeder 216.740.98231
Feeder 320.690.97738
Feeder 415.620.98438
Feeder 522.140.97231
Feeder 616.760.97953
Feeder 716.760.97953
Feeder 812.650.98553
Feeder 912.650.98553
Table 8. Maximum loading of transformers for Scenario #1.
Grid RegionTransformer Rated Power (kVA)Max. Loading (%)
Urban grid63053.6
Suburban grid40074.67
Rural grid40050.41
Table 9. An overview of the weakest and strongest structures for each bottleneck in the suburban grid.
With 11 kW ChargersWith 22 kW Chargers
The Suburban Grid’s BottlenecksFeederThe First Violation in Scenarios
Voltage (in the weakest structure)#5 (70 mm2 overheadline)#2, #6#2, #6
Voltage (in the strongest structure)#1 (150 mm2 cable)No Violation, #8#3, #7
Line overloading (in the weakest structure)#5 (70 mm2 overheadline)No Violation, #8#3, #6
Line overloading (in the strongest structure)#8–9 (240 mm2 cables)No ViolationNo Violation, #9
Transformer overloading#3, #6#2, #6
Table 10. An overview of the weakest and strongest structures for each bottleneck in the rural grid.
With 11 kW ChargersWith 22 kW Chargers
The Rural Grid’s BottlenecksFeeder The First Violation in Scenarios
Voltage (in the weakest structure)#5 (70 mm2 overheadline)#2, #6#2, #6
Voltage (in the strongest structure)#1 (150 mm2 cable)No Violation, #8#5, #7
Line overloading (in the weakest structure)#5 (70 mm2 overheadline)No Violation, #9#5, #7
Line overloading (in the strongest structure)#8–9 (240 mm2 cables)No ViolationNo Violation
Transformer overloadingNo Violation, #7#4, #7
Table 11. An overview of the LV grids’ robustness for each bottleneck.
Voltage ViolationLine OverloadingTransformer Overloading
The most vulnerable grid regionSuburban Suburban Suburban
The most resilient grid regionUrbanRuralUrban
Disclaimer/Publisher’s Note: The statements, opinions and data contained in all publications are solely those of the individual author(s) and contributor(s) and not of MDPI and/or the editor(s). MDPI and/or the editor(s) disclaim responsibility for any injury to people or property resulting from any ideas, methods, instructions or products referred to in the content.

