1. Introduction
Conventional oil-fueled vehicles have exacerbated the oil/energy crisis and air pollution. Automotive energy and environmental issues are major problems faced by the traditional automotive industry. In order to solve such problems, vigorously promoting the development of electric vehicles (EVs) has become an inevitable choice. However, due to the current limitations of battery range and charging technology, there are still some challenges in the actual use of electric vehicles.
Range anxiety: Users’ range anxiety due to inexperience, cold weather, or unexpected conditions on the road prevents them from accurately predicting the state of charge (SOC), and the accessibility of their destination makes them less inclined to choose EVs for travel.
Long charging time: The charging of EVs is often time-consuming, and the charging costs are also expensive, especially at peak charging times, such as during holidays, because the load on the grid is large and uneven. In addition, charging during peak hours increases the queuing time, resulting in greater charging time and costs.
Insufficient charging infrastructure: At present, the construction of charging infrastructure is in the planning and development stage, which restricts the increase in EV ownership. In particular, the charging demand is too high during holidays, and the uneven load on the power grid or damage of the charging piles causes inconveniences to the use of electric vehicles, thus causing more charging anxiety among users.
In order to deal with these issues, it is especially important to propose an effective scheme to induce users to choose a suitable charging station to charge their vehicles. On the one hand, it should be timely to induce users to charge and prevent them from running out of power during their trip, and on the other hand, it should help users to select a charging station according to the existing charging facilities while avoiding queues, considering personal needs, reducing travel costs, and improving the travel experience. Based on the full consideration of users’ multi-dimensional preferences, this study calculated the preference degree of different charging stations according to the demand characteristics to provide suitable charging guidance solutions for electric vehicle users. A multi-objective optimization model with the lowest comprehensive cost for the user was established to provide a charging strategy that reduces the user’s range anxiety and charging anxiety by considering the user’s multi-dimensional preferences and guides the user to choose the best charging station. The research on EV charging optimization in this paper not only provides a theoretical basis for further popularization of EVs in the future, but also has practical application value in encouraging users to choose EVs as a travel method more often. With charging guidance service as the goal, this study established charging station guidance algorithms, models, and schemes for multi-dimensional user preferences in real-world situations, which have far-reaching practical significance for improving the efficiency of electric vehicle travel and alleviating users’ range anxiety. By considering the user’s multi-dimensional preferences, the model recommends suitable charging stations for the user and potential patronage for underutilized charging stations. In addition, it provides planners of charging station construction with a more meaningful reference direction for the development of a charging station network.
The remaining portions of this paper are organized as follows.
Section 2 presents a literature review. In
Section 3 we calculate the similarity of different charging stations using a collaborative filtering algorithm, and the basis for constructing a multi-objective optimization model is established in
Section 4.
Section 5 presents a simulation scenario to verify the model algorithm’s ability to provide the optimal charging induction scheme for users. At the end,
Section 6 provides the conclusions and directions for future research.
2. Literature Review
In the whole travel charging process, the preference habits of EV users directly affect their choice of charging stations. Therefore, it is necessary to consider users’ preferences in charging guidance strategies. Several studies have investigated the charging preferences of the different types of EV users. Among them, Sun et al. [
1], Anderson et al. [
2], and Xu et al. [
3] used surveys to analyze users’ charging preferences in depth. On the other hand, Erdem et al. [
4] introduced time window constraints to solve and validate users preferences using heuristic algorithms by considering different charging states and charging strategies of vehicles at multiple charging stations. Zhao et al. [
5] and Wen et al. [
6] identified two influencing factors, tariffs and charging premiums, based on these studies of user preferences. Hu et al. [
7] analyzed users’ attitudes and preferences under risky situations. Ashkrof et al. [
8] and Li et al. [
9] analyzed and studied the various preferences of users by building a mixture model.
On the other hand, some studies have investigated different kinds of EV users’ charging preferences in depth. Among them, Hu et al. [
10] and Erdogan et al. [
11] analyzed the charging preferences of different types of EV users in terms of EV trajectory data and charging infrastructure optimization, respectively. Zakariazadeh et al. [
12], Das et al. [
13], Guang et al. [
14], and Zhang et al. [
15] studied the charging preferences of different classes of users to optimize EV charging and discharging strategies to alleviate the pressure on the grid during peak hours. Both Shi et al. [
16] and Deb et al. [
17] improved the modelling of user preference for charging stations by optimizing the deployment scheme of EV fast charging stations. The studies by Chen et al. [
18], Wang et al. [
19], Sarker et al. [
20], and improved the modelling of user preferences for charging stations as a multi-objective optimization problem considering different user preferences to determine the optimal charging scheme. Globisch et al. [
21] analyzed the factors affecting charging station preferences by studying different types of potential EV users to optimize the construction planning of future charging stations. Studies by Zhang et al. [
22], Huang et al. [
23], Xu et al. [
24] all integrated the information of charging station locations, road networks, and power grids into the same diagram, and found that reasonable charging guidance for EVs could not only adequately coordinate the distribution of charging loads, but also relieve some of the traffic pressure. Zhang et al. [
25] further formed a complete charging guidance method, and the effectiveness and efficiency of the method were verified in a large city. However, none of these studies really take the user’s own multidimensional preferences into account for charging from the user’s perspective.
In summary, most of the existing literature on how to reduce the travel costs for EV users (similar and different types of users) has focused on optimizing the total travel distance and reducing the total travel costs, ignoring the multi-dimensional preferences of users for EV charging stations. In reality, users’ preferences for EV charging stations are often formed by considering multi-dimensional cost objectives such as range anxiety caused by remaining battery power, capacity limitation of charging stations, and charging time period, which can have a considerable impact on their final decision in choosing a charging station. In this study, based on these multi-dimensional preferences of users, we established a multi-objective charging optimization model and determined the optimal solution to provide EVs users with an effective charging guidance scheme. Based on the existing user travel path planning method, this study integrated the multi-dimensional preferences of users, including preferences for charging stations and each target cost, and built a model, helping users make charging decisions, improving user experience, and providing a theoretical basis for further popularization of electric vehicles in the future.
3. User Preference Analysis
With the popularity of electric vehicles, and to further improve users’ travel satisfaction, when providing users with charging guidance solutions, only considering the users’ travel costs does not accurately reflect users’ diverse needs, which may lead to users not being satisfied with the selected charging stations and a negative user experience. Collaborative filtering algorithms are one of the more commonly used recommendation algorithms. In this study, we relied on the user’s historical selection data for charging stations to determine the relationship between the user and a specific charging station. This allows us to recommend not only the user’s previously preferred charging stations, but also potential preferred charging stations for similar types of users. In this section, a preference model is established based on the user’s behavior when it comes to choosing charging stations using a collaborative filtering algorithm to analyze the user’s preference degree for charging stations and to lay the foundation for the establishment of the subsequent multi-objective optimization model.
3.1. Collaborative Filtering Algorithm
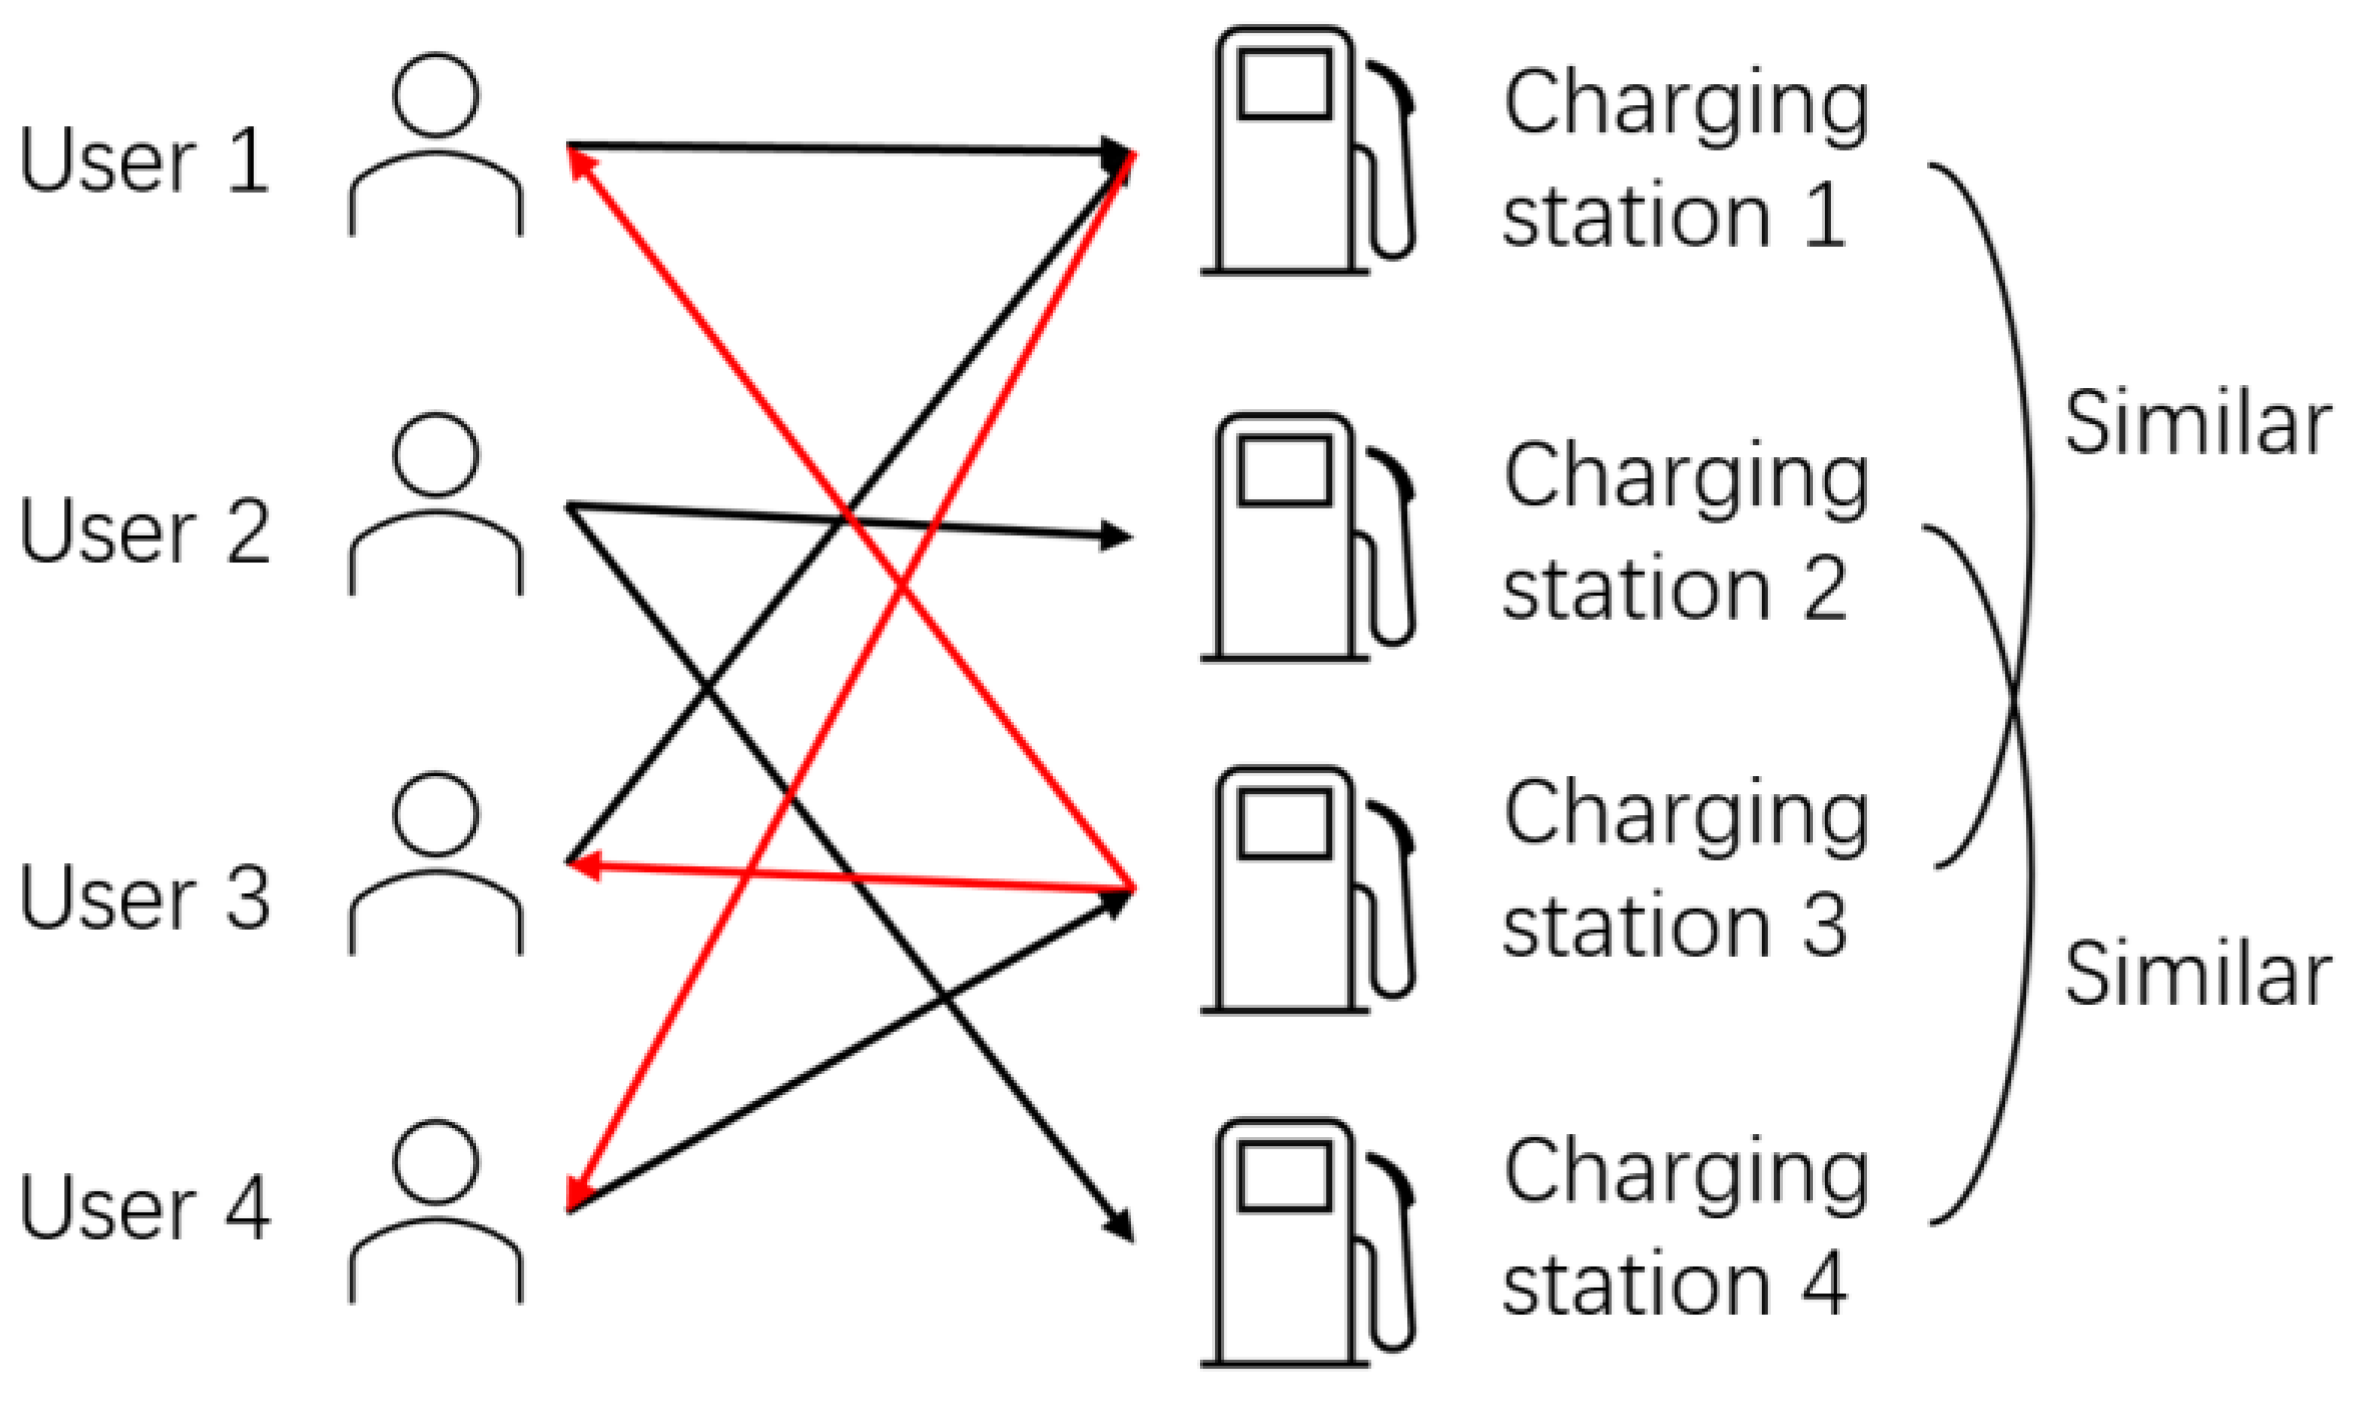
Collaborative filtering algorithms can help users discover potential but undiscovered charging stations. Depending on the object, this algorithm can usually be divided into user-based and item-based collaborative filtering. In this study, we considered the relationship between users and charging stations; therefore, the objects of study are the EV users and charging stations. The charging station-based collaborative filtering is based on the set of charging stations that the users are interested in and recommends other similar charging stations in the set to users by analyzing the similarity between different charging stations. The core principle of the algorithm is that similar charging stations have the same attractiveness to the same users. The schematic diagram of the collaborative filtering mechanism based on charging stations is given in
Figure 1.
3.2. Modeling of User Preferences for Charging Stations
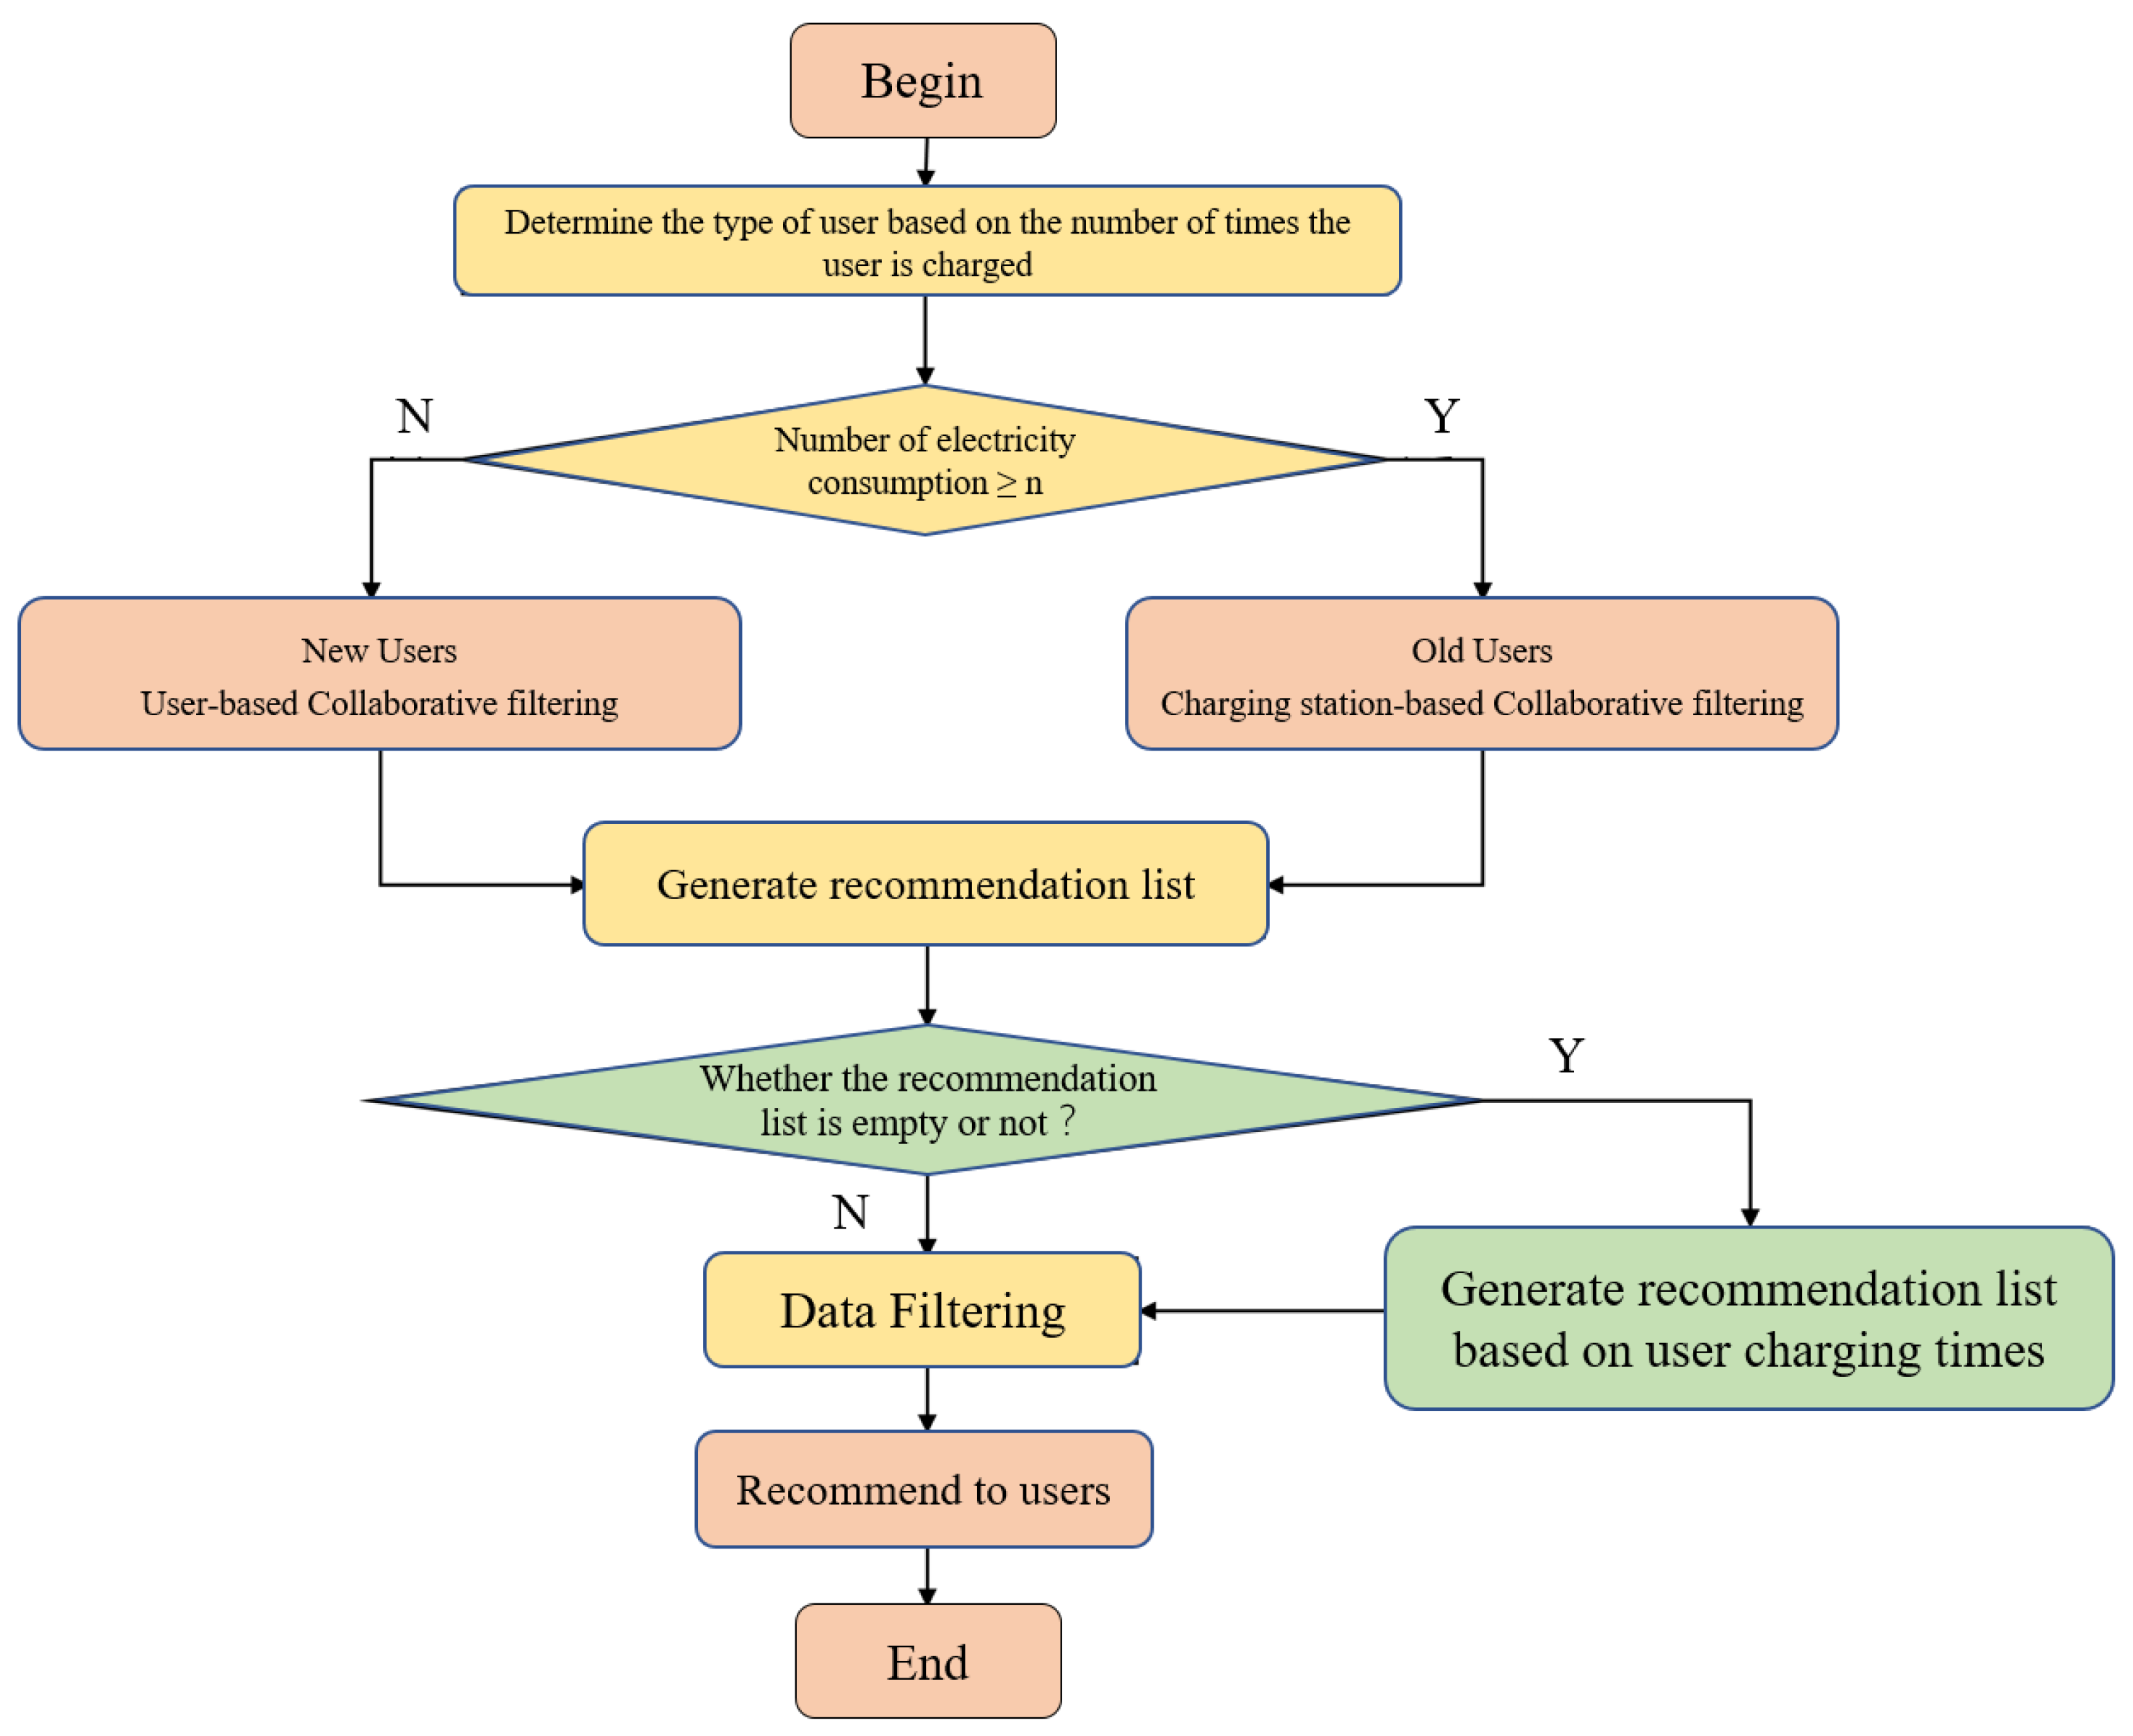
The charging station preference model established in this study was constructed based on the user’s charging record, which mainly describes the correspondence between the user and the charging station and indicates the charging station selected by the user in one charging decision and maps the data into the number of times the user charges at each charging station as a feature quantity to facilitate the subsequent algorithm development. For experienced EV users, they often choose certain fixed charging stations, and the accuracy of recommendation results is higher due to clear behavioral habits. In terms of the number of users and charging stations, the number of the latter is much smaller than the number of the former, so the collaborative filtering algorithm based on charging stations was chosen. For new users of electric vehicles, their charging habits are not yet fixed, and they rarely choose a fixed charging station for charging, so the model needs to maintain and update the similarity between charging stations frequently.
Based on the above analysis, the collaborative filtering algorithm was applied to the charging station selection preference, and its recommendation process is shown in
Figure 2.
Based on the above analysis of the charging station selection recommendation process, the charging station preference model was designed.
Through the various similarity calculation methods and the analysis of the recommended process, the Pearson correlation coefficient method was used to calculate the similarity of charging stations and users, and the similarity of charging stations
i and
j is calculated using Equation (1):
Similarly, for user
x and user
y the similarity is calculated using Equation (2):
- 2.
Feature extraction
In the preference model for charging station selection, the user’s rating value for the charging station is determined by the number of times the user has utilized that station. Based on the user’s charging records, the number of times the user has charged at each charging station is counted and provided to the model as a feature vector for similarity calculations. Based on this, the user’s charging data are processed and mapped to the number of times the user has charged at each charging station, i.e., the user’s rating value for the charging station. The results after processing are shown in
Table 1.
- 3.
Model Design
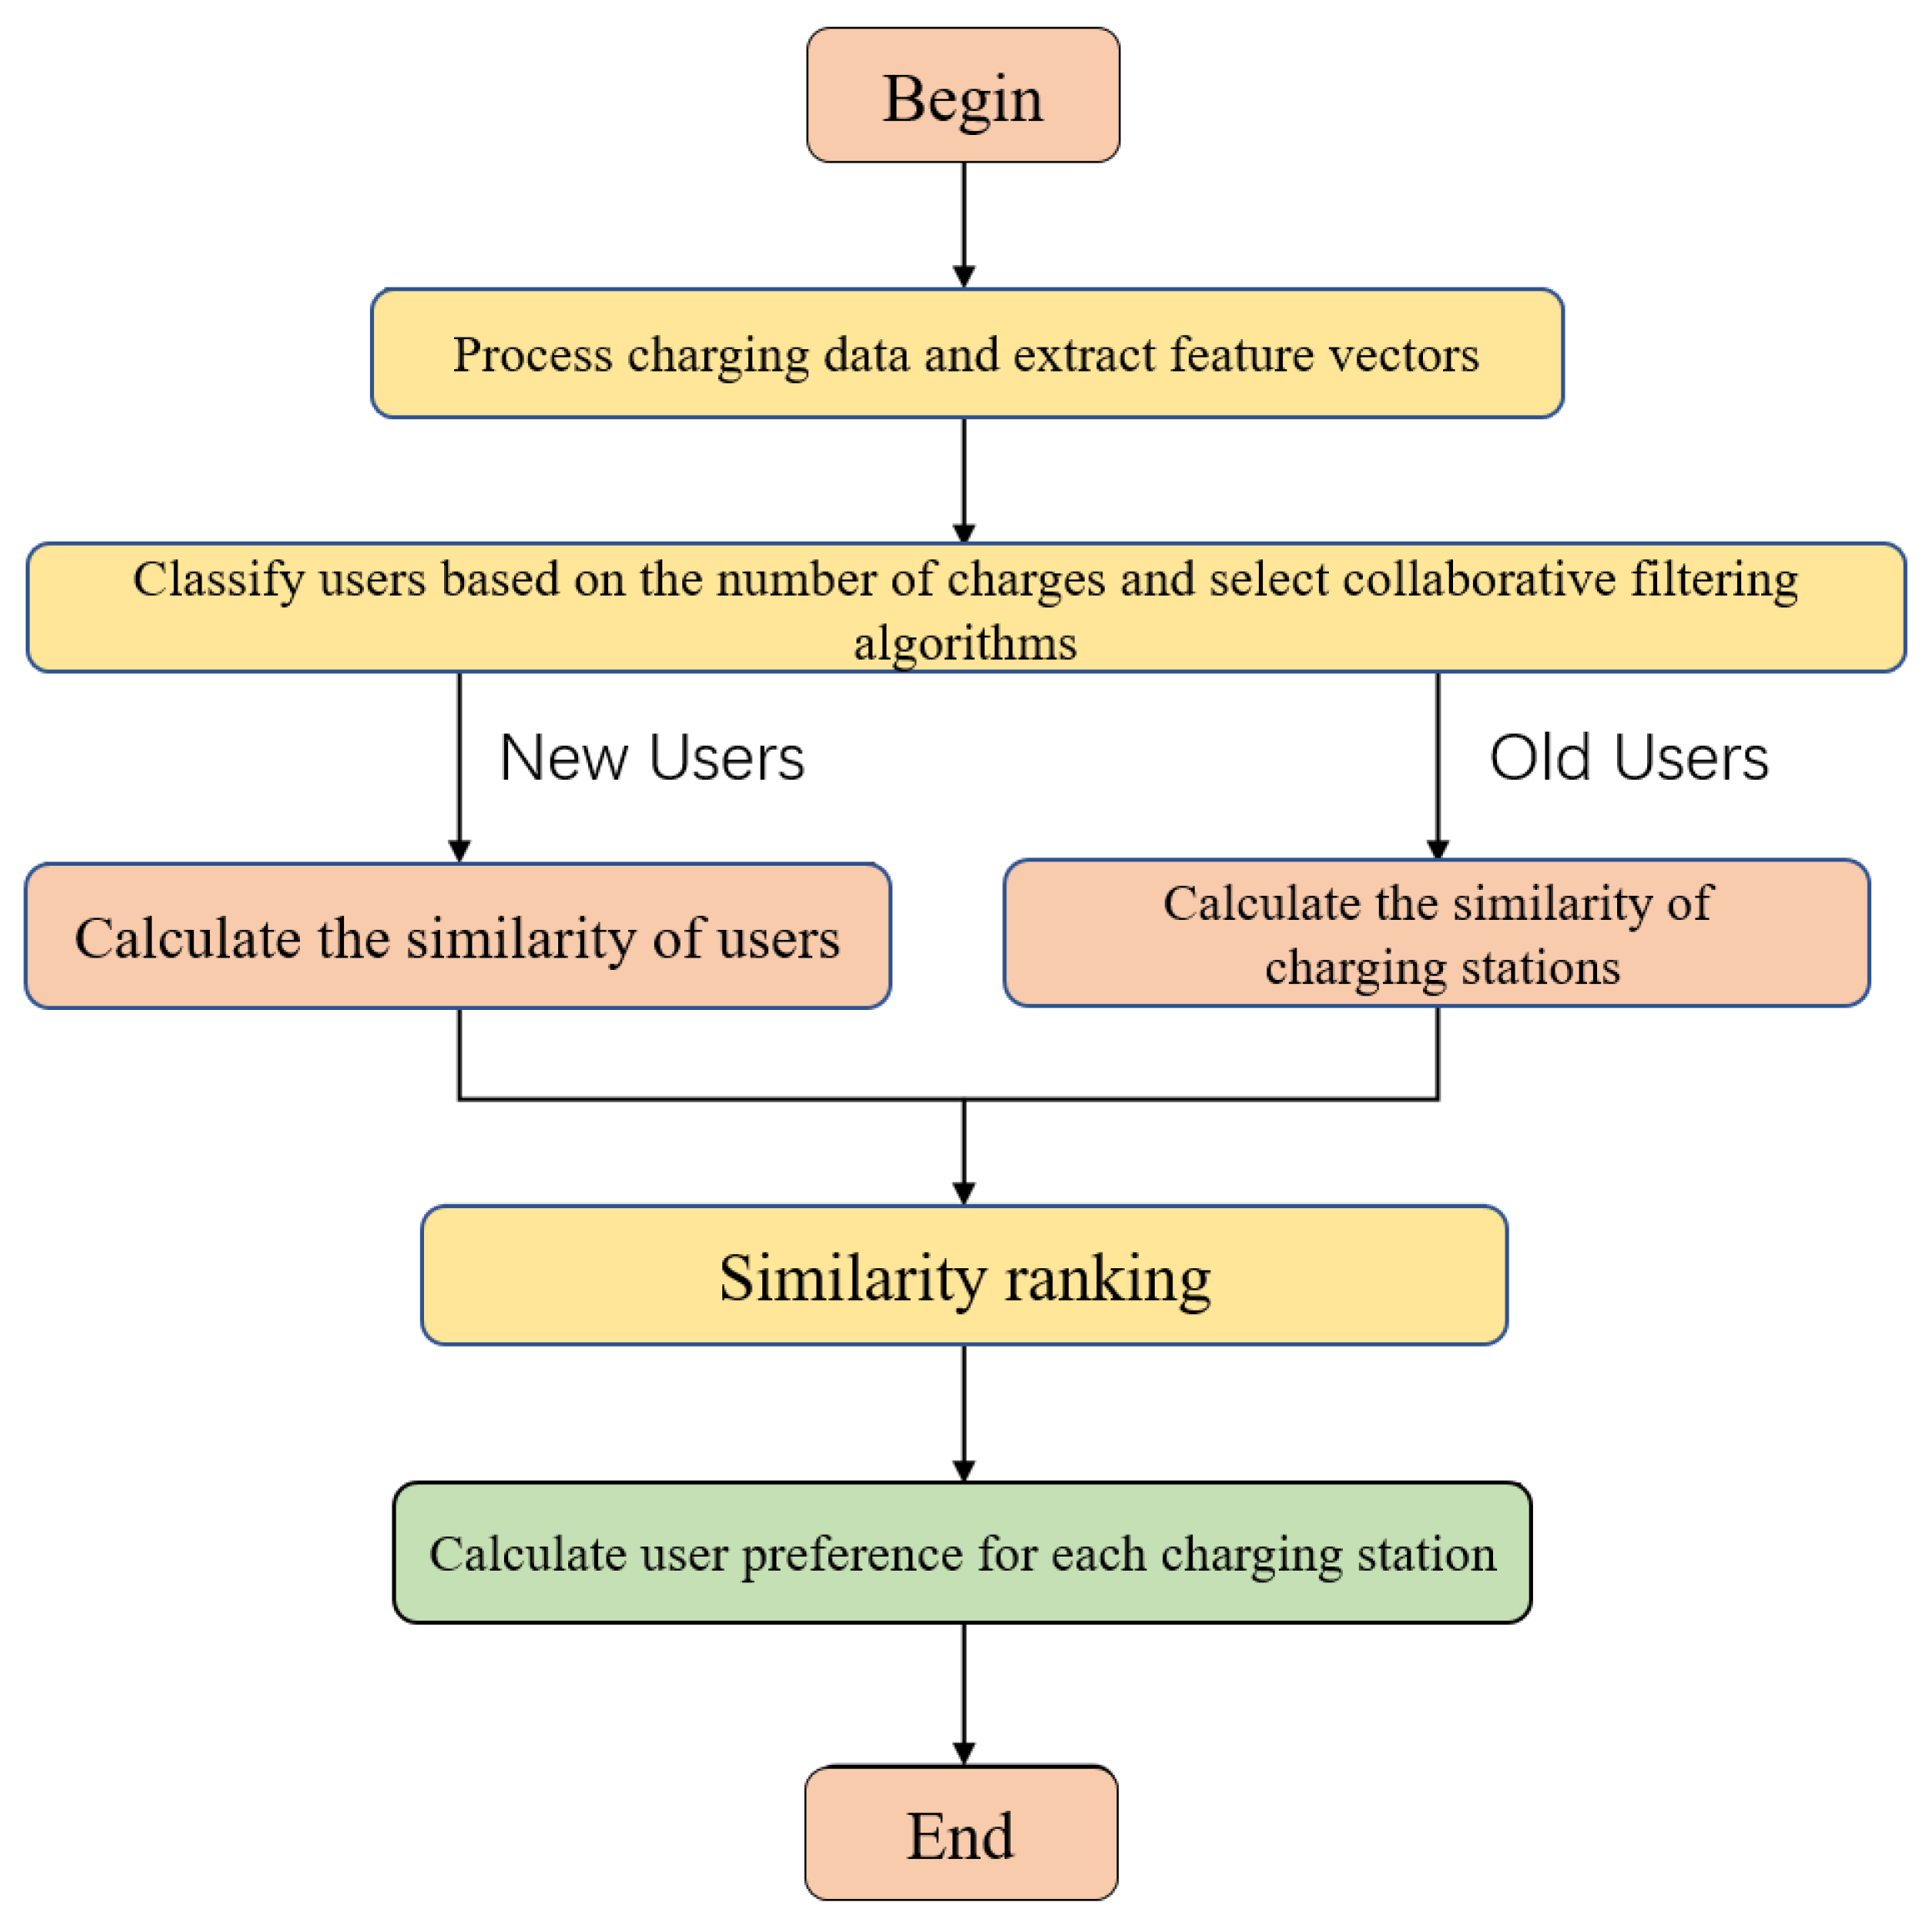
The users are classified according to the number of times they have charged, and the new and old users are used for preference calculations using user-based and charging station-based collaborative filtering, respectively. The modeling processing flow is given in
Figure 3.
The model first calculates the similarity based on the number of charging times of the users, and then uses the similarity to calculate the preference of the users for the research object (in this case, charging stations) to ensure that the model can recommend to the users both the preferred charging stations and other charging stations that may be of interest according to the preference habits of the users. As shown in
Figure 3, after the similarity calculation, the preference is calculated by finding the set of K objects with the highest similarity according to the K nearest neighbor principle. The detailed process is divided into two cases: for new users, given the number of neighbors of the target user, the set of users similar to the target user is determined by using the similarity calculation, and the user’s preference for charging stations is calculated using Equation (3):
Similarly, for older users, given the number of neighbors of the target charging station, the set of charging stations similar to the target charging station is determined by using the similarity calculation, and the preference based on collaborative filtering of charging stations is calculated using Equation (4):
4. Optimization Model for EV Charging Guidance
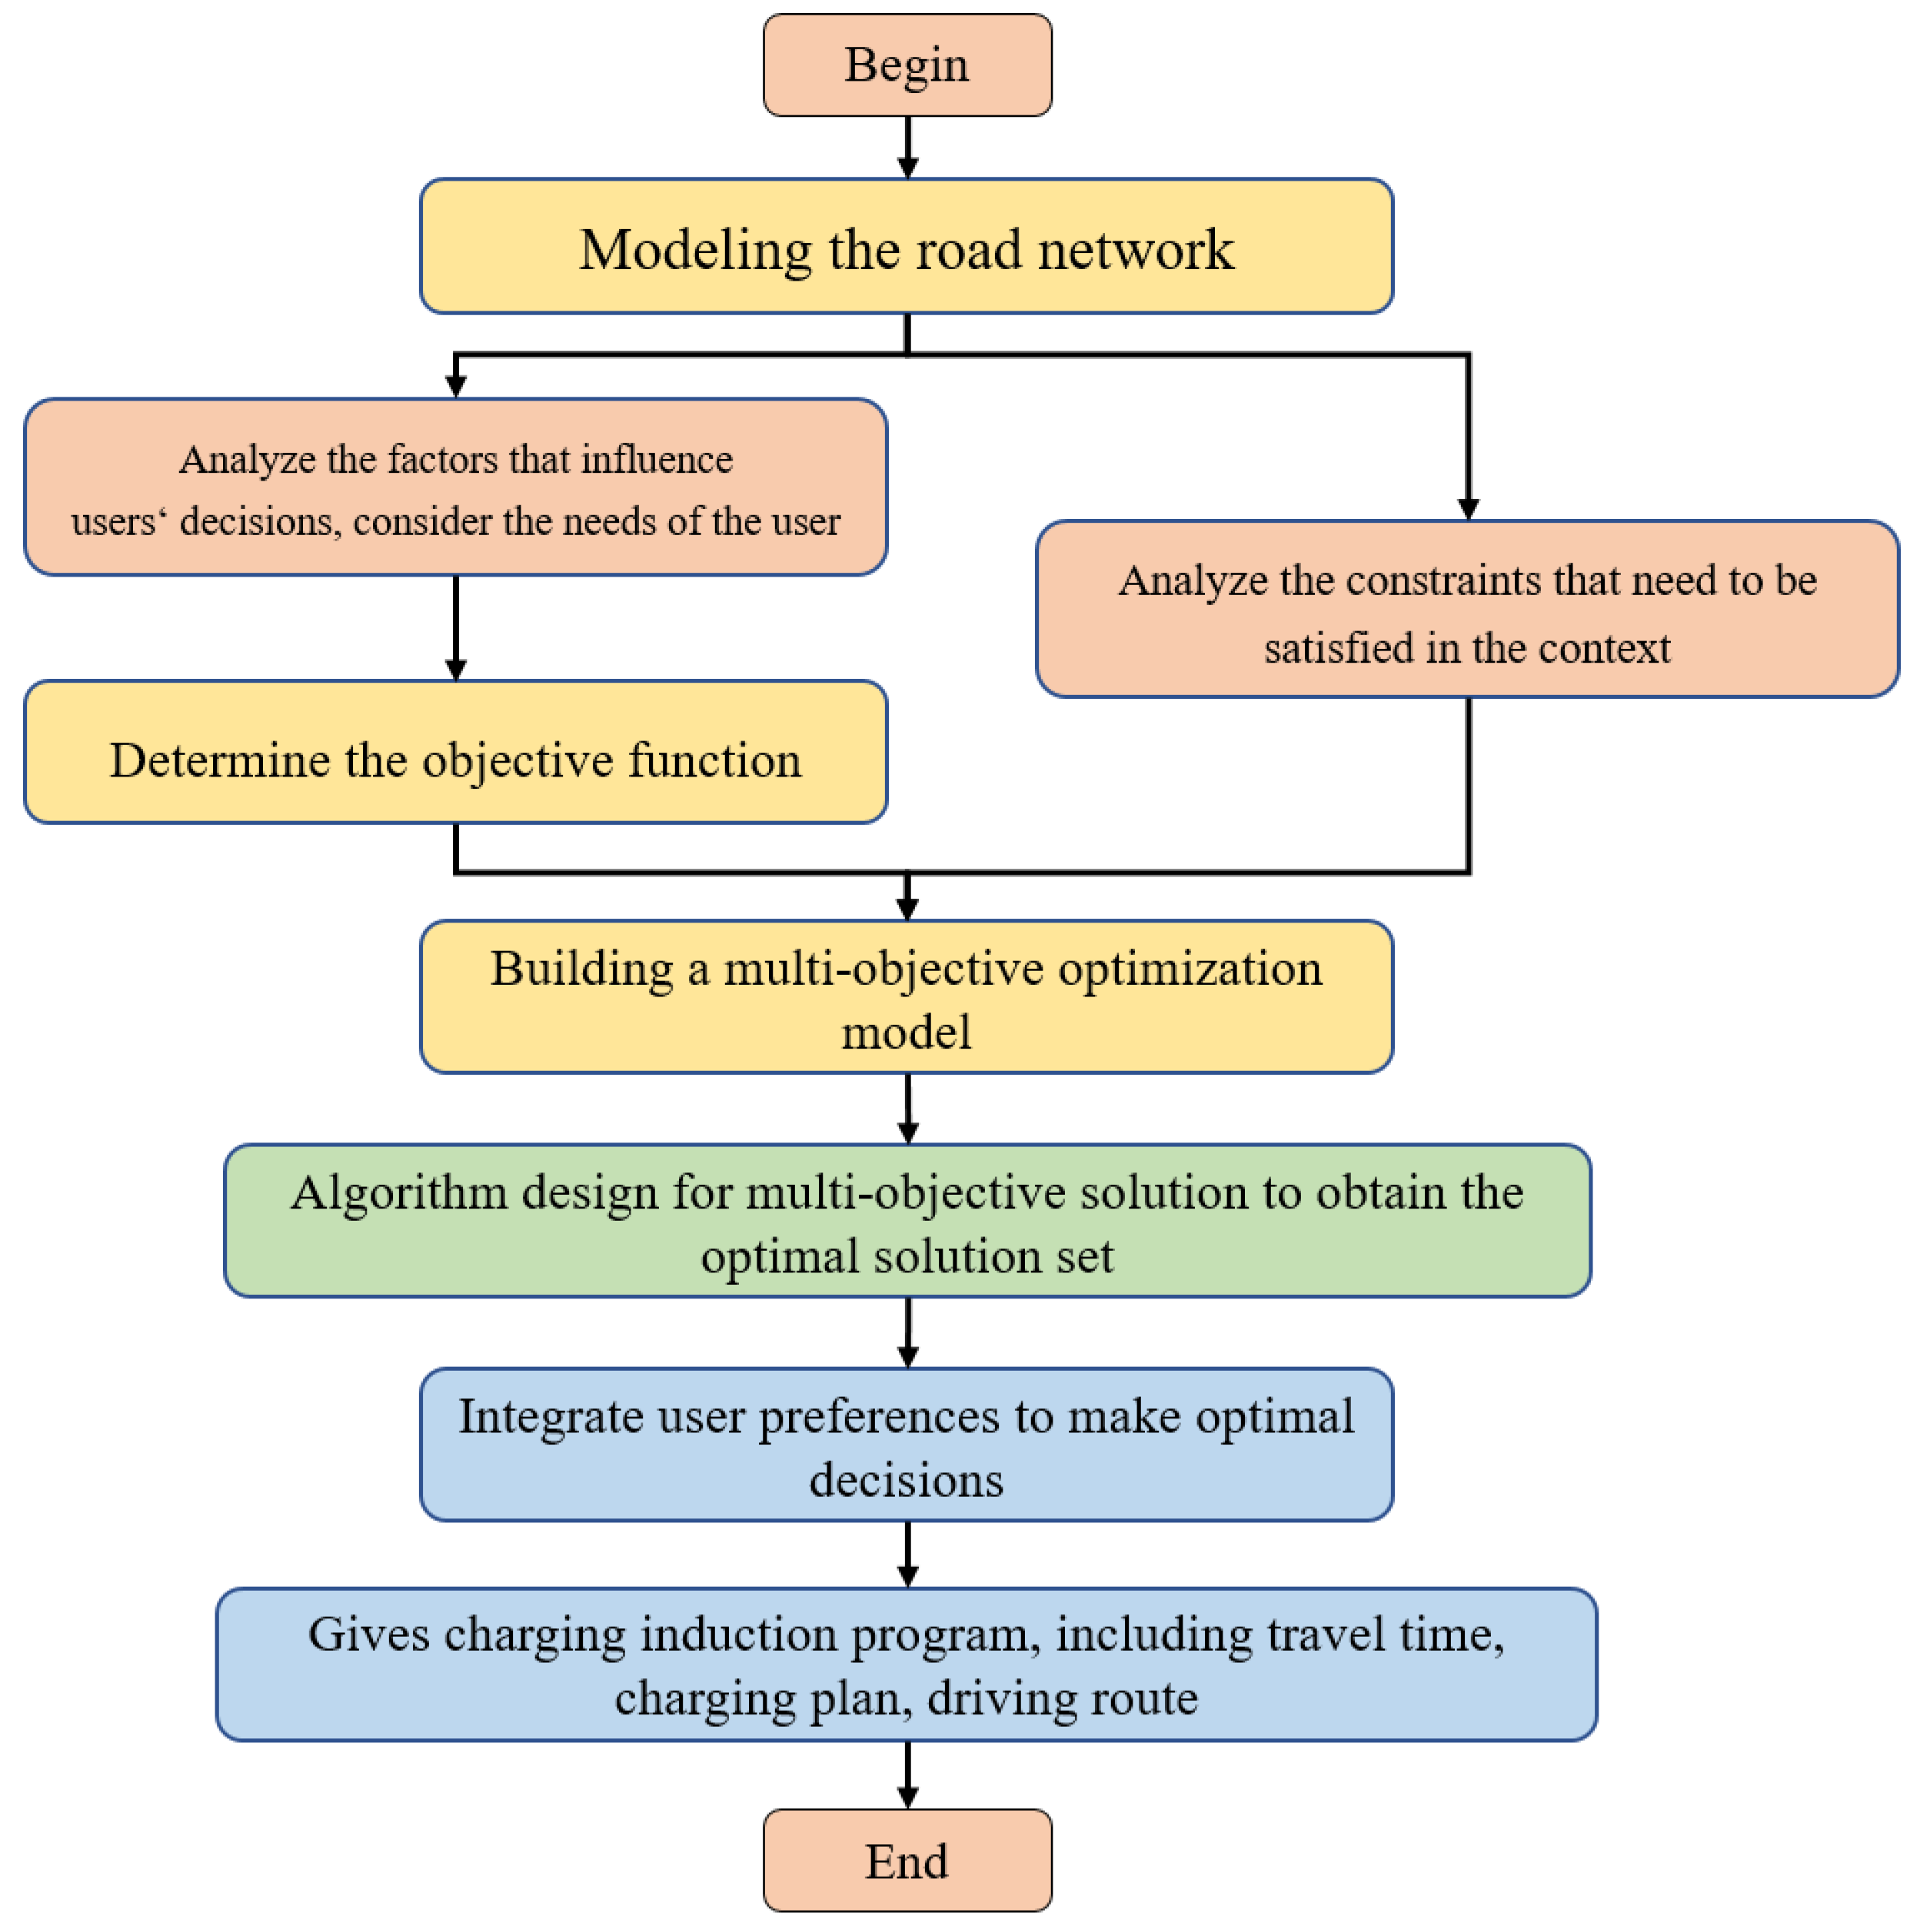
The use of electric vehicles has been expanding in recent years, and it is necessary to provide a reasonable charging guidance strategy to help users choose the optimal charging station from the user’s perspective. An efficient charging guidance strategy can effectively improve user satisfaction and thus promote the further development of electric vehicles in the future transportation system. The current research on electric vehicle users’ travel charging does not comprehensively consider the user’s preferences. This section details a model that combines the user’s preferences for charging stations and the user’s multi-dimensional preferences for targets in the previous section and considers the user’s personalized needs for multi-objective modeling to finally propose a reasonable charging guidance scheme to help users select the best charging station.
4.1. Basic Assumptions
The charging guidance scheme considers several factors, and for better subsequent model construction, the following assumptions were made to simplify and generalize the problem.
Assumption 1. The locations and number of charging stations are given in advance, because this study is concerned with charging guidance for EVs and does not discuss the distribution of charging stations.
Assumption 2. The charging power of each charging station is divided into fast charging and slow charging, and the choice of which mode depends on the user’s starting charging time. Charging time is an important factor influencing the user’s choice of charging station.
Assumption 3. Assuming that users know their charging needs, the destination they are traveling to, and the initial charge before departure, the charge rate is fixed regardless of when the user arrives at the charging station to charge, and each user leaves the charging station fully charged. This study only addresses the user’s preferences and does not address the time-of-day pricing of charging stations and partial charging strategies.
Assumption 4. Only charging requests generated at the user’s initial moment of departure are considered, and dynamic charging requests generated during the user’s trip are not considered; the user has, at most, only one charging request during the trip from the starting point to the end point, and since short trips within cities usually require only one charge, the need for multiple charges is very rare.
Assumption 5. The impact of uncertainties, such as weather or other unexpected events, is not considered during the trip, and the focus is only on energy consumption and travel time improvement due to the randomness of the speed during the electric vehicle trip.
4.2. Notations
Let be a directed graph consisting of a vertex set and an edge set . denotes the set of ordinary nodes at the starting and ending locations of electric vehicle users and charging stations in the road network, and denotes the set of directed, entitled, and connected road sections between nodes. Let and denote the subsets of the sets and , respectively. The main components of the charging service guidance scheme are described as follows.
Departure time: The departure time of the EV user from the starting point, obtained by solving the model.
Charging plan: Based on the full charging strategy, the optimal charging station is assigned to the user, which is obtained from the model solution.
Driving route: According to the determined optimal charging station, the corresponding route is given by the shortest path algorithm.
The overall idea of the guidance scheme considering users’ multi-dimensional preferences is shown in
Figure 4.
In order to facilitate the explanation of the proposed model, the variables used in the model are defined, which include decision variables and general variables. Let
denote one set of decision variables in the model, which indicates that user
i selects charging station
j for charging and takes a range of values from the set
, as expressed in Equation (5).
The other decision variable in the model is denoted as , which presents the time at which user i leaves the starting point.
We use a table to list the intermediate variables and parameters, which is detailed in
Appendix A at the end of the paper.
4.3. Objective Functions
Due to the multi-dimensional nature of user needs, the model optimization objectives are divided into the following categories in terms of the factors that influence the user’s selection of a charging station. In this paper, the energy consumption cost, time cost, fee cost, and penalty cost of electric vehicle users are considered, and the model is subsequently built with these four objective functions minimized below.
4.3.1. Energy Consumption Cost
Driving energy consumption, as a major component of users’ travel costs, is one of the factors considered by users for travel. In order to reach the destination smoothly and safely, users need to pay attention to the change in electric vehicle power at all times. A larger energy consumption will not only bring higher energy cost to users, but also induce range anxiety, which will affect the expansion of EV usage. Therefore, under the condition of satisfying the demand constraint, users are more inclined to choose the travel and charging strategy with less energy consumption. In this study, the lowest user energy consumption cost is taken as the optimization objective, and the objective function is shown in Equation (6):
and
are calculated using Equations (7) and (8):
The vehicle travel energy consumption is the sum of the travel energy consumption from the starting point to the charging station; the travel energy consumption is the sum from the charging station to the end point; and the objective function represents the minimal total vehicle travel energy consumption of all users.
4.3.2. Time Cost
Usually, electric vehicle users want to complete the travel process in the shortest possible time during actual travel. The travel time of electric vehicles is composed of the travel time on the road and the time consumed at the charging station, where the time consumed in the charging station mainly includes the charging time and the waiting time. The objective function is shown in Equation (9):
The time cost
is calculated using Equation (10):
From the above analysis of the robust optimal path study, the travel time is calculated using Equations (11) and (12):
Drawing on previous research results and combining the assumptions of the research problem in this study, the queue waiting time of users at charging stations is calculated using Equation (13):
The queue waiting time is divided into two parts: the charging time of the EVs being served by the selected charging post, and the charging time of other EVs in the queue. The queuing time here takes into account the target user’s charging of other vehicles at the charging station during the process from the starting point to the charging station as well as the state change of the charging station over time. The latter can be derived from the basic information of the charging station according to the above equation, providing a basis for the target user to select the charging station according to the time cost.
According to the hypothetical conditions, the electric vehicle user is fully charged at the charging station and the charging time is calculated using Equation (14):
4.3.3. Fee Costs
In addition to considering the energy and time costs during the user’s travel, the cost spent by the user at the charging station is also an important factor for the user to consider. The cost components usually include service fee, charging fee, and parking fee, and the objective function is expressed as Equation (15):
The service and charging fees are related to the charging power, and the parking charge is related to the total time the electric vehicle stays at the charging station, and each component cost is calculated using Equations (16)–(18), respectively:
4.3.4. Penalty Costs
On the basis of the above costs, we considered the demand of EV users for charging moments, which may be different for different users who wish to perform charging, and the penalty cost is highlighted here in conjunction with the time window constraint that was previously studied. The objective function expression is shown as Equation (19):
This calculation is related to the user’s departure moment, which is used as a decision variable and is expressed in the penalty cost. The decision variable is used to determine the user’s starting charging moment and to judge whether it is within the time frame in which the user expects to perform charging. The model aims to minimize the penalty cost for all users and helps the user to select the optimal charging station.
4.4. Constraints
4.4.1. Charging Station Capacity Constraint
Electric vehicle users need to consider the charging station capacity constraint when selecting a charging station. Since the charging station has a limited number of vehicles that can be accommodated at one time, after the number of vehicles reaches its capacity, no new vehicles are allowed to enter the charging station to charge or wait in line until an electric vehicle leaves the station; the constraint is given in Equation (20):
where
is the current number of vehicles in charging station
j. Its components and calculation methods are described in detail in the subsequent section, and
denotes the capacity of charging station
j. All units are in vehicles.
4.4.2. Remaining Mileage Constraint
Due to the limitation of the battery capacity, if the driving range of electric vehicles cannot meet the travel demand of users, the users could develop range anxiety. The remaining mileage is used to indicate the driving mileage that can be supported by the current electric vehicle’s power, and since the previous section used the path search method with robust optimization for the problem of random driving energy consumption, the constraint only requires that the remaining mileage of the electric vehicle at any node position is greater than or equal to zero; the constraint is expressed as in Equation (21):
where:
The remaining mileage depends on the current remaining power of the vehicle and is a function of the remaining power, calculated using Equation (22), which translates this constraint into a constraint on the remaining power of the vehicle, which is shown in Equation (23).
where
is the remaining power of the vehicle at node
k on the path.
This constraint helps to determine the optimal charging station selection, ensuring that the vehicle can reach its destination before it runs out of power and guaranteeing safe travel for users.
Under the system optimum objective, individual users cannot all be assigned to the most ideal charging station; however, the system optimum is beneficial to users from the overall perspective in the actual complex traffic scenario. If the system optimum is not considered and the results are optimized for individual users, some users may not be assigned to charging stations. Based on this, the model design is considered reasonable.
Other constraints include:
The constraint in Equation (24) indicates that the user’s initial power is not greater than the battery capacity of the electric vehicle; the constraint in Equation (25) indicates that the user’s travel process can only choose one charging station for charging based on the assumptions considered in the problem; and the constraint in Equation (26) indicates the fast charging and slow charging power set according to the time that the user starts charging, where t indicates the charging moment in hours.
5. Numerical Simulation
5.1. Example Scenario Description
We conduct a numerical simulation in this section to verify the proposed model. The model was applied to solve each of the four objectives of optimization of energy consumption, time, cost, and penalty cost under the corresponding constraints, and the optimal charging scheme was selected by combining the user preferences, from which the feasibility and practicality of the scheme were analyzed.
In this simulation, we extracted the Beijing road network data, including road network node data and road section data, using OpenStreetMap (OSM). After data processing and selection of paths, we obtained a comprehensive information table of the road network; some of the data are shown in
Table 2.
Table 2.
Comprehensive information of road network.
Table 2.
Comprehensive information of road network.
| Start Node | End Node | Section Length | Start Node Latitude and Longitude | End Node Latitude and Longitude | Travel Time |
|---|
| 3634 | 19983 | 165.3992 | 116.3379, 39.91324 | 116.3359, 39.91314 | 29.77185 |
| 26 | 13103 | 35.15128 | 116.3281,39.9133 | 116.3282, 39.91359 | 5.061784 |
| 13103 | 23963 | 364.2321 | 116.3282,39.91359 | 116.3283, 39.91685 | 52.44942 |
| 17374 | 350 | 216.9624 | 116.2817, 39.93521 | 116.2816, 39.93715 | 11.00091 |
| 350 | 22529 | 224.9431 | 116.2816, 39.93715 | 116.2813, 39.93917 | 11.40557 |
| 730 | 3731 | 35.16322 | 116.3506, 39.99189 | 116.351, 39.99192 | 1.947502 |
| 3731 | 17628 | 378.7178 | 116.351, 39.99192 | 116.3554, 39.99212 | 20.97514 |
| 17628 | 16729 | 161.4882 | 116.3554, 39.99212 | 116.3573, 39.99221 | 8.943964 |
| 16729 | 16730 | 54.82072 | 116.3573, 39.99221 | 116.358, 39.99225 | 3.036225 |
| 2200 | 359 | 268.0961 | 116.3596, 39.97348 | 116.3564, 39.97342 | 16.08577 |
| 359 | 22176 | 115.0853 | 116.3564, 39.97342 | 116.3551, 39.97339 | 6.905119 |
| 17460 | 21939 | 119.731 | 116.3164, 39.95222 | 116.3164, 39.95115 | 7.18386 |
| 36 | 9542 | 371.0652 | 116.3621, 39.94738 | 116.3629, 39.95062 | 21.89893 |
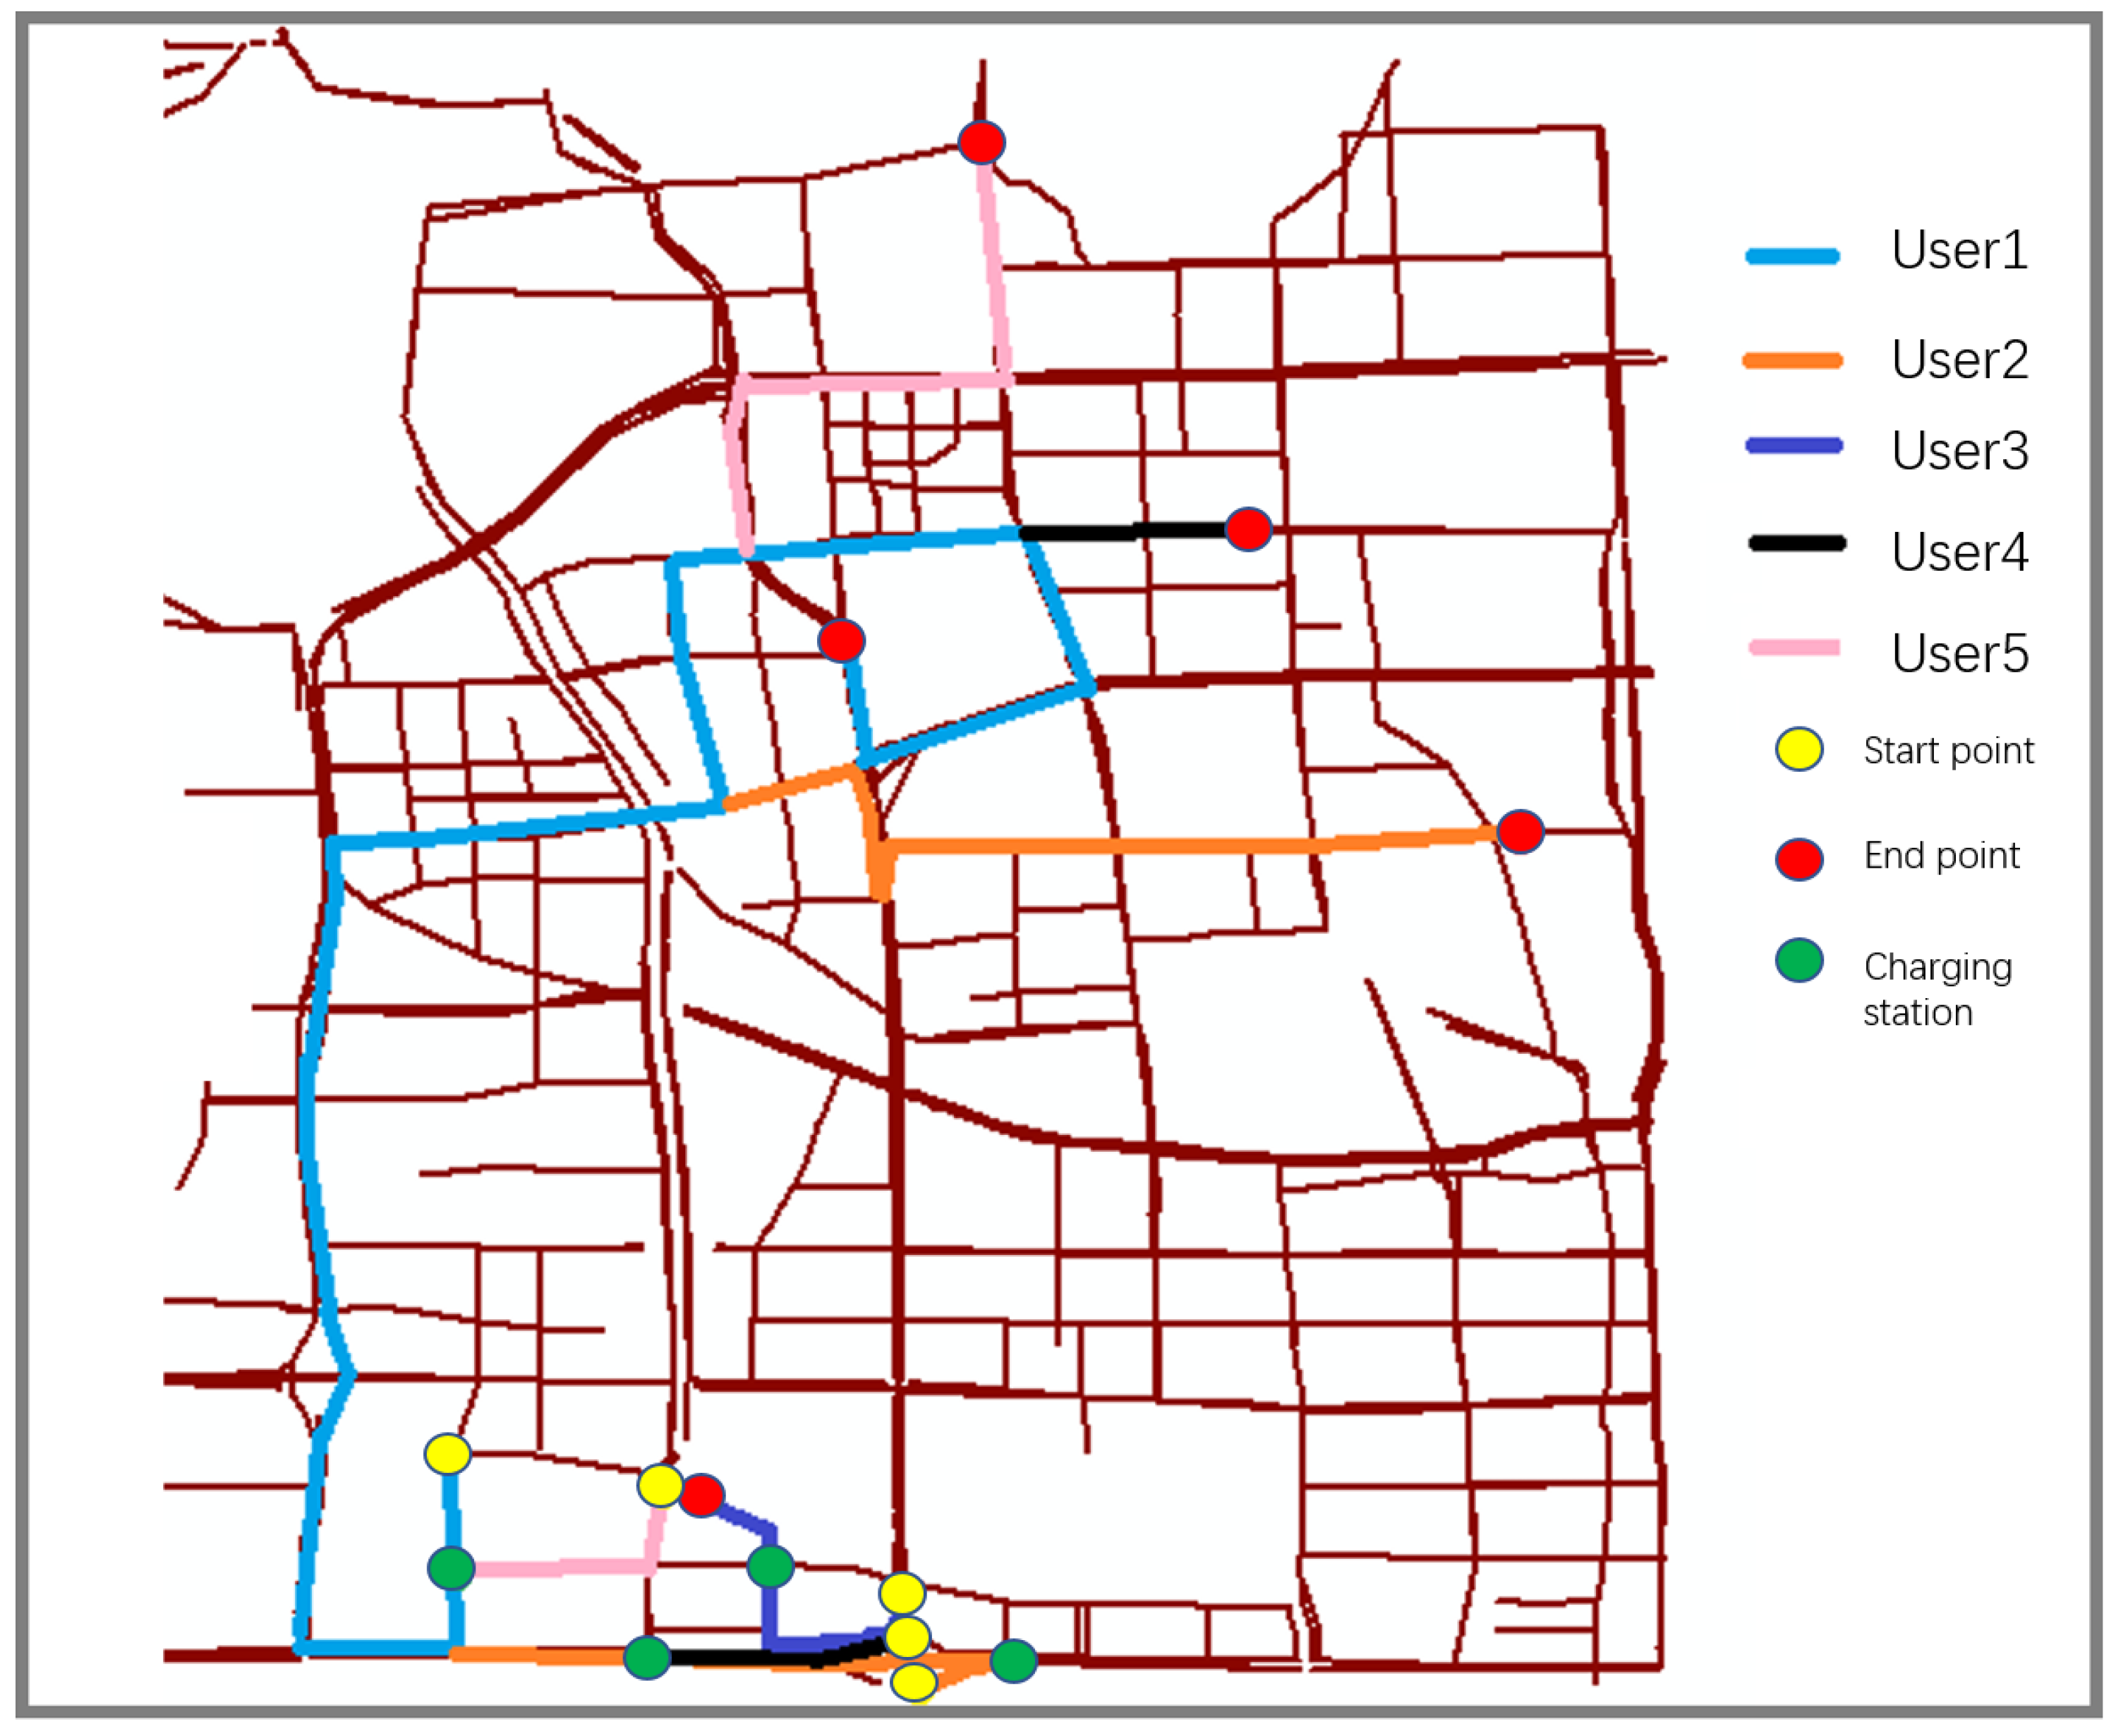
A model is built based on part of the road network in Beijing, and the locations of 50 charging stations are given in the actual situation of the road network. Given five EVs to assign, the electric vehicles generate a charging demand at the starting node in the road network. The travel O-D nodes of the five users here are 6528→7521, 29857→48484, 29603→48603, 21385→20842, and 17358→48408. The node data of the 50 charging stations are shown in
Table 3.
According to the collaborative filtering algorithm, the result of the Pearson similarity calculation for the 50 charging stations is a 50 × 50 matrix; some of the results are shown in
Table 4.
The EVs generate a charging demand at the starting nodes. The basic information of the EVs is shown in
Table 5, including the initial power level and the time period when the user expects to perform charging, assuming the battery capacity of the EVs is 25 kWh.
The charging station data include the number
of vehicles currently present in the charging station, the number of charging posts
, the vehicle arrival rate
(vehicles/min), the charging station capacity
, the parking fee per unit of time
(CNY/h), the service fee per unit of electricity
(CNY/kWh), and the charging fee per unit of electricity
(CNY/kWh). The correspondence of nodes on the charging station road network is shown in
Table 6. The parameters
,
, and
are given in combination with the studied range, i.e., the actual charging station pricing standard in Haidian District, Beijing;
and
are generated randomly within the specified range by combining experience; and
and
satisfy the condition that they are not larger than the charging station capacity
.
Converting the expected arrival time in
Table 5 to time periods in minutes, user 1 expects the charging time period to be [480, 540], user 2 expects the charging time period to be [480, 540], user 3 expects the charging time period to be [600, 720], user 4 expects the charging time period to be [720, 840], and user 5 expects the charging time period to be [1020, 1140]; the algorithm solution parameters were set as shown in
Table 7.
5.2. Optimal Results and Analysis
In the given scenario, the model was solved using the NSGA-III algorithm, and the solution results are shown in
Table 8.
The corresponding values of each objective function, i.e., the total cost of the system, are shown in
Table 9.
Taking user 1 as an example, whose expected charging time is from 8:00 a.m. to 9:00 a.m., for the second solution in the solution set, the departure time for user 1 is given as 7:34 a.m. Combined with the corresponding penalty cost in
Table 10, the user charges within their expected time period for charging, and the solution is consistent with the user’s expectation and can be considered reasonable. Taking the first solution in the solution set as an example and transforming the time, the corresponding charging guidance scheme is that user 1 chooses to charge at charging station number 20 at 8:22 a.m., user 2 chooses to charge at charging station number 14 at 8:10 a.m., user 3 chooses to charge at charging station number 17 at 11:00 a.m., and user 4 chooses to charge at charging station number 17 at 12:53 p.m. At 12:53 p.m., user 4 selects the charging station number 17 for charging, and user 5 selects the charging station number 18 for charging at 17:05 p.m.
The preference coefficients of each user for each charging station are shown in
Table 10.
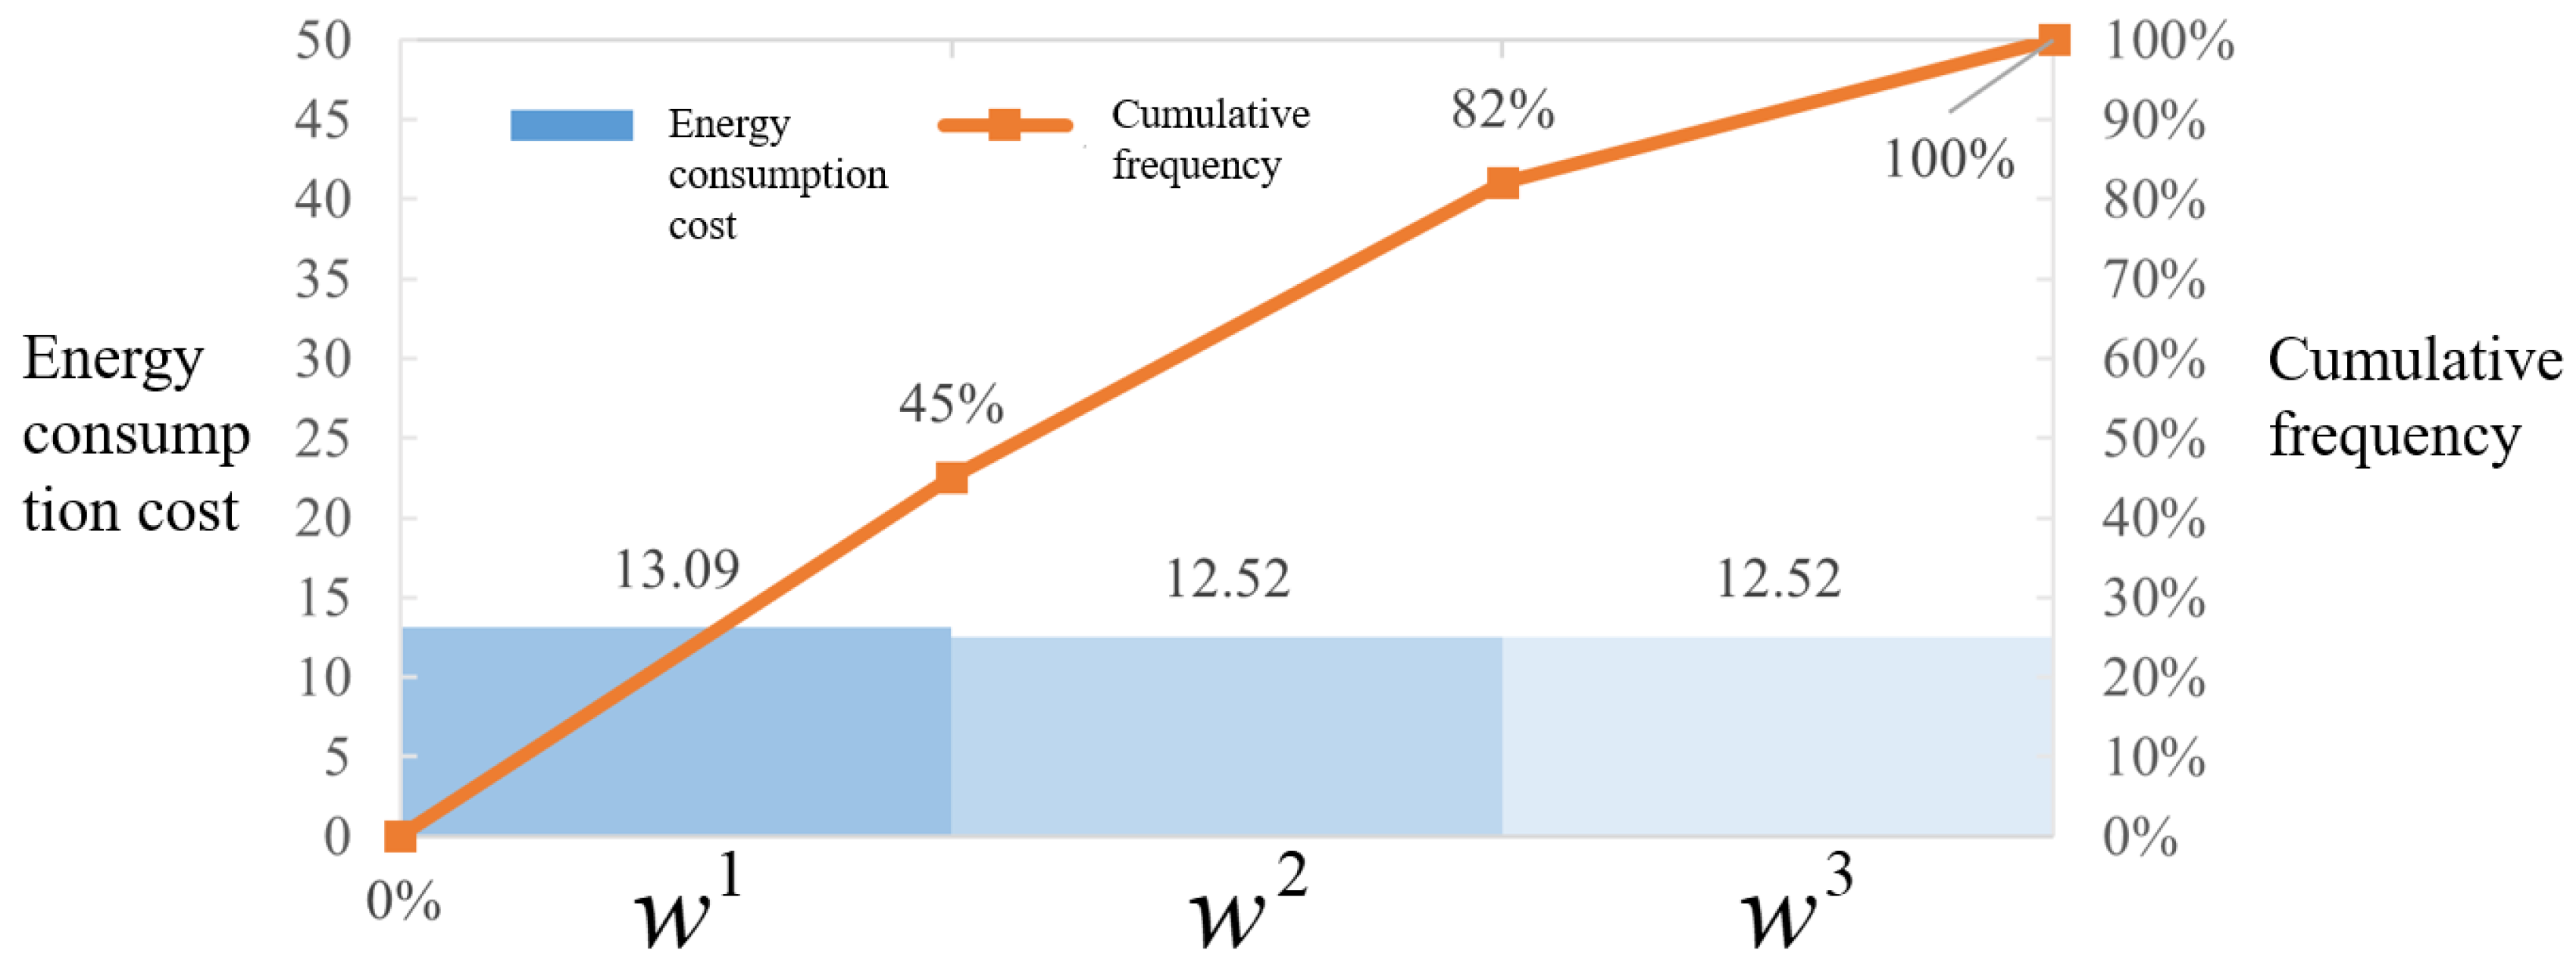
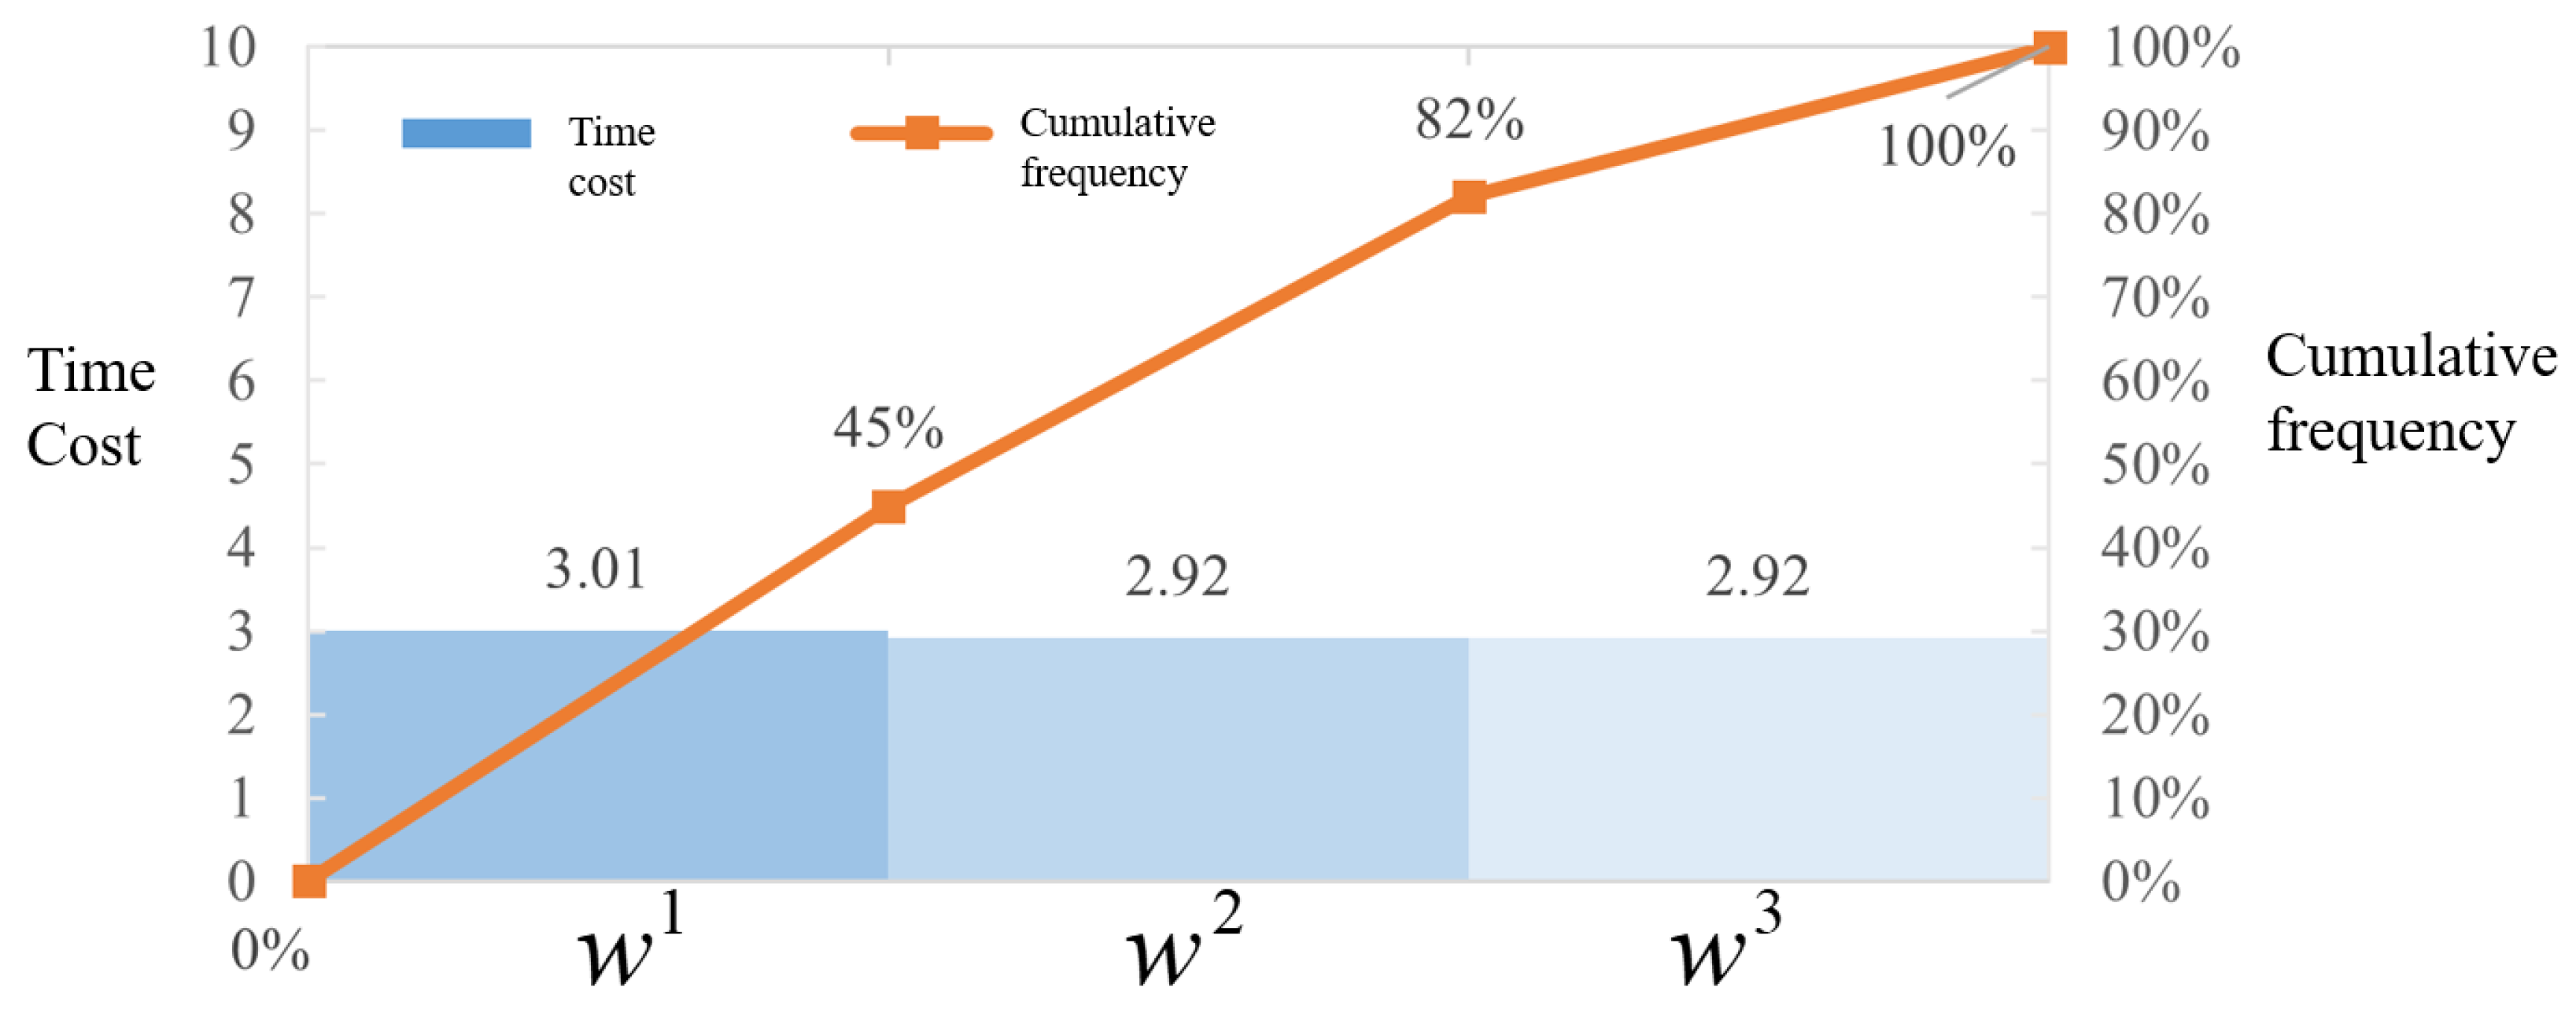
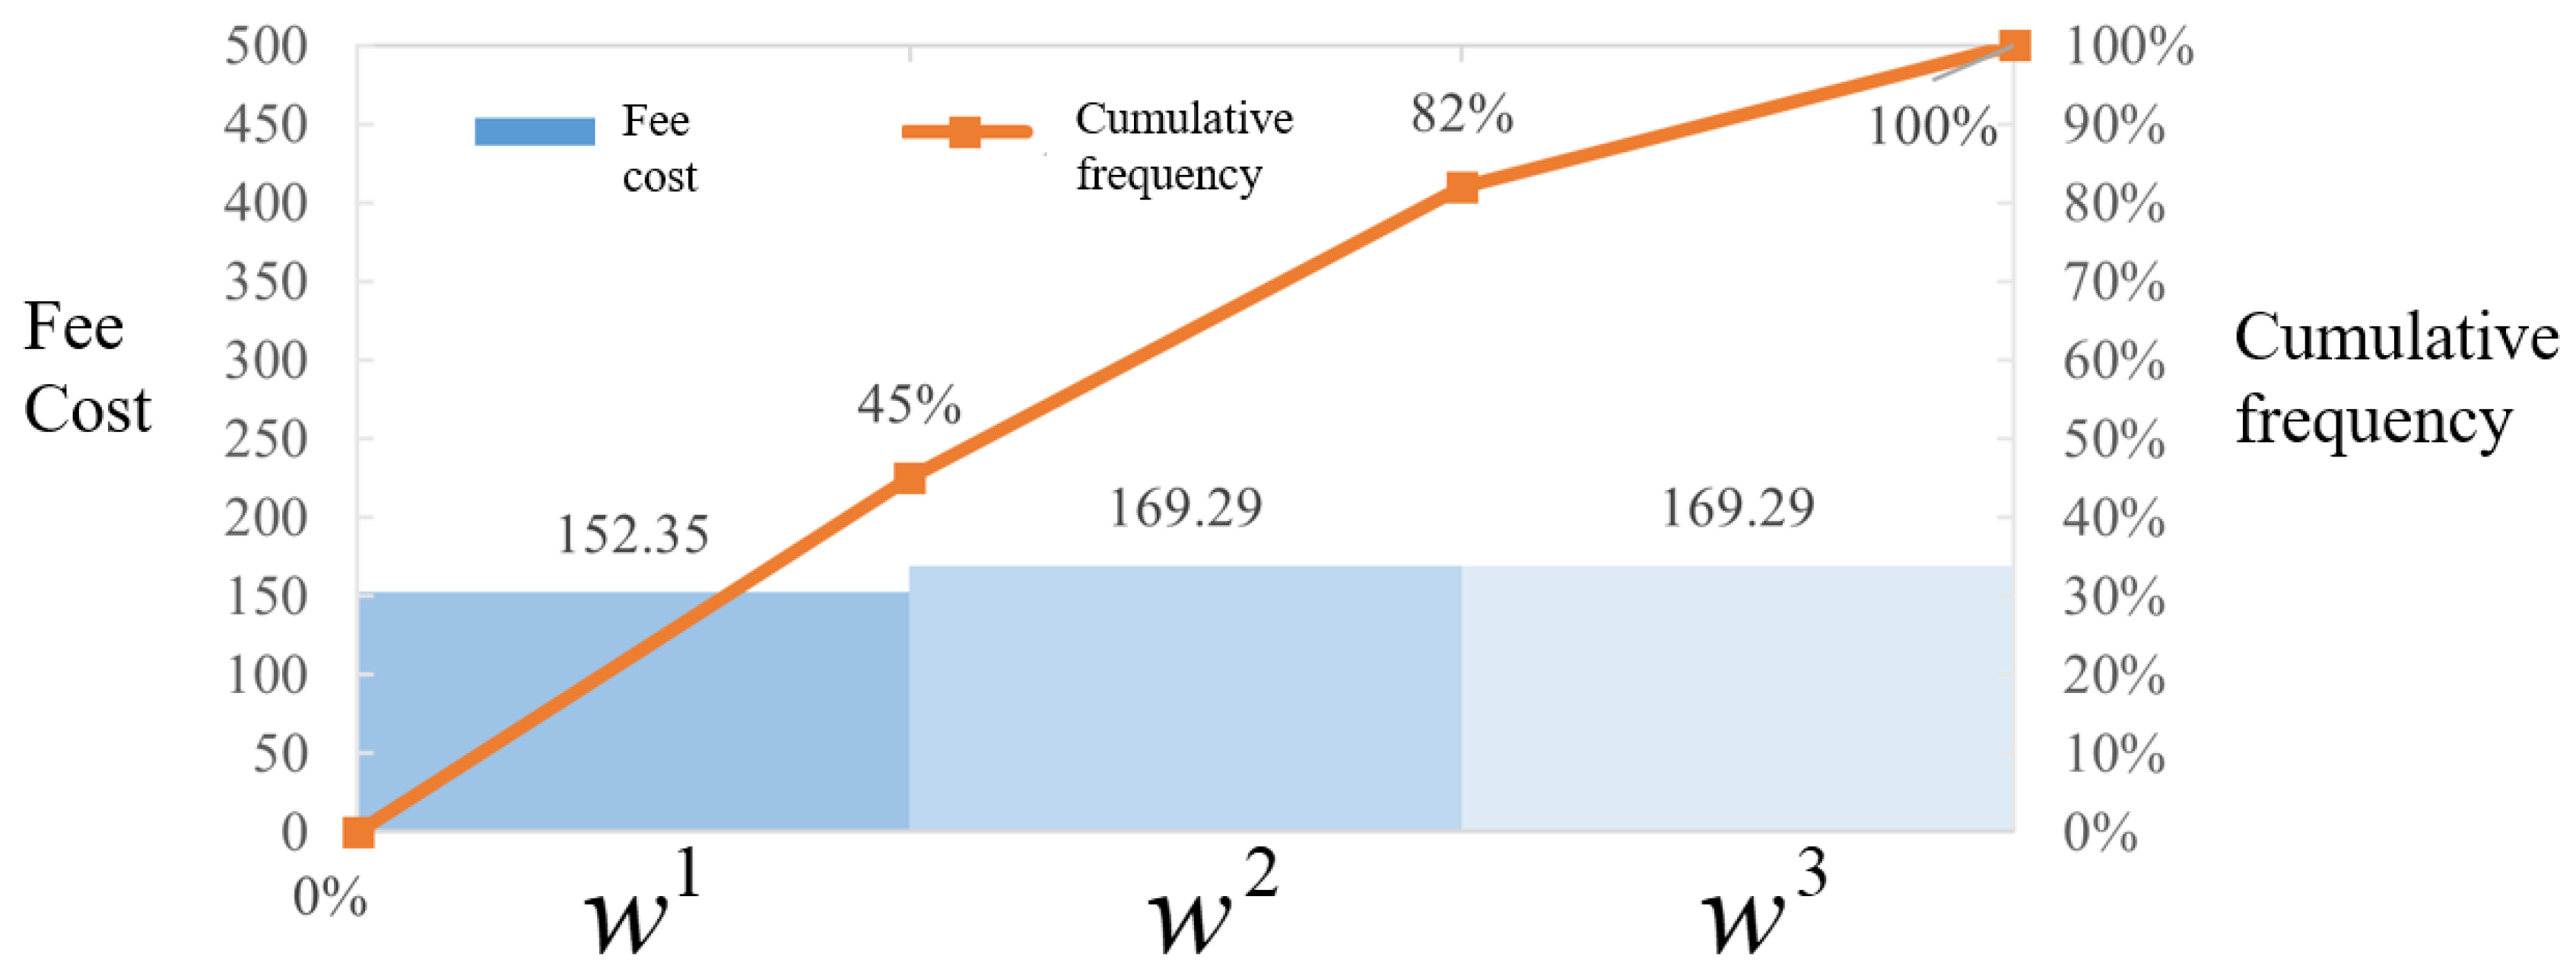
Different types of users have different degrees of preference for choosing charging stations. The charging guidance scheme is designed with three different user preferences: lowest energy cost (
), lowest time cost (
), and lowest cost (
). The optimal charging decisions for the three different cases are shown in
Table 11,
Table 12 and
Table 13.
The objective function was solved for each of the three different types of user preferences; the results are shown in
Table 14.
The value of
indicates that all users prefer the decision option with the lower total travel time cost; the value of
indicates that all users prefer the decision option with the lower total travel cost; and the value of
indicates that all users prefer the decision option with the lower total travel energy cost. It is easy to observe from
Table 14 that in the above three cases, the solution system with
had the lowest time cost, the solution system with
had the lowest travel cost, and the solution system with
had the lowest energy cost.
In order to further study the influence of different preference weights on each objective, the Pareto curve was used to analyze the optimal objective values in the above three cases. The Pareto curves using the three different types of preference weights are shown in
Figure 6,
Figure 7 and
Figure 8. The Pareto curve using
obtained the minimum value of the time cost,
obtained the minimum value of the travel cost, and
obtained the minimum value of the energy cost.
According to the above analysis, the cost of each target affecting the system did not change much under the different weight cases, and the optimal decision scheme given according to the model solution results corresponded to the lowest values of each targeted cost (energy consumption, time, and money), meaning the optimization results derived from the model can be considered reasonable.
5.3. Analysis of Algorithm Parameters and Convergence
In order to verify the charging guidance model and related algorithms proposed in this paper, this section described the detailed analysis of simulation cases. Firstly, the road network was modeled through data processing to search for robust optimal paths between the nodes of the road network; then the preference of users for charging stations was analyzed according to the collaborative filtering algorithm in
Section 3. On this basis, the model built in
Section 3 was solved separately, and the results of the algorithm were compared and analyzed to verify the feasibility and effectiveness of the model and algorithm, and finally the optimal charging guidance scheme for EV users was determined.
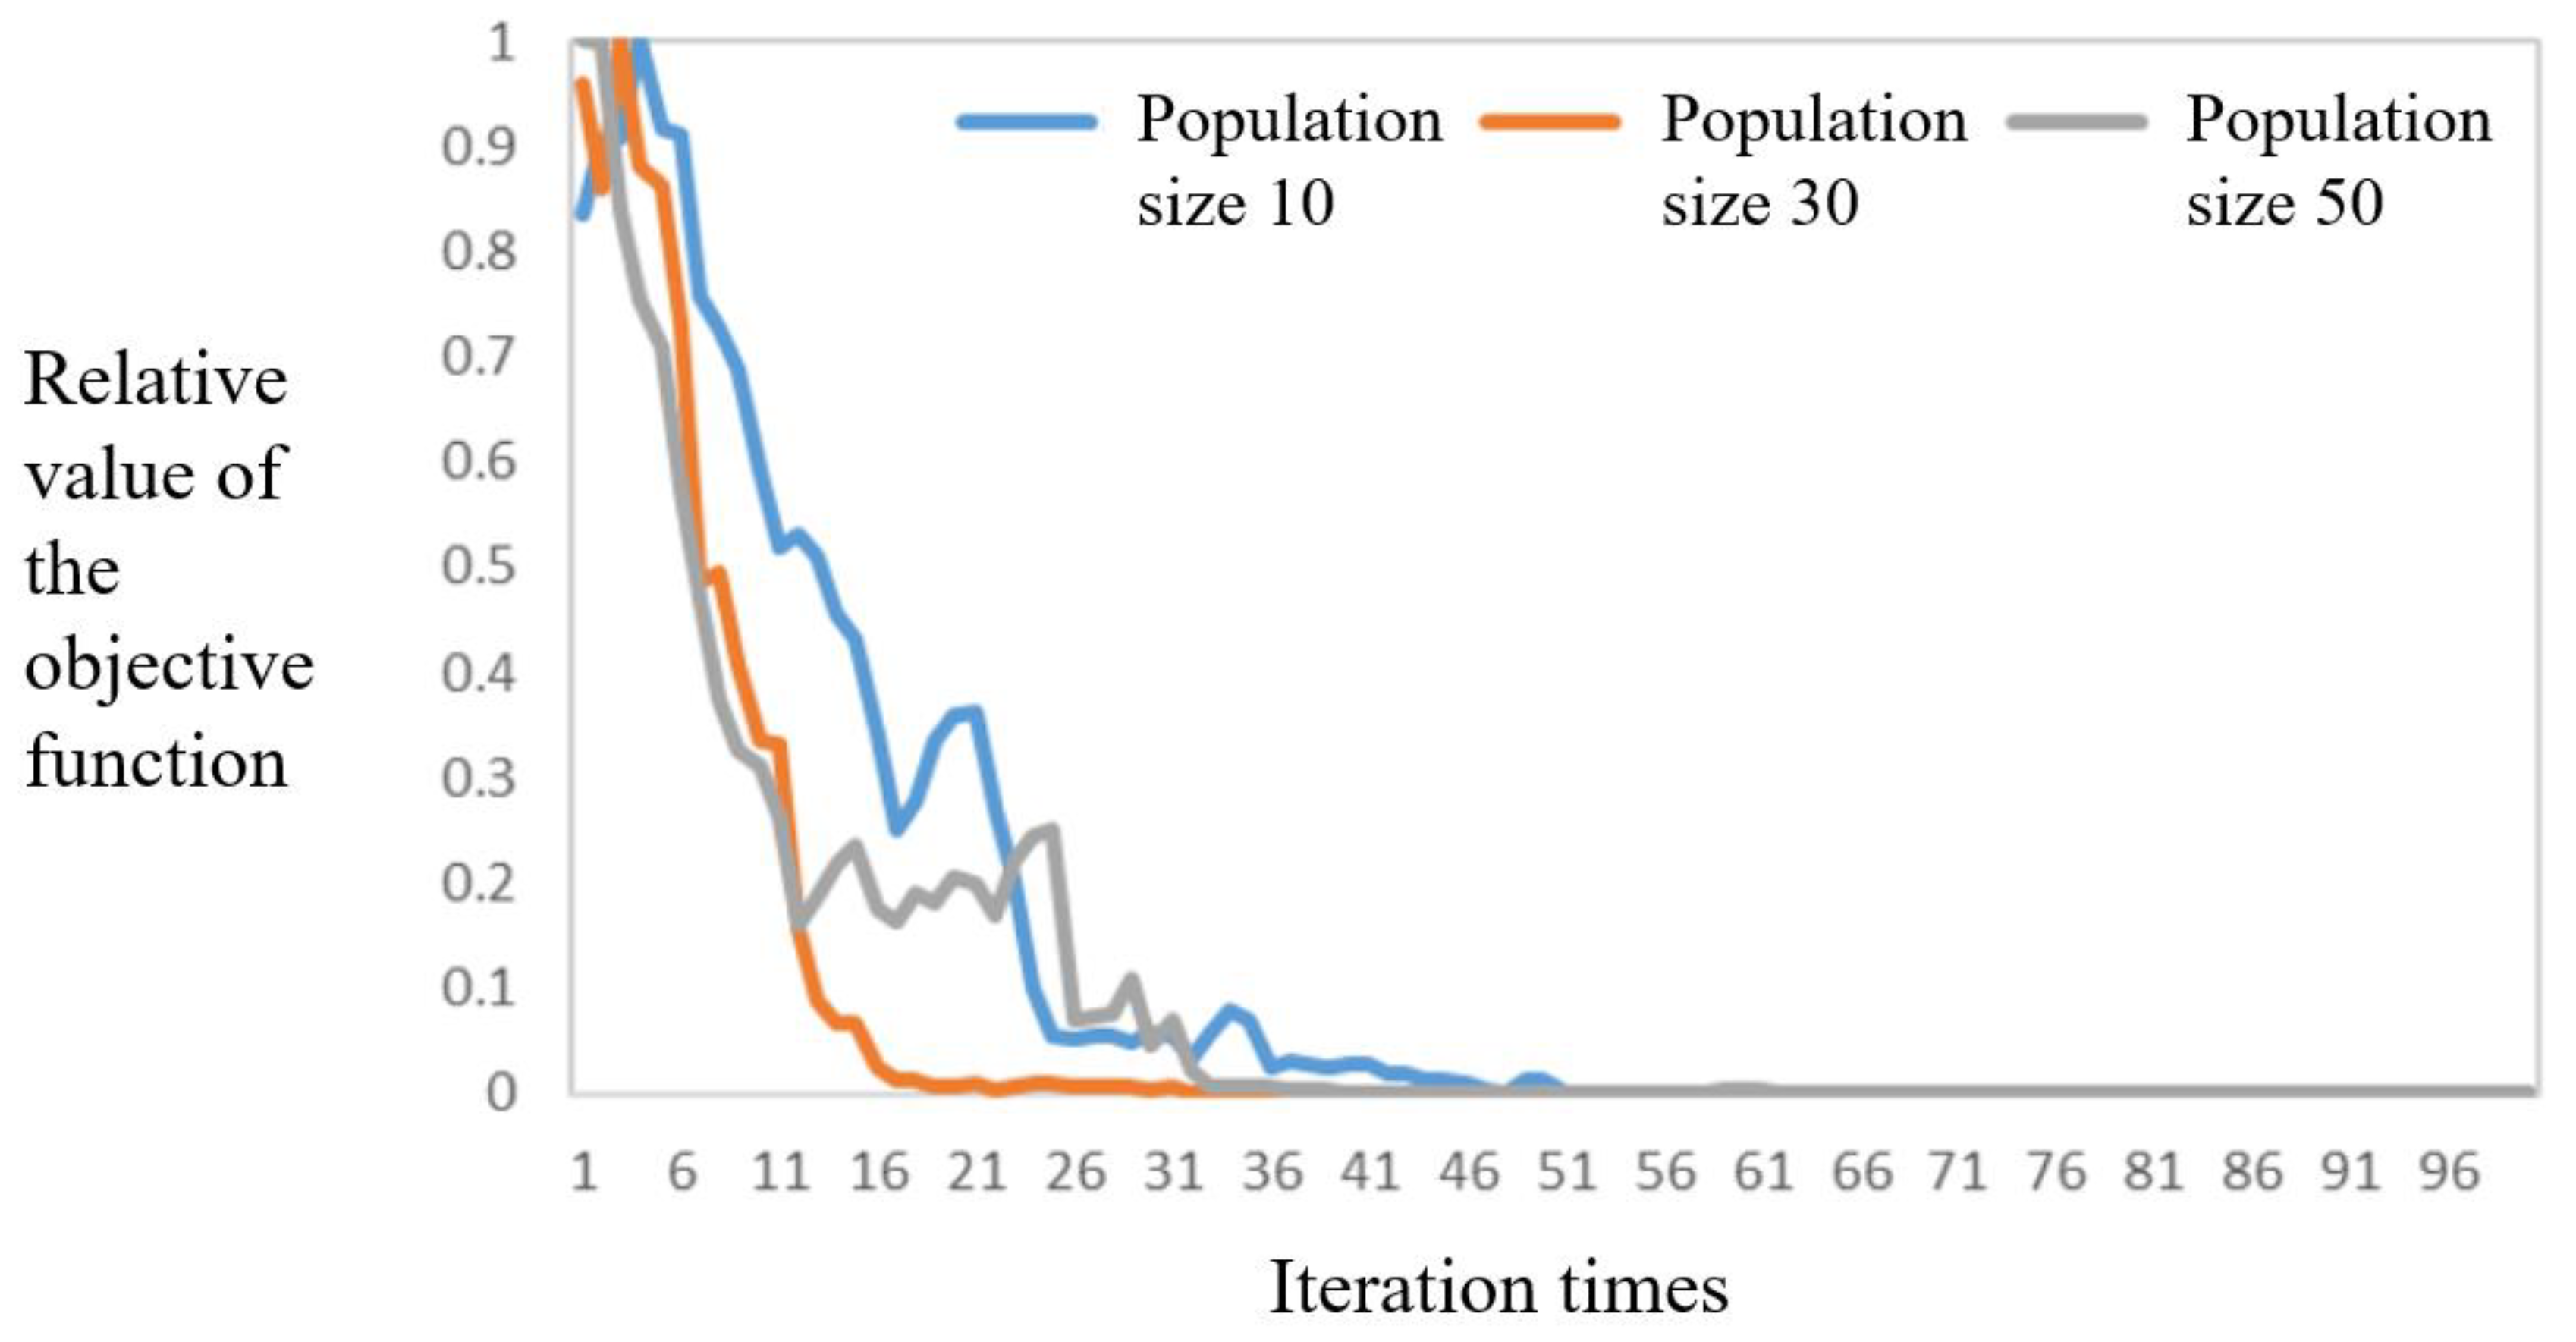
In this section, the corresponding algorithm parameter settings and convergence are verified. The algorithm sets different population sizes, i.e., 10, 30, and 50, to be solved, and the corresponding numbers of non-dominated solutions are 10, 30, and 35. The mean value of each objective function is taken from the Pareto optimal solution set obtained by solving the model under different population sizes, and the change in its relative value under different iterations was observed. Compared with the changes in the other three objective functions, it was found that the penalty cost converged the slowest according to the convergence results (
Figure 9).
From
Figure 9, it can be easily observed that the algorithm converged the fastest when the population size was 30 and converged the slowest when the size was 10. In the three scale cases, the objective function value remained stable when the number of iterations was greater than 50, and the parameter settings were given such that there were as many non-dominated solutions as possible, subject to the number of iterations it takes to reach convergence.
In this section, the previously studied contents were verified using examples. The road network data were first collected for road network modeling and an optimal path search was performed using robust optimization. The similarity between charging stations was analyzed based on the given user charging data using a collaborative filtering algorithm. Simulation experiments of the charging guidance schemes considering multi-dimensional user preferences were designed; the given different preference matrices were solved separately to compare the differences between the results in the case of different preference matrices to analyze the underlying reasons for them.
6. Conclusions
Previous studies on EV charging guidance strategies have only considered the total travel cost of users, the congestion level of the traffic network, and the load balance of the grid. However, in practice, it is necessary to recommend charging solutions for different types of users from the user’s point of view to meet the multi-dimensional preferences of various users. In this paper, we studied users’ preferences for charging stations, modeled these preferences based on collaborative filtering, and ranked the existing but unconscious preferences for charging stations from analyzing the similarity between charging stations, so as to provide users with charging stations that suit their preferences and charging habits, thereby improving user satisfaction. The charging induction problem considering users’ multi-dimensional preferences was described, the assumptions of the problem were given, and the general modeling solution was determined. According to the multi-dimensional charging demand of users, the multi-objective optimization model was established with the optimal system based on energy consumption, travel time, travel cost, and penalty cost as the objective functions in combination with the actual conditions. Combined with the above-mentioned study of user preferences for charging stations, the solution was designed according to the model characteristics, including algorithm design using the NSGA-III framework. Using part of the road network in the Haidian District of Beijing as an experimental scenario, we obtained the actual road network data and processed and modeled the road network. Simulation experiments were designed for the charging induction model considering users’ multi-dimensional preferences and given different preference weight cases of users; the solution was analyzed by combining the users’ preferences for each charging station. The influence of different users’ preference degrees for each target on the optimal decision scheme selection was analyzed in conjunction with the actual conditions. The feasibility and reasonableness of the scheme were verified. Additionally, the optimal solution was selected from the Pareto solution set, and the optimal travel charging induction scheme was finally determined. A charging guidance strategy that considers users’ multi-dimensional charging preferences is a more appropriate approach to solve users’ range anxiety. By studying the multi-dimensional preferences of different types of users, it is not only possible to recommend potentially more-suitable charging solutions for the same types of users to meet their needs, but this method will also allow some underutilized charging station resources to be used more efficiently, balancing the load on the power grid as well as on the road network, and will also provide a development plan for the future construction of charging stations that is more relevant to users’ needs. More reasonable charging station planning will also enable the promotion of electric vehicles to be further enhanced.
Providing users with more efficient, accurate, and real-time charging guidance schemes will be further investigated in future research. This paper used collaborative filtering algorithms to incorporate users’ preferences for charging stations based on their behavioral data in choosing charging stations; in the future, larger scale data can be used to design and recommend charging schemes for a larger user population, and perhaps certain laws based on big data can be explored from this to provide a more practical and efficient charging scheme. In the future, we can study the state of charging stations, analyze the factors that cause changes, and model and predict the state of charging stations over time, so as to provide a basis for users to choose charging stations.


