1. Introduction
The battery electric vehicle is one of the most promising solutions to the energy crisis and environmental pollution. Thanks to rapid progress in lithium-ion battery technology in recent years, more and more traditional internal combustion engine vehicles will be replaced by electric vehicles in the near future [
1,
2]. The transition towards battery electric mobility brings many challenges, of which Battery Thermal Management (BTM) is one of the most important, where several disciplines such as electronics, heat transfer and controls need to be managed together to guarantee a safe and efficient operation of the battery. BTM is important since the battery temperature has a great impact on its performance, lifetime and safety [
3]. During operation, the temperature of the battery cells inside the battery pack should be firstly maintained within an optimal operating range (e.g., between 15 and 50 °C [
4] or even between 15 and 35 °C [
5]) to avoid adverse effects such as accelerated aging and thermal runaway. At low temperature, the battery internal resistance increases significantly which results in reduced energy and power densities [
6]. Charging the battery cell at low temperature also increases the risk of lithium plating, which seriously reduces lifespan [
7]. When operating at too high temperature, the overheating of the battery cells can cause thermal runaway, which may result in a destruction of the whole battery pack [
8]. Secondly, the temperature gradient of the battery cells inside a battery pack should be kept as small as possible (e.g., within 5 °C [
3,
5]) to avoid performance loss and uneven cell aging. The imbalance caused by uneven cell aging affects not only the performance of the related cells but also that of the whole pack [
9].
To efficiently design a battery thermal management system, a complete and detailed battery pack model is needed in order to gain detailed insights into the cell temperature evolution under different operating conditions. The battery pack model includes not only the cell models, but also the models of other battery pack components, such as the electrical connectors, the air or liquid cooling channels, and the pack casing. To represent battery electrical and thermal behavior, two main types of models are available in the literature:
Electrochemical models, such as the well-known pseudo-two-dimensional (p2D) model [
10] and the single particle model [
11,
12], allow detailed insight into different electrochemical processes inside the battery cell. However, it is not suitable for real-time applications and battery pack level simulation due to a high computational cost [
13,
14]. In addition, calibration of the electrochemical models is a challenging step which requires considerable experimental effort to measure or estimate the model parameters.
The empirical equivalent circuit models are widely used in battery applications [
13,
14,
15]. They are simple and commonly consist of basic electrical elements (e.g., voltage source, resistance, capacitance) or electrochemical impedance (e.g., Warburg impedance or constant phase element). Due to the simplicity in model structure and limited number of parameters, the equivalent circuit models run faster compared to the electrochemical models and hence are more suitable for real-time applications and battery pack level simulation. The equivalent circuit models require, at the same time, less experimental effort to calibrate the model parameters from test data. When they are properly parameterized, the equivalent circuit models can give accurate voltage and temperature estimations for the battery [
13,
15].
To simulate the battery pack model, the methods employed in the literature can be summarized into three categories: one-dimensional system simulation (or 1D simulation in short), three-dimensional computational fluid dynamics (CFD) simulation (or 3D simulation), and a combined approach using both 1D and 3D simulations. Compared to 3D simulation, 1D simulation is much faster and hence more suitable for real-time applications and aging simulation. Several works have shown system level battery pack simulations based on empirical equivalent circuit models [
13,
16,
17,
18]. Li et al. in [
13] proposed a real-time compatible model to simulate the electro-thermal behavior of a battery pack with air cooling. This system level battery pack model has been used in the work of Ponchant et al. [
16] for the software-in-the-loop and hardware-in-the-loop tests of the battery management system. Wang et al. in [
17] designed a system level model to simulate a liquid cooled battery pack. This model includes not only the cell equivalent circuit model, but also models for other pack elements such as the cooling plates and the flow channels. Ramesh Babu et al. in [
18] presented a liquid cooled battery pack model based on a system level approach. The model was used to simulate the average temperature of the battery pack. While 3D simulation is very time consuming, it can be more accurate and provides a higher level of detail compared to 1D simulation [
18]. Li et al. in [
19] developed a three-dimensional electrochemical-thermal model coupled with a fluid dynamics module to analyze in detail the temperature distribution inside an air-cooled battery pack. Buidin et al. in [
4] used steady-state 3D simulations to determine the values of the heat transfer coefficient on the surface of the cylindrical battery cells at different pre-defined air flow and heat generation values. The heat transfer maps obtained via 3D simulations at different pre-defined conditions were used by the 1D simulation model to evaluate the thermal behavior of the battery pack in transient mode. Li et al. in [
20] presented a similar work for a liquid-cooled battery pack combining 1D and 3D simulations via the use of heat transfer maps.
In this paper, a novel and holistic approach is presented that leverages experiments, 1D system simulation and 3D CFD simulation for the thermal and electrical characterization of cells and battery packs. Compared to similar works in the literature, the main contribution of our work is threefold. Firstly, this approach describes a complete workflow of the battery pack electro-thermal characterization, including the very first step, which is the cell characterization from experimental data. Commonly, many automotive manufacturers acquire cells from suppliers, but the parameter values to model the cell behavior are usually not provided by the cell suppliers. In our work, a standard workflow is used to calibrate the cell model parameters from experimental data. This calibration workflow can be easily applied to other battery cells. Secondly, our approach employs a co-simulation of the 1D and 3D models using the Functional Mockup Interface (FMI) standard [
21]. Co-simulation allows for the evaluation of any operating condition. Hence it avoids the need to generate heat transfer maps for pre-defined operating conditions, as in [
4,
20]. Finally, serval important issues encountered during the battery pack design are rarely covered in similar works, such as battery aging, the conversion from an air-cooled design to a liquid-cooled design, and the integration of the battery pack model into a complete vehicle model. These aspects can be addressed with our simulation approach and will be discussed in this paper.
The case study chosen to present this concept is an electric Formula Student race car (as described in
Section 2) and this approach consists of three steps. First, a single cell is experimentally investigated to identify the parameters of the equivalent circuit model (
Section 3). Afterwards, a system simulation is set up to represent part of the battery pack as an ensemble of characterized cells (
Section 4). Successively, the battery pack is exported by means of the FMI standard and embedded in a CFD Conjugate Heat Transfer (CHT) simulation, to simulate the cooling of the battery pack (
Section 5). In this framework, fundamental quantities of the battery such as the state of charge, the temperature and the ohmic heating can be accessed for optimal dimensioning of the cooling system. Future improvements or extensions of the current work are discussed (
Section 6), including the extension to a liquid-cooled design, the consideration of battery aging, and model integration into a full vehicle system model.
2. Case Study
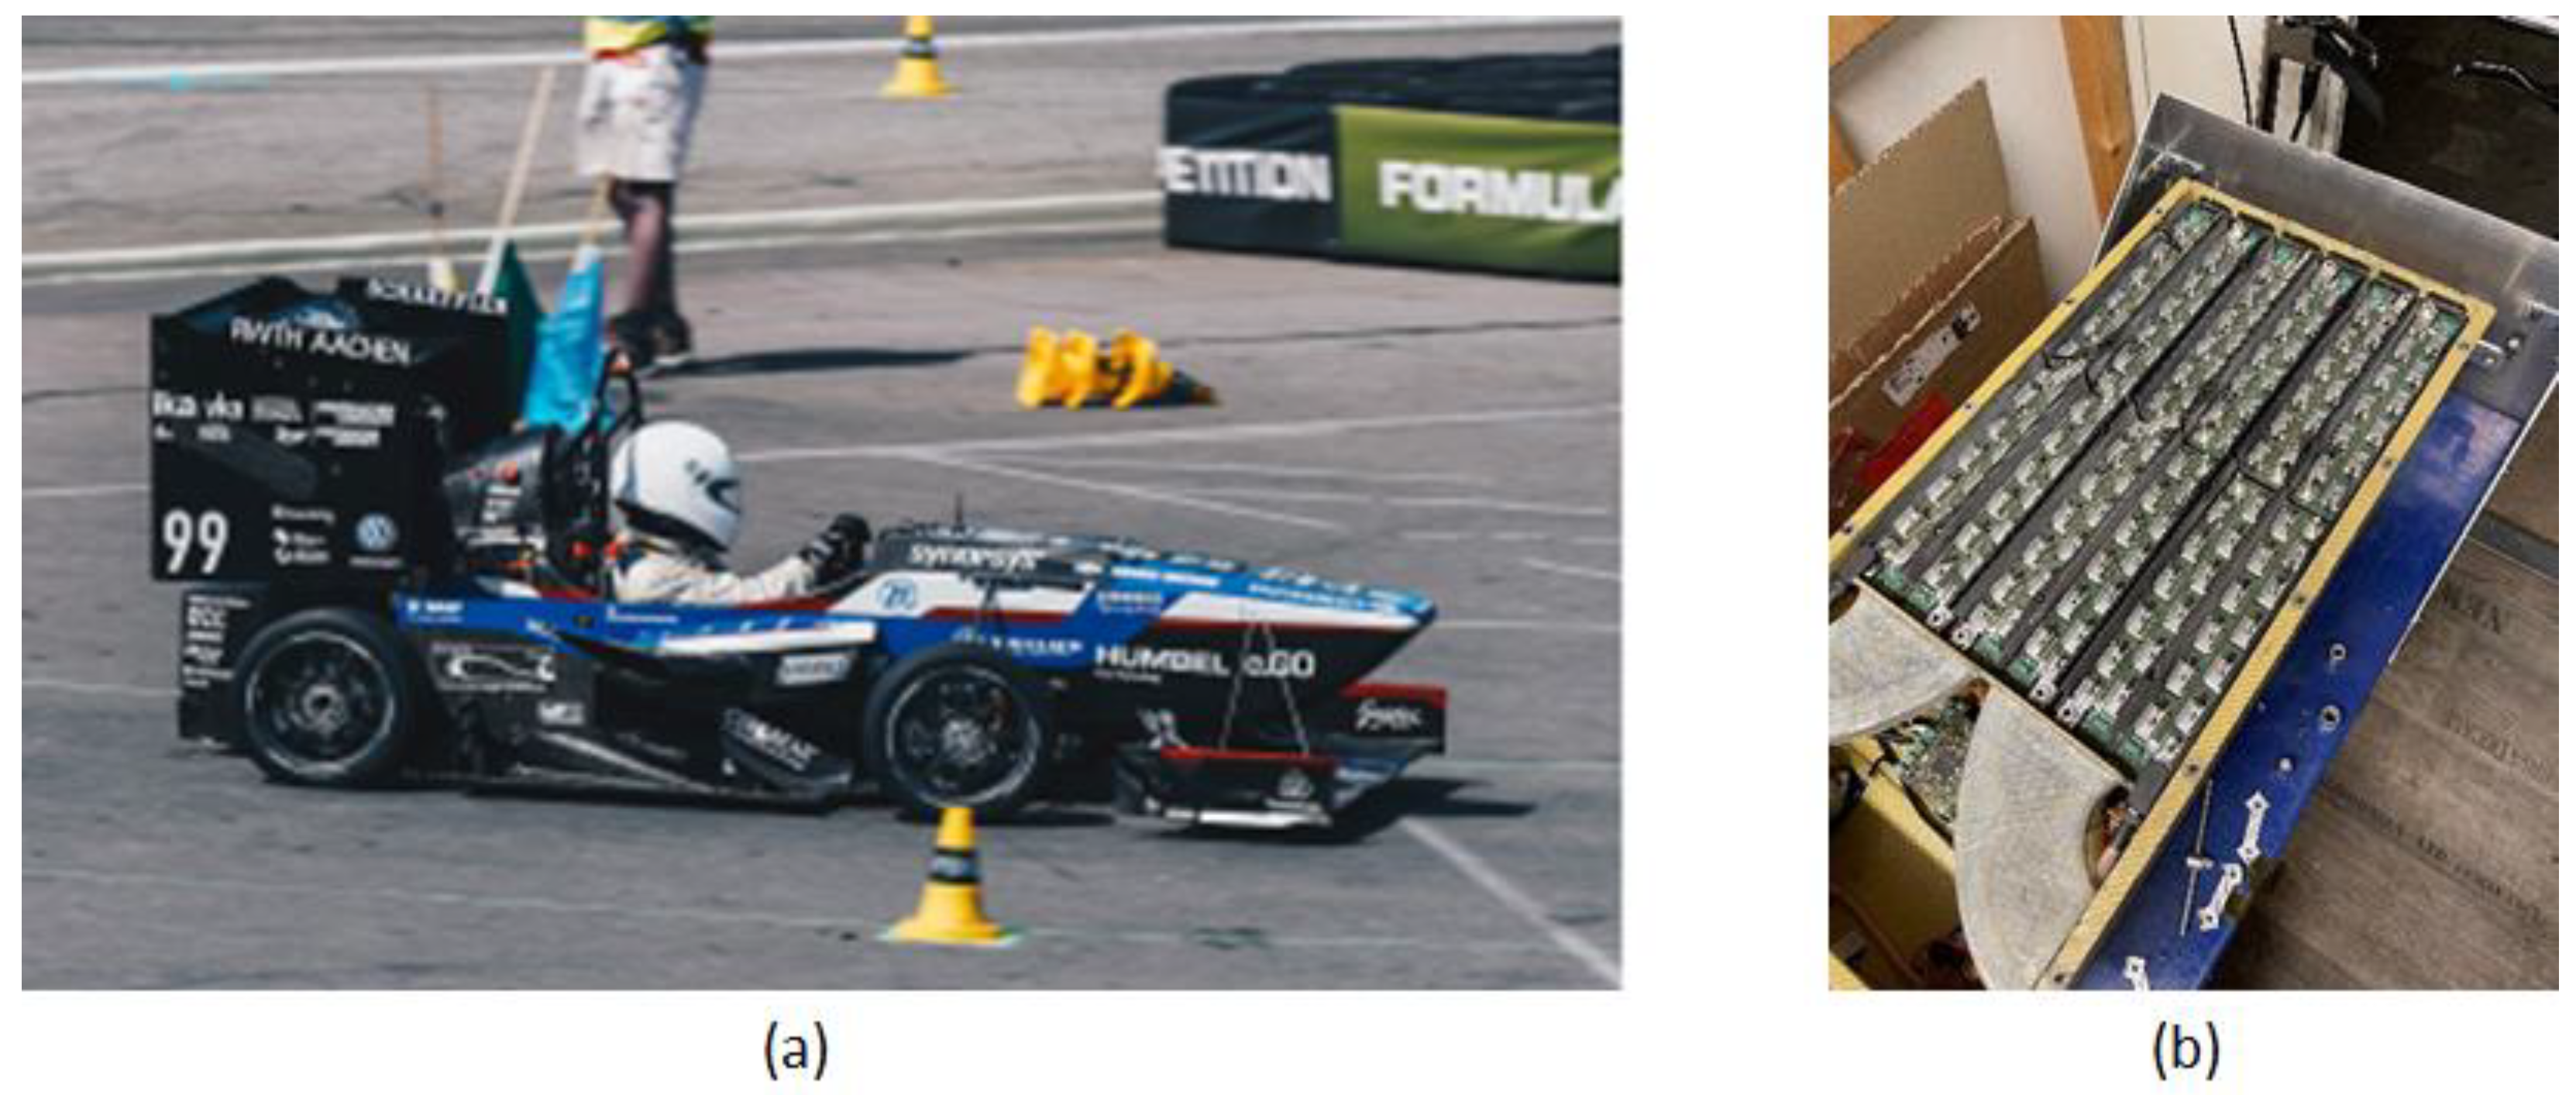
The case study addresses the electric race car eace08 [
22] shown in
Figure 1a, designed and built by the RWTH Aachen’s Formula Student team Ecurie Aix. The eace08 is a 4-wheel-drive car with up to 32 kW traction power per wheel hub motor, with an overall peak power of 80 kW (limited by the competition rules) and a recuperation capability of up to 60 kW. Four IGBT inverters supply the PMSM motors with power. Both systems are water cooled. The drive train is powered by a high-power Li-Ion battery pack with a capacity of roughly 6 kWh.
The energy is stored in 288 high power Li-ion pouch cells, and 24 of these cells in a 12s2p configuration form one stack, held together by a 3D-printed cage that also contains a secondary controller of the battery management system (BMS). A total of 12 of the described stacks are placed in a carbon-fiber-reinforced plastics container, together with the BMS master controller and periphery devices, such as a fuse, relays, and an insulation monitoring device. This yields an overall battery configuration of 144s2p and a theoretical voltage range of 432–600 V (upper limit defined by the rules). To accomplish the lightweight construction requirements, the battery cells are air cooled. Three fans at the back of the battery container induce a mass flow through the air vents on both side of the monocoque and the effect of the instantaneous car velocity is negligible with respect to the mass flow imposed by the fans. The air streams over the heat sinks are mounted on the cell tabs (
Figure 1b) and leave the car at the rear end. The first generation of the air-cooling system as described above was developed as a conservative, oversized proof-of-concept design.
At the formula student competition, the cars compete in various dynamic disciplines, with the endurance race being the most prestigious but also the most challenging: over a track length of 22 km, the cars must drive as quickly and efficiently as possible. Not only the fastest overall time, but also the lowest net energy consumption will be rewarded with points. Efficient energy and thermal management of the battery is therefore necessary to get the most out of the race. The race car is designed to operate closely to the limits of its performance, considering lightweight construction, energy efficiency and thermal design. Since the system must maintain acceptable temperatures for 22 km, the cooling system can be even smaller than a conservative design approach would suggest: an improvement of the first proof-of-concept design is the pivotal motivation of the Batterie Aix project described here.
To optimize the BTM for the endurance race, proper knowledge of the battery’s dynamic behavior in terms of thermal and electrical aspects is mandatory: hence, a multi-disciplinary approach for the investigation of the battery cooling was developed by Ecurie Aix in collaboration with Siemens Digital Industries Software, as described in the present document. The main motivations of this project are: (1) to gain deep insight into the behavior of the current battery pack/cooling system; (2) to derive trustworthy models that can be used in the design phase of the next generation’s cooling system, e.g., towards alternative cooling strategies and/or improved overall BTM concepts; (3) to gain a better understanding of the electric-thermal properties of the system in different scenarios. The present paper focuses on the first goal of the project and the new approach is described below.
3. Cell Characterization
The battery cell used in the race car is a commercial LiCoO
2 pouch cell from MELASTA. The cell specification is summarized in
Table 1.
In our work, equivalent circuit models as shown in
Figure 2 are chosen to model the battery cell behavior because they are simple, fast, suitable for battery pack level simulation, with a good compromise of accuracy/simplicity, and have been implemented in Simcenter Amesim [
23], a multi-physical system simulation software from Siemens Digital Industries Software. A detailed description of these models can be found in [
13].
The workflow to calibrate the equivalent circuit model parameters from the experimental data is summarized in
Figure 2:
Firstly, two types of current test profile have been designed to characterize the battery cell. The first type is a constant discharge and CC/CV (Constant Current/Constant Voltage) charge test as in
Figure 3a. This profile allows verification of the cell capacity via coulomb counting, in order to detect eventual defected cells at an early stage of the experimental tests. It also allows collection of data along with significant cell temperature increase, which will be used to identify thermal parameters such as the cell specific heat (C
p) and the convective heat exchange coefficient (h
cov) of the cell surface in the thermal model in
Figure 2. The second type is a HPPC (Hybrid Pulse Power Characterization), like the pulse test current profile from [
13]. The pulse profile is adapted to the battery cell according to its specification in
Table 1.
Figure 3b–d show the detail of the pulse test profile. This pulse test profile tests the battery at different states of charge and different current amplitudes which allows identification of the parameters of the battery equivalent circuit models. At each tested state of charge, as shown in
Figure 3d, the voltage and current data of the short-duration charge and discharge pulses is used to identify the instantaneous ohmic resistances (R
ohm) at different current amplitudes. The data of the long-duration charge and discharge pulses are used to identify the RC circuits of the electrical model (R
diff and C
diff in
Figure 2). After each long-duration pulse, a rest period is imposed to stabilize the cell voltage. The stabilized cell voltage at the end of the rest period is considered to be the open circuit voltage (OCV) at the corresponding state of charge. More detail of the model parameter identification can be found in [
13,
23].
Secondly, the two types of test profiles were applied experimentally to the battery cells at the Institute for Power Electronics and Electrical Drives (ISEA) of the RWTH Aachen. The battery cells were placed in a climate chamber and were connected to a Digatron battery test bench. Two battery cells were tested, as shown in
Figure 2, to ensure the repeatability of the test results. The constant discharge and CC/CV charge test profile was applied to the cell at 25 °C of ambient temperature to evaluate the cell’s real capacity. The pulse test profile was applied to the cell at 25 and 55 °C of ambient temperature. The tested temperatures cover the operating ambient temperature range of the battery pack for the competition in summer. For all the tests, the cell current, voltage, and temperature were measured.
Figure 3 shows the experimental test results. The minor temperature variation of the pulse test at 25 °C in
Figure 3b is neglectable for the electrical parameter identification. In this case, an average temperature is considered as 27 °C for this pulse test.
Finally, the Battery Electro-thermal Identification Tool in Simcenter Amesim [
23] was used to identify the electrical and thermal parameters of the equivalent circuit models from the experimental test data. The voltage and temperature estimation of the identified battery models are also shown in
Figure 3.
To validate the cell electrical and thermal models, a validation profile was applied to the cell via the test bench at different ambient temperatures. The validation profile includes a fast charge phase from about 0% State of Charge (SoC) and several dynamic driving cycles at different SoCs, as shown in
Figure 4b,c. A battery cell simulation sketch in Simcenter Amesim, as in
Figure 4a, is used to compare the model voltage and temperature estimations to the experimental data.
Figure 4b,c show the comparison results, respectively, for 25 and 55 °C. A minor temperature difference can be seen at the beginning of the test at 25 °C, which is due to the ambient temperature variation in the climatic chamber, like the test at 25 °C in
Figure 3b. At very low states of charge (<5% SoC), the battery electrical behavior becomes very nonlinear, which cannot be accurately represented by the equivalent circuit model. Otherwise, the identified models give accurate estimation of the battery volage and temperature behavior at these two temperatures. The identified cell electrical and thermal models are then validated.
4. System Simulation Model
Based on the model of the single cell, electrically and thermally characterized as described in the previous section, the model of a cell stack consisting of several cells is built. To this end, and according to the 12s2p stack configuration in the race car described in
Section 2, 24 instances of the cell model are electrically linked with each other to form a stack in the system simulation environment. It is noteworthy that building the stack model using any pre-calibrated cell is possible even before the cell characterization. In this case, the cell parameters of the pre-calibrated cell would be improved accordingly once the cell characterization is complete. This process of parallelization may be useful in view of a reduced project time.
In terms of a modular and efficient model construction, in Simcenter Amesim a cell pair of 1s2p configuration is first created as a so-called super-component, as portrayed in
Figure 5. As suggested by the name, a super-component comprises several components combined into one, and in this way facilitates the re-use of model parts sharing the same setup. By means of exposed parameters and exposed variables, relevant “inner” quantities are defined as accessible outside the super-component. In this way, the super-components consisting of several individual components, such as the 1s2p cell configuration, simplify the visual appearance and ease the parametrization of complex models [
23].
Figure 5 shows the super-component created and the electrical parallel connection of two single cells, which deliver their potential voltage through the electrical ports 1 and 3. The voltage of the cell pair can be extracted with the signal output of the voltmeter and processed further if needed. The thermal ports of both cells are connected to a node that enables the data exchange via the common thermal port 2. In this way, the heat flow rates due to the power losses generated in the cells are added and the simplifying assumption is that both cells have the same temperature, as two cells in parallel are thermally connected in this case.
The electrical stack configuration 12s2p is implemented by interconnecting 12 of the cell pairs (or 12 instances of the super-component) in series, as shown in the bottom part of
Figure 6. The current through the stack is consequently divided between the two cells and combined accordingly at the nodes connecting the 1s2p elements. Thermal adapters are connected to the thermal ports of the cell pairs to enable the exchange of temperature as input and heat flow as output at the signal level. This exchange applies to each pair of cells and is ultimately used for co-simulation with the CFD model.
To account for different situations, i.e., different current loads, and to ensure the re-usability of the model, the current profile is applied by means of a component (a current source) that points to a table file. To simulate different scenarios, the user only needs to swap the table file. This procedure is also applied to validate the system simulation model: current profiles from measurements are used to assess and verify the voltage response during charging and discharging, read from the voltage sensor connected in parallel with the current source. At this stage, the model is used in an open-loop fashion, meaning that it does not account for changing temperatures due to power losses in the cells, but rather prescribes constant cell temperatures. Once the model is validated, it can then be embedded in the CFD simulation, as described in the following.
Whereas the system simulation reflects the electrical setup of the stack, the thermal interconnections between the cells, and thus their orientations to each other, as well as their thermal properties, are modeled in CFD.
Figure 7 shows the basic idea of the co-simulation between the electrical system simulation model and the thermal CFD model. Between the models, the temperatures are passed from the thermal model to the electrical model and, vice versa, the heat flow rates from the electrical to the thermal. The so-called watch parameters and watch variables are defined within the system simulation model, to possibly change system simulation model parameters and to access result variables from the CFD model.
The implementation of the co-simulation was made by means of the FMI standard [
21] that allows exchange of models between different simulation tools, since both Simcenter Amesim and Simcenter STAR-CCM+ support this standard. Specifically, the FMI standard is used in the co-simulation protocol according to the FMI 2.0 standard. A Functional Mockup Unit (FMU) is generated in Simcenter Amesim with three steps: adding an interface block to the model (shown in
Figure 6); removing the dummy signal components; connecting it to the current source and thermal adapter components. Eventually, the FMU is imported into Simcenter STAR-CCM+ with the complete electrical characterization that was conducted during the experiments and system simulation.
5. CHT Simulation
In this section, the setup of the three-dimensional CHT simulation is explained. The software used is Simcenter STAR-CCM+, version 2021.1 [
24], a multi-physics CFD-focused platform, based on a Finite-Volume approach for space discretization and a second-order temporal discretization of the transport equations, i.e., Navier-Stokes and energy equation.
Due to the constant air mass flow provided by the fans, the flow field can be seen as steady, and changes only in reaction to the temperature effects via heat transfer from the surrounding solid regions, e.g., the cooling fins. Hence, in the present case study, a multi-time scale workflow is employed, in which steady and transient solvers are combined. The transient behavior of the solid domains is calculated by using an algebraic multi-grid based iterative solver that is second order accurate in space and time. The fluid flow is captured by applying an eddy-viscosity based Reynolds Averaged Navier Stokes (RANS) solver, in which a predictor-corrector approach is used for the velocity-pressure coupling, based on a Semi-Implicit Method for Pressure Linked Equation (SIMPLE) algorithm, with second-order accuracy in space. The κω-SST turbulence model [
25] with a low-y
+ mesh approach is employed for an optimal modeling of wall turbulence.
The solid domains consist of the cooling fins, the printed circuit boards (PCBs), the cell tabs, the stack cages, and the battery cells, as portrayed in
Figure 8. For each of these, components were modeled with corresponding material values (e.g., thermal conductivity and density). The voids of the stack cages are modeled as solid regions (with air material properties) for solver stability and reduction of calculation time: separate investigations are conducted to assess that this choice has only a marginal influence on the heat transfer, but great computational advantages. The stacks of the active material layers of the pouch cells are modeled as a homogenized body with orthotropic thermal conductivity
, assuming
W·m
−1·K
−1 z-direction and
W·m
−1·K
−1 in in x- and y-direction (see
Figure 8). The battery cells are packed closely in the stack cages and are not in direct contact with the cooling fluid. Instead, the heat is conducted away through the cell tabs, which are located at the top end of the cells and connected to the cooling fins.
The transient energy equation for the battery cell level can be written as:
with
the heat source calculated by the electrical cell model in the FMU, depending on the SoC, the cell temperature
and the current
at the respective time step.
The symmetric architecture of the battery system allows the simulation setup to be reduced to six cell stacks, representing half of the battery system: a symmetry boundary condition is therefore applied to the symmetry plane, as displayed in
Figure 8. On all other outer system boundaries apart from the inlet and the outlet, a convection boundary condition with a heat transfer coefficient of 6 W·m
−2·K
−1 is applied, representing a natural convection in the battery container. The fans at the back of the battery container are modeled as a constant air mass flow of 0.0045 kg·s
−1. The driving heat transfer modes inside the battery container are conduction and convection and, due to the limited expected temperature below 60 °C, the influence of radiation is considered negligible and therefore neglected. For the fluid region, i.e., the cooling channel, the mesh consists of around 12 million cells, while all the solid regions together consist of around 11 million cells.
The small impact of the temperature change on the fluid flow and the different time scales between the solid and fluid continua in terms of propagation of temperature allow for the utilization of a steady-state fluid solver that is updated periodically, mimicking a transient behavior. For the multi-time scale workflow, a time step of 0.1 s is employed for the implicit unsteady solver of the solid continua, whilst the steady state solver of the fluid continua is updated every 60 s of simulation time by running 20 iterations, until converged, for the prevalent conditions of the solid continua. In the underlying case study, this multi-time scale workflow has proven to be computationally less expensive, with a negligible deviation compared to the fully time dependent simulation.
As described in
Section 4, the system simulation model represents a complete cell stack, incorporating 24 of the previously parameterized battery cell models, consisting of two cell pairs. The system simulation model is now exported as a Standalone FMU, allowing Simcenter STAR-CCM+ (that acts as the master tool for the coupled electro-thermal simulation of the battery system) to call the FMU for the co-simulation, independently of the secondary controller tool (Simcenter Amesim [
23]). For a FMU to be called by the CFD simulation, it must be embedded in Simcenter STAR-CCM+, specifying the exchanged variables, the exchange time step and optional watch parameters to access electrical quantities in the CFD simulation. Since six cell stacks are necessary in the CFD setup, the same FMU is imported six times and the inputs (
) and outputs (
) are linked to the three-dimensional volumes of the respective cell pairs, allowing for the models to exchange data in a closed loop. The latter, with an exchange interval of 0.1 s, consists of the following steps: the mean temperature of each cell pair is evaluated in the CHT simulation at each (solid continua) time step, then passed to the FMUs; the latter evaluate the corresponding generated heat (calculated by the underlying electrical model in the FMU itself); finally, this value is imposed as a volume heat source for each cell pair in the CFD calculation. Each cell pair, as any other geometry part, is discretized in space in the three spatial dimensions, so that all physical quantities (e.g., temperature) can be evaluated in each discretization point (i.e., each mesh point) and an inhomogeneous profile on the surfaces and in the volumes can be observed. The current profile applied in the CFD simulation is a recorded profile measured during an endurance race.
The temperature of the battery pack and the velocity field inside the cooling channels at the end of the endurance race simulation can be seen in
Figure 9a. The development of the average temperature, the voltage and the SoC over time in a selected cell pair (S1P12 = stack 1, cell pair 12) are shown in
Figure 9b–d. In general, the results show the expected behavior of the electrical and thermal quantities for the applied current profile of the endurance race. The plateau that can be seen in electrical and thermal values from 725–975 s corresponds to the driver change phase, in which the car stands still and the current load is zero. Furthermore, the simulation results fit well with the target values that have been defined during the battery development. For an initial temperature for air and solids of 30 °C (which represents a canonical weather condition at Hockenheim in summer) the hottest cell of the battery pack reaches a maximum temperature of 59.2 °C at the end of the endurance race, which is slightly below the temperature limit defined by the competition rules [
26]. The temperature spread inside the selected cell pair amounts to 7.9 °C and is below the limit of 10 °C that is linked to accelerated aging in a battery cell. According to the simulation, the car reaches the end of the endurance race with a remaining state of charge of 7%, which shows that the battery pack provides enough energy, but also points to a possible improvement of the energy management strategy.
7. Conclusions
In this paper a novel, multi-disciplinary approach is presented to characterize and simulate the BTM (Battery Thermal Management) of a battery pack for a race car, leveraging and combining experiments, systems and CFD simulation. First, a single cell is experimentally investigated to identify the equivalent circuit model under different temperatures. The cell model parameters are calibrated using a standard workflow from experimental data. This calibration workflow can be easily applied to other battery cells. By using the identified cell model, a system level battery stack model is set up and is then exported into a FMU by means of the FMI standard to ensure the scalability, re-usability, and portability of the model. Finally, the FMU is embedded in a CFD simulation where the cooling of the battery pack is simulated. This procedure allows a detailed CFD fluid-solid simulation that embeds experimental characterization, as well as the functional interconnection of cells at system level. In addition, the 1D and 3D co-simulation using the FMI standard highlights the advantages of the proposed approach to evaluate directly any operating conditions without the need to have a heat transfer map for pre-defined operating conditions, as in [
4,
20].
The same procedure can also be applied to model and simulate battery packs with different types of cooling strategies, e.g., with liquid cooling. In addition, if an empirical battery aging law is available, it can be added to the battery pack model in order to study the battery aging under different operating scenarios. Last but not least, the battery pack model can be integrated into a full vehicle system model to analyze the interactions with other subsystems, such as the electric motors and inverter.
As future research directions, the proposed approach can be adapted for other types of battery thermal management systems, such as those with heat pipe, phase change material, and immersion cooling. In addition, the cell thermal modeling can be further improved in the CFD model to distinguish the inner-cell material from the cell casings, as in [
31].


 and
and 


