Article

Technical Feasibility of Heavy-Duty Battery-Electric Trucks for Urban and Regional Delivery in Germany—A Real-World Case Study

1
Fraunhofer Institute for Systems and Innovation Research ISI, Breslauer Str. 48, 76139 Karlsruhe, Germany
2
Karlsruhe Institute of Technology, Kaiserstraße 12, 76131 Karlsruhe, Germany
*
Author to whom correspondence should be addressed.
World Electr. Veh. J. 2022, 13(9), 161; https://doi.org/10.3390/wevj13090161
Submission received: 5 August 2022 / Revised: 18 August 2022 / Accepted: 18 August 2022 / Published: 27 August 2022

Abstract

:
Cutting greenhouse gas emissions to comply with the Paris Agreement is challenging for road freight. While heavy-duty battery-electric trucks (BET) promise tremendous and immediate reduction potential, literature increasingly confirms technical feasibility in general, and several manufacturers launched BET models. However, their real-world application is still being questioned by fleet owners due to the limited range or payload penalties. Thus, our case study aims to assess the technical feasibility of urban and regional delivery in Germany based on real-world and per-vehicle operational data that feed into an energy simulation with Monte-Carlo modeling. Our results demonstrate the importance of vehicle-specific examination for the right battery capacity that ideally matches the vehicle’s operating profile. We find that full electrification may be most accessible for 18-t and 26-t rigid solo trucks, soon followed by tractor-trailers, while truck-trailers turn out as most challenging. With up to 600 kWh battery capacity available in all truck classes, we find nearly 40% of all transport performance and 60% of all diesel trucks may be replaced with BET—while already 400 kWh is sufficient for half of all trucks. Additional measures such as intermediate charging and adjusted and more flexible truck-tour allocation may significantly accelerate electrification.

1. Introduction

A broad consensus has been reached that cutting greenhouse gas (GHG) emissions rapidly and eventually reaching climate neutrality by 2050 is essential to comply with the Paris Climate Agreement, i.e., to keep the global mean temperature below 1.5 °C, and thus mitigate the anthropogenic climate change. Today, despite their minor significance in the total vehicle fleet, heavy-duty vehicles contribute about 8% of the total EU GHG emissions [1]. While several technological pathways for zero-emission trucks exist, heavy-duty battery-electric trucks (BET) benefit from the technological experience and recent battery innovations—i.e., costs, volumetric and gravimetric energy density, and fast charging capability [2,3,4]—and, thus, short-term large-scale availability [5]. The increasing European manufacturer commitment toward BET further accentuates this shift [6].
The literature increasingly confirms technical feasibility in general. While several studies imply a great potential for urban and regional delivery with a daily mileage lower than 400 km [3], most recent studies even see long-haul transport close to a threshold where BETs become feasible [3,4,7]. Despite this commitment and literature-proofed feasibility, truck fleet owners are still questioning the technical feasibility of BETs for their application in light of limited vehicle range, insufficient public charging infrastructure, and payload restrictions [8,9]. This individual reservation demands a shift from generalized feasibility assessments based on synthetic operating schedules [10], fleet analyses [11,12], or standardized driving profiles and generic use patterns [2,3,4,7,13]. Thus, we aim to assess the technical feasibility of BETs with a comprehensive case study by using real-world and per-vehicle operational data. This answers which shares within the truck fleet may be replaced by BET today and which technological or operational factors may boost or limit electrification.
The paper is structured as follows: First, we introduce the data and describe our methods to evaluate the technical feasibility in Section 2. Section 3 continues with data evaluations and presents our results. Section 4 discusses our results and their representativeness. We close with conclusions and recommendations in Section 5.

2. Data and Methodology

2.1. Operational Vehicle Data

We use tour data from the food retail industry that is provided by commercial tour scheduling software (CSV format) for two depots in the northeast region of Germany. Our sample covers one month from 2021, roughly 9500 individual tours, 543 retail stores, around 1 million km, and 224 different trucks operating within 220 km around Berlin. These are refrigerated trucks with a gross vehicle weight (GVW) of 18 or 26 tons as rigid trucks, truck-trailer combinations, and tractor-semitrailer combinations. The data cover the planned temporal sequence, routing, and payload information. Each tour starts and ends at either one of both depots. Based on timestamp information, we chain these individual tours to more than 4000 daily tours. While Depot1 primarily supplies Berlin and partially the metropolitan area, Depot2 additionally supplies the entire northeast region. Figure 1 shows both depot locations within the northeast region. Evaluations and statistics are provided in Section 3.1.

2.2. Methodology

2.2.1. Energy Simulation

The technical feasibility involves a tour-specific energy simulation for each truck. First, we use the simplified mathematical-physical vehicle model by [14] to account for vehicle dynamics and energy losses related to aerodynamic drag forces, frictional forces, and inertial forces (Equation (1)). Second, we incorporate energy demand from both accessories and refrigeration as well as restrictions to the depth of discharge (DoD) and minimum residual range requirements (Equation (2)). Parameter and values are shown in Table 1 and Table 2.
E d r i v i n g = [ ( 1 2   ·   ρ · C D · A ·   v r m s 3 + c r r · m T   · g · v a v + α · m T   · g · v a v ) η b w + R e k u · m T · a a v · v a v   ·   ( 1 η b t w η b t w · η b r k ) ] ·   D v a v
E r e q = E D r i v i n g + P A u x ·   t D r i v i n g + P C o o l ·   ( t D r i v i n g + t S t o p p ) + E R e s i d u a l η D o D  
E d r i v i n g represents the net battery capacity [kWh] required to overcome all driving resistances. Major parameters are vehicle drag coefficient ( C D ) , vehicle frontal area ( A ) , mean vehicle velocity ( v a v ) , root-mean-square velocity ( v r m s ) , mean vehicle acceleration ( a a v ) , tire rolling resistance coefficient ( c r r ) , trip distance ( D ) , and total vehicle mass ( m T ) . Truck specifications such as aerodynamics, tire rolling resistance, and diesel chassis curb weight are based on empirical data [14] and aggregated per truck class—lower quantile (Q25), median (Q50), and upper quantile(Q75). Tour-specific parameters such as payload, mean vehicle velocity, trip distance, or timestamps for driving and stopping are taken from the tour scheduling software. Parameter ( α ) approximates the average road gradient per tour that is calculated based on truck routing software [15]. This involves a piecewise linearization of the reconstructed tour (500 m steps) and the calculation of distance-weighted quantiles (Q25 and Q75) as minimum and maximum values. We adopt the most likely value from [16]. The root-mean-square velocity is calculated using the Steiner–König–Huygens theorem, including crosswind influence. The mean vehicle acceleration is approximated by cycle-specific values based on 18 different American driving cycles [17]. Since urban driving usually features higher dynamics due to stop-and-go traffic, traffic lights, or planned stops per distance than regional deliveries, we distinguish between both use cases. η B T W denotes the battery-to-wheels efficiency and summarizes battery discharge efficiency ( η B a t t e r y ) and drivetrain efficiency ( η D r i v e t r a i n ) . The proportion of recoverable energy is specified via R e k u . η b r k accounts for additional braking losses. m T represents the total truck weight, comprising truck curb weight, potential trailer curb weight, and tour-specific payload [kg]. Here we apply a top-down approach starting from diesel truck values, suppose a common vehicle chassis, and then calculate the possible BET curb weight. Therefore, we subtract all major diesel powertrain-related components such as the ICE, gearbox, and fuel tank from the diesel curb weight ( m C u r b _ D ) . Afterward, we add major electric powertrain components such as motor and battery. For truck-trailers and tractor-trailers, we add the trailer curb weight. We close by adding the tour-specific payload weight.
E r e q represents the gross battery capacity [kWh] required to complete any tour successfully. We approximate additional per-vehicle energy demand from accessories (pneumatics, hydraulics, heating and air conditioning (HVAC), on-board power grid) by using mean power consumption ( P A u x ) per driving time ( t D r i v i n g )—following [18,19]. Likewise, the energy demand for refrigeration ( P C o o l ) is calculated. However, continuous refrigeration is needed even during stationary periods at the retail stores ( t S t o p p ). The mean power consumption—generally highly dependent on the temperature delta, the cooling volume, and the frequency of opening and closing—is calculated based on the ATP/DIN 8959. The temperature difference is assumed to be 25 °C. The customer-specific safety margin corresponds to about 20–30 km of residual range.
Main uncertainties result from the energy consumption formula (Equations (1) and (2)) based on the simplified vehicle model, uncertain technical vehicle parameters, and variable and dynamic real-world operating conditions. We follow [14] and cast all major parameters using individual PERT distributions to increase robustness instead of running sensitivity analyses of selected parameters afterward. Minimum, most likely, and maximum values are specified based on empirical data, literature values, or assumed to spread ± 20%. Finally, we perform a standard Monte Carlo simulation for each tour (n = 100). Table 1 and Table 2 indicate the chosen approach and parameter spreads. We perform all calculations on a standard Lenovo notebook with i7-8565U @1.8 GHz and 16 GB RAM.

2.2.2. Assumptions and Premises

There is no tour optimization, truck re-allocation, or adjusted scheduling for all calculations. Tours are presumed to be exactly as of February 2021 so that potential BET would mimic the existing diesel truck schedule. There is no opportunity for public charging during mandatory driving breaks, as these coincide with the stops at customer retail stores. Thus, private or semi-public charging infrastructures may be the most promising possibility to avoid time losses.

2.2.3. Feasibility Calculations and Scenarios

We simulate gross battery capacities between 100 and 800 kWh in 50 kWh increments per truck and compare those against the required gross battery capacity ( E r e q ) . This happens for each tour. We include higher permitted GVW limits for BETs in Germany, i.e., up to 2 tons depending on truck class [25]. If E r e q is lower than the simulated battery capacity and the permitted GVW is not exceeded, this simulation run is labeled as “technically feasible”. If at least 95% (i.e., 95 out of 100) of all simulation runs are labeled as “technically feasible”, we label this tour as “technically feasible”. If all tours per vehicle are labeled “technically feasible”, we affirm the BET replacement for this truck and denote the simulated gross battery capacity. This approach is rather restrictive, as just one daily tour might negate BET replaceability.
We investigate three scenarios in total. Our base scenario (S0) assumes that vehicles depart from the depot fully charged in the morning, and installed gross battery capacities must be sufficient throughout the day. Additionally, we investigate the effect of private charging opportunities to extend vehicle coverage. Thus, we integrate potential intermediate depot-charging within the depot premises (S1) at the beginning of each tour that might happen directly at the cargo terminals during vehicle commodity loading ( t L o a d i n g ). Additionally, we investigate the effect of charging opportunities at individual customer retail stores (S2), where the stop time ( t S t o p p ) at the local cargo terminals might be used for charging. We still assume vehicles depart from the depot fully charged in the morning. Vehicles recharge without time losses in both scenarios, and the tour schedule is maintained. We approximate the state of charge (SoC) evolution throughout any tour based on consumed energy (driving, accessories, and cooling) per traveled distance. For depot charging, we consider six different peak charging powers ( P C h a r g e , D e p ) . For individual retail stores, we explore the effect of 150 kW peak charging power ( P C h a r g e , C R ) at any retail store. The latter might align with a joint passenger car charging infrastructure deployment at local customer parking lots. We use an average charging power across the whole SoC corridor based on peak charging power, empirical findings on the average net charging power η N C P from passenger cars, and a 2C charging rate limit. Parameters are included in Table 2.

3. Results

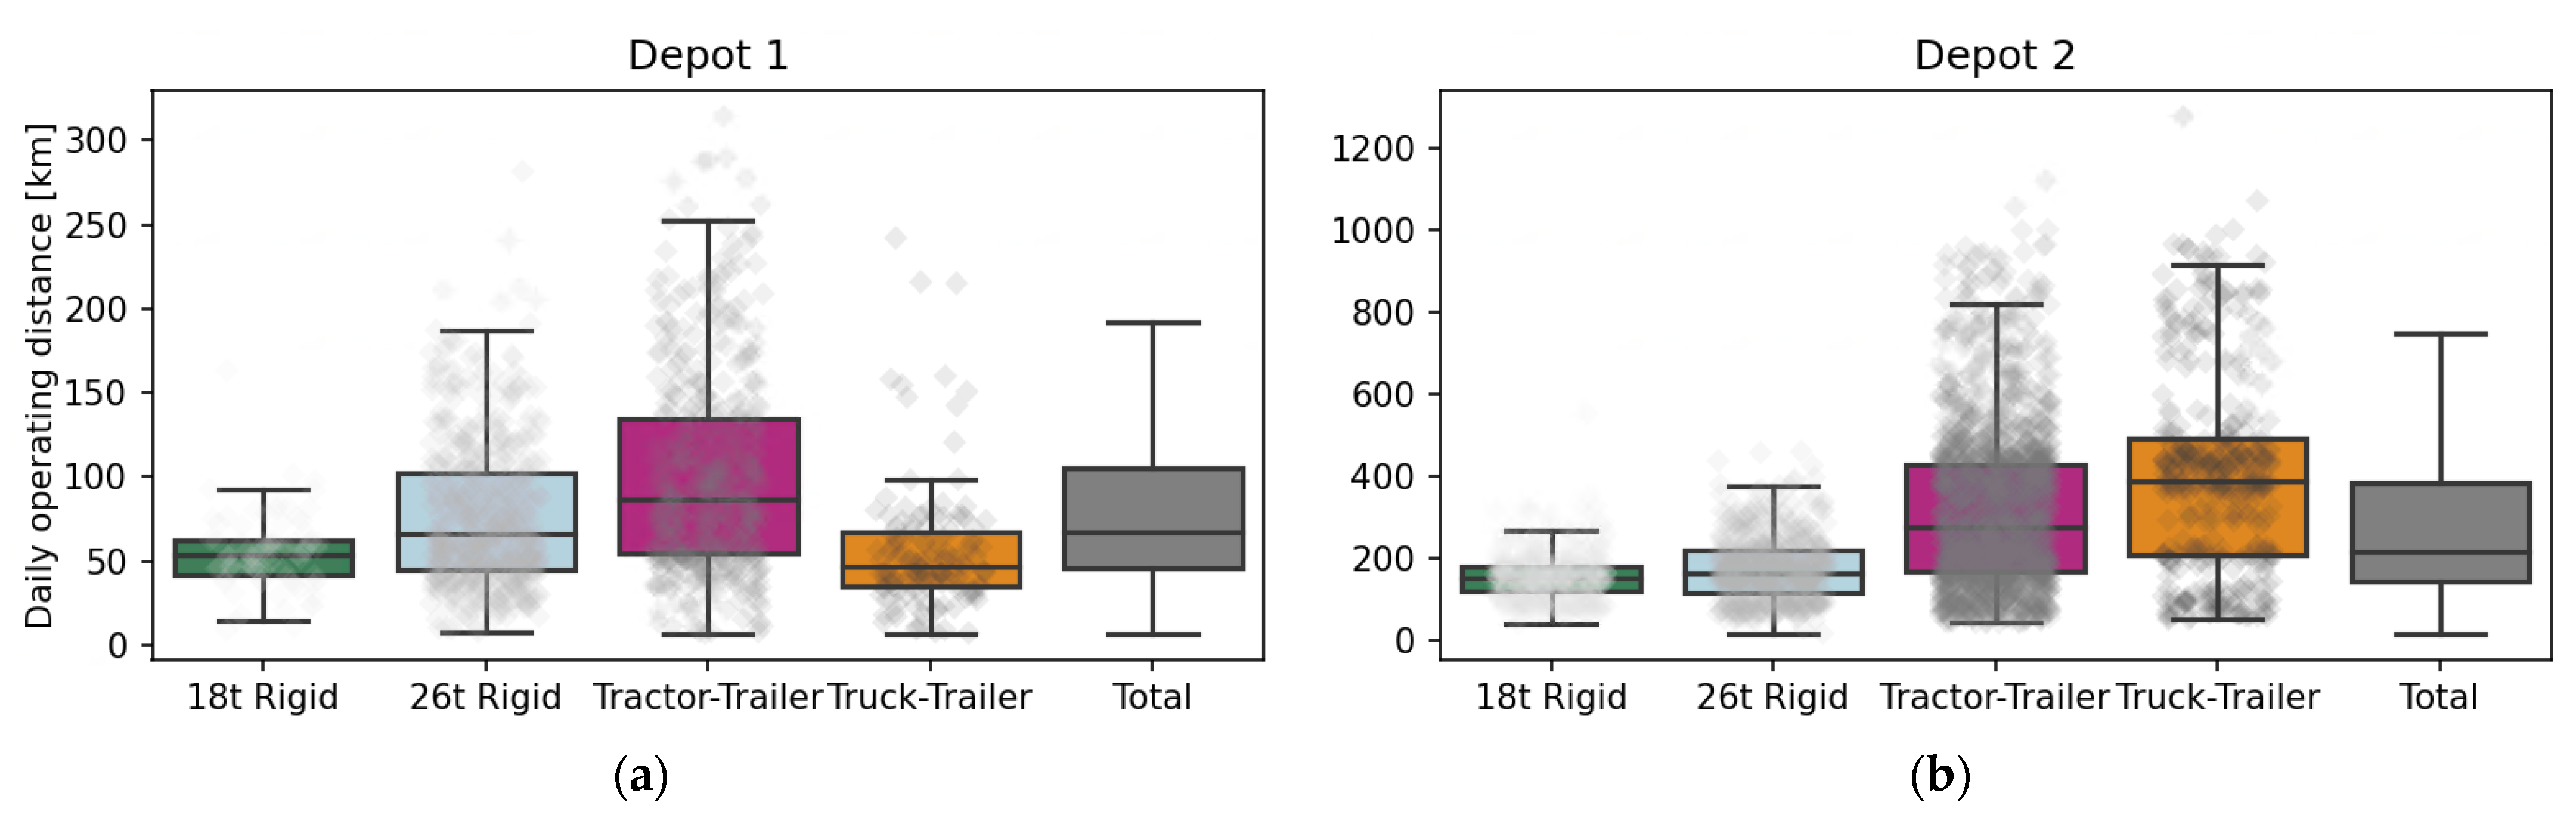
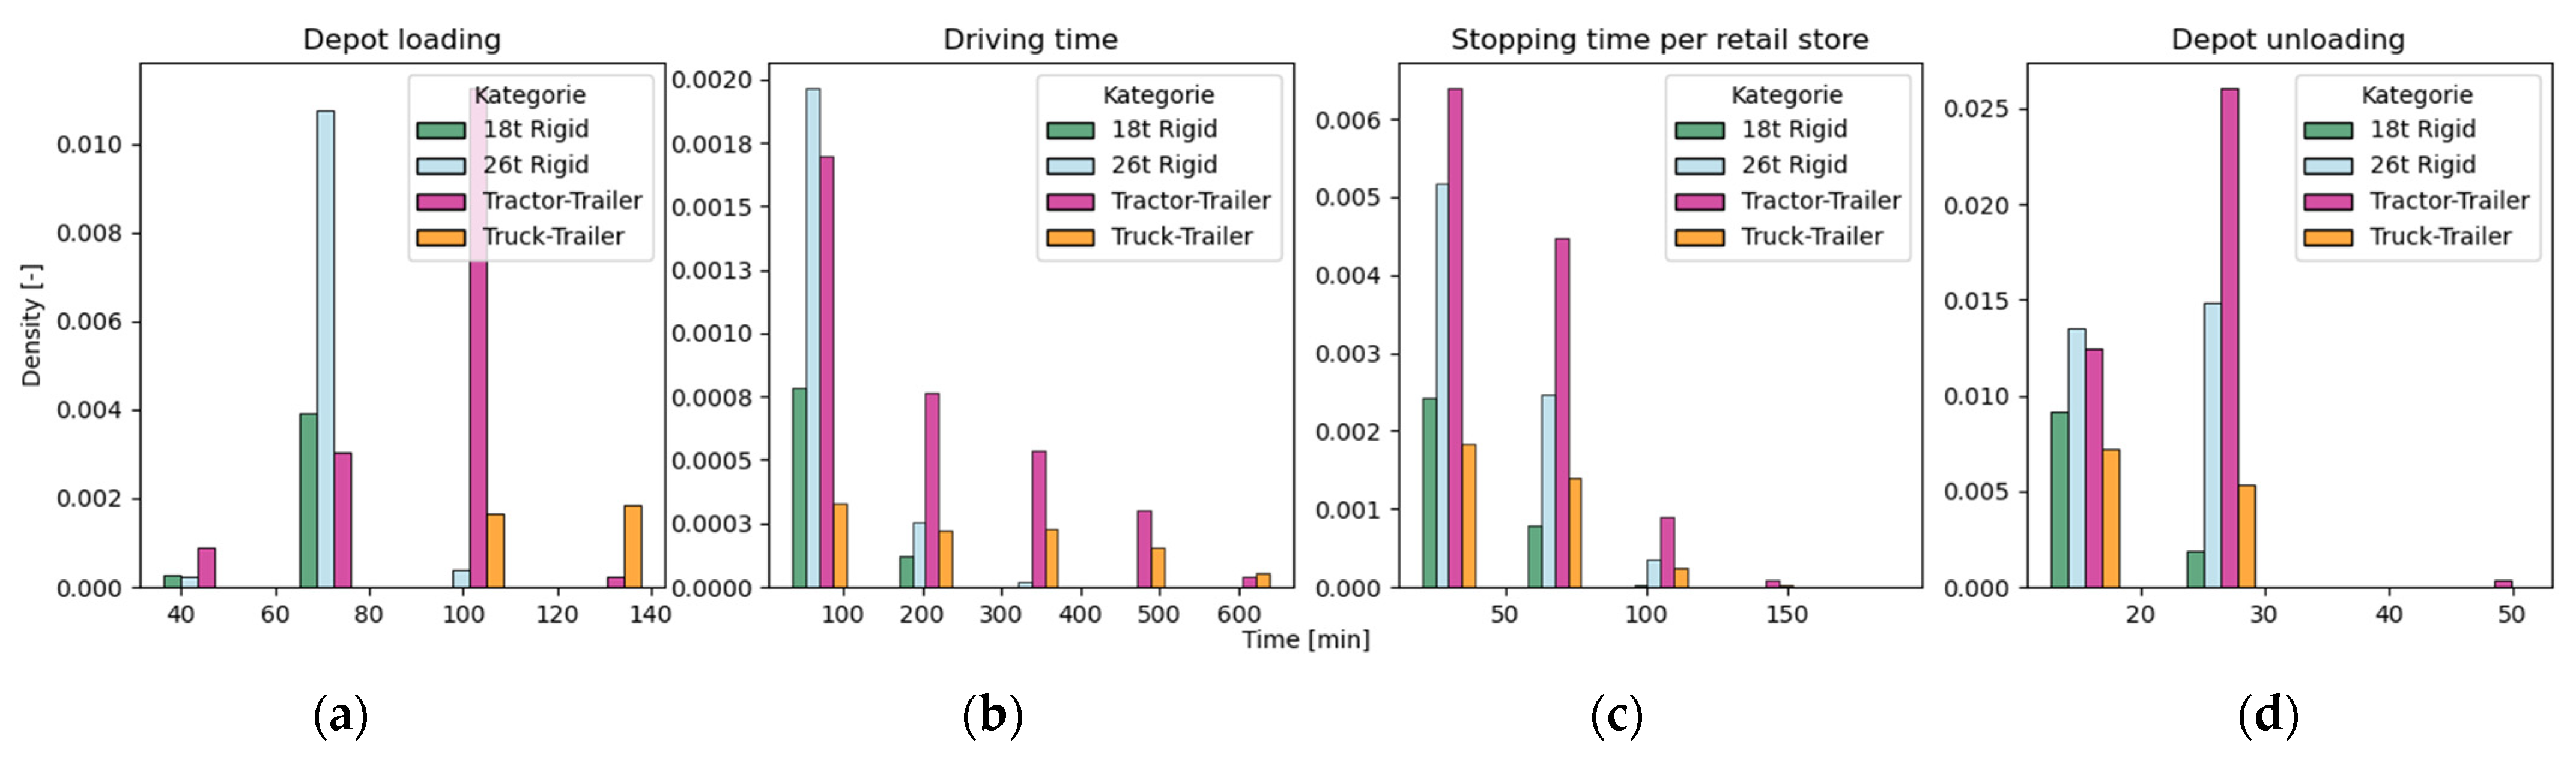
3.1. Operating Patterns: Daily Mileage and Timestamps

The daily operating distances are visualized in Figure 2. The visualization splits per truck class and depot location and involves aggregated boxplots and individual values as scatter. The daily operating distance typically ranges from 46 to 105 km (25% and 75% quantile) for Depot1 and from 143 to 384 km for Depot2. Across both depots, we typically find 1–5 daily tours per truck. Each tour usually serves 1–4 customer retail stores. Rigid trucks (18 t and 26 t) focus on Berlin and the metropolitan area, while truck-trailer and tractor-semitrailer combinations also supply the entire northeast region. Daily mileages in the urban and metropolitan deliveries are usually less than 200 to 300 km, while from 500 to 700 km may be a typical upper limit for regional deliveries. However, over 800 to 1200 km are possible in multi-shift and cross-daily operations.
The corresponding daily operating times are visualized in Figure 3. Vehicle scheduling specifies four timestamps, from vehicle loading at the cargo terminals within the depots ( t L o a d i n g ), driving time ( t D r i v i n g ), stop time at customer retail stores ( t S t o p p ), and eventually vehicle unloading at the cargo terminals to complete one single tour. The visualization aggregates depot locations and visualizes each truck class separately. While vehicle loading typically takes 60–80 min (lower and upper quartile) for rigid solo trucks, 90–110 min for tractor trailers, and 110–120 min for truck-trailers. Similar to the daily mileage, truck trailers and tractor trailers exhibit higher driving times and wider span compared to rigid solo trucks. Stops at customer retail stores typically last between 40–60 min across all truck classes, with over 80 min occurring as well, especially for larger truck classes. Eventual unloading takes only 15–22 min across all truck classes. As mentioned earlier, additional breaks such as the mandatory 4.5 h driving break are not scheduled as these are covered at customer stops.
To derive net charging times from t L o a d i n g and t S t o p p , we need to approximate potential time losses for waiting, vehicle docking, or connecting to the charging station. Here, we refer to the difference between our tour data’s planned and actual data. We find certain deviations between planned and actual data so that specified planned timestamps are undercut, and only 65% to 85% of the specified planned times are usually obtainable. Thus, we multiply t L o a d i n g and t S t o p p and reduce the possible charging time by this fraction ( r P l a n V S A c t u a l ) . For the solo trucks, only 39–68 min would be available during vehicle loading at the depot (instead of the 60–80 min). In addition, we set 10 min as the minimum net charging time to ensure practical implementation.

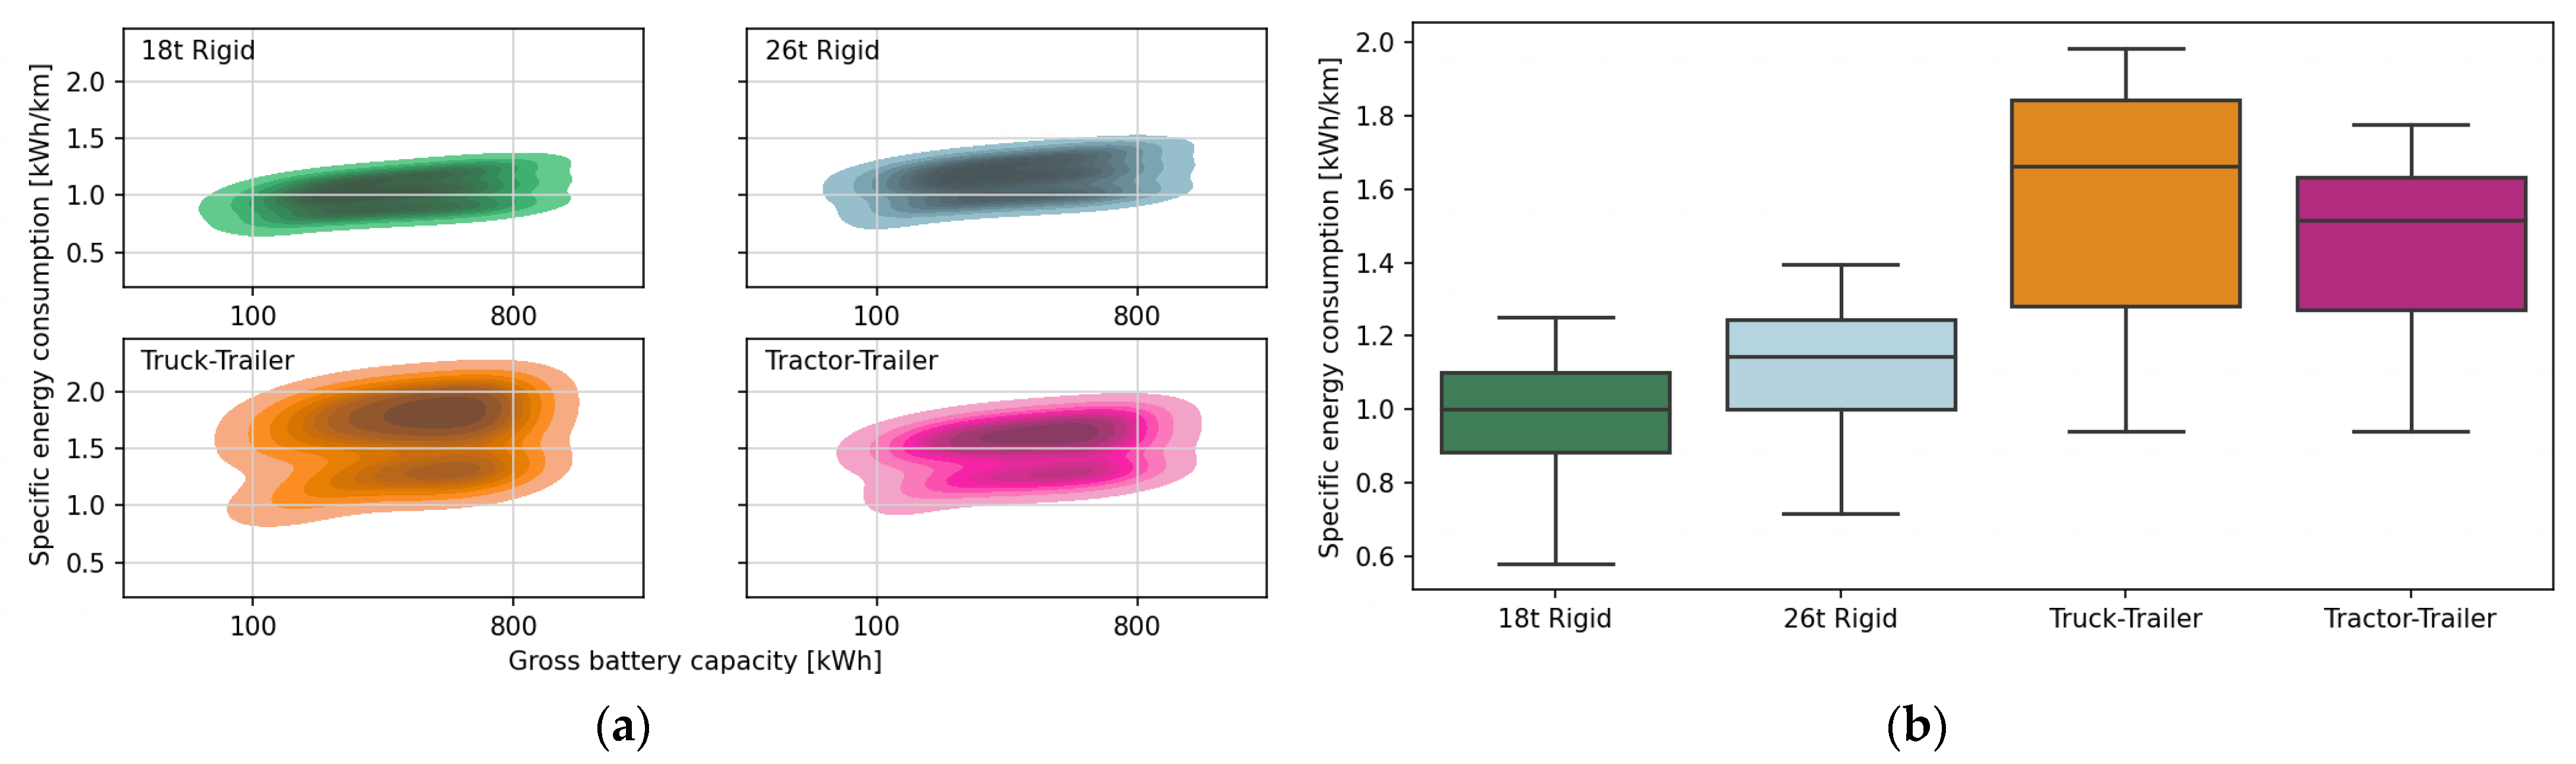
3.2. Simulation Results: Specific Energy Consumption

Figure 4 shows our simulation results for the specific energy consumption. The left side visualizes the energy consumption as a density plot per truck class over different battery capacities to illustrate the spread and influence of larger batteries. Note that the density plots extrapolate beyond simulated battery capacities. The right side shows the sample-weighted boxplot per truck class and aggregated over all battery capacities, whereas outliers are removed. All plots comprise only feasible tour-battery combinations. The sample-weighted median spans from 1.01 kWh/km for the 18-t rigid truck, 1.14 kWh/km for the 26-t rigid truck, and 1.52 kWh/km for tractor-trailers, to 1.66 kWh/km for the truck-trailer combinations. The higher variation for tractor-trailers and truck-trailer is striking and may be attributed to broader territorial coverage and thus operating patterns. Depending on the truck class and total operating times, around 0.1 to 0.4 kWh/km on average may be attributed to accessories and refrigeration.

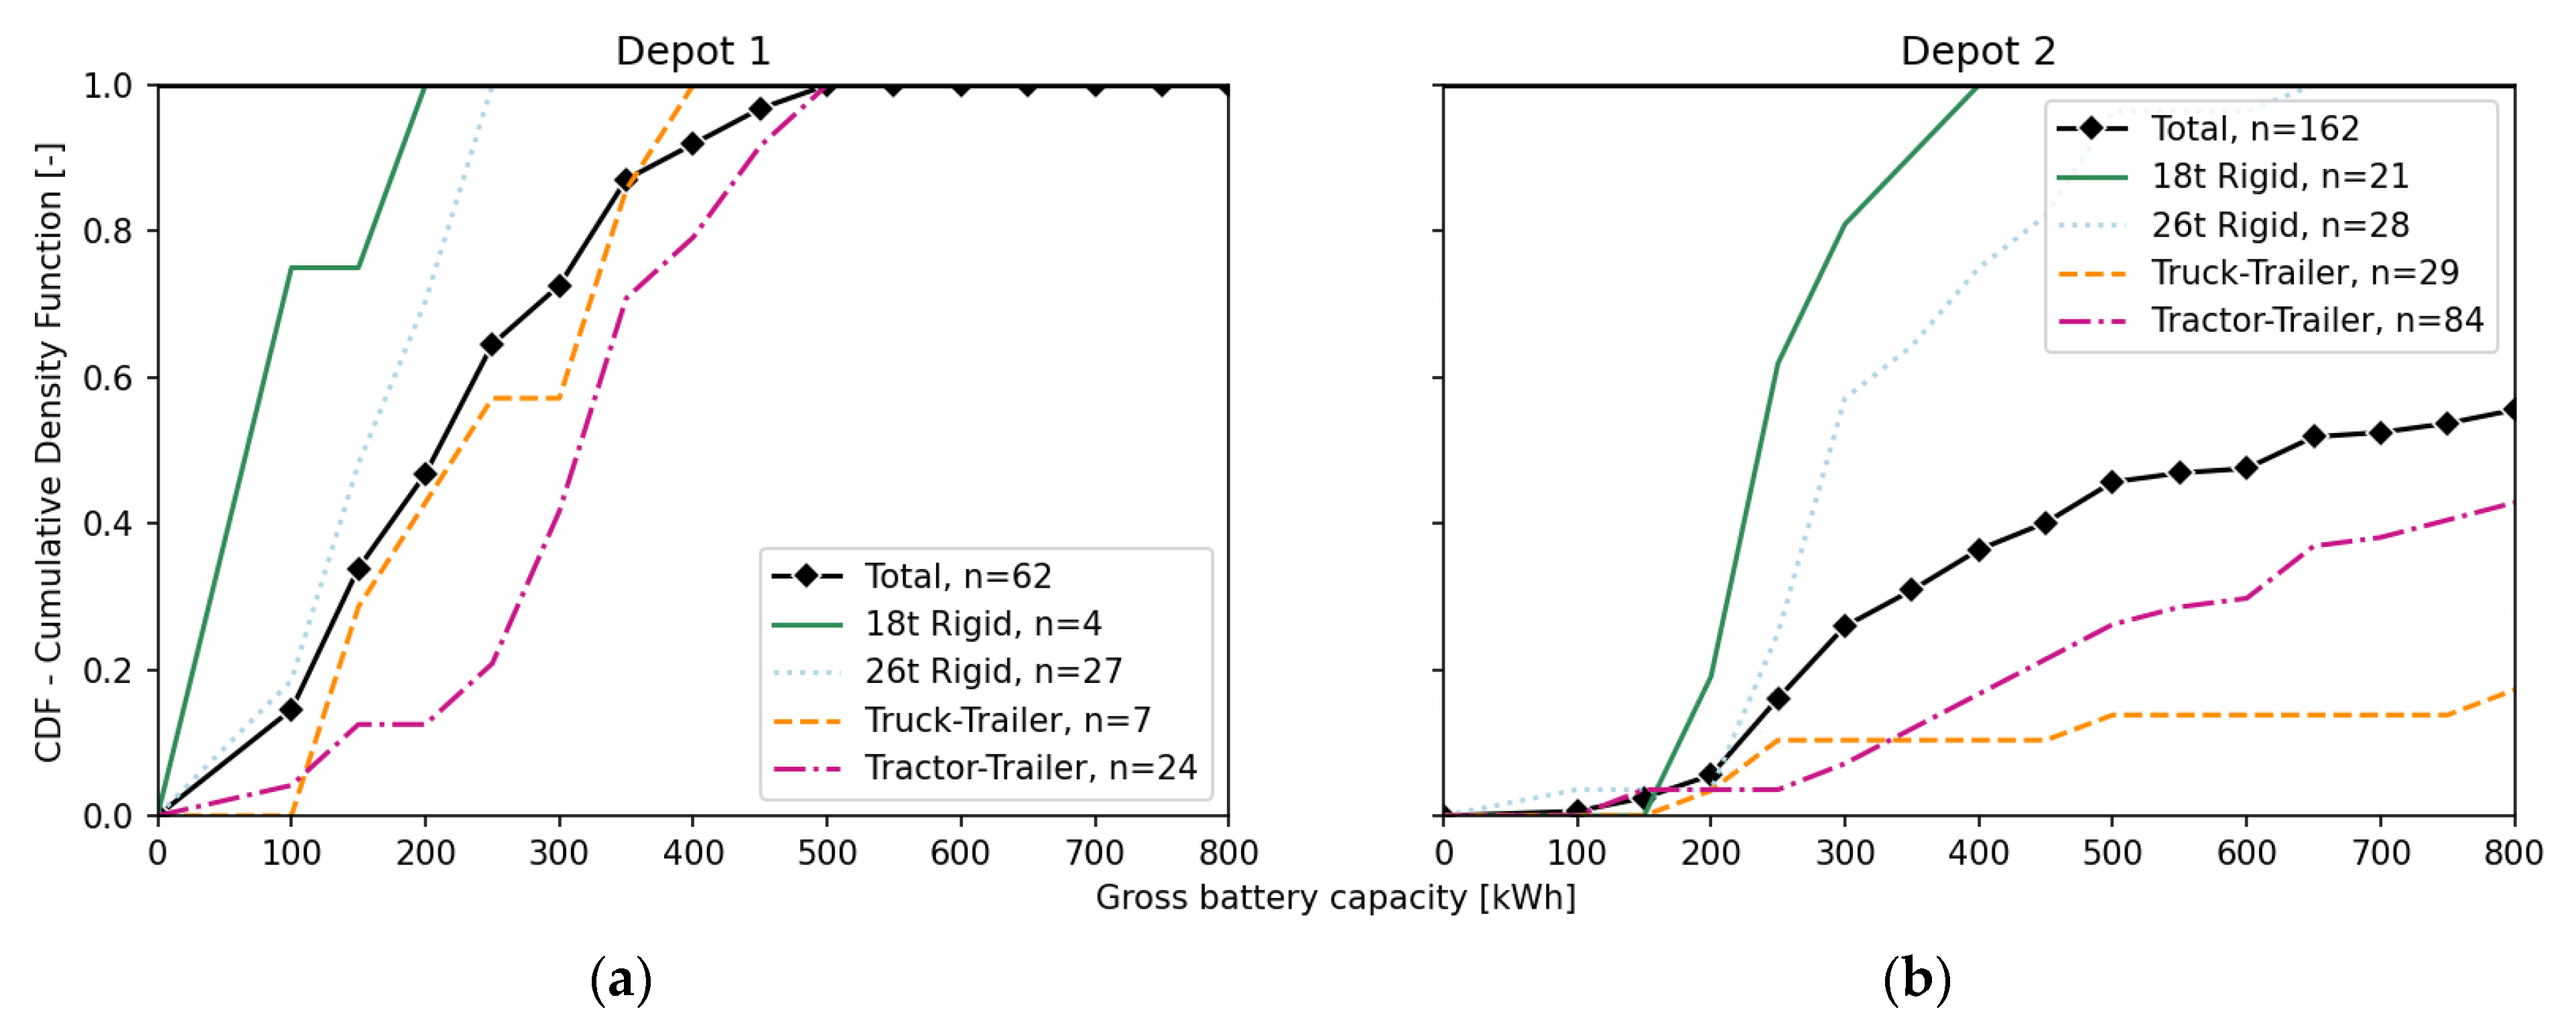
3.3. Scenario 0: Technical Feasibility without Intermediate Charging

The effect of different battery capacities on BET feasibility aggregated per truck class is visualized in Figure 5. The y-axis (CDF—cumulative density function) indicates the share of feasible trucks that would cope with this or less gross battery capacity throughout each vehicle’s daily tours. We remark that we require all daily tours per vehicle to be technically feasible to affirm its BET replaceability.
For Depot1, the technical feasibility is high given that primarily urban and partially metropolitan operating areas and daily operating distances are usually below 300 km. Battery capacities from 100 to 200 kWh for 18-t rigid trucks and 100 to 250 kWh for 26-t rigid trucks are sufficient for full electrification. Truck-trailers (400 kWh) and tractor-trailers (550 kWh) require slightly larger batteries. The highest gains are reached between 250 and 350 kWh. Up to 400 kWh is sufficient to affirm 80% BET replaceability for the whole fleet. If we had required all simulation runs per tour to be technically feasible instead of 95%, we would have increased the capacities for full electrification to 450 kWh for 26-t rigid trucks and 550 kWh for truck-trailers, and 650 kWh for tractor-trailers. Up to 400 kWh would then be sufficient to affirm 75% BET replaceability for the whole fleet. The GVW limits may be exceeded for rigid trucks at around 450 kWh and 650 kWh for tractor-trailers. We conclude that around 400 kWh may already be sufficient to replace over three-quarters of the truck fleet, while around 600 kWh may be sufficient to replace the entire one.
For Depot2, the technical feasibility is significantly lower given the greater operating area in the northeast region, so larger batteries are required. Battery capacities from 100 to 400 kWh for 18-t rigid trucks and 200 to 650 kWh for 26 t rigid trucks are sufficient for full electrification. The vast majority (80%) of rigid trucks require 200 to 350 kWh (18-t rigid) or 200–450 kWh (26-t rigid). For truck-trailers and tractor-trailers, full electrification even fails. Around one-third of all tractor-trailers may be replaced with up to 600 kWh. With up to 800 kWh, only 18% of truck-trailers and 42% of tractor-trailers may be replaced. Overall, 37% of the total fleet may be electrified with up to 400 kWh, 48% with 600 kWh, and 56% with 800 kWh. If we had released our 95% feasibility threshold per tour, fleet replaceability for Depot2 would have dropped to 29% (400 kWh), 42% (600 kWh), or 50% (800 kWh).
If we consolidate both truck fleets, we find 52% BET replaceability with 400 kWh, 62% with 600 kWh, and 68% with 800 kWh. If we had required all simulation runs per tour to be technically feasible, the total fleet replaceability would have dropped to 44% (400 kWh), 57% (600 kWh), or 63% (800 kWh). Thus, given the available and announced battery capacities across all truck classes, we conservatively conclude that at least half of the total truck fleet is suitable for ad-hoc electrification.
The following section discards aggregating tours to trucks and focuses solely on the feasibility of individual tours to answer how many of the 4000+ daily tours would be feasible if examined separately. Through this, we want to approximate the effect of a modified tour planning (sequence and vehicle assignment). Daily trip chains remain untouched, and tours are still presumed to be exactly as of February 2021. The effect is visualized in Figure 6. Here we distinguish between simple tour count and the associated transport performance (i.e., ton-kilometers) per tour as a common metric in transport statistics. The y-axis indicates the share of feasible daily tours or electrifiable transport performance with this or less gross battery capacity.
For Depot1, battery capacities between 200 and 300 kWh are sufficient to electrify 83 to 94% of all tours. Up to 400 kWh are sufficient to electrify almost all tours (99%) and, as the previous analysis has shown, 550 kWh are required for full electrification. Feasibility in terms of transport performance is lower, most likely because this adds information in terms of short and light-loaded tours versus long and heavily loaded tours instead of equal counting. However, 400 kWh is still sufficient to electrify 94% of all ton-kilometers. If we had required all simulation runs per tour to be technically feasible, the effect would have been negligible as almost 98% of all tours, or 92% of all ton-kilometers, respectively, would have been feasible with up to 400 kWh.
For Depot2, over one-half of all tours may be electrified with about 400 kWh and up to 66% with 600 kWh. Up to 78% may be possible with 800 kWh. The difference between tour count and transport performance is considerably bigger than for Depot1. Feasibility is around 23% with up to 400 kWh, 33% with up to 600 kWh, and 49% with 800 kWh.
If we consolidate both depots, we find 65% of all tours feasible with up to 400 kWh, 75% with 600 kWh, and 84% with 800 kWh. Equivalently in terms of transport performance, this is 29% with up to 400 kWh, 39% with 600 kWh, and 53% with 800 kWh. Thus, given the available and announced battery capacities across truck classes, we conservatively conclude that roughly two-thirds of all tours and roughly one-third of transport performance may be feasible for ad-hoc electrification.
To summarize, our base scenario highlights two main findings: (1) There is no one battery capacity per truck class, even within one fleet. Thus, a vehicle-specific examination for the right battery capacity that ideally matches the vehicle’s operating profile is crucial to avoid over- or undersized battery capacities. (2) If the tour-truck allocation is neglected, the tour feasibility is significantly higher than on the truck level. Most likely, only a few unfeasible tours may be the crunch. This implies certain potential by re-allocating daily tours within the truck fleet.

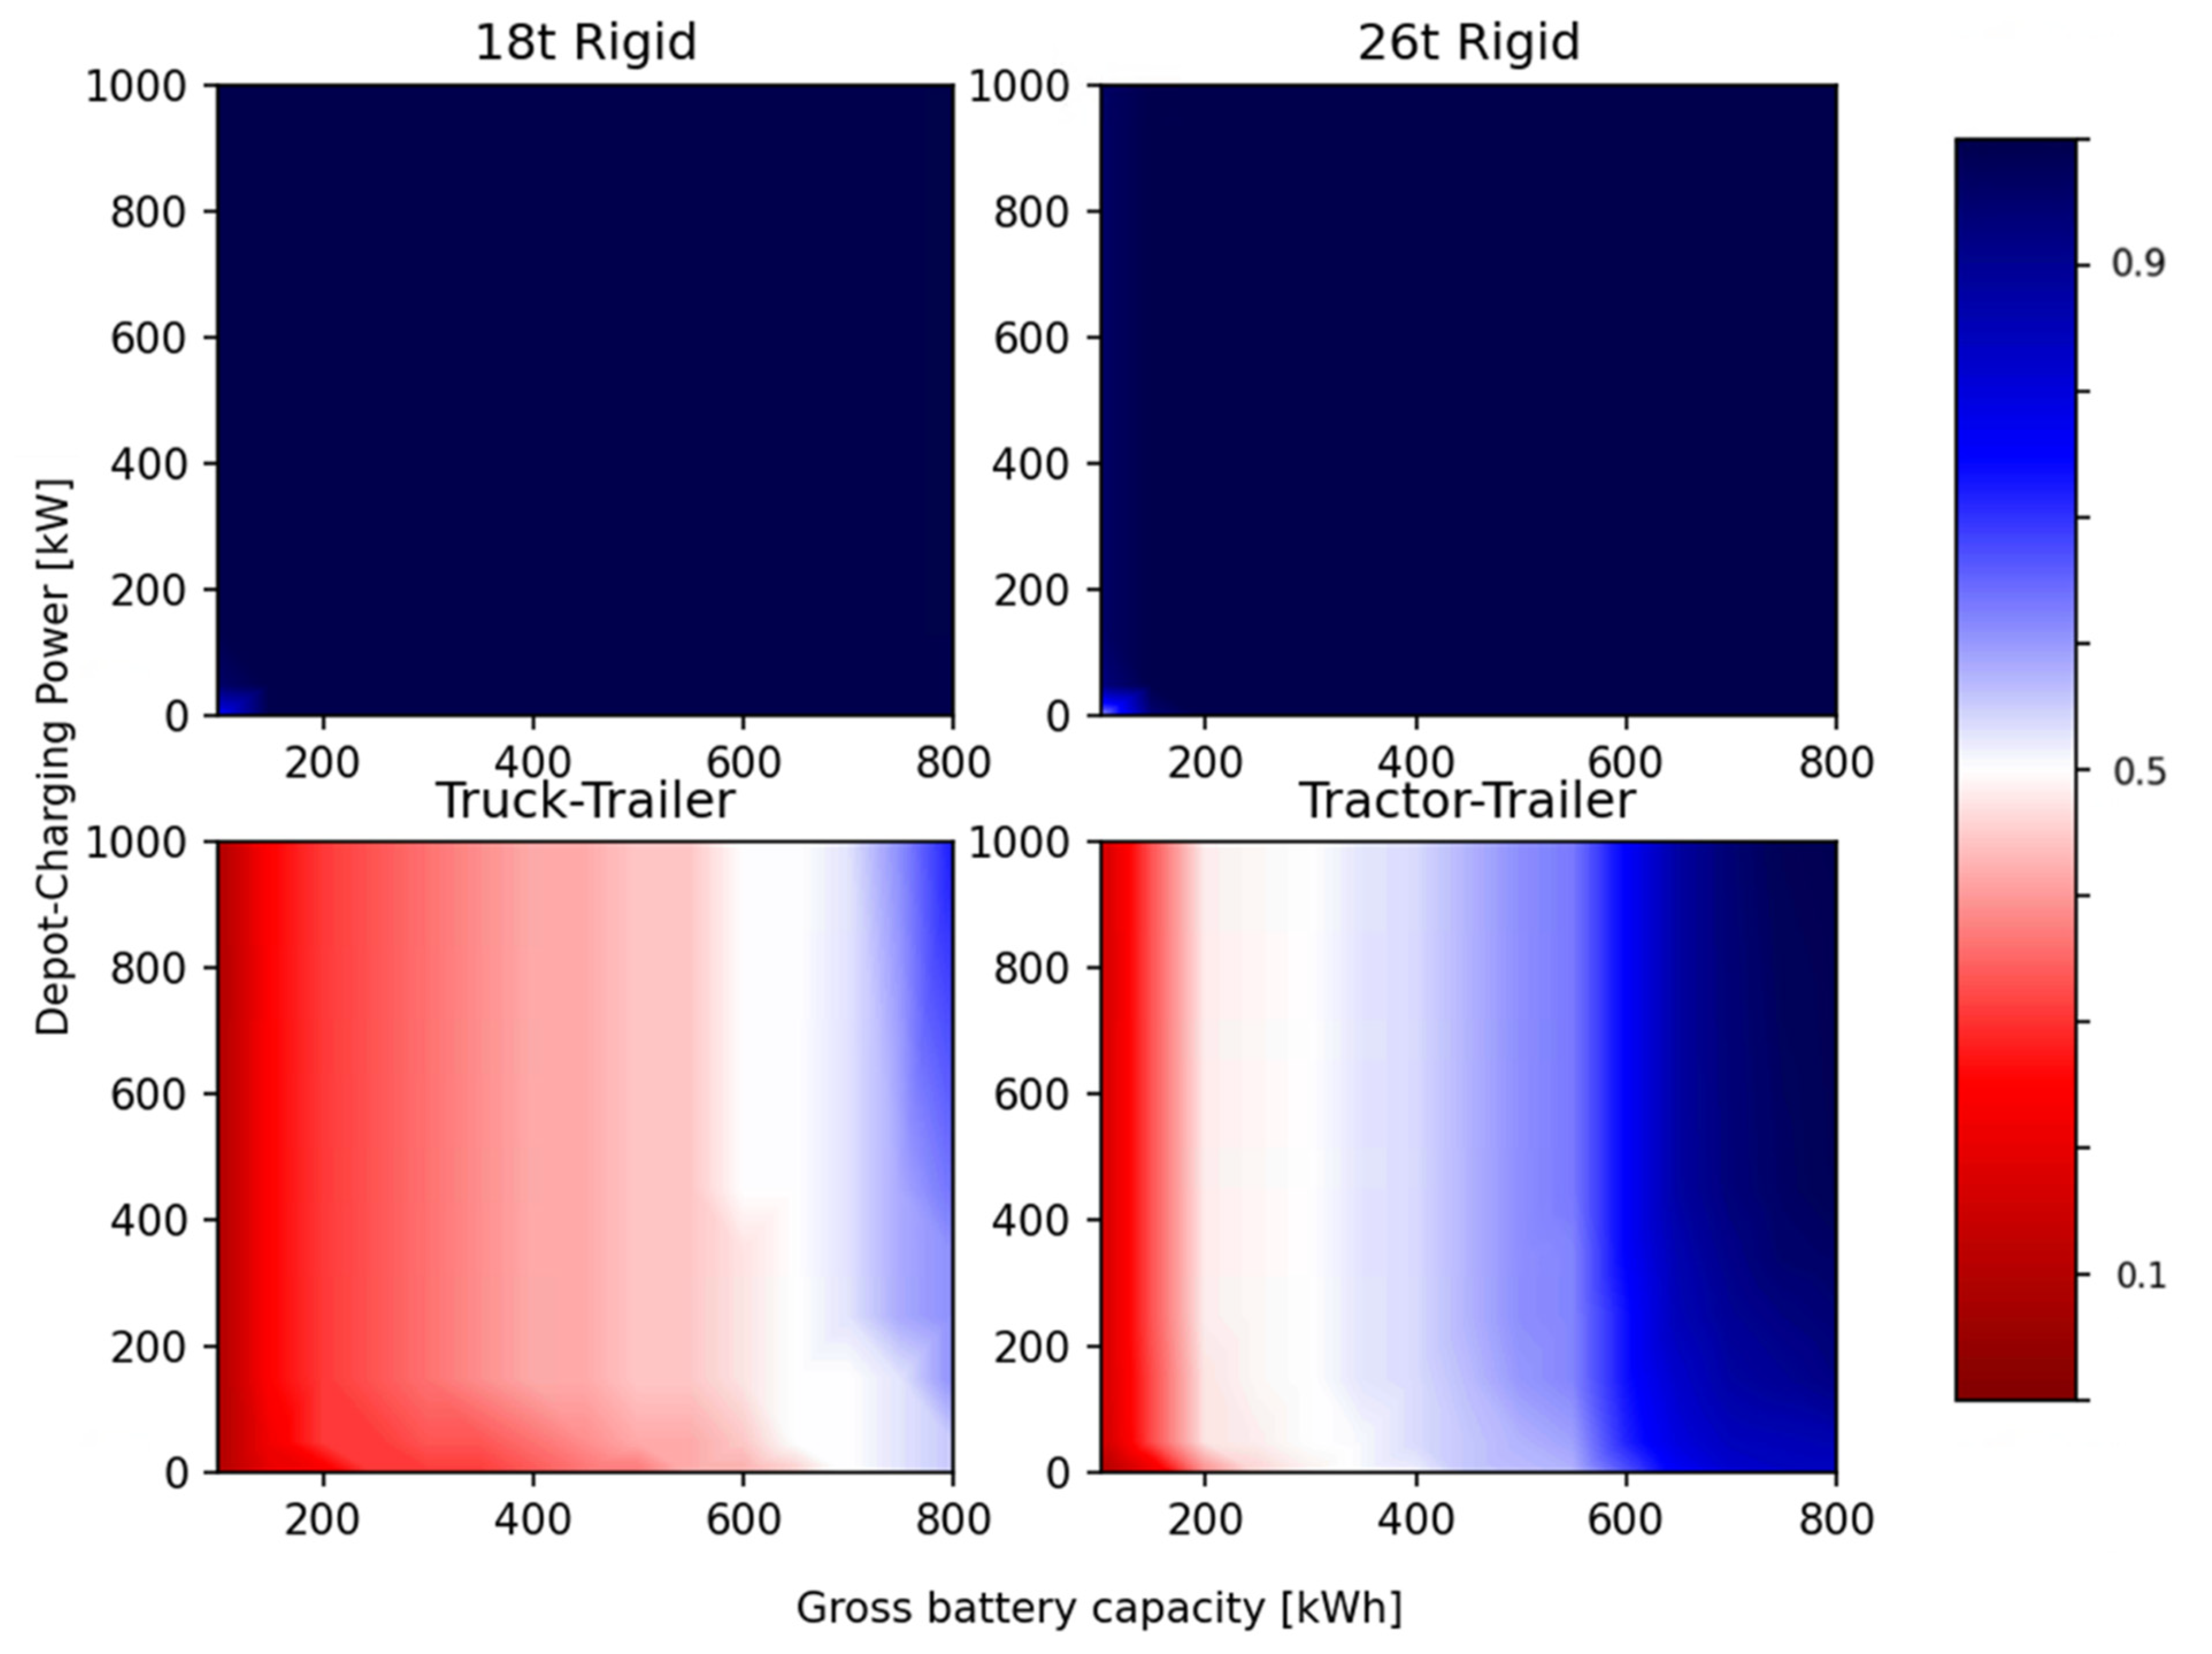
3.4. Scenario 1: Technical Feasibility with Intermediate Depot Charging

For our scenario evaluation, we aggregate both depots. Results are visualized in Figure 7, where the color scale indicates BET replaceability. The median (50% threshold) is given in white. We limit to truck-level evaluation across all simulated gross battery capacities, as findings from our base scenario regarding tours and transport performance react similarly. The y-axis indicates the charging power ( P C h a r g e , D e p ) . Thus, the x-axis matches the base scenario.
Intuitively, higher charging power leads to higher feasibility with smaller batteries. However, a substantial effect saturates beyond 350 kW, and we see higher sensitivity towards installed battery capacity rather than charging power. While there is hardly any effect on rigid solo trucks above 200 kWh, depot charging particularly boosts BET replaceability for truck-trailers and tractor-trailers. While truck-trailers do not even reach the 50% threshold, tractor-trailers may reach up to 66%. The broad 50% corridor at 400 to 600 kWh is striking here. This shows the trade-off between installed battery capacity and intermediate depot charging paired with higher charging power, yet the replaceability effect on the fleet remains equal.
Considering all 224 trucks, with up to 600 kWh maximum gross battery capacity and 350 kW available depot fast charging, we may replace nearly 70% of the whole fleet with BET, and almost half the transport performance may be electrified (i.e., +10% compared to the base scenario).

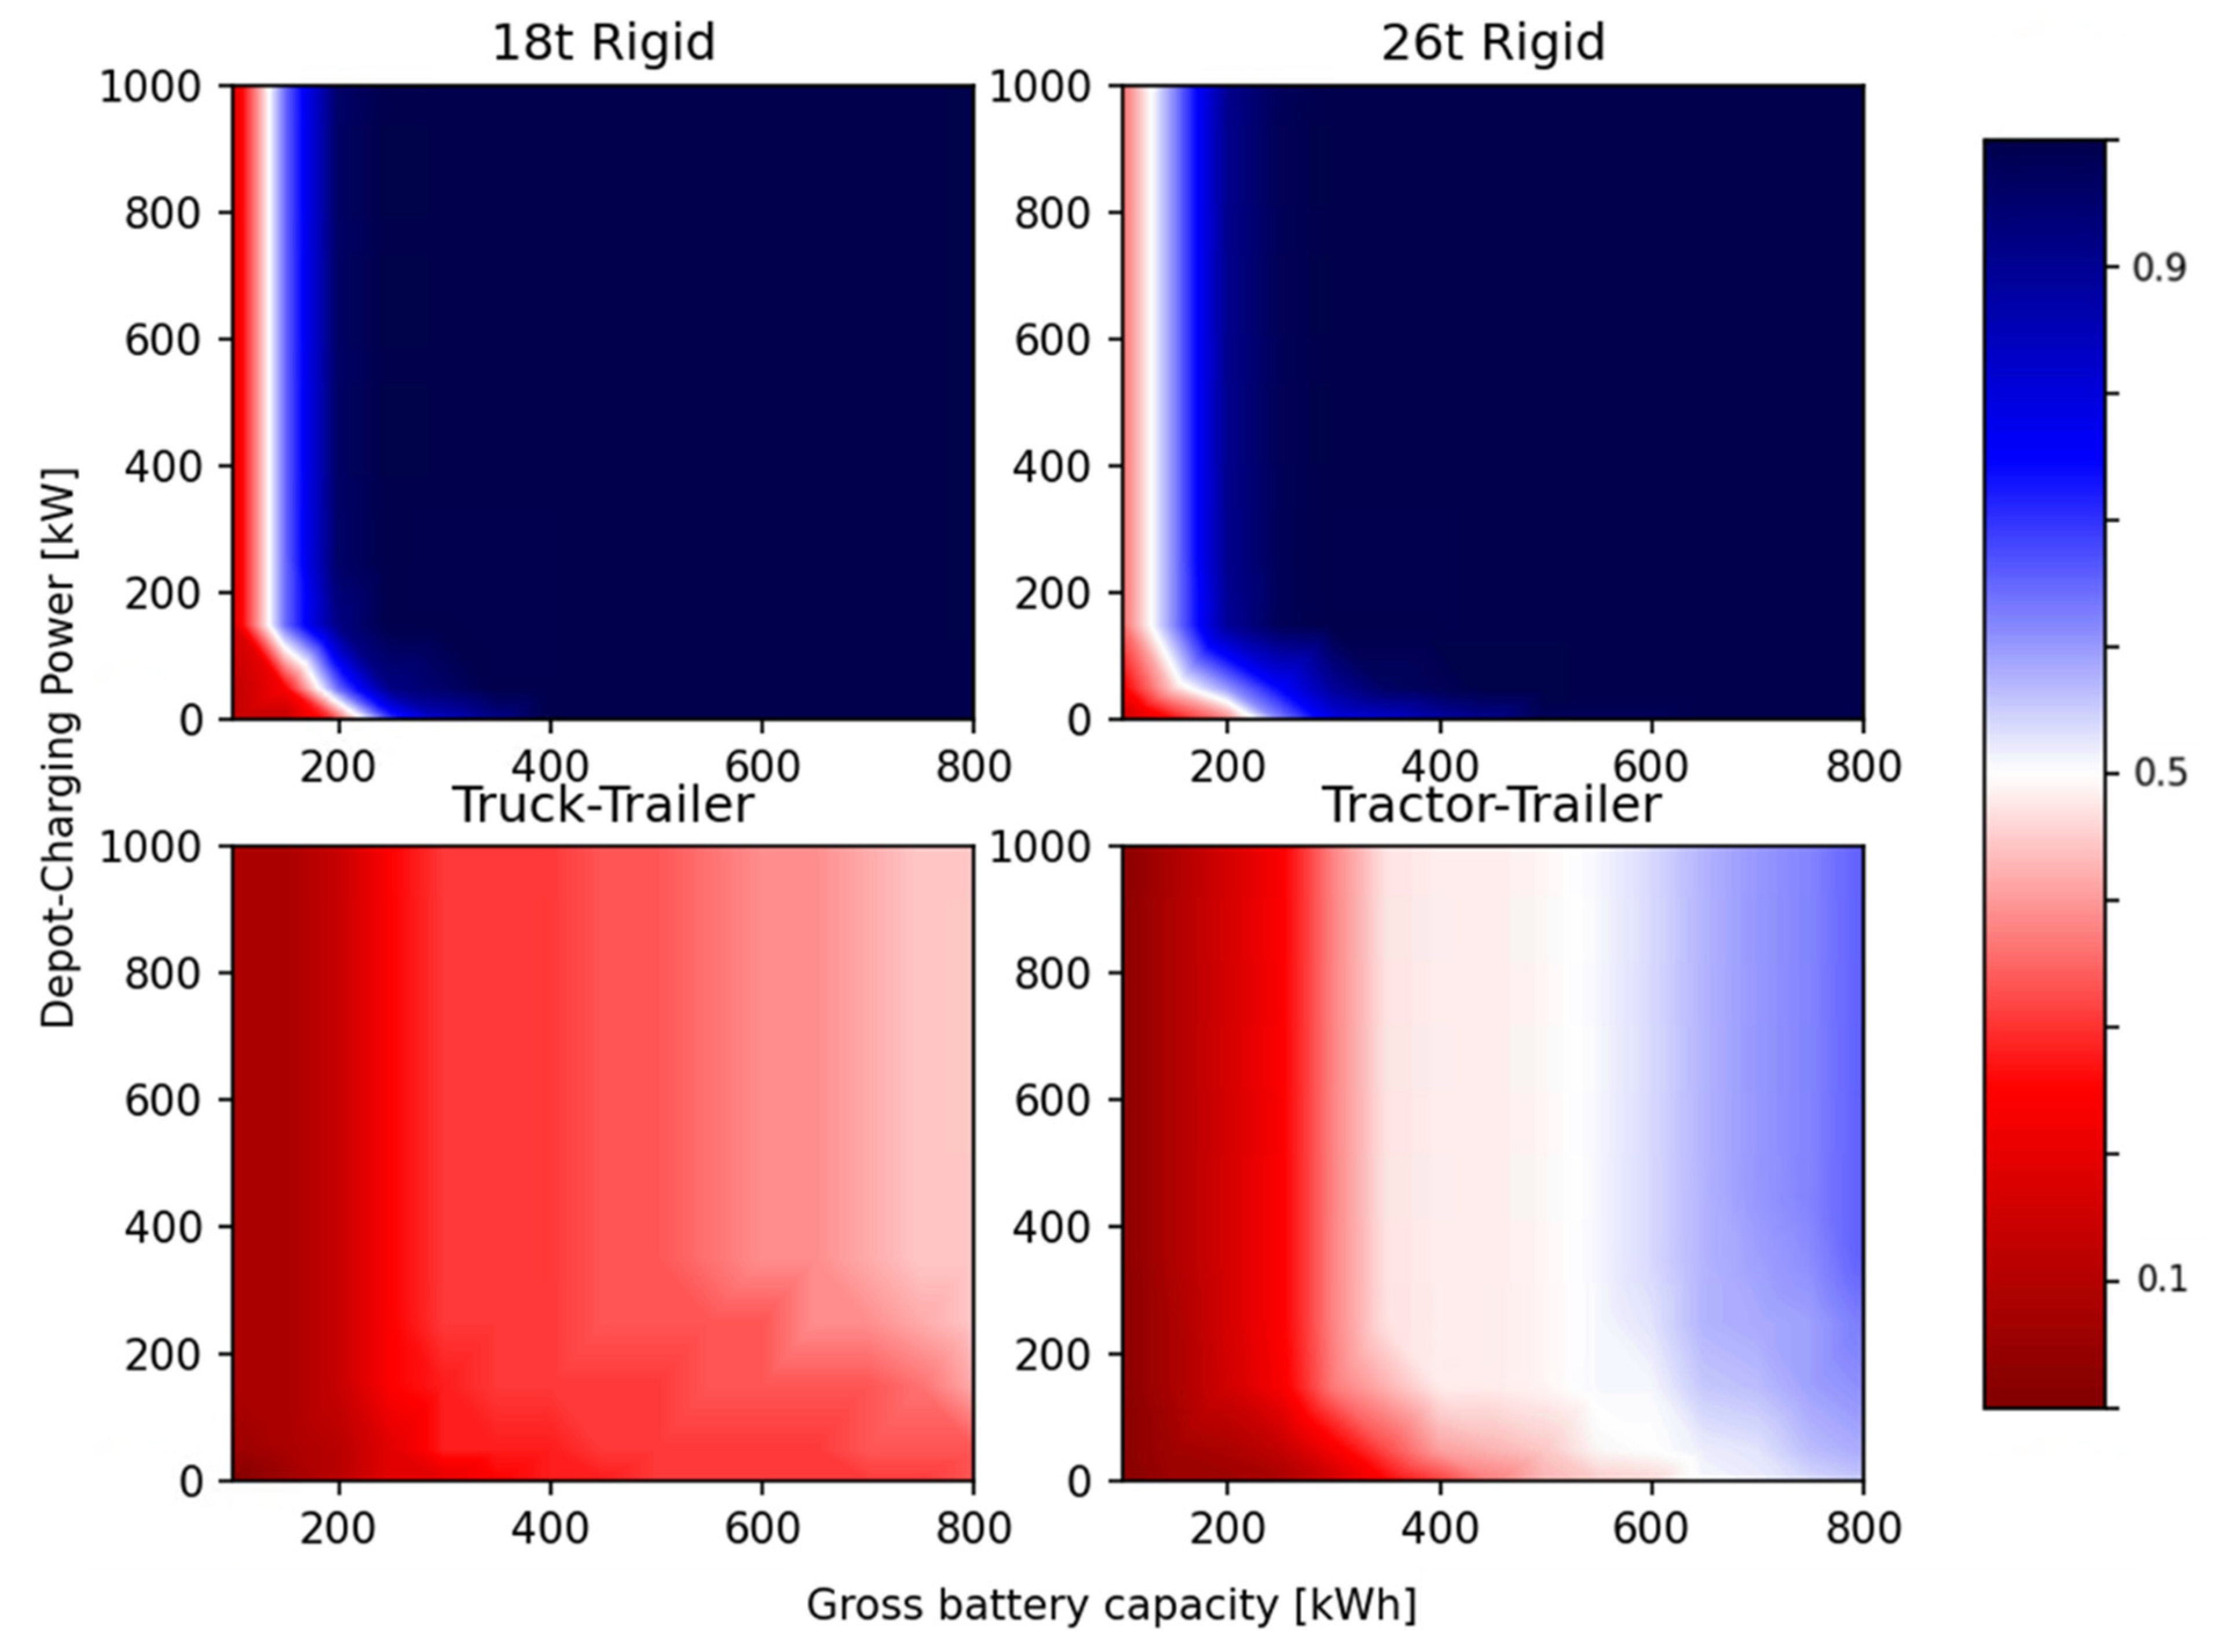
3.5. Scenario 2: Technical Feasibility with Intermediate Charging at the Depot and Customer Retail Stores

Figure 8 visualizes the results of our second scenario and the layout follows the previous logic from Figure 7. However, as introduced in the methodology section, we additionally explore the effect of charging opportunities at customer retail stores ( P C h a r g e , C R = 150 kW).
The additional charging at customer retail stores may enable full electrification for solo trucks (18 t and 26 t rigid) and tractor-trailers, while significantly smaller battery capacities are needed. This effect is most apparent in the 50% corridor for tractor-trailers, which decreases to 200–400 kWh instead of 400–600 kWh. The substantial effect of higher depot charging power already saturates beyond 150 kW. Truck-trailers show the lowest feasibility, and full electrification fails as only 72% may be reached.
Considering all 224 trucks, with up to 600 kWh maximum gross battery capacity, 350 kW available depot fast charging, and 150 kW fast charging at retail stores, we may replace over three-quarters of the whole fleet with BET and roughly 70% of the transport performance may be electrified (i.e., +30% compared to the base scenario).

4. Discussion

The following discussion includes tour data, representativeness, energy consumption modeling, charging assumptions, and battery aging.
(1) Tours and vehicle allocation are presumed to be exactly as of February 2021 so that potential BET would mimic the existing diesel truck schedule rather than using a tour schedule optimized for BET (e.g., allocate energy-consuming tours to available trucks with highest SoC). Plus, daily tour chains are untouched.
(2) We acknowledge that our food retail case study may not represent the entire European or even German distribution logistics and road freight transport since each industry has its unique characteristic usage patterns and constraints. However, we analyzed four relevant truck classes covering about 87% of the German N3 truck stock [25]. The studied region (i.e., Berlin, Mecklenburg-Western Pomerania, and Brandenburg) covers a relevant share of German land area (15%) and total population (9%). Plus, distribution logistics for the food retail industry covers up to a quarter of the annual transport performance in Germany (2019: 498 billion tkm) [26]. However, our sample covers less than 1%. Our calculated annual mileage is typically from 15,000 km to 124,000 km (10% and 90% quantile), with a mean value of 56,000 km and a median of 42,000 km. Our annual mileage is lower than official statistics [27] and driving data surveys [28]. However, pure long-haul transport is missing in our data but included in the others.
(3) Uncertainties for our simulated energy consumption and battery sizes result from the simplified vehicle model, parameter values from standard driving cycles, underlying generic BET technical specifications, and neglected dynamics (i.e., vehicle-related, speed profile, or ambient conditions). Since exact time- or distance-based vehicle speed profiles are missing from such tour data, we refrain from setting up a dynamic component-based simulation, such as used by [2]. Since we define the SoC as a function of traveled distance, we ignore any fluctuations that may limit real-world feasibility, nor did we simulate different seasonal effects. Even though we performed a Monte-Carlo simulation to increase robustness, there are no dynamics within one trip, and we may have incorporated only certain variations and irregularities. However, our results, taking the tractor-trailer as an example, are consistent with other studies indicating ranges between 1.2 and 1.9 kWh/km [2,3,7,10], which underlines our results.
(4) For convenience, we assume that charging is available at all retail stores. Plus, all cargo terminals for depot loading are equipped with charging infrastructure. Thus, we assume charging availability at any time. While this mirrors a full rollout, it seems intuitive that charging infrastructure may not be built at all cargo terminals or cannot be built at all retail store locations due to different constraints (e.g., costs, available space, or grid connection). Different optimization approaches may be used to determine the most relevant locations or the optimal number of equipped cargo terminals.
(5) We neglect battery aging effects (i.e., cyclic and calendar). Typically, the battery state-of-health (SoH) would decrease to 70–80% toward an ending truck service life. This impacts technical feasibility, assuming that the truck-tour allocation remains identical throughout the service life. In contrast, assuming more variable vehicle planning, the latest trucks might master the more difficult daily tours given a typically ongoing truck fleet renewal, while older trucks perform on easier daily tours (i.e., SoH-based tour allocation). To approximate aging, one might choose the next higher battery increment (+50 kWh) when affirming the feasible battery capacity threshold per truck.

5. Conclusions and Recommendations

Our case study quantifies the technical feasibility of BET for urban and regional delivery in Germany, covering over 9000 real-world tours, over 540 customers, and more than 200 heavy trucks from four different truck classes. Even though trucks are operating within only 220 km around Berlin, we see 200–300 km as daily mileage in urban delivery and 500–700 km as typical for regional deliveries, while even higher distances are possible in multi-shift and cross-daily operations. The opportunity for public charging at service areas and parking lots during the mandatory driving breaks may be limited for those delivery types, an effect possibly not limited to this case study and industry. Thus, private or semi-public charging infrastructure may be most promising to avoid time losses and stick to current schedules.
We find high potential for BET feasibility even if we mirror the existing diesel truck operating schedule. With up to 600 kWh and no additional charging infrastructure, we reach 39% of electrified transport performance and may replace nearly 60% of all trucks. Full electrification may be most accessible for rigid solo trucks (18 t and 26 t) and tractor-trailers. Truck trailers remain a concern. We find no one battery capacity per truck class but high heterogeneities, even within one fleet. Thus, we recommend that fleet owners and shippers carefully evaluate the modular battery capacities offered by the manufacturers to find the most suitable capacity per truck to avoid over- or undersized batteries. However, this might also limit flexible and universal vehicle planning.
Interim charging options at the depot (S1) and at individual retail stores (S2) boost feasibility and the share of electrified tkm. However, we find an overall higher sensitivity to battery capacity given long individual journeys than additional depot charging. In any case, overnight charging at the depot is crucial. Intermediate charging offers little added value for urban delivery, and the effect is greater for regional deliveries. The same applies to rigid solo trucks versus truck-trailers as well as tractor-trailers. The individual effect of each scenario measure is larger than the combined effect and, thus, should be balanced against each other. However, both may be necessary in selected cases to achieve full electrification. Apart from intermediate charging, we highlight the potential through tour optimization, truck re-allocation, and adjusted tour schedules. These imply significant potential without additional structural measures and costs (note: neglecting planning costs).
Given our findings, representativeness, and the literature-proofed general feasibility, we recommend all fleet owners and shippers to start examining their transition to climate-friendly commercial vehicles. Recent studies already indicate cost-effective operations of BET as of today or in the near future [29,30], currently especially in light of the notable subsidies for vehicles and charging infrastructure (e.g. in Germany: 80% refund for extra costs compared to a comparable diesel-powered truck as well as 80% of infrastructure-related expenses [31]). We emphasize the necessity of finding the right battery capacity per truck by analyzing its operational patterns and ad-hoc potential through tour optimization, adjusted and variable truck-tour allocation (i.e., SoC- and SoH-based), or even mixed fleet considerations with BETs and diesel trucks. Further practical BET research should focus on more case studies from other relevant industries, highlight custom pitfalls in daily operations, and enhance techno-economic evaluations.

Author Contributions

S.L.: Conceptualization, Methodology, Software, Writing—Original Draft. S.L. is the first author. P.P.: Methodology, Supervision, Writing—Review & Editing. All authors have read and agreed to the published version of the manuscript.

Funding

This work was sponsored by the Federal Ministry of Education and Research Germany within the project “BetterBat” under grant number 03XP0362C.

Institutional Review Board Statement

Not applicable.

Informed Consent Statement

Not applicable.

Data Availability Statement

Not applicable.

Acknowledgments

This research extends the ZeroEmissionDeliveries—Berlin project funded by the European Climate Foundation (ECF) and managed by Transport & Environment (T&E) Germany. The authors thank the REWE Group for kindly providing the data and supporting their work.

Conflicts of Interest

The authors declare no conflict of interest.

Abbreviations

BETHeavy-duty battery-electric trucks
GHGGreenhouse gas
GVWGross vehicle weight
SoCState of charge (battery)
SoHState of health (battery)
tkmton-kilometers

References

  1. European Commission. EU Transport in Figures: Statistical Pocketbook 2020; European Commision: Luxembourg, 2020; Available online: https://op.europa.eu/en/publication-detail/-/publication/da0cd68e-1fdd-11eb-b57e-01aa75ed71a1 (accessed on 1 August 2022).
  2. Mareev, I.; Becker, J.; Sauer, D. Battery Dimensioning and Life Cycle Costs Analysis for a Heavy-Duty Truck Considering the Requirements of Long-Haul Transportation. Energies 2018, 11, 55. [Google Scholar] [CrossRef]
  3. Phadke, A.; Khandekar, A.; Abhyankar, N.; Wooley, D.; Rajagopal, D. Why Regional and Long-Haul Trucks are Primed for Electrification Now; Lawrence Berkeley National Laboratory: Berkeley, CA, USA, 2021; Available online: https://escholarship.org/uc/item/3kj8s12f (accessed on 1 August 2022).
  4. Nykvist, B.; Olsson, O. The feasibility of heavy battery electric trucks. Joule 2021, 5, 901–913. [Google Scholar] [CrossRef]
  5. International Energy Agency. Global EV Outlook 2021: Accelerating Ambitions Despite the Pandemic; International Energy Agency: Paris, France, 2021; Available online: https://iea.blob.core.windows.net/assets/ed5f4484-f556-4110-8c5c-4ede8bcba637/GlobalEVOutlook2021.pdf (accessed on 1 August 2022).
  6. Transport and Environment. Easy Ride: Why the EU Truck CO2 Targets Are Unfit for the 2020s; Transport and Environment: Brussels, Belgium, 2021. [Google Scholar]
  7. Basma, H.; Beys, Y.; Rodriguez, F. Battery Electric Tractor-Trailers in the European Union: A Vehicle Technology Analysis; ICCT: Berlin, Germany, 2021; Available online: https://theicct.org/sites/default/files/publications/eu-tractor-trailers-analysis-aug21-2.pdf (accessed on 1 August 2022).
  8. Zayer, E.; Gnamm, J.; Strempel, K.; Di Loreto, G.; Johansson, M. European Truck Market Outlook 2022; Bain & Company: Munich, Germany, 2022. [Google Scholar]
  9. Youngeun, B.; Suman Kumar, M.; Craig, R.R.; Stephen, G.R. Factors influencing alternative fuel adoption decisions in heavy-duty vehicle fleets. Transp. Res. Part D Transp. Environ. 2022, 102, 103150. [Google Scholar] [CrossRef]
  10. Hildermeier, J.; Jahn, A.; Rodriguez, F. Electrifiying EU City Logistics: An Analysis of Energy Demand and Charging Cost; ICCT: Berlin, Germany, 2020; Available online: https://theicct.org/sites/default/files/publications/EU-logistics-electrification-fv-202011.pdf (accessed on 1 August 2022).
  11. Liimatainen, H.; van Vliet, O.; Aplyn, D. The potential of electric trucks—An international commodity-level analysis. Appl. Energy 2019, 236, 804–814. [Google Scholar] [CrossRef]
  12. Çabukoglu, E.; Georges, G.; Küng, L.; Pareschi, G.; Boulouchos, K. Battery electric propulsion: An option for heavy-duty vehicles? Results from a Swiss case-study. Transp. Res. Part C Emerg. Technol. 2018, 88, 107–123. [Google Scholar] [CrossRef]
  13. Mauler, L.; Dahrendorf, L.; Duffner, F.; Winter, M.; Leker, J. Cost-effective technology choice in a decarbonized and diversified long-haul truck transportation sector: A U.S. case study. J. Energy Storage 2022, 46, 103891. [Google Scholar] [CrossRef]
  14. European Environment Agency. Monitoring of CO2 Emissions from Heavy-Duty Vehicles: Flattened HDV 2019–20 Data; European Environment Agency: Copenhagen, Denmark, 2021. [Google Scholar]
  15. HERE Truck Navigation. Available online: https://developer.here.com/documentation/android-premium/dev_guide/topics/routing-truck.html (accessed on 1 August 2022).
  16. Sripad, S.; Viswanathan, V. Performance Metrics Required of Next-Generation Batteries to Make a Practical Electric Semi Truck. ACS Energy Lett. 2017, 2, 1669–1673. [Google Scholar] [CrossRef]
  17. NREL DriveCAT. Chassis Dynamometer Drive Cycles. Available online: www.nrel.gov/transportation/drive-cycle-tool (accessed on 30 September 2021).
  18. Delgado, O.; Rodriguez, F.; Muncrief, R. Fuel Efficiency Technology in European Heavy-Duty Vehicles: Baseline and Potential for the 2020–2030 Timeframe; ICCT: Berlin, Germany, 2017. [Google Scholar]
  19. Gao, Z.; Lin, Z.; Davis, S.C.; Birky, A.K. Quantitative Evaluation of MD/HD Vehicle Electrification using Statistical Data. Transp. Res. Rec. 2018, 2672, 109–121. [Google Scholar] [CrossRef]
  20. Löbberding, H.; Wessel, S.; Offermanns, C.; Kehrer, M.; Rother, J.; Heimes, H.; Kampker, A. From Cell to Battery System in BEVs: Analysis of System Packing Efficiency and Cell Types. World Electr. Veh. J. 2020, 11, 77. [Google Scholar] [CrossRef]
  21. European Commission. Vehicle Energy Consumption Calculation TOOL (VECTO); European Commission: Luxembourg, 2019. [Google Scholar]
  22. Doppelbauer, M. Grundlagen der Elektromobilität: Technik, Praxis, Energie und Umwelt; Springer Professional: Wiesbaden, Germnay, 2020; ISBN 978-3-658-29730-5. [Google Scholar]
  23. Van Basshuysen, R.; Schäfer, F. Handbuch Verbrennungsmotor: Grundlagen, Komponenten, Systeme, Perspektiven, 7th ed.; Springer Professional: Wiesbaden, Germany, 2015. [Google Scholar]
  24. P3 automotive GmbH. P3 Charging Index—Update 2021: Comparison of the Fast Charging Capability of Different Electric Vehicles from an User Perspective; P3 Group GmbH: Stuttgart, Germany, 2021. [Google Scholar]
  25. Federal Transport Authority (KBA). Bestand an Kraftfahrzeugen und Kraftfahrzeuganhängern am 1. Januar 2021 Nach Bundesländern und Fahrzeugklassen Absolut: FZ 27; KBA: Flensburg, Germany, 2021; Available online: https://www.kba.de/DE/Statistik/Produktkatalog/produkte/Fahrzeuge/fz27_b_uebersicht.html (accessed on 27 September 2021).
  26. Göckeler, K.; Hacker, F.; Mottschall, M.; Blanck, R.; Görz, W.; Kasten, P.; Bernecker, T.; Heinzelmann, J. Status Quo und Perspektiven Alternativer Antriebstechnologien für den Schweren Straßengüterverkehr: Erster Teilbericht des Forschungs-und Dialogvorhabens „StratES: Strategie für die Elektrifizierung des Straßengüterverkehr“; Öko-Institut e.V.: Berlin, Germany, 2020. [Google Scholar]
  27. Federal Transport Authority (KBA). Verkehr in Kilometern (VK): Zeitreihe Jahre 2014 bis 2020. Available online: https://www.kba.de/DE/Statistik/Kraftverkehr/VerkehrKilometer/vk_inlaenderfahrleistung/vk_inlaenderfahrleistung_node.html (accessed on 30 September 2021).
  28. Wermuth, M.; Neef, C.; Wirth, R.; Hanitz, I.; Löhner, H.; Hautzinger, H.; Stock, W.; Pfeiffer, M.; Fuchs, M.; Lenz, B.; et al. Mobilitätstudie „Kraftfahrzeugverkehr in Deutschland 2010“ (KiD 2010) 70.0829/2008; WVI, IVT, DLR, KBA: Braunschweig, Germany, 2012; Available online: https://www.bmvi.de/SharedDocs/DE/Anlage/G/kid-2010.pdf?__blob=publicationFile (accessed on 2 May 2021).
  29. Basma, H.; Saboori, A.; Rodriguez, F. Total Cost of Ownership for Tractor-Trailers in Europe: Battery Electric versus Diesel; ICCT: Berlin, Germany, 2021. [Google Scholar]
  30. Basma, H.; Rodriguez, F.; Hildermeier, J.; Jahn, A. Electrifying Last-Mile Delivery: A Total Cost of Ownership Comparison of Battery-Electric and Diesel Trucks in Europe; ICCT: Berlin, Germany, 2022. [Google Scholar]
  31. Federal Ministry for Digital and Transport. Richtlinie Über die Förderung von Leichten und Schweren Nutzfahrzeugen Mit Alternativen, Klimaschonenden Antrieben und Dazugehöriger Tank-und Ladeinfrastruktur: Richtlinie KsNI; Federal Ministry for Digital and Transport: Berlin, Germany, 2021. [Google Scholar]
Figure 1. Data sample—Maps of the northeast region of Germany. Points represent individual retail stores; Red: Retail stores in the Berlin zip code area (share: 50%); Purple: Berlin metropolitan area (40 km) (share: 20%); Blue: Other retail stores (share: 30%)—own illustration based on leaflet.
Wevj 13 00161 g001
Figure 2. Evaluation of daily operating distances per truck class; (a) Depot1; (b) Depot2; Sample points are scattered. Boxplots include the lower quartile, median, upper quartile, and whiskers (±1.5 IQR); Colors indicate different truck classes: 18-t rigid (green), 26-t rigid (blue), tractor-trailers (purple), truck-trailers (orange), and total (grey)—own illustration.
Wevj 13 00161 g002
Figure 3. Evaluation of vehicle operating times per tour across both depots and per truck class; (a) Vehicle loading at the depot; (b) Driving time; (c) stopping time per retail store; (d) Vehicle unloading at the depot—own illustration.
Wevj 13 00161 g003
Figure 4. Trip-averaged specific energy consumption [kWh/km] per truck class. (a) Density plot over battery capacity (b) Sample-weighted boxplot per truck class. Boxplots indicate the lower quartile, median, upper quartile, and whiskers (±1.5 IQR); Colors indicate different truck classes: 18-t rigid (green), 26-t rigid (blue), tractor-trailers (purple),and truck-trailers (orange)—own illustration.
Wevj 13 00161 g004
Figure 5. BET feasibility per truck class as CDF over gross battery capacity; (a) Depot1; (b) Depot2—own illustration.
Wevj 13 00161 g005
Figure 6. BET feasibility on tour- and tkm-level as CDF over gross battery capacity; (a) Depot1; (b) Depot2—own illustration.
Wevj 13 00161 g006
Figure 7. BET feasibility per truck class—scenario 1. Variations for battery capacity [kWh] and depot-charging power [kW]; color bar indicates technical feasibility from 0% to 100%—own illustration.
Wevj 13 00161 g007
Figure 8. BET feasibility per truck class—scenario 2. Variations for battery capacity [kWh] and depot-charging power [kW] plus charging at retail stores (fixed, 150 kW; color bar indicates technical feasibility from 0% to 100% —own illustration.
Wevj 13 00161 g008
Table 1. Truck-class-specific simulation parameters. Ranges indicate the PERT distribution’s minimum, most likely, and maximum values. Individual parameters are constant values.
ParameterUnit18-t Rigid26-t RigidTruck-TrailerTractor-TrailerSource
m Curb _ D [kg]5761–6475–71258239–8679–90738239–8679–90735761–6475–7125Q25-Q50-Q75 [14]
m T r a i l e r [kg]--6500 ± 20%8500 ± 20%derived from [18]
C D · A [m2]5.559–5.698–5.8375.463–5.997–5.7376.557–7.839–9.1795.559–5.698–5.837Q25-Q50-Q75 [14]
c r r [N/kN]5.5–5.7–6.95.0–5.6–6.85.0–5.6–6.84.9–5.1–6.5Q25-Q50-Q75 [14]
P A u x [kW]2.97 ± 20%3.39 ± 20%4.32 ± 20%4.11 ± 20%[18,19]
P C o o l [kW]3.11 ± 20%3.11 ± 20%5.90 ± 20%5.14 ± 20%ATP/DIN 8959
P M o t o r [kW]200–228–265265–323–350265–323–350331–355–368Q25-Q50-Q75 [14]
v S t d [m/s]0.4130.4170.7440.677[-]
Table 2. Other simulation parameters. Ranges indicate the PERT distribution’s minimum, most likely, and maximum values. Individual parameters are constant values.
ParameterUnitValue/Value RangeSource
η D o D [%]90% ± 5 %[13]
ρ B a t [Wh/kg]150–175–225[13,16,20]
R e k u [%]50% ± 10%[16]
a a v [m/s2]Urban: 0.331 ± 20%, Regional: 0.160 ± 20%Q25 and Q75 [17]
η B T W [%] η B T W = η B a t t e r y   ( 95 %   ±   2.5 % ) · η D r i v e t r a i n (90% ± 2.5%)[13,16]
η b r k [%]97%[16]
v R M S [m/s] = v a v 2 + v s t d 2   + v W i n d   (3 ± 20%)Based on [16] and VECTO [21]
E R e s i d u a l [kWh]30Own assumption
p [kg/m3]1.15–1.225–1.3Own assumption
m E m o t [kg/kW]1.43[22]
m D P T [kg] = m G e a r b o x   ( 300   kg ) + m T a n k (108 kg) = 408 kgBased on [2]
m I C E [kg/kW]3.3[23]
m P L [kg]Base value from the truck schedule (± 20%)
P C h a r g e , D e p [kW] { 50 , 150 , 250 , 350 , 450 , 1000 }
P C h a r g e , C R [kW]150
r P l a n V S A c t u a l [%]75% ±10%Own assumption
η N C P [%]68.1% (184/270)–82% (164/200)–92.6% (250/270)[24]
Publisher’s Note: MDPI stays neutral with regard to jurisdictional claims in published maps and institutional affiliations.

