Abstract
The advances in electric mobility, motivated by current sustainability issues, have led public and private organizations to invest in the electrification of their corporate fleets. To succeed in this transition, companies must mitigate the impacts of electrification on their fleet operation, in particular the ones on vehicle recharging. The increase in energy demand caused by electrification may require changes in the company electrical infrastructure, the installation of charging stations, and the proper planning of the recharging schedule, considering the particularities of each fleet and operation. In this context, data analytics is seen as an important tool to help companies to understand their charging fleet profile, supporting decision makers in making data-driven decisions regarding their charging infrastructure. This paper shows how data analytics could be applied to analyze the charging data of corporate electric fleets, adopting a business-oriented analysis method based on the Cross Industry Standard Process for Data Mining (CRISP-DM) methodology. The analyses were performed on data collected from three different companies, with each one of them operating fleets of vehicles of different categories, i.e., ultra-light, light, and heavy vehicles. The results illustrate how data analytics, based on interactive reports and dashboards, can shed light on business questions related to the operation of electric vehicle corporate fleets.
1. Introduction
Electric mobility has advanced around the world, largely driven by the need for decarbonization and reduction in greenhouse gas emissions, which has attracted public and private investments in transport electrification. Global electric vehicle (EV) sales doubled in 2021 with respect to the previous year, reaching a record level of 6.6 million units. EVs currently account for approximately 10% of global vehicle sales, four times the 2019 market share [1]. This expansion has been led by China, some European countries, and the United States, while it has been less expressive in developing countries. For instance, according to Brazilian Association of Electric Vehicles (ABVE), the fleet in Brazil has reached 100,000 EVs in 2022. Despite being a small volume, the Brazilian EV market is growing, with a 77% sales increase in 2021 compared with the previous year [2,3].
Public and private organizations from different sectors, such as transport, logistics, and utilities, among others, invest in the electrification of their fleets to meet their sustainability goals and to leverage the economic benefits of this new transport model, such as operational savings related to vehicle recharging and maintenance [4]. To succeed in the electric mobility transition, and to achieve its full benefits, these companies must mitigate the impacts on their operations, especially those on vehicle recharging.
One aspect to be considered by companies is the impact on the energy demand of the fleet. In addition to installing charging stations, the increased energy demand may also require adjustments in the company’s electrical infrastructure and energy contracts. Another aspect to be considered is the EV recharging time, which can be considerably longer than the refueling time of an equivalent combustion engine vehicle, affecting the fleet recharging schedule. The fleet operation and recharging plan must also consider the charging profile of each vehicle, which depends on its daily usage (time, distance, route, etc.), the vehicle characteristics (battery capacity, maximum range, etc.), and the type of charging station (charging power, availability, etc.).
The digitalization of the charging process, with data collection in real time (or near real time) and the analysis of the charging data, is seen as a fundamental element in this context, enabling companies to monitor the charging infrastructure and use data to properly plan the fleet recharging schedule, control the energy consumption, and assess the reduction in CO2 emissions obtained with electrification.
Previous research projects [5,6,7] applied data analytics to explore the electric vehicle charging data of public and private charging infrastructures. Some of this research, such as Cuder et al. (2018) [8] and Pevec et al. (2018) [9], adopted a business-oriented data analytics methodology based on CRISP-DM, supporting service providers and local governments in making data-driven decisions regarding charging station management. However, none of these works focused on corporate fleet charging.
Other research considered charging data from corporate fleets; for instance, Cochero et al. (2014) [10] analyzed data from electro-mobility projects funded by the European Union, including public and private charging infrastructures for individuals and fleet operators, proposing guidelines for data monitoring, collection, and quality control. Schäuble et al. (2017) [11] applied data analytics to investigate the charging data of EV fleets in Germany, proposing as a result a model to simulate EV loads and generate synthetic load profile data.
The objective of this research was to investigate how data analytics could be applied to analyze the charging data of corporate electric fleets, adopting a business-oriented data analytics approach, based on the CRISP-DM methodology, to support companies in making data-driven decisions regarding their charging infrastructure and fleet operation.
For this purpose, a case study was conducted with three different companies, with each one of them operating fleets of vehicles of different categories, i.e., ultra-light, light, and heavy vehicles. Charging data were obtained using a digital Charging Station Management System (CSMS), developed as part of the project, and enriched with external data of local energy utilities and vehicle specifications. The collected charging data were then analyzed to answer real business questions raised by the companies during the business understanding phase of the CRISP-DM methodology. The results illustrate how data analytics, based on interactive reports and dashboards, can shed light on business questions, supporting companies in managing their fleet and recharging infrastructure.
The reminder of this article is organized as follows: Section 2 details the research approach, describing the analyzed data, the collection process, and the applied analytics methodology. Section 3 describes the research results, which are illustrated with analytics charts, along with their interpretation. Section 4 summarizes the research results, presenting some additional discussions. Finally, Section 5 presents the final conclusions of our research, its limitations, and possible future works.
2. Materials and Methods
2.1. Analyzed Data
Data were collected using a CSMS digital platform, developed as part of the project, which communicated with the charging stations through OCPP (Open Charge Point Protocol), a protocol standardized by OCA (Open Charge Alliance) [12] and adopted by most commercial equipment on the market. For Non-OCPP charging stations, a hardware device was developed to enable data collection through a proprietary communication protocol.
The platform collected data periodically (every minute) from each charging station (CS), obtaining dynamic data, such as the device status and charging information. Static information (such as the place where the station was installed and the type of electrical installation) was also available for the analyses. Details about the charging sessions were also stored by the platform; the information included the date and time of each charging session, the energy consumed, the identifier of the charging station, the user who performed the recharging session, and the vehicle identifier. In Brazil, the energy cost may vary depending on the time of day, with higher costs during periods of peak grid demand, which typically happens at the end of the day. To properly calculate energy costs according to peak and off-peak pricing, the energy consumption was registered in the peak and off-peak periods. Table 1 illustrates the internal data attributes that were collected for the analysis.

Table 1.
Internal data attributes.
Besides the platform internal data detailed above, data from external sources were also collected to enrich the analyses. For instance, vehicle specification data (such as vehicle type, battery capacity, and range) were obtained from EV manufacturers [13]. Energy cost information obtained from utility companies was also integrated to allow us to conduct a recharging cost analysis. Table 2 illustrates the external data attributes that were collected and analyzed.

Table 2.
External data attributes.
2.2. Data Collection
Recharging data were collected from experimental electrification projects conducted with three distinct partner companies. The companies operated fleets of vehicles of different types, classified according to their battery capacity as ultra-light vehicles (tuk-tuks with a battery capacity of 7.68 KWh), light vehicles (passenger cars with a 40 KWh battery capacity), and heavy vehicles (trucks with a battery capacity of 217 KWh). All fleets consisted exclusively of battery electric vehicles (BEVs).
Each company had its own charging infrastructure, typically composed of a collection of charging stations installed in one or more establishments (physical locations where vehicles were recharged, such as a garage). Recharging was carried out by drivers who authenticated themselves on the system with a mobile application.
Table 3 describes the recharging infrastructure of each company operation.

Table 3.
Operational infrastructures.
2.3. Data Analysis
The data analysis process started around 6 months after the beginning of platform operation, so that there was a minimum data volume to conduct the analyses. An agile methodology, based on CRISP-DM [14], was applied to the data analyses with the following steps:
- Business understanding: This phase focused on understanding the requirements and objectives of the data analyses. Firstly, business actors were identified within the three company operations. Then, the actors were interviewed to identify business questions (based on real business problems, pains, and opportunities) that could be answered using the data analyses. Finally, the key business questions identified were prioritized in the analyses.
- Data understanding: After the selection of the business questions, it was verified whether the platform had relevant internal data that could be analyzed to answer the questions. In some cases, the platform was modified to collect additional data; for instance, to allow us to conduct a recharging analysis for each vehicle, the vehicle identity was included in the recharging data. In other cases, external data were added to enrich the data model, making it possible to analyze other scenarios. For instance, data from vehicle specifications were added to include information regarding battery capacity and range. Energy cost data from energy distribution concessionaires were also included to allow us to conduct the recharging cost analysis.
- Data Preparation: Before the analyses, data were prepared to guarantee the quality of the original data and the reliability of the results. Data security and privacy were also taken into consideration at this stage, for example, by implementing policies and access control mechanisms to ensure that each company could only access data and analyses relative to its own operation.
- Modeling: Descriptive analytics techniques were applied to examine the data, using statistics and graphics to explain what had happened (or was happening) in the fleet operations. Predictive analytics was also applied to forecast future trends, such as the expected power consumption in future periods. Microsoft PowerBi (version 2.111.590.0 64-bit) [15] was adopted to conduct the analyses, creating visual reports and dashboards to answer the prioritized business questions.
- Evaluation: Initially, the reports and dashboards were validated by the project’s technical team, in a controlled test environment, to ensure the correctness of the analyses. After approval by the technical team, the reports and dashboards were validated by key business actors, to make sure that they helped to answer the selected business questions. After corrections and adjustments, the solution was made available to all business users.
- Deployment: Initially, reports and dashboards were shared with business users using Power Bi’s sharing feature. However, this approach required each person to have a PowerBi user account. To solve that problem, the reports and dashboards were embedded in the CSMS web client, so all users were able to access the analysis directly via the platform’s web interface, without the need for external tools or additional accounts.
3. Results
This section describes the results of the analyses, which are illustrated with charts extracted from the reports and dashboards created to answer each of the selected business questions, which are presented in the following subchapters. The charts are presented for the three different companies, using data to explain the observed results and operation behavior.
3.1. What Is the Monthly Cost and Energy Consumption of the Operation?
Figure 1, Figure 2 and Figure 3 illustrate the monthly evolution of the three targeted company operations. The bar chart shows the energy consumption (KWh) and energy cost (BRL) by month, and the cards in the top-right corner show the cumulative values.
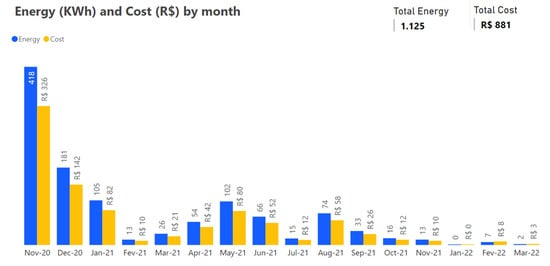
Figure 1.
Energy consumption and costs of Operation 1 (ultra-light vehicles).
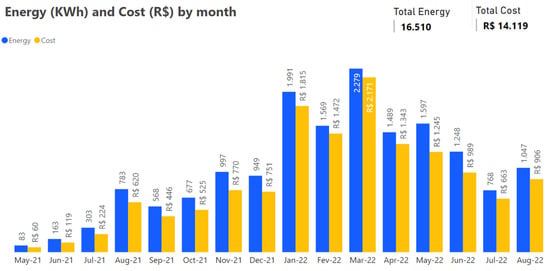
Figure 2.
Energy consumption and costs of Operation 2 (light vehicles).
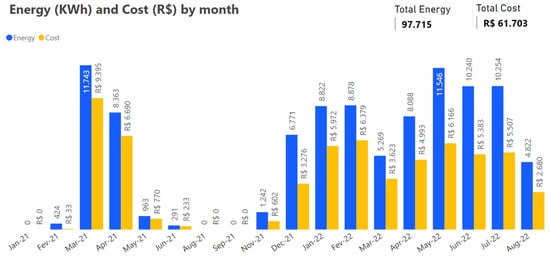
Figure 3.
Energy consumption and costs of Operation 3 (heavy vehicles).
The first point to note is that the operations started, and were more active, in different periods: Operation 1 (ultra-light vehicles) started in November 2020 and gradually reduced its activities, which ended in March 2022; Operation 2 (light vehicles) started in May 2021, had a period of peak activity between January and March 2022, and continued in a stable manner until April 2022; Operation 3 (heavy vehicles) started in February 2021, faced intense activity from March to April 2021, followed by a reduction from May to November 2021, and returned to a consistent and stable activity in 2022.
It can also be observed that, considering the total energy consumption and costs (displayed in the cards), Operation 1 was the smallest, followed by Operation 2 and Operation 3. This can be explained by the nature of the fleets (consisting of different types of vehicles) and by the number of recharging sessions performed in each operation. As illustrated in Figure 4 below, in addition to having a greater number of recharging sessions, the average energy consumption per recharging session was much higher in Operation 3 (heavy vehicles).
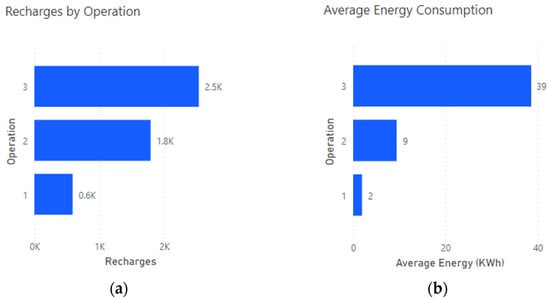
Figure 4.
(a) Number of recharging sessions of each operation; (b) average energy consumption of each operation.
3.2. What Is the Reduction in CO2 Emissions Obtained with the Electrification of the Operation?
Regarding CO2 emissions, it can be observed in Figure 5 that Operation 1 had a small reduction, reaching only 22 Kg CO2 throughout its operation. Operations 2 and 3 had more expressive results, surpassing the marks of 25 and 29 tons of CO2, respectively. This result is largely affected by the higher energy consumption of Operations 2 and 3 compared with Operation 1, but other factors, such as vehicle type, can also affect the results.
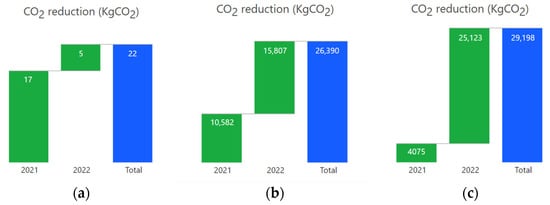
Figure 5.
CO2 emissions reductions of (a) Operation 1, (b) Operation 2, and (c) Operation 3.
The reduction in CO2 emissions was estimated considering the emissions of the electric fleet (which depended on the emission factor of the charging energy source) and the baseline emissions of an equivalent fleet of combustion engine vehicles (which considered the average emission factor of each vehicle category).
3.3. Which Establishments Have More Recharging Sessions?
Figure 6 shows the distribution of recharging session by establishment for each operation. Operation 1 only had one establishment, where all recharging was carried out; Operation 2 had nine establishments, with similar recharging distributions among them, although establishments 17 and 14 had fewer recharging sessions; Operation 3 only had two establishments, with one of them accounting for most recharging.
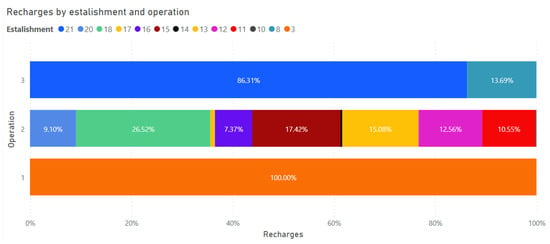
Figure 6.
Recharging sessions by establishment and operation.
A low number of recharging sessions in an establishment can be affected by several reasons, including the number of charging stations available. Figure 7 illustrates the number of charging stations per establishment of each operation.
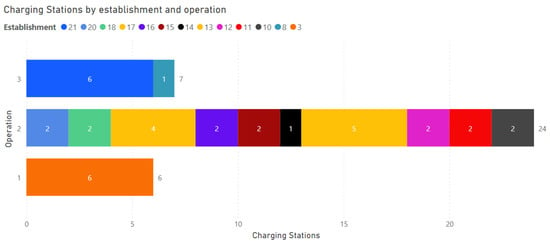
Figure 7.
Charging stations by establishment and operation.
Operation 3 had one establishment with six charging stations and another one with only one, which may explain the difference in the number of recharging sessions performed in each establishment. In Operation 2, establishment 14 only had one charging station, which also explains the low number of recharging sessions; however, establishment 17 was the second with the highest number of stations, with four stations. This may indicate a possible underutilization of the infrastructure installed at establishment 17.
3.4. What Is the Average Recharging Session Duration?
Figure 8 indicates the average recharging time for each operation. It can be observed that the recharging session duration was very close for all operations. Operation 2 (light vehicles) had the longest duration among them, followed by Operation 1 (ultra-light vehicles) and Operation 3 (heavy vehicles).
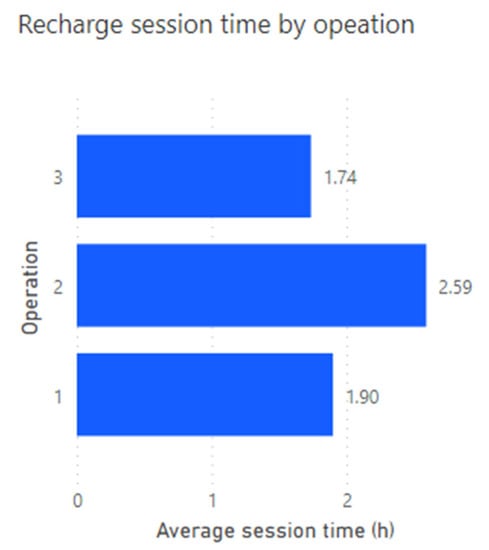
Figure 8.
Recharging session time by operation.
It is interesting to note that, even though heavy vehicles suggest more energy and, consequently, longer recharging, Operation 3 (heavy vehicles) had the shortest average recharging duration compared with the other two operations. This happened because the charging time depends on several factors, such as the vehicle battery capacity and the charging station power (which influences the charging speed).
Figure 9 illustrates the average values of battery capacity and charging speed for each operation. As expected, since the fleet of Operation 3 comprised heavy vehicles, the average battery capacity was higher. However, the charging speed in Operation 3 was also higher, indicating that they used high-power charging stations. This explains (at least partially) why the charging duration in Operation 3 was shorter despite having vehicles that demanded more energy. Other factors also impact the charging time, such as the average travel distance and vehicle consumption. Currently, the platform does not have vehicle travel data, but this information will be added in the future to support other analyses.
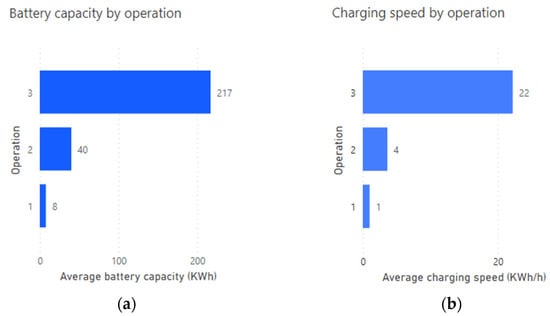
Figure 9.
(a) Battery capacity by operation; (b) charging speed by operation.
Further regarding charging duration, Figure 10 shows the histogram of the recharging sessions by duration, grouped by 1 h, 2 h, 3 h, 4 h, and 5 h or more. It can be observed that short recharging sessions, taking up to 1 h, were the most common for all operations. However, long recharging sessions, lasting 5 or more hours, were quite common in Operation 2 (representing 25% of all its recharging sessions), but they were not so common in Operation 1 (where they represented 12.56%) or in Operation 3 (where they represented only 3%).
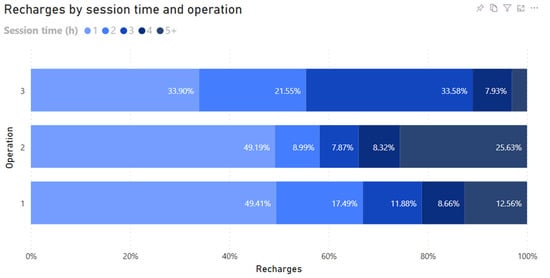
Figure 10.
Recharging sessions by session time and operation.
3.5. Which Days and Times Have More Recharging Sessions?
The charts in Figure 11 illustrate the distribution of the recharging sessions for each day of the week. On weekends, all operations had a smaller number of recharging sessions than on working days, which was expected because the companies either stopped or reduced their fleet operation on weekends. On working days, there was intense recharging activity, with each operation showing peak recharging sessions on different days: Thursdays in Operation 1; Mondays, Wednesdays, and Fridays in Operation 2; Tuesdays and Thursdays in Operation 3.
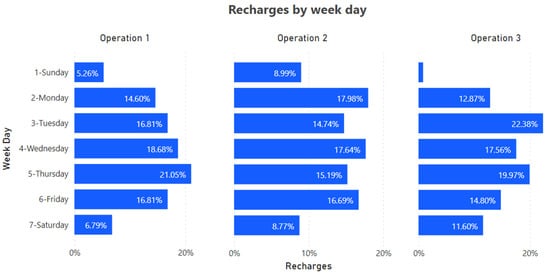
Figure 11.
Recharging sessions by week day and operation.
Figure 12 illustrates how the recharging sessions were distributed over the hours of the day. Operation 1 had two moments of intense recharging activity, the first around noon and the second at the end of the day (between 17 h and 19 h), with little activity at night. Operation 2 had heavy recharging activity throughout the day (from 7 h to 18 h), showing some activity at the beginning of the night (from 19 h to 22 h). Operation 3 showed recharging activity during the day and the night, with a very clear peak at noon and another one at 22 h.
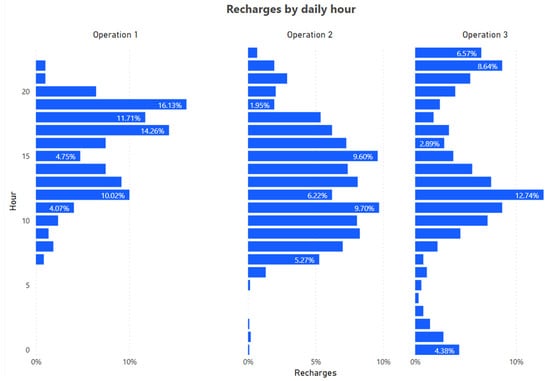
Figure 12.
Recharging sessions by daily hour and operation.
3.6. What Is the Energy Consumption Forecast for the Operation?
The previous questions were answered using descriptive analytics, with which we investigated past data to understand and explain what had happened (and what was happening) in the operations. On the other hand, this business question requires predictive analytics to infer future trends, allowing users to prepare for what is going to happen in the future.
Figure 13, Figure 14 and Figure 15 show the energy consumption forecasts by operation for a two-month period, which were obtained using PowerBi embedded predictive analytics. The dashed green line indicates the predicted energy consumption, while the green area around it represents the 80% confidence interval.

Figure 13.
Energy consumption forecast for Operation 1.

Figure 14.
Energy consumption forecast for Operation 2.

Figure 15.
Energy consumption forecast for Operation 3.
For Operation 1 (Figure 13), the prediction indicated that the operation was expected to reduce activities after March 2022, which indeed happened, since operation stopped then. It is also interesting to note that the green area (representing the 80% confidence interval) was narrow, which indicates good confidence in the prediction.
For Operations 2 and 3 (Figure 14 and Figure 15, respectively), the predictions indicated stable energy consumption for the coming months. However, in both cases, we can see a very wide green area, indicating a possible large deviation between the predicted values and the real energy consumption. This result was obtained because the energy consumption in the previous months did not have a clear pattern, making it difficult to predict the future behavior of those operations. As the operations advance and more data are acquired for analysis, it should be possible to improve these predictions.
4. Discussion
The above results illustrate how descriptive and predictive data analytics can be applied to support decision makers in answering business questions and making data-driven decisions regarding their EV fleets and charging infrastructure.
The analyses show that a complete understanding of the fleet operational dynamics versus the available recharging infrastructure of each operation is important for the proper planning and rational use of energy resources.
For instance, the charts can help business actors to visualize the particularities of their recharging over the days of the week and time of the day, helping them to avoid bottlenecks in their schedule that could lead to queues and delays in operation. Energy consumption, associated costs and infrastructure limitations are other aspects that can be quickly visualized, allowing companies to plan their recharging infrastructure and energy contracts.
The business questions analyzed were identified at the beginning of the analytics process, in the business understanding phase of the CRISP-DM methodology, driving the analyses of real problems faced by the operations related to different aspects, such as energy consumption, energy costs, CO2 emissions, charging infrastructure utilization, charging fleet profile, etc.
Descriptive analytics techniques were applied to answer questions 1 to 5, presenting statistic information about the charging data visually in graphs, helping decision makers to understand what had happened (or was happening) in the operation. Predictive analytics was applied to answer question 6 to predict the future energy consumption of the operations, allowing decision makers to plan their charging infrastructure accordingly.
It is also worth mentioning that the charts can be accessed by users on dashboards and reports that include interactive options, which allow them to filter the data by different dimensions, such as establishment, charging station, vehicle, driver, etc. This enables the users to investigate specific aspects of the fleet and recharging infrastructure.
5. Conclusions
Companies invest in the electrification of their corporate fleets, which can impact their operation, especially regarding vehicle recharging. The article shows how descriptive and predictive data analytics, based on interactive reports and dashboards, can be used in this context to help companies to understand the particularities of their operations, predict future trends, and make data-driven business decisions.
Data for the analyses were obtained using a CSMS platform and were collected from pilot projects carried out with three different companies over 2 years. Each company had fleets of different types of electric vehicles, i.e., ultra-light, light, and heavy vehicles. A business-oriented analysis method based on the CRISP-DM methodology was adopted, where business questions were obtained from the operations and used to guide the analyses.
The results showed that the particularities of each fleet and recharging infrastructure were relevant and could be clearly observed in the charts, helping business people to understand their operation and make decisions based on the data.
The CRISP-DM methodology, and especially its first phase of business understanding, contributed to drive the analyses from a business perspective, identifying real business questions that were analyzed and answered based on charts created using the collected data.
Even though the experiments were conducted considering a period of two years, the dataset obtained had a limited number of recharging sessions, affecting the results obtained to predict future trends, such as the low confidence obtained for the energy consumption forecasts analyzed in question 6. Other data limitations, such as the lack of dynamic information on the vehicles such as the state of charge and travel mileage, inhibited the prioritization and analysis of other business questions, which would have required these data to be obtained.
In future studies, external data regarding vehicle travel information and state of charge, which directly affect energy consumption and recharging, could be used to enrich the data and to allow additional analyses to be conducted. Other advanced scenarios, such as the automatic identification of failures or anomalous behavior of vehicles or recharging infrastructure, could also be analyzed in future works.
Author Contributions
Conceptualization, methodology, software, validation, formal analysis, investigation, resources, and data curation, F.G. and L.d.A.B.; writing—original draft preparation, F.G.; writing—review and editing, F.G. and R.B. All authors have read and agreed to the published version of the manuscript.
Funding
This research was founded by an ANEEL (Agência Nacional de Energia Elétrica) R&D project (PD-07625-0119/2019), and article publication was supported by Venturus.
Data Availability Statement
Not applicable.
Acknowledgments
We would like to thank all project team members, leading institutions, and partner companies who contributed to this research.
Conflicts of Interest
The authors declare no conflict of interest.
References
- International Energy Agency (IEA). Global EV Outlook 2022. Available online: https://www.iea.org/reports/global-ev-outlook-2022 (accessed on 20 October 2022).
- ABVE (Associação Brasileira de Veículos Elétricos). 100 Mil Eletrificados Já Circulam no Basil. Available online: https://www.abve.org.br/100-mil-eletrificados-circulam-no-brasil/ (accessed on 20 October 2022).
- PNME (Plataforma Nacional de Mobilidade Elétrica). Primeiro Anuário Brasileiro de Mobilidade Elétrica. 2022. Available online: https://www.pnme.org.br/biblioteca/1o-anuario-brasileiro-da-mobilidade-eletrica/ (accessed on 20 October 2022).
- PEGN. Empresas Ivestem para ter Frota 100% Elétrica em Meio a Demanda por Redução de Emissões. Available online: https://revistapegn.globo.com/Um-So-Planeta/noticia/2022/03/empresas-investem-para-ter-frota-100-eletrica-em-meio-demanda-por-reducao-de-emissoes.html (accessed on 20 October 2022).
- Wolbertus, R.; van den Hoed, R. Charging Station Hogging: A Data-Driven Analysis; EVS30 Symposium: Stuttgart, Germany, 2017. [Google Scholar]
- Lee, Z.J.; Li, T.; Low, S.H. ACN-Data: Analysis and Applications of an Open EV Charging Dataset. In Proceedings of the Tenth ACM International Conference on Future Energy Systems, Phoenix, AZ, USA, 25–28 June 2019. [Google Scholar]
- Tuncer, D.; Babacan, O.; Guiazon, R.; Ali, H.A.; Conway, J.; Kern, S.; Moreno, A.T.; Peel, M.; Pereira, A.; Assad, N.; et al. Engineering data-driven solutions for future mobility: Perspectives and challenges. arXiv 2022, arXiv:2203.077892022. [Google Scholar]
- Cuder, G.; Breitfuss, G.; Kern, R.; Angerer, R. E-Mobility and Big Data – Data Utilization of Charging Operations. 2018. Available online: https://www.know-center.at/filemaker/pdf_publikationen/Paper.pdf (accessed on 20 October 2022).
- Pevec, D.; Babic, J.; Kayser, M.A.; Carvalho, A.; Ghiassi-Farrokhfal, Y.; Podobnik, V. A Data-Driven Statistical Approach for Extending Electric Vehicle Charging Infrastructure. Int. J. Energy Res. 2018, 42, 3102–3120. [Google Scholar] [CrossRef]
- Corchero, C.; Gumara, R.; Cruz-Zambrano, M.; Sanmarti, M.; Gkatzoflias, D.; Dilara, P.; Drossinos, I.; Donati, A. Data Collection and Reporting Guidelines for European Electro-Mobility Projects; European Commission, Joint Research Centre, Institute for Energy and Transport: Luxembourg, 2014. [Google Scholar]
- Schäuble, J.; Kaschub, T.; Ensslen, A.; Jochem, P.; Fichtner, W. Generating electric vehicle load profiles from empirical data of three EV fleets in Southwest Germany. J. Clean. Prod. 2017, 150, 253–266. [Google Scholar] [CrossRef]
- OCA (Open Charge Alliance). Available online: https://www.openchargealliance.org/ (accessed on 20 October 2022).
- INMETRO. Light Vehicles. 2022. Available online: https://www.gov.br/inmetro/pt-br/assuntos/avaliacao-da-conformidade/programa-brasileiro-de-etiquetagem/tabelas-de-eficiencia-energetica/veiculos-automotivos-pbe-veicular/pbe-veicular-2022.pdf/view (accessed on 20 October 2022).
- Data Science Process Alliance. CRISP-DM. Available online: https://www.datascience-pm.com/crisp-dm-2/ (accessed on 20 October 2022).
- Microsoft PowerBi. Available online: https://powerbi.microsoft.com/pt-br/ (accessed on 20 October 2022).
Publisher’s Note: MDPI stays neutral with regard to jurisdictional claims in published maps and institutional affiliations. |
© 2022 by the authors. Licensee MDPI, Basel, Switzerland. This article is an open access article distributed under the terms and conditions of the Creative Commons Attribution (CC BY) license (https://creativecommons.org/licenses/by/4.0/).