Article

A New Control Strategy for Energy Management of Bidirectional Chargers for Electric Vehicles to Minimize Peak Load in Low-Voltage Grids with PV Generation

Department of Engineering, RheinMain University of Applied Sciences, 65428 Russelsheim am Main, Germany
*
Author to whom correspondence should be addressed.
World Electr. Veh. J. 2022, 13(11), 218; https://doi.org/10.3390/wevj13110218
Submission received: 20 October 2022 / Revised: 15 November 2022 / Accepted: 17 November 2022 / Published: 19 November 2022
(This article belongs to the Special Issue Charging Infrastructure for EVs)

Abstract

:
This paper introduces a new bidirectional vehicle-to-grid (V2G) control strategy for energy management of V2G charging points equipped with photovoltaic systems (PVs), considering the interaction between V2G chargers, electric vehicle (EV) owners, and the network operator. The proposed method aims to minimize peak load, grid infeed power, feeder loading, and transformer loading by scheduling EVs charging and discharging. The simulation experiments take into account three EV battery capacities as well as two levels of EV penetration. In order to validate the effectiveness of the proposed approach, five scenarios are studied in a single feeder of a low-voltage (LV) distribution network in DIgSILENT PowerFactory, which comprises a combination of residential and commercial loads as well as PV systems. Simulation results demonstrate that the proposed V2G strategy improves the paper’s objectives by providing ancillary services to the grid.

1. Introduction

In recent years, many countries have developed plans for mitigating climate change and transitioning to a more sustainable future. Through the 2022 Immediate Action Programme and the new Climate Change Act, the German Federal Government aims to decrease greenhouse gas (GHG) emissions by 65% and 88% of 1990 rates by 2030 and 2040, respectively, with the ultimate objective of going climate-neutral by 2045 [1]. After the energy and industry sectors, transportation has been Germany’s third most polluting sector over the last two decades [2]. The replacement of internal combustion engine (ICE) vehicles with battery electric vehicles (BEVs) and plug-in hybrid electric vehicles (PHEVs) in traffic turnaround is a viable solution for achieving a climate-friendly traffic system. Despite the fact that demand for such vehicles was initially low, and the time horizon for reaching a significant load proportion of charging processes in distribution networks’ power flows seemed to be long, the forecasts for the future development of power transportation require a major change.
The German Federal Government allocated 200 million EUR for DC fast charge (DCFC) infrastructure and 100 million EUR for slow charging, as well as a purchase incentive of up to 9000 EUR on EVs in collaboration with the car manufacturers to promote the growth of the electromobility industry [3,4]. However, the additional loads caused by the high integration of EVs and charging stations (CSs) into the grid pose new challenges to the electrical distribution network, potentially resulting in unreliability and power quality problems. In this respect, the low-emission power of renewable energy sources (RESs) (such as PV) might be used to meet a part of the charging infrastructure’s energy consumption. One way to reduce the uncertainties associated with EVs and RESs is by optimally integrating an external battery storage system (BSS) into the grid [5,6]. As a more economical solution, with V2G technology [7], EVs batteries can operate as mobile energy storage systems (ESSs) by storing power from the grid and surplus energy from PV to tackle PV’s volatility and non-dispatchable power generation [8]. The effective implementation of V2G offers a variety of services, including load balancing [9], reactive power compensation and voltage control [10,11], frequency regulation [12], and spinning reserve [13]. Properly controlling the bidirectional power flow between EVs and grid-using V2G technology in combination with RESs provides a promising solution for managing power generation and consumption while minimizing the need for network infrastructure upgrades.
Several recent studies have looked into energy management approaches using V2G and PV with the aim of minimizing various costs, such as environmental and operational costs. With the integration of V2G technology, ref. [14] used particle swarm optimization (PSO) and artificial bee colony (ABC) to reduce pollution costs, operation costs, and carbon emissions. Solar and EVs were part of the proposed microgrid (MG). Ref. [15] studied the peak demand energy market for PV and V2G in Brazil by introducing two different dispatch approaches to minimize grid operation costs. The impact of V2G technology on degradation costs and battery aging was explored in [16]. In addition, a new stochastic power flow based on the unscented transform has been presented to model the behavior of PVs. Ref. [17] introduced a home energy management system that combined PV with vehicle-to-home (V2H) technology to help consumers manage their energy consumption through scheduling optimal automation appliances as well as reducing costs. In [18], heuristic and linear programming methods were used to calculate the operating cost of a MG that included V2G technology, ESS, and PV under various scenarios. Fixed values were used for the user’s arrival time and initial battery state of charge (SOC). Ref. [19] utilized genetic algorithms (GA) to reduce the operation cost of a MG using V2G technology and RESs.
Another field of research is focused on providing ancillary services to the grid by utilizing the V2G technology with PV. Ref. [20] proposed a rule-based power management technique for V2G systems based on the antlion optimizer (ALO) algorithm, with the goal of increasing the renewable energy proportion while minimizing the losses power supply probability and electricity costs. Ref. [21] presented the development of a real-time energy storage management system for a nanogrid that integrated PVs and V2G to provide ancillary services (load shifting and frequency regulation) to the utility power system. Ref. [22] developed a model to minimize peak demand while increasing self-consumption of PV energy through V2G strategy and smart charging of EVs in the city of Utrecht, the Netherlands. The lifespan of EV batteries and various MG configurations were also examined. Ref. [23] suggested a real-time decentralized vehicle/grid algorithm that took into account V2G and PVs with the goal of peak shaving, system losses reduction, and voltage deviations limitation. Ref. [24] proposed a PV-based EV charging solution that used V2G technology to provide the grid with reactive and active power support. Although the findings of references [20,21,22,23,24] indicate that their own objectives have been achieved, other distribution grid challenges such as transformer and feeder loading, as well as grid infeed power, have gone overlooked.
Differently from the previous studies, this paper presents a new V2G application that considers EV owner behavior, the grid operator’s contribution in setting the charging start time, a mobile app for user settings, and PVs integration. The development of an approach for managing EV charging and discharging is the aim of this work. The investigation involves the minimization of peak load, grid infeed power, loading along a feeder, and transformer loading on the LV distribution network. The major focus of this article is summarized as follows:
  • A new V2G application predicts EV charging/discharging profiles using C++ programming language and the Qt toolkit [25]. The main contribution of this paper is that the proposed application takes into account all of the previously mentioned factors while employing various scheduling strategies for EV charging/discharging to satisfy the needs of EV owners and the power grid.
  • Grid analyses are carried out in DIgSILENT PowerFactory [26] utilizing the Quasi-Dynamic Simulations toolbox to assess the V2G method’s effects on a part of a LV network.
The rest of this paper is organized as follows: The V2G control strategy is described in Section 2. Several case studies and simulation results are presented in Section 3. Finally, conclusions are drawn in Section 4.

2. Materials and Methods

2.1. PV System

The following two types of PV panels are employed in this study; both are available as predefined models in the DIgSILENT library:

2.1.1. Aleo S77.190

Aleo Solar Company manufactures this PV panel, which is made of single crystalline silicon and has a peak power of 190 W. The PV system in this paper comprises two parallel inverters with a total of 26 panels per inverter.

2.1.2. c-Si M 48 M180

This PV panel is produced by Bosch Solar Energy, which is made of the same material as the previous panel and has a peak power of 180 W. Two parallel inverters, each with 28 panels, are used in this paper’s PV system. The remaining PV panels input parameters are detailed in the DIgSILENT library.

2.1.3. Active Power Output of a PV System

The Solar Calculation option in PV panel settings in DIgSILENT PowerFactory is used to compute active power over time [27]. Figure 1 illustrates the active power of one of the Aleo PV systems over time on a typical sunny autumn day.

2.2. The V2G Scheduling System

Two applications are used to implement the V2G scheduling system:
  • The proposed V2G application forecasts the EVs charging/discharging profiles, utilizing the C++ programming language and the Qt toolkit. This application addresses a variety of topics, including:
    • The possibility of controlling the charging start time by grid operator;
    • Simulating user’s diverse behaviors through distribution random functions;
    • The mobile application, which connects users to the grid operators and the V2G chargers by allowing them to define their desired departure time and SOC levels;
    • If PVs are available, they can be used to charge EVs directly.
  • The software application DIgSILENT PowerFactory for assessing the distribution network.

2.2.1. V2G Application—Data Collection

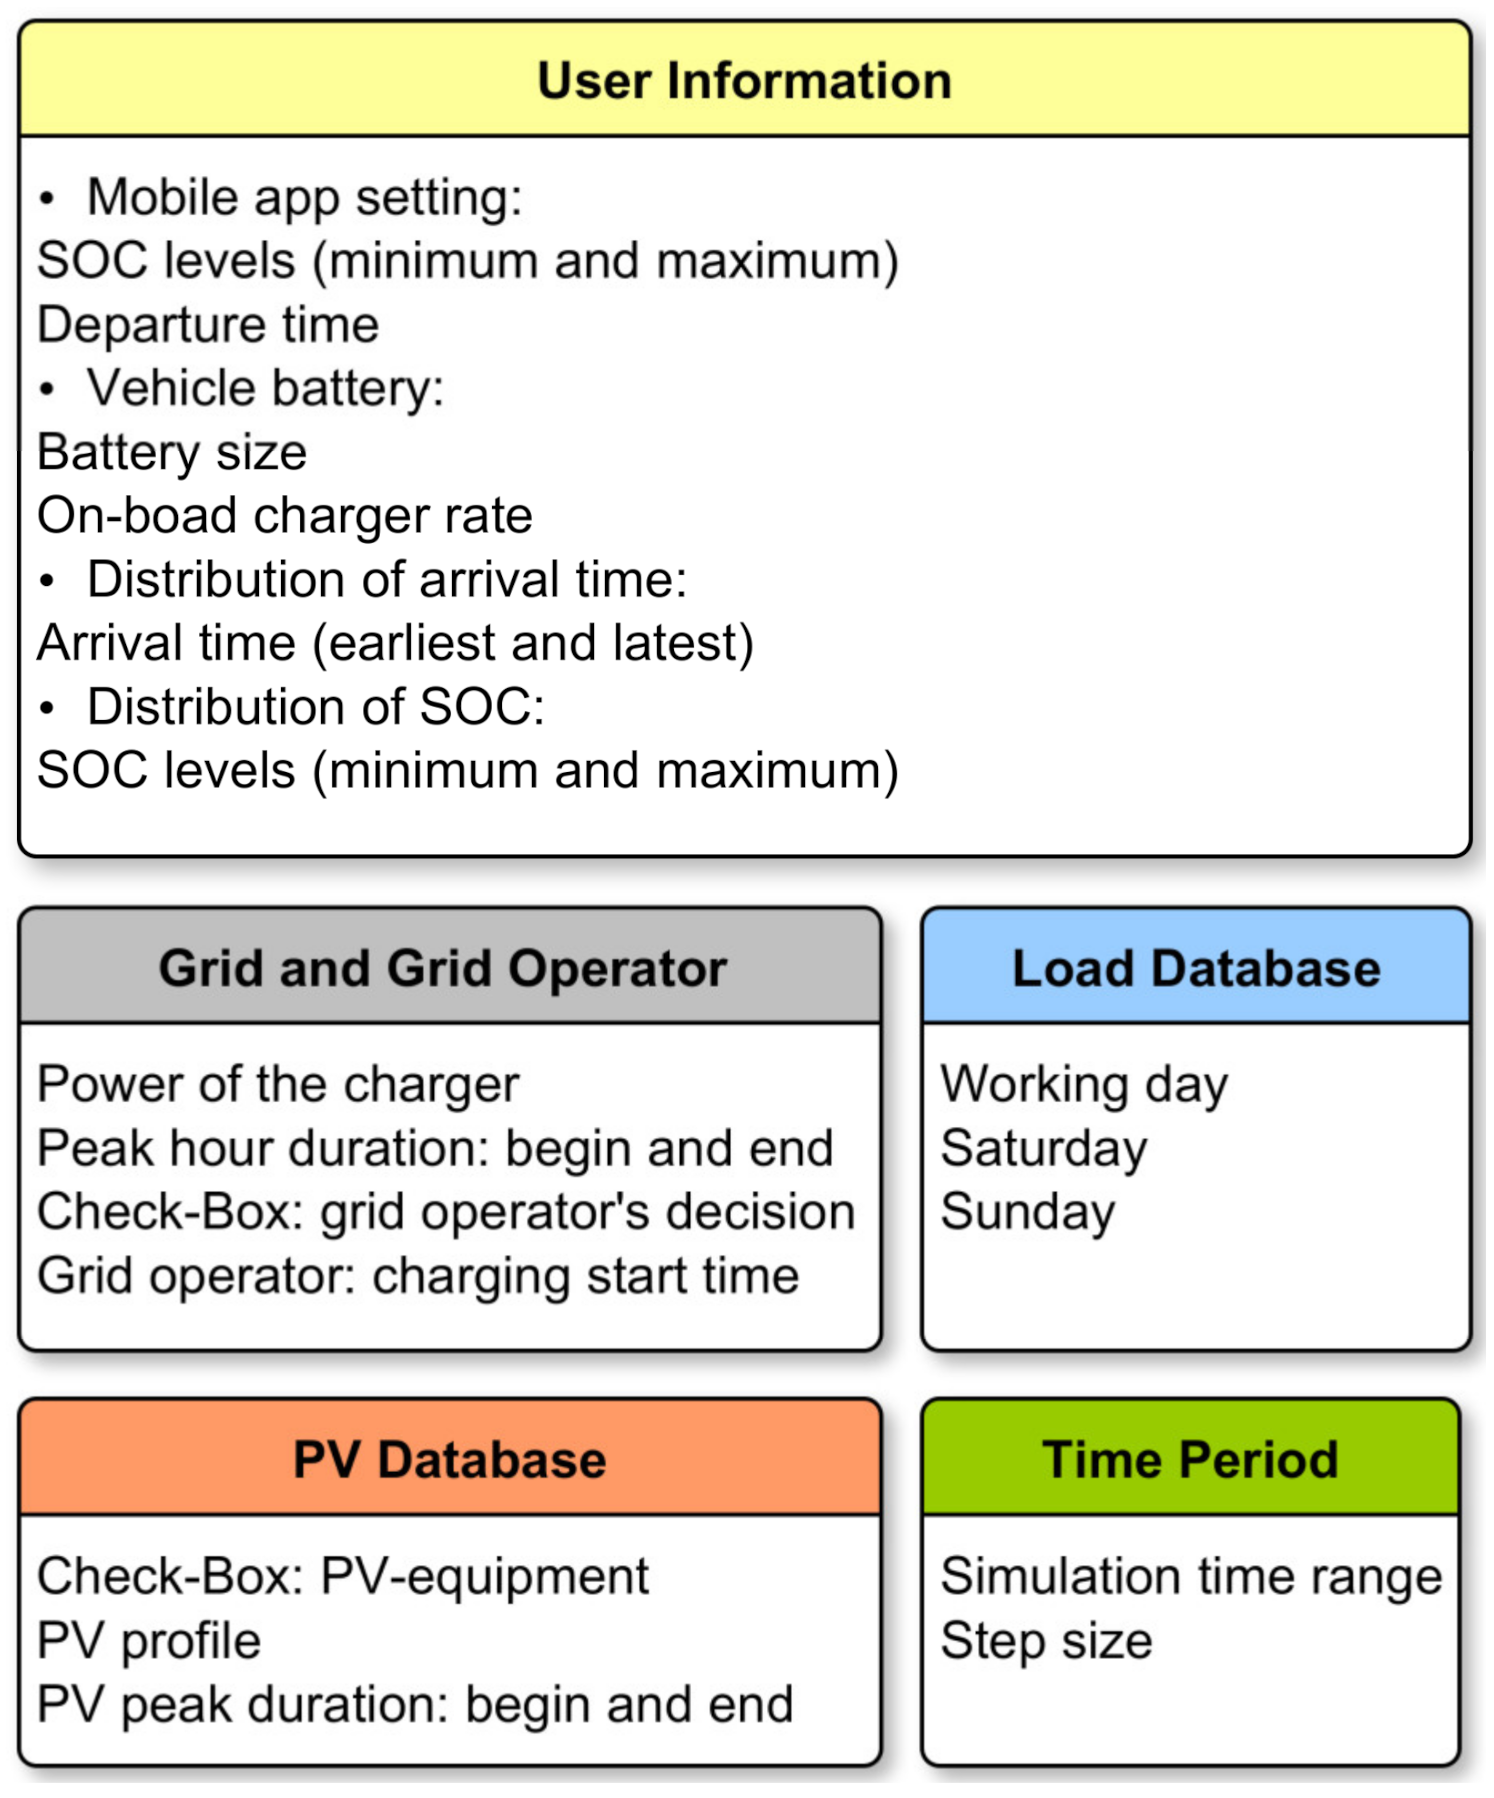
The V2G application’s input data is divided into five categories:
  • User information;
  • Grid and grid operator;
  • Household and commercial load database based on BDEW (German Association of Energy and Water Industries) standard for working days, Saturday, and Sunday;
  • PV database;
  • Simulation time period.
PVs and load profiles are exported in advance from DIgSILENT PowerFactory. Figure 2 shows the input parameters for each category in detail.

2.2.2. V2G Procedure

The V2G service aims to manage EV charging and discharging, assuming that each EV is connected to the V2G charger once per day.
The procedure begins with data received from Section 2.2.1. The user’s arrival time ( T a r r i u s e r ) and initial SOC follow uniform distribution. Since the chance of variables occurring in a uniform distribution is identical, it appears to be a viable solution for describing initial SOC and arrival time due to the user’s stochastic behavior. The uniform_ int_distribution function from the standard C++ library is used to produce uniformly distributed random integer values for arrival time according to the discrete probability function (Equation (1)). Likewise, the uniform_ real_ distribution function from the standard C++ library is utilized to generate random floating-point values for initial SOC according to Equation (2):
f ( x ) = 1 b a + 1 ,   a     x     b
f ( x ) = 1 b a   ,   a     x < b
where a and b are the minimum and maximum values of x , respectively.
Then, the total time (s) to charge the EV with grid from the user’s initial SOC to the maximum SOC level is calculated as follows:
T c h f u l l g r i d = C b E V × ( S O C m a x M o b i l e A p p S O C a c t u a l ) × 3600 P c h g r i d × η × 100
where C b E V donates the EV battery’s capacity (kWh), S O C m a x M o b i l e A p p is the maximum SOC level (%) set by the EV owner in the mobile app (Section 2.2.1), S O C a c t u a l   is the actual SOC (%), and η is the battery charge/discharge efficiency. P c h g r i d   is the power (kW) that the EV can receive exclusively from the grid to be charged, calculated using the minimum value between the EV on-board charger and CS powers:
P c h g r i d = m i n ( P C S V 2 G , P r a t e E V )
where P C S V 2 G   and   P r a t e E V   are the powers (kW) of V2G charger and EV on-board charger, respectively, as specified in Section 2.2.1.

Charging and Discharging Scheduling Strategy

We assumed that EVs are discharged during peak hours if possible and preferably charged during off-peak or PV peak hours. The initial SOC, T c h f u l l g r i d , and the user’s arrival and departure times ( T d e p u s e r ) determine whether the charging or discharging operation should take place. Discharging is not permitted in the following circumstances:
  • The time difference between T d e p u s e r and end of peak hour ( T e n d p e a k   ) is equal to or less than T c h f u l l g r i d ;
  • User arrives before T e n d p e a k   with a SOC equal to or less than mobile app’s minimum SOC level ( S O C m i n M o b i l e A p p );
  • User arrives after T e n d p e a k   .
In this regard, the start time of the charging process is prioritized as follows:
  • At grid operator’s charging start time ( T c h o p ) (Section 2.2.1): if T d e p u s e r T c h o p > T c h f u l l g r i d .
  • At T e n d p e a k   : if T d e p u s e r T e n d p e a k   > T c h f u l l g r i d .
  • At T a r r i u s e r : if T d e p u s e r T e n d p e a k     T c h f u l l g r i d .
The objective of this prioritizing is to fulfill the demands of the power system as well as the EV owner. In this regard, the grid operator has the ability to select the ideal charging start time ( T c h o p ) during off-peak hours or PV peak hours if PV is available. If the item 1 for EV charging at T c h o p is not satisfied, the option of charging at T e n d p e a k   will be explored to still reduce the burden on the power system and provide benefits to the user by charging at the lowest electricity price. Finally, if items 1 and 2 are not met, the EV starts charging at T a r r i u s e r to ensure that it will be ready at T d e p u s e r .

Charging and Discharging Processes

The charging and discharging processes modify the energy of the EV. In the case of charging the EV with PV, the average power (kW) according to the PV profile is first estimated as follows:
P a v e P V = P t P V + P t + Δ t P V 2
where P t P V and P t + Δ t P V   are the PV power outputs (kW) at time t and t + Δ t , respectively.
Then, the charging power (kW) provided from PV to EV is computed by the least of the powers in Equation (6):
P c h P V = m i n ( P C S V 2 G , P r a t e E V , P a v e P V )
In the charging process, the SOC level (%) in the next step size ( Δ t (s)) is expressed as:
S O C c h a r g e n e x t s t e p = S O C a c t u a l + P c h × Δ t × η × 100 C b E V × 3600
where P c h   is either P c h g r i d or P c h P V . The value of S O C c h a r g e n e x t s t e p   should eventually reach S O C m a x M o b i l e A p p   to guarantee user satisfaction.
To evaluate whether an EV can be fully charged only by a PV, we assume that the S O C f i n a l P V   value (%) in Equation (8) should be equal to S O C m a x M o b i l e A p p :
S O C f i n a l P V = S O C a c t u a l + E c h P V × η × 100 C b E V
where E c h P V   is the amount of energy (kWh) supplied by the PV to the EV, calculated using the value of power in Equation (6), PV peak duration, and T d e p u s e r .
If the above criterion is not met, the possibility of partially charging the EV using PV will be examined. In this regard, it is assumed that the EV is first charged with grid for T c h p v g r i d   hours and then switches to charge with PV mode once the PV peak begins.
T c h p v g r i d = C b E V   × ( S O C m a x M o b i l e A p p   S O C p v ) P c h g r i d × η × 100
where S O C p v   is the SOC level increased by PV energy ( E c h P V ) from the user’s initial SOC.
The EV will be charged solely by the grid ( P c h g r i d ) if the requirements for charging totally or partially with PV are not met.
When discharging during peak hours, the average power (kW) is calculated using the load profile as follows:
P a v e L o a d = P t L o a d + P t + Δ t L o a d 2
where P t l o a d   and P t + Δ t l o a d   are the load power values (kW) at time t and t + Δ t , respectively, obtained from DIgSILENT PowerFactory.
The power delivered from EV to the grid is given as:
P d i s c h a r g e = m i n ( P C S V 2 G , P r a t e E V , P a v e L o a d ) × ( 1 )
The SOC (%) in the next step size is then represented as:
S O C d i s c h a r g e n e x t s t e p = S O C a c t u a l + P d i s c h a r g e × Δ t × η × 100 C b E V × 3600
The final value of S O C d i s c h a r g e n e x t s t e p is not allowed to be less than S O C m i n M o b i l e A p p .
The V2G procedure is repeated every day until the simulation time runs out.
With the help of mobile app settings, the proposed application attempts to enhance users’ willingness to participate in V2G by guaranteeing both the minimum SOC level during the discharge process and the maximum SOC level until their desired departure time; additionally, the economic benefits of the EV charging/discharging management facilitate the adoption of V2G.

2.3. Impact on LV Network

The V2G service is developed with the intention of improving load and infeed profiles while minimizing transformer and feeder loading.
The loading (%) for a two-winding transformer is computed as follows:
L o a d i n g t r = I a c t I r × 100
where I a c t   and I r   are the actual currents and rated currents of HV or LV side, respectively.
To find a feeder’s maximum loading, the loading of each element along the feeder is measured, and the highest value among them is chosen.
The followings are the constraints of the objective problems:

2.3.1. Voltage Constraint

Each bus should have a voltage magnitude that is within acceptable limits:
V i m i n V i , t V i m a x

2.3.2. Thermal Loading Constraint

The thermal loading of each element should not exceed 100%.

3. Results

3.1. Proposed Test System

The proposed methodology is tested on the example of a LV distribution network in DIgSILENT PowerFactory, which consists of 0.4 kV, 10 kV, and 30 kV systems. Feeder 067 on the 0.4 kV side of the network is considered to assess the impact of EV charging and discharging on the grid. Figure 3 shows the diagram of Feeder 067 with 50% penetration of EVs; this feeder, which has a length of 0.302 km, 41 lines, 1 residential and 24 commercial loads, and 7 PV systems, is supplied by a three-phase 11/0.4 kV transformer with a capacity of 0.63 MVA. The Quasi-Dynamic Simulation toolbox in DIgSILENT PowerFactory is used to generate the results. The load profiles are simulated utilizing the BDEW standard, which is included in the DIgSILENT PowerFactory library. In addition, the V2G application’s transferred outputs are applied to model EVs in DIgSILENT PowerFactory. Since the capacity of the EV battery is anticipated to increase in the future, we assume that the EVs in this paper have capacities of 50, 60, and 70 kWh with an acceptance rate of 11 kW.

3.2. Case Studies and Results

The following five scenarios are analyzed and compared to validate the effectiveness of the proposed control algorithm:
Scenario 1: The original grid before the adoption of EVs.
Scenario 2: The grid performance with a 25% EV penetration level (six EVs) is investigated. EVs are charged as soon as they are plugged into the chargers, with no intervention from the grid operator. In this scenario, EVs are charged only from the grid at full power. To estimate the initial SOC of the battery, a and b values in Equation (2) are set to 35% and 75%, respectively.
Scenario 3: EV owners participate in the V2G operation by discharging their vehicles during peak load hours, while charging them either during off-peak load hours or when PV systems are at their peak. In this case, the grid operator manages the charging start time ( T c h o p ) to avoid additional peak loads in the power grid and to facilitate load-shifting through the V2G service. We assumed a value of 35% for a since it must be greater than S O C m i n M o b i l e A p p to meet one of the discharge conditions. The penetration of EVs is 25%, which is the same as in the preceding scenario.
Scenario 4: Similar to Scenario 2, but with 50% penetration of EVs (12 EVs).
Scenario 5: Similar to Scenario 3, but with 50% penetration of EVs.
Table 1 summarizes the simulation settings utilized in this paper for EVs, CSs, PV systems, and simulation time range.
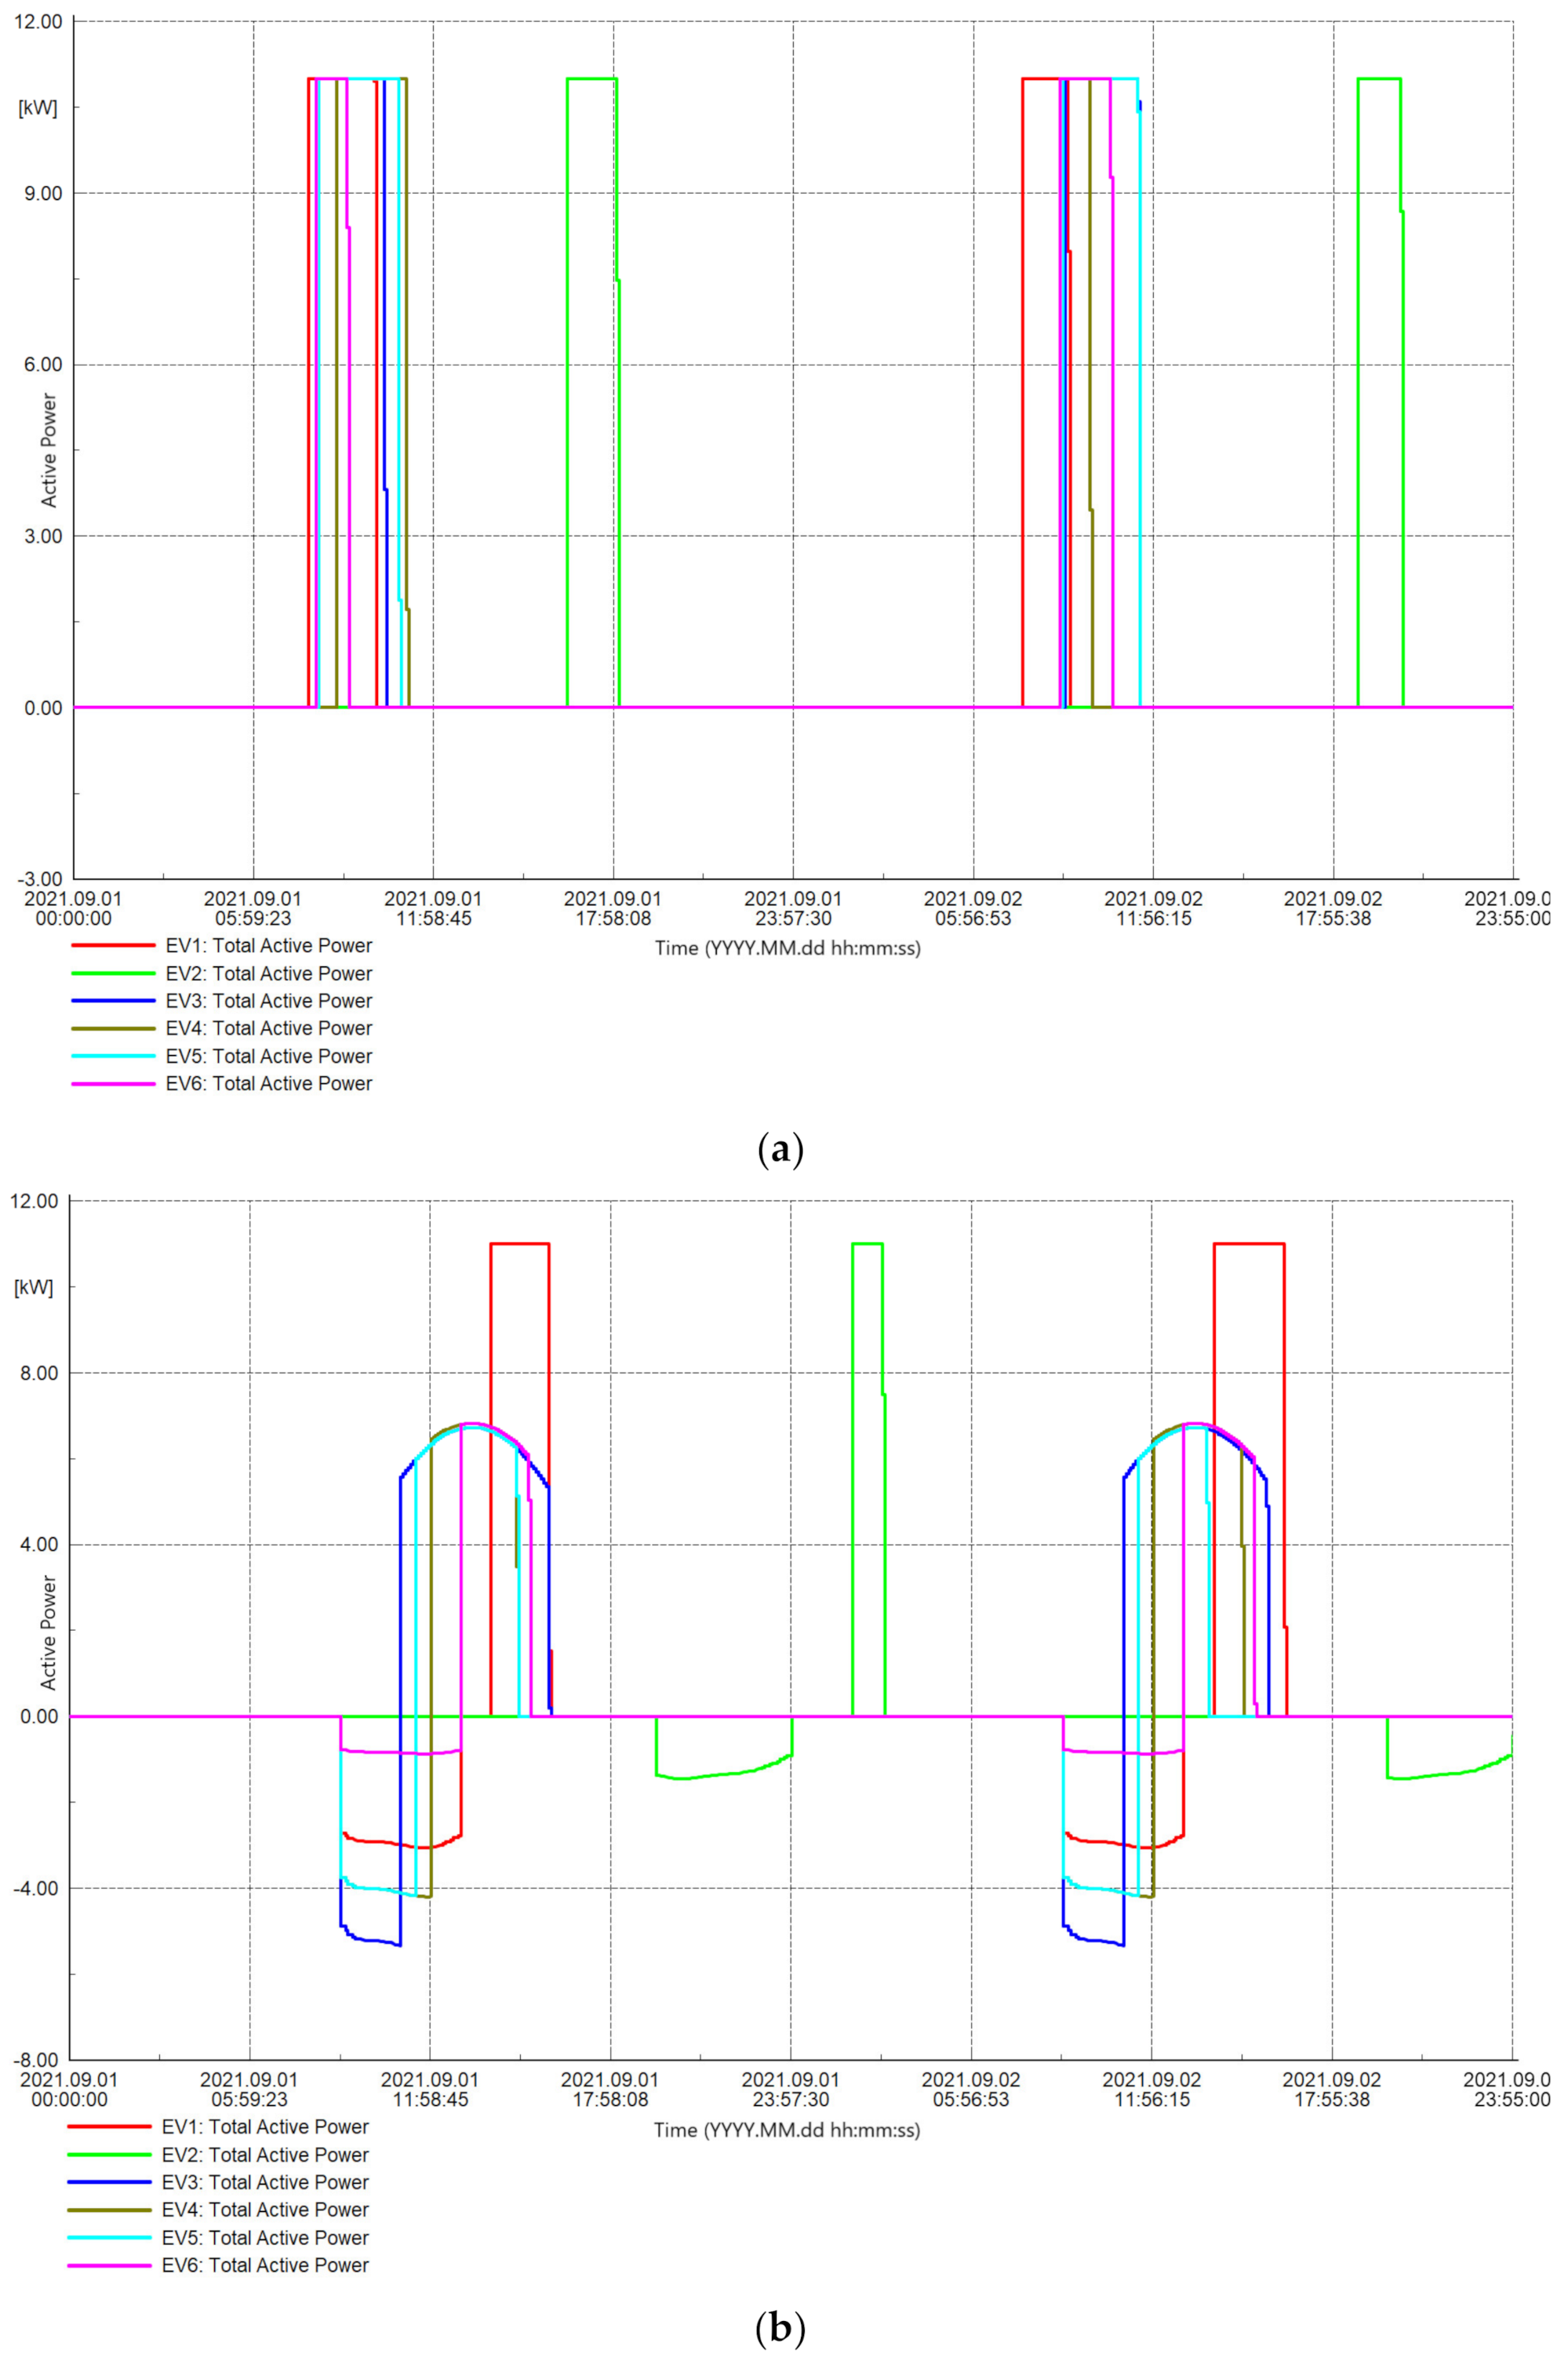
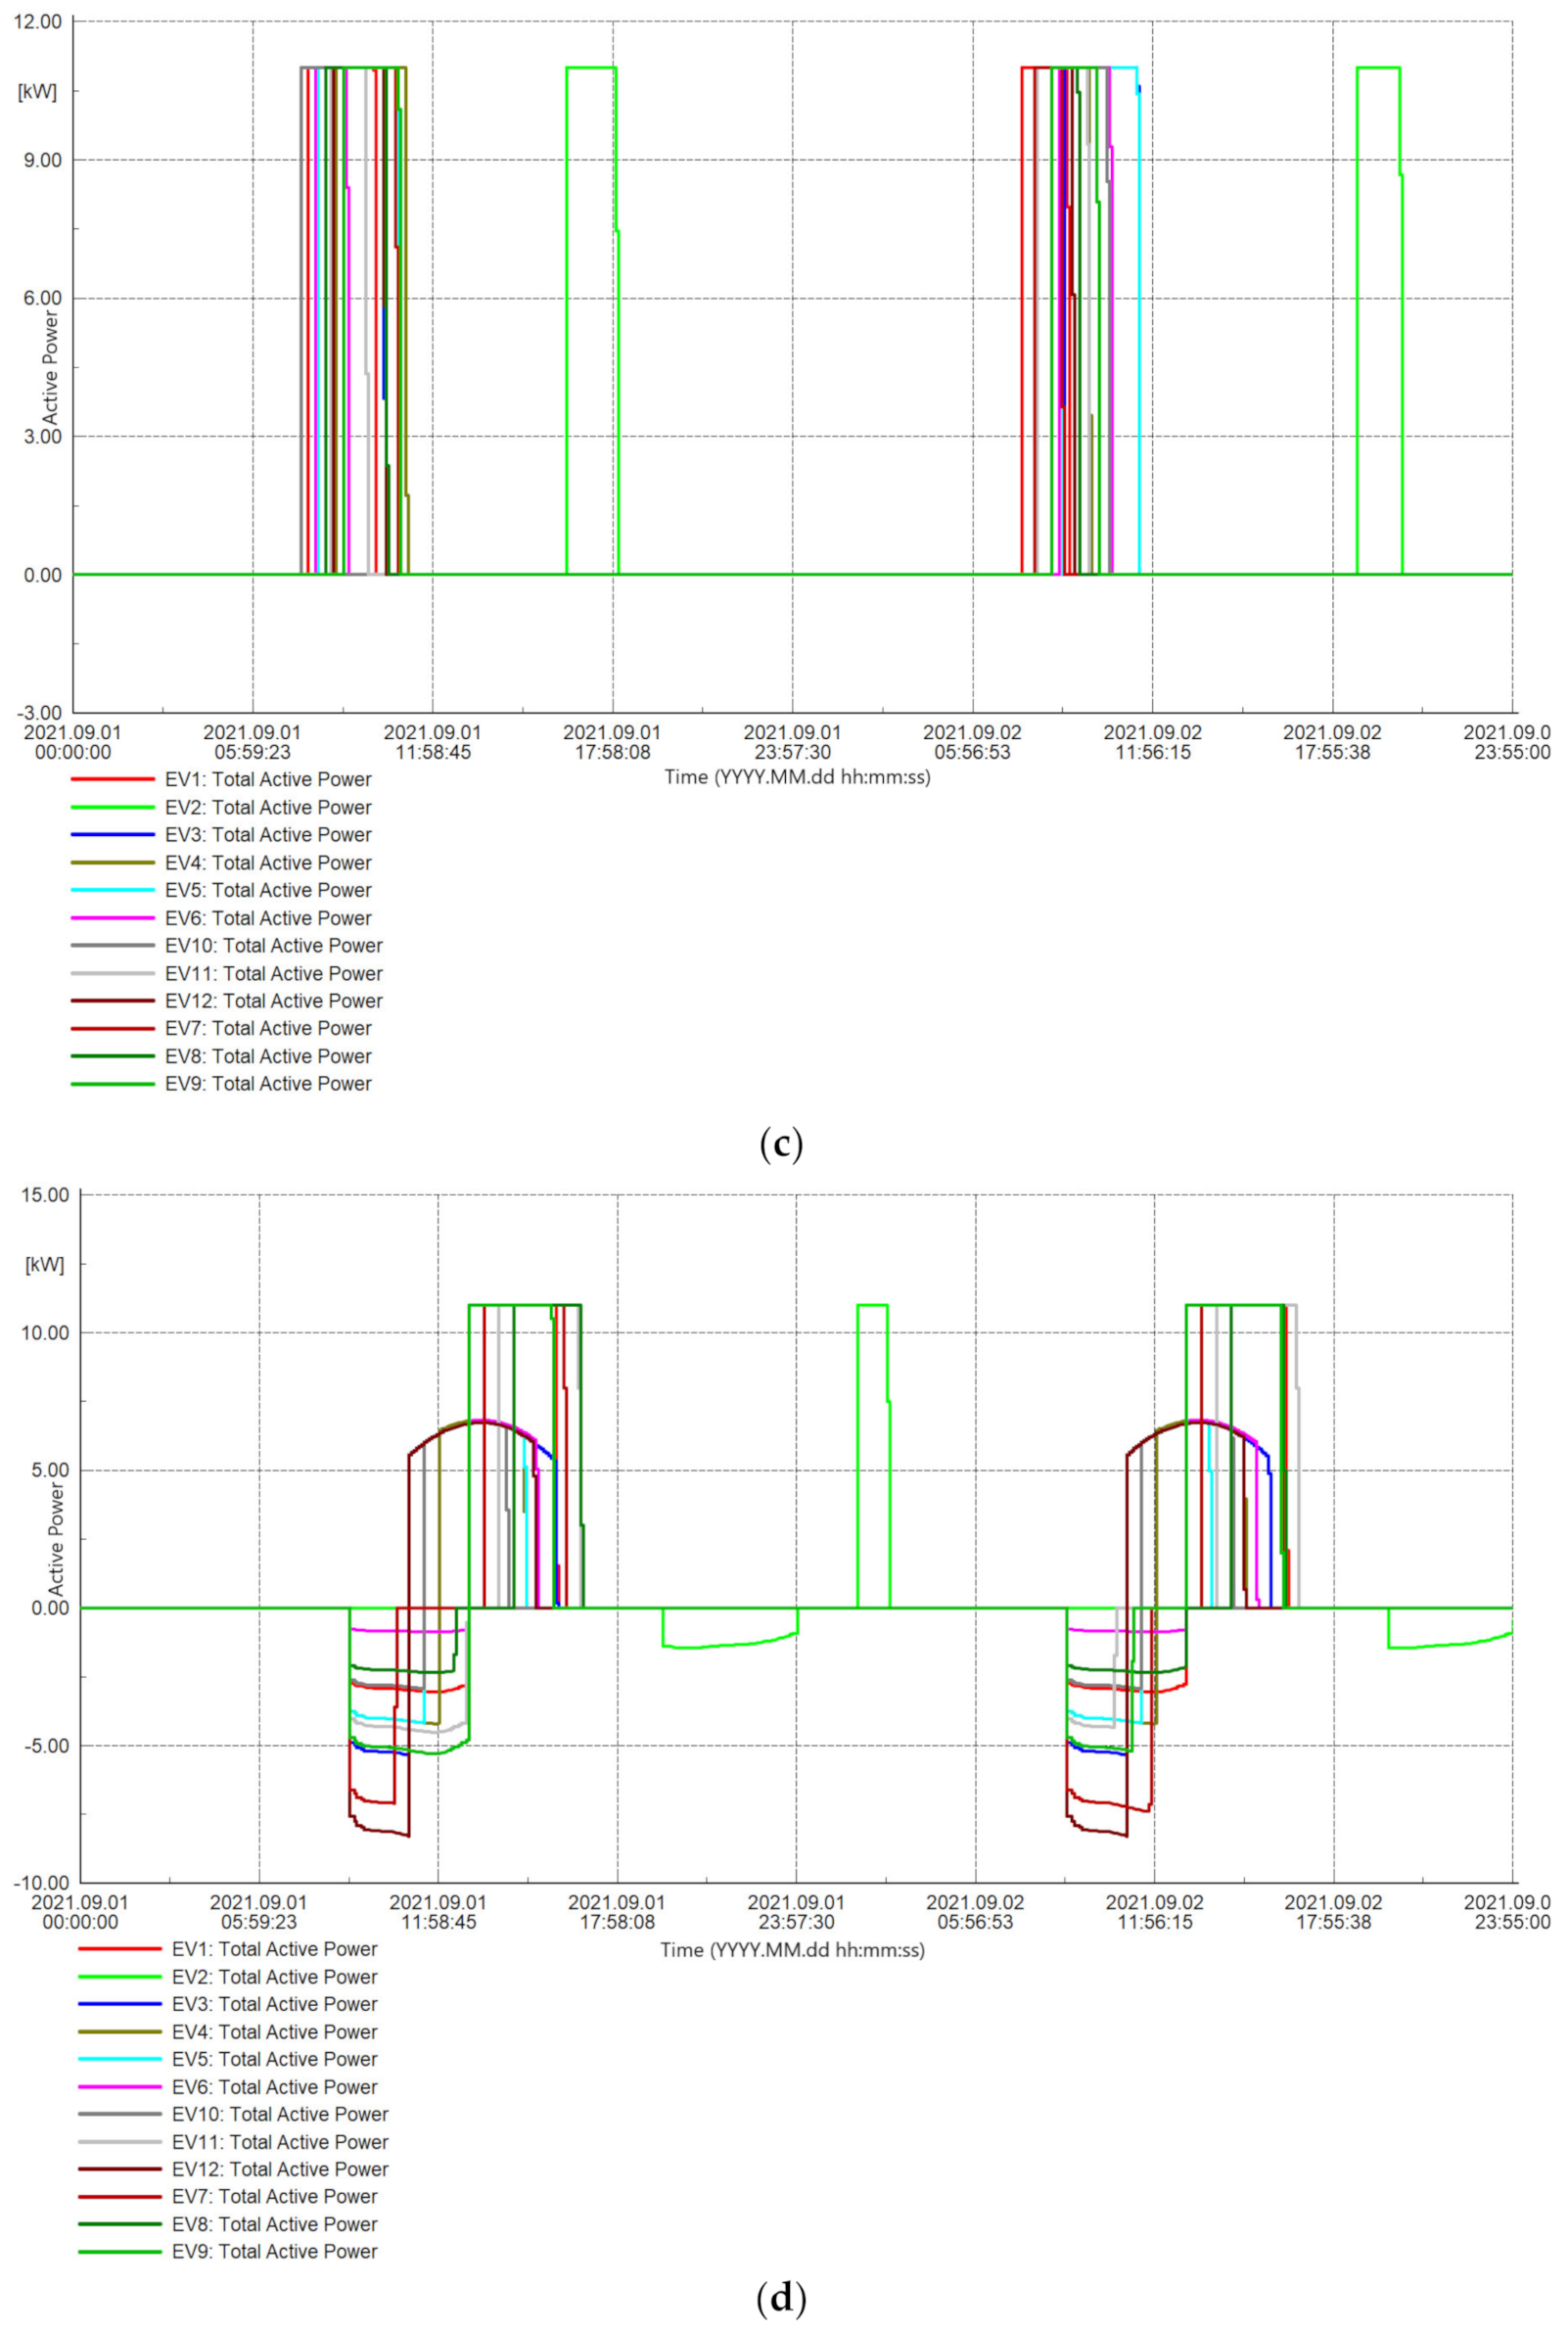
Figure 4 depicts the load profiles of EVs in the various scenarios. Only EV #2 is connected to a home charger; the rest of the EVs are charged at the workplace during the working day. EVs charging demands for scenarios 2 and 4 are shown in Figure 4a,c, respectively. As can be seen, EVs charging events occur based on users’ arrival times, which are between 7:30 and 9:00 at work and between 16:00 and 20:00 at home; no discharging takes place in these cases. Figure 4b,d, which correspond to scenarios 3 and 5, respectively, illustrate EVs charging/discharging profiles in accordance with the proposed V2G concept. To avoid grid congestion, the grid operator schedules the recharging process to begin during off-peak hours or PV peak hours if PV is available. Although it is difficult to distinguish individual EV profiles in each scenario because they are all displayed in the same figures, it gives a useful visual representation of EVs charging/discharging events during weekdays.
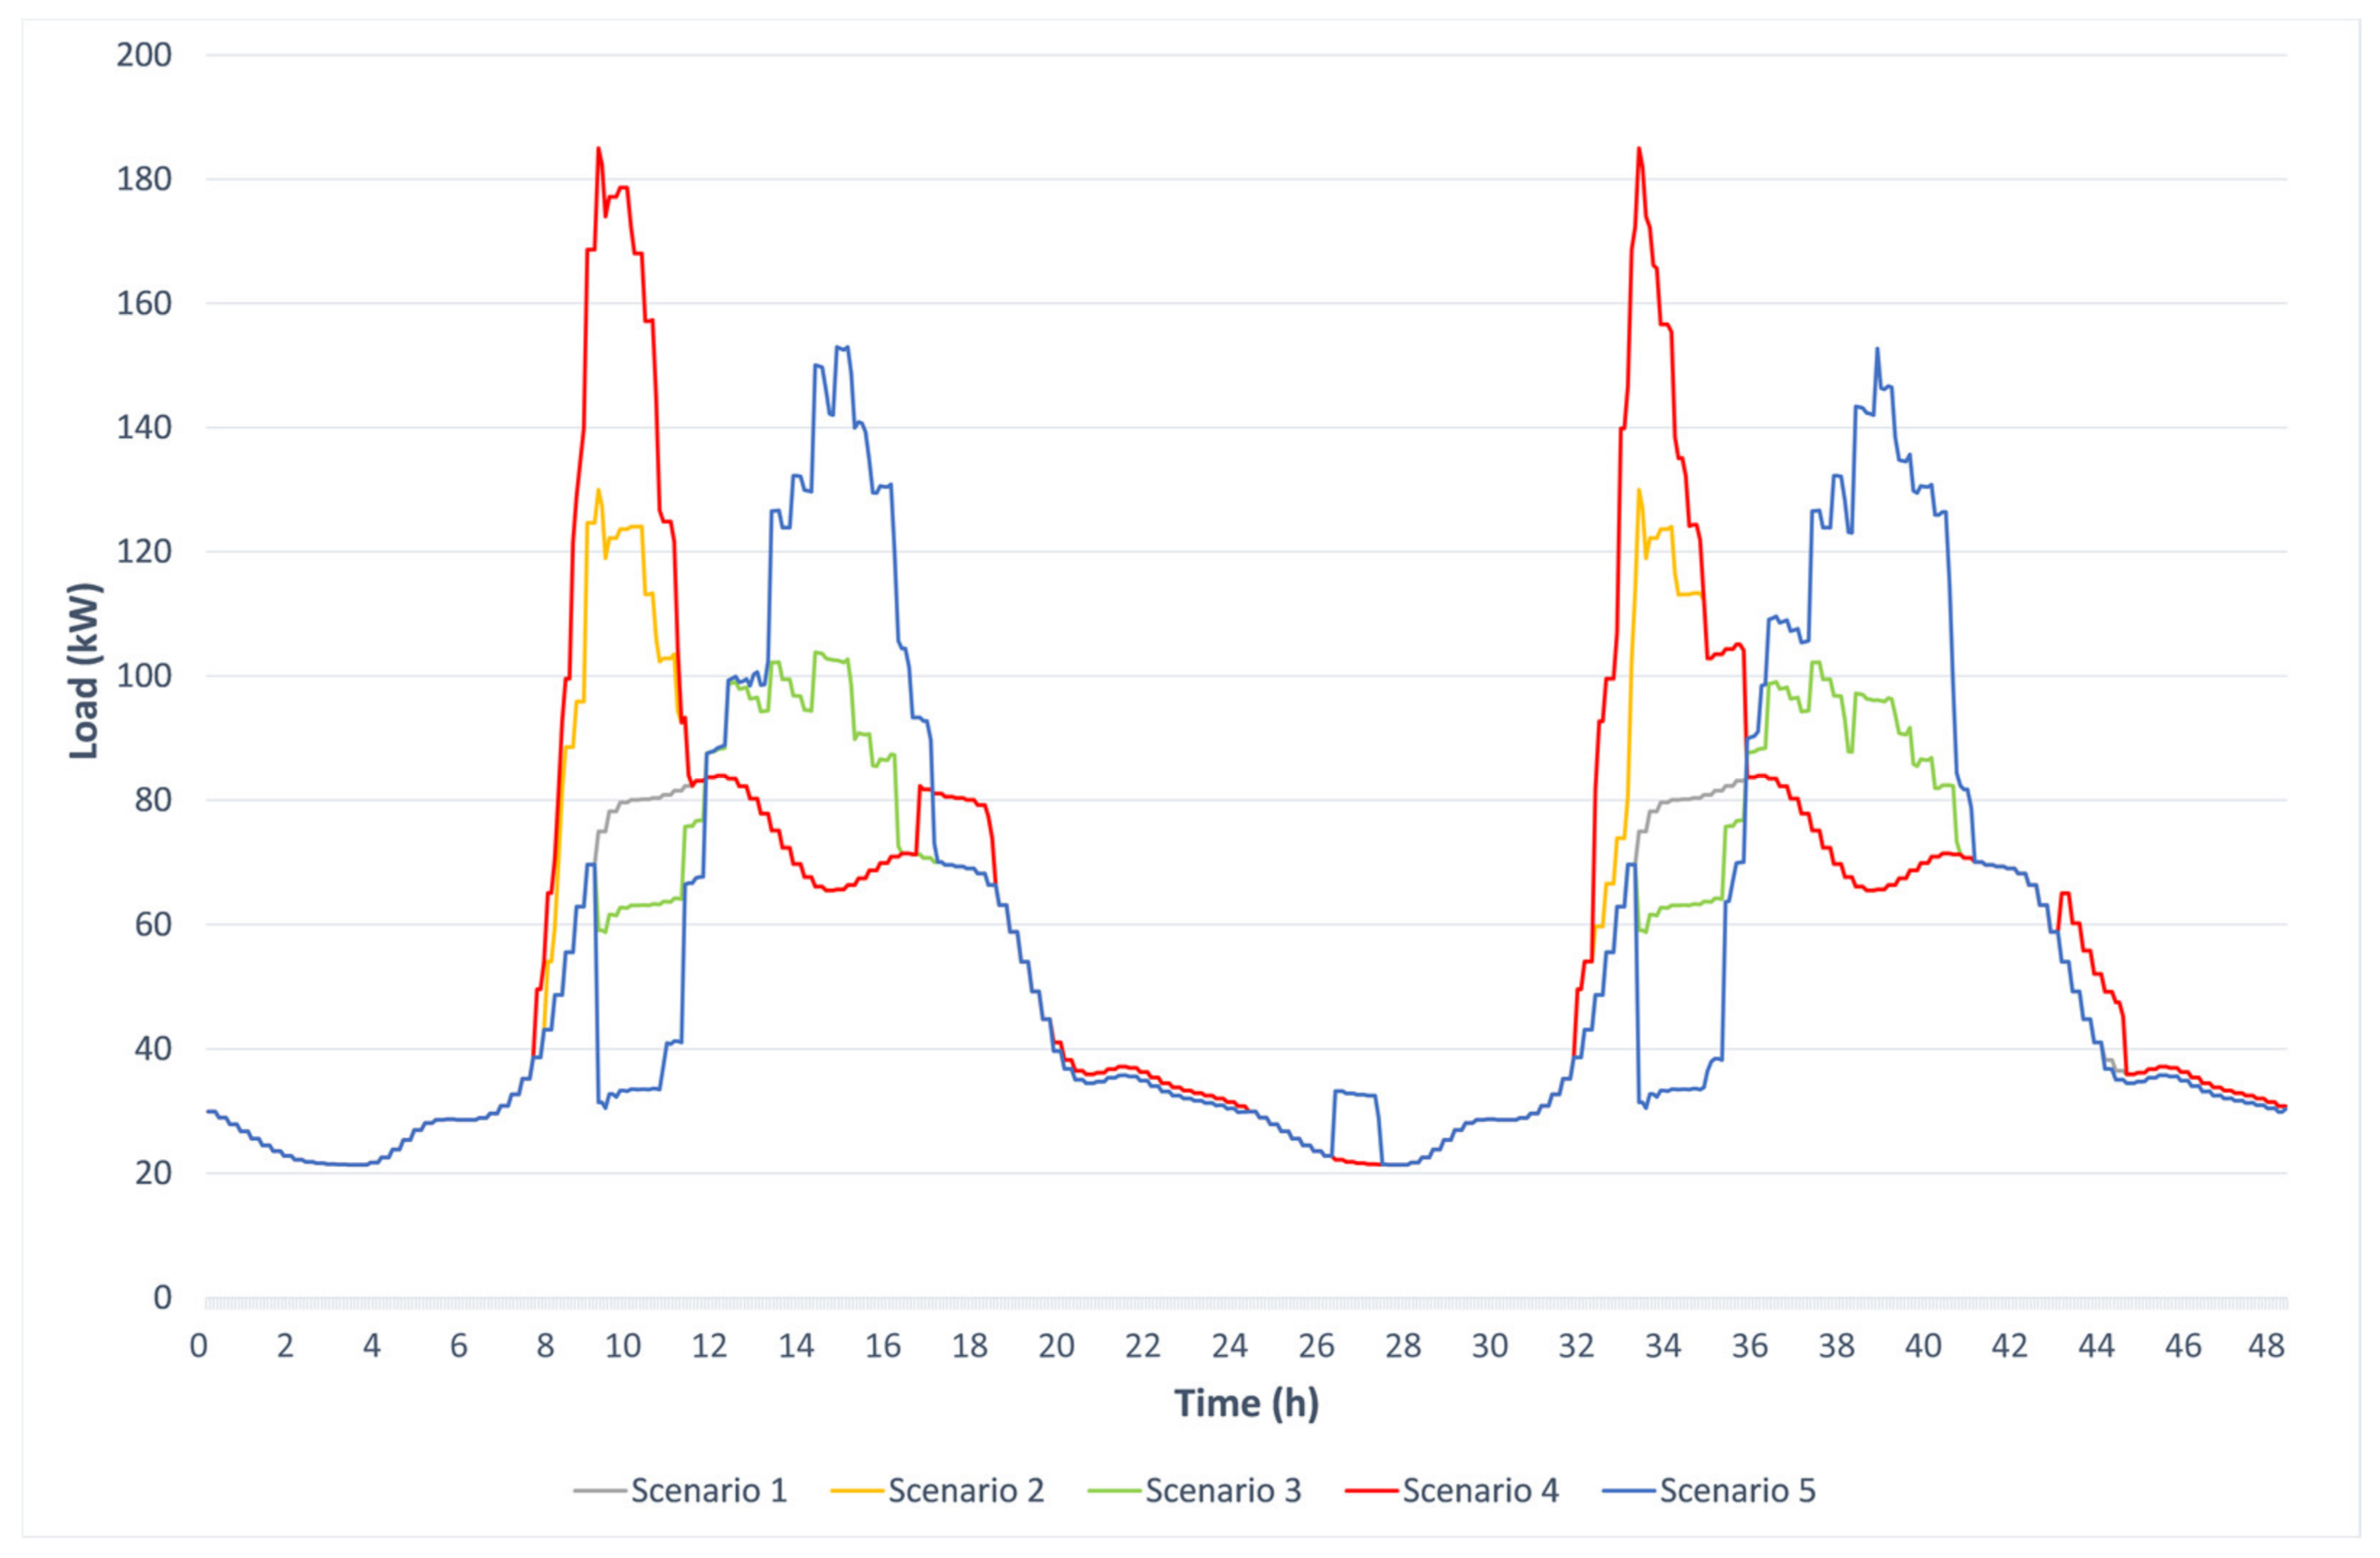
The load profiles of Feeder 067 for all scenarios are shown in Figure 5. When scenario 1 is compared to scenarios 2 and 4, it can be observed that the power consumption in this feeder ramps up between 7:30 and 11:30 due to EVs charging, resulting in a new peak demand at around 9:00. In scenarios 3 and 5, on the other hand, proper V2G scheduling reduces peak demand by EVs discharging during peak hours and shifts loads to off-peak hours.
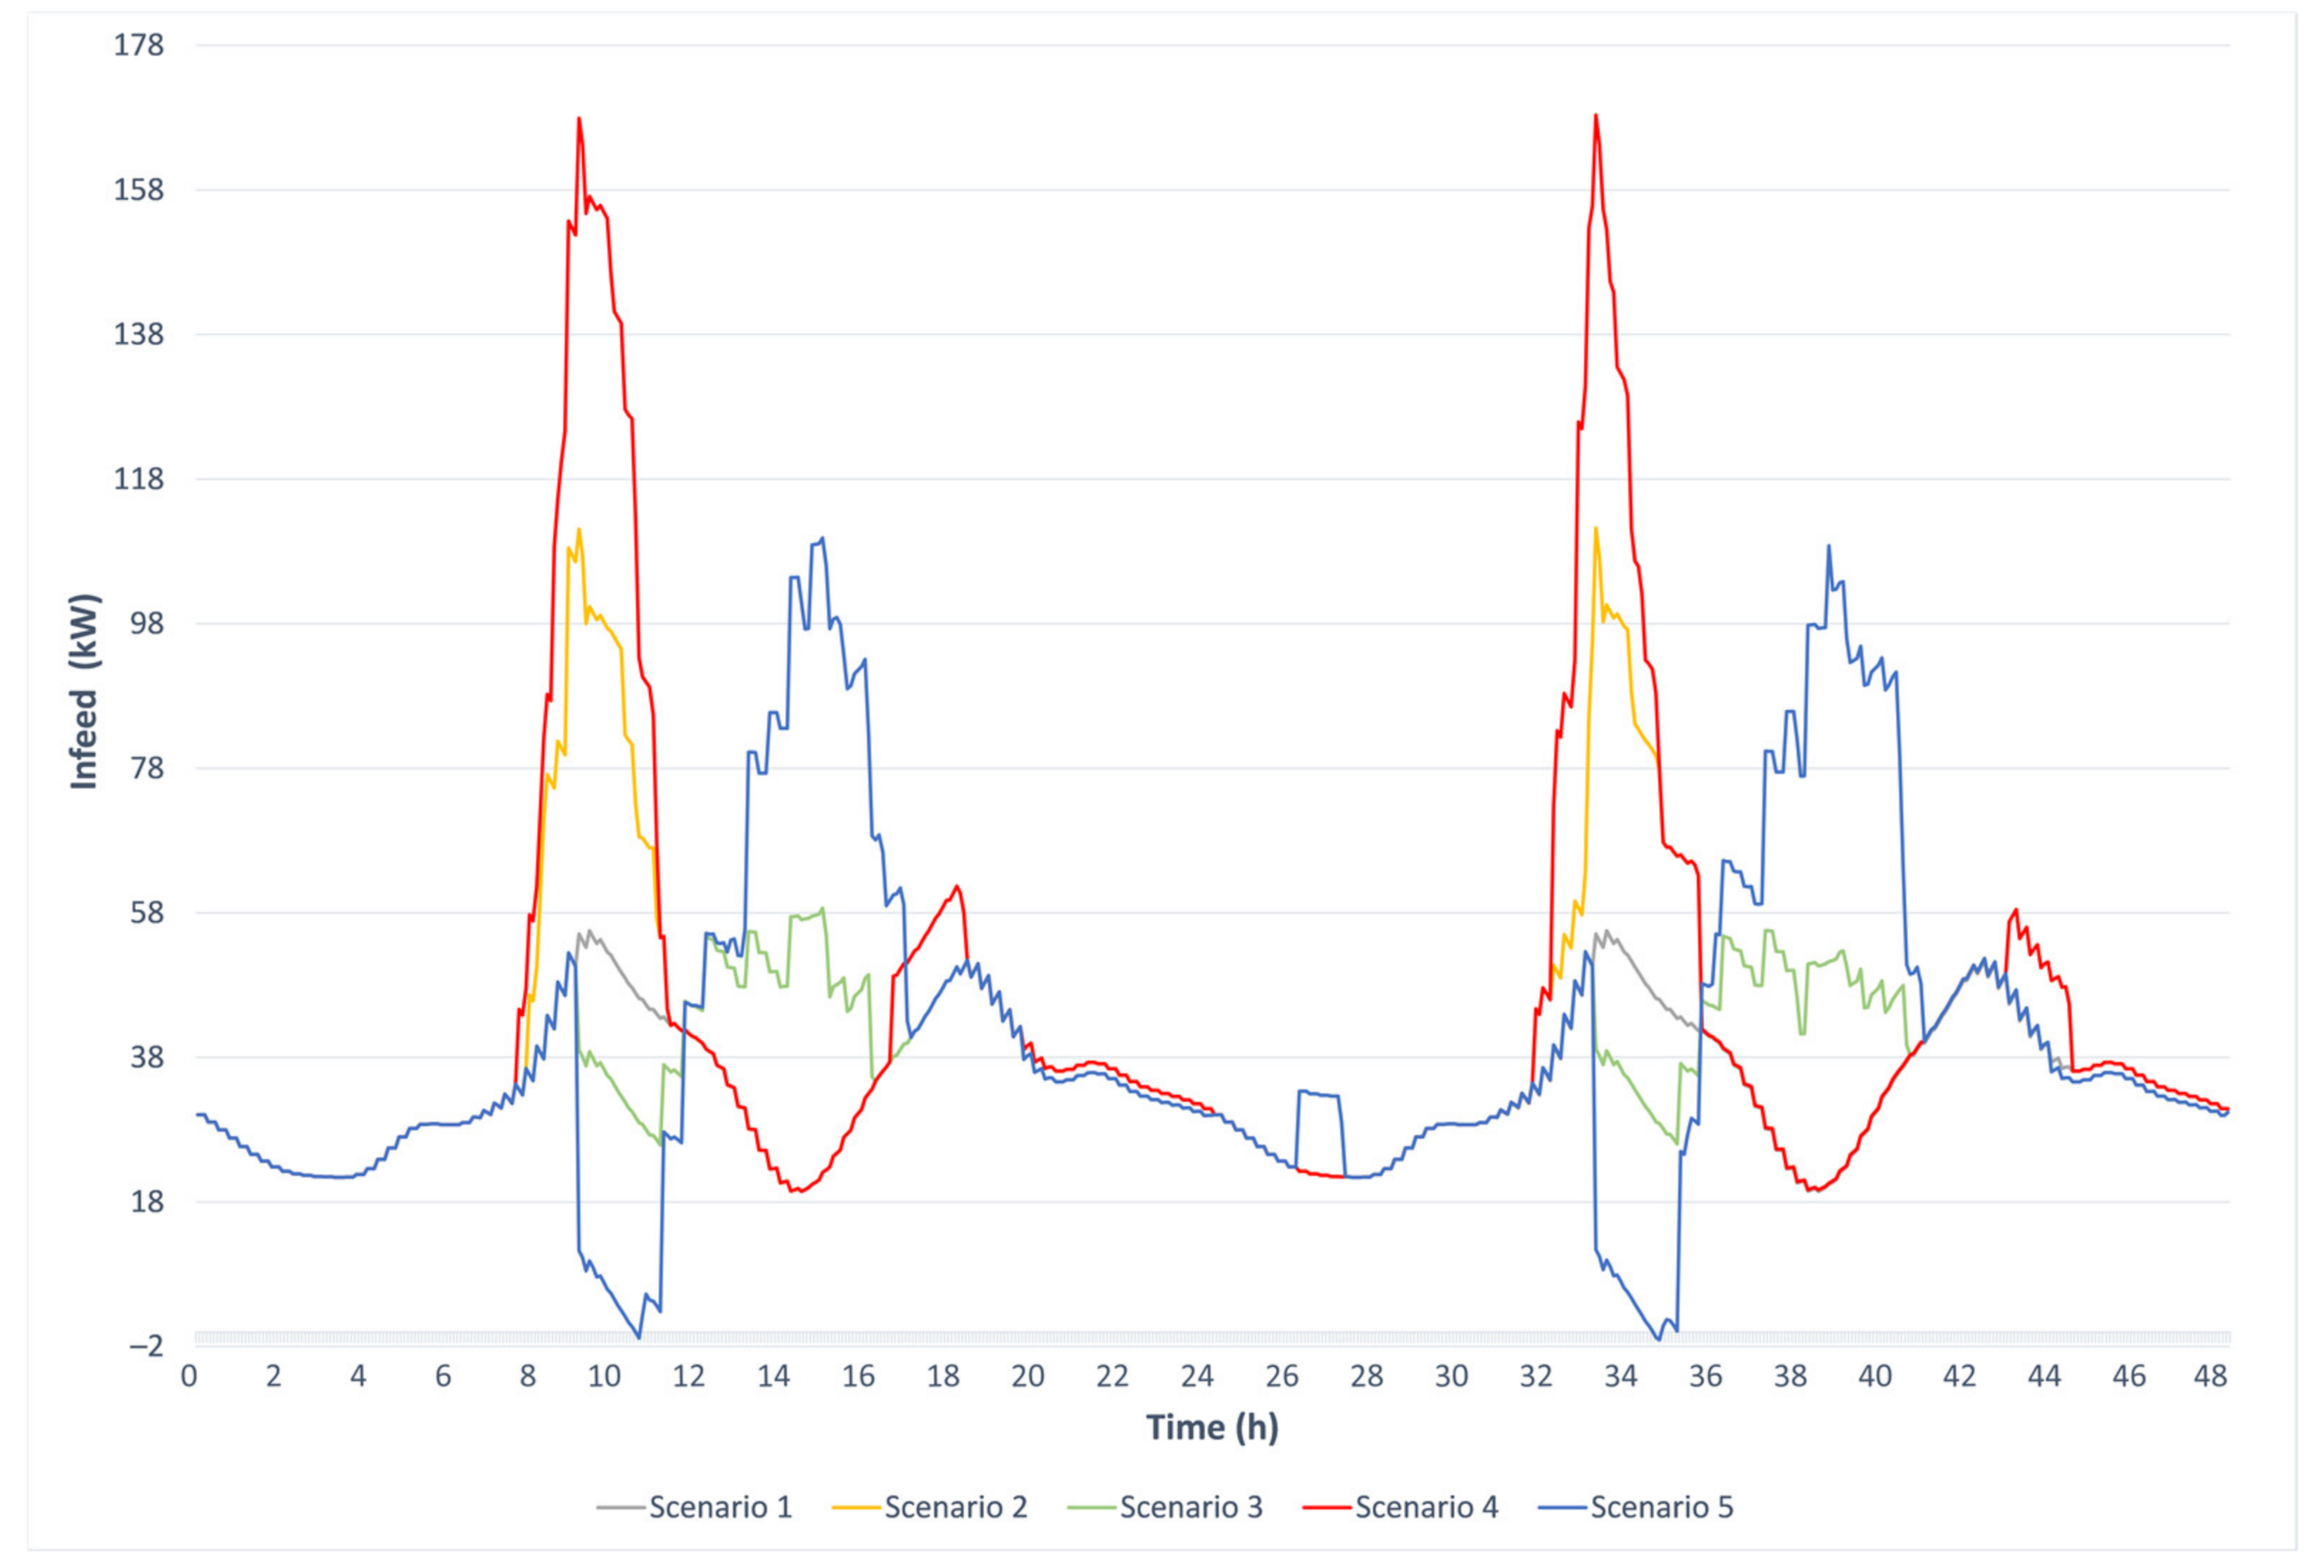
The scenarios can also be compared from the grid perspective. The infeed power from the grid to Feeder 067 is shown in Figure 6. The V2G approach decreases the load demand (Figure 5), resulting in a large reduction in the grid infeed power due to the discharge of 6 and 12 EVs in scenarios 3 and 5, respectively; hence, when used in the V2G mode, EVs minimize the grid stress by acting as energy storage units and delivering energy back to the grid during discharging procedures. In scenarios 2 and 4, on the other hand, the grid infeed power is considerably boosted to meet the increase in load demand caused by the uncoordinated EVs charging; in these cases, the energy produced by PVs is the only source of the grid support.
The major observations from Quasi-Dynamic Simulation are presented in Table 2, Table 3 and Table 4, which include the minimum, average, and maximum values of load and infeed powers, transformer loading, and maximum loading along the feeder, respectively. When comparing scenarios 1 and 2, it can be seen that the uncoordinated EVs charging can result in a 54.9% growth in the maximum peak load, as well as 99.76% and 85.83% increases in the maximum infeed power and transformer loading, respectively; these three parameters are raised by 23.69%, 5.36%, and 2.01%, respectively, when comparing scenarios 1 and 3. The impact of increasing the EV penetration level on the feeder is seen in scenarios 4 and 5. The three abovementioned values are increased by 42.31%, 51.37%, and 49.41%, respectively, when comparing scenario 2 to 4. When the number of EVs is doubled in the V2G case, the maximum peak load and transformer loading are increased by 47.38% and 79.04%, respectively. However, the minimum value of infeed power drops to −1.064 kW, owing to an increase in the number of EVs that discharge during peak hours, indicating that the amount of load demand at that time is even lower than the PVs generation. Table 4 shows that the maximum loading value in scenario 4 is 91.998%, which is dedicated to the cable that is directly connected to the substation, whereas in the other cases, one of the PV systems has the highest loading value of 66.886% in comparison to the other elements along the feeder. Although our analysis reveals that the maximum loading along the feeder does not violate its constraint, if the EV penetration level is greater than 50%, this parameter might become problematic for uncoordinated EV charging.

4. Conclusions

This paper presented a two-stage control strategy for energy management of bidirectional CSs and its impact on a LV distribution grid. In the first stage, a new V2G application was introduced to estimate EV charging/discharging profiles using key factors such as user uncertainties, mobile app settings specified by the user, the feasibility of charging by PV systems, charging start time managed by the grid operator, and load profiles. This application was developed to guarantee user satisfaction while also meeting the grid’s demand. In the second stage, the output of the proposed application was examined on a commercial–residential feeder in DIgSILENT PowerFactory, calculating time-varying load flows over the simulation period. In this paper, five scenarios were designed. The findings have demonstrated that an uncoordinated EV charging resulted in an additional peak load, causing grid parameters such as grid infeed power and transformer and feeder loading to increase; even though these parameters did not exceed their acceptable limits in our investigation, energy management is a critical issue for EVs due to their global growth. The numerical results and comparison of grid behavior under the aforementioned scenarios indicate the effectiveness of the proposed V2G approach in mitigating the adverse effects of EVs on the grid while also minimizing the need for grid upgrades. The V2G approach has been proved to be reliable at two EV penetration levels. When comparing the uncoordinated EVs charging with a 25% penetration level to the V2G mode with 50% EVs penetration, the maximum peak load was only increased by 17.7%, while the maximum infeed power and transformer loading were reduced by 1.21% and 1.71%, respectively; the maximum loading along the feeder remained constant in both conditions.

Author Contributions

Conceptualization, P.F.; data curation, P.F.; formal analysis, P.F. and V.P.; investigation, P.F.; methodology, P.F.; project administration, V.P.; resources, P.F.; software, P.F.; supervision, V.P.; validation, V.P.; visualization, P.F.; writing—original draft, P.F.; writing—review and editing, V.P. All authors have read and agreed to the published version of the manuscript.

Funding

This research was funded by the “Immediate Clean Air Program 2017–2020” of the Federal Ministry for Economic Affairs and Energy in Germany [grant number FKZ: 01MZ18008B].

Data Availability Statement

All data generated or analyzed during this study are included in this published article.

Conflicts of Interest

The authors declare no conflict of interest.

References

  1. The German Federal Government. Intergenerational Contract for the Climate. Available online: https://www.bundesregierung.de/breg-de/themen/klimaschutz/climate-change-act-2021-1936846 (accessed on 20 October 2022).
  2. German Federal Environment Ministry and the Federal Environment Agency. Greenhouse Gas Emissions Fell 8.7 Percent in 2020. Available online: https://www.bmuv.de/pressemitteilung/treibhausgasemissionen-sinken-2020-um-87-prozent (accessed on 20 October 2022).
  3. The Federal Ministry for Economic Affairs and Energy. Regulatory Environment and Incentives for Using Electric Vehicles and Developing a Charging Infrastructure. Available online: https://www.bmwk.de/Redaktion/EN/Artikel/Industry/regulatory-environment-and-incentives-for-using-electric-vehicles.html (accessed on 20 October 2022).
  4. The Federal Ministry for Economic Affairs and Energy. Electromobility in Germany. Available online: https://www.bmwk.de/Redaktion/DE/Dossier/elektromobilitaet.html (accessed on 20 October 2022).
  5. Mohagheghi, E.; Gasso, J.G.; Li, P. Optimal integration of electric vehicles in smart grids with renewables and battery storage systems under uncertainty. Trends Comput. Sci. Inf. Technol. 2020, 5, 048–049. [Google Scholar] [CrossRef]
  6. Mohammad, A.; Zamora, R.; Lie, T.T. Integration of electric vehicles in the distribution network: A review of PV based electric vehicle modelling. Energies 2020, 13, 4541. [Google Scholar] [CrossRef]
  7. Kempton, W.; Tomić, J. Vehicle-to-grid power fundamentals: Calculating capacity and net revenue. J. Power Sources 2005, 144, 268–279. [Google Scholar] [CrossRef]
  8. Vayá, M.G.; Andersson, G. Self scheduling of plug-in electric vehicle aggregator to provide balancing services for wind power. IEEE Trans. Sustain. Energy 2015, 7, 886–899. [Google Scholar] [CrossRef]
  9. Yilmaz, M.; Krein, P.T. Review of benefits and challenges of vehicle-to-grid technology. In Proceedings of the 2012 IEEE Energy Conversion Congress and Exposition (ECCE), Raleigh, NC, USA, 15–20 September 2012; pp. 3082–3089. [Google Scholar] [CrossRef]
  10. Kisacikoglu, M.C.; Ozpineci, B.; Tolbert, L.M. Examination of a PHEV bidirectional charger system for V2G reactive power compensation. In Proceedings of the 2010 Twenty-Fifth Annual IEEE Applied Power Electronics Conference and Exposition (APEC), Palm Springs, CA, USA, 21–25 February 2010; pp. 458–465. [Google Scholar] [CrossRef] [Green Version]
  11. Shi, L.; Lv, T.; Wang, Y. Vehicle-to-grid service development logic and management formulation. J. Modern Power Syst. Clean Energy 2019, 7, 935–947. [Google Scholar] [CrossRef]
  12. Han, S.; Han, S. Development of short-term reliability criterion for frequency regulation under high penetration of wind power with vehicle-to-grid support. Electr. Power Syst. Res. 2014, 107, 258–267. [Google Scholar] [CrossRef]
  13. Pavić, I.; Capuder, T.; Kuzle, I. Value of flexible electric vehicles in providing spinning reserve services. Appl. Energy 2015, 157, 60–74. [Google Scholar] [CrossRef]
  14. Habib, H.U.R.; Subramaniam, U.; Waqar, A.; Farhan, B.S.; Kotb, K.M.; Wang, S. Energy cost optimization of hybrid renewables based V2G microgrid considering multi objective function by using artificial bee colony optimization. IEEE Access 2020, 8, 62076–62093. [Google Scholar] [CrossRef]
  15. Drude, L.; Junior, L.C.P.; Rüther, R. Photovoltaics (PV) and electric vehicle-to-grid (V2G) strategies for peak demand reduction in urban regions in Brazil in a smart grid environment. Renew. Energy 2014, 68, 443–451. [Google Scholar] [CrossRef]
  16. Tabatabaee, S.; Mortazavi, S.S.; Niknam, T. Stochastic scheduling of local distribution systems considering high penetration of plug-in electric vehicles and renewable energy sources. Energy 2017, 121, 480–490. [Google Scholar] [CrossRef]
  17. Slama, S.A.B. Design and implementation of home energy management system using vehicle to home (H2V) approach. J. Clean. Prod. 2021, 312, 127792. [Google Scholar] [CrossRef]
  18. Sheng, S.W.; Yee, Y.S.; Raymond, W.J.K.; Mei, K.T. Economic Dispatch of Micro-grid Considering Electric Vehicles. In Proceedings of the 2021 11th IEEE International Conference on Control System, Computing and Engineering (ICCSCE), Penang, Malaysia, 27–28 August 2021; pp. 66–70. [Google Scholar] [CrossRef]
  19. Sabzehgar, R.; Kazemi, M.A.; Rasouli, M.; Fajri, P. Cost optimization and reliability assessment of a microgrid with large-scale plug-in electric vehicles participating in demand response programs. Int. J. Green Energy 2020, 17, 127–136. [Google Scholar] [CrossRef]
  20. Alsharif, A.; Tan, C.W.; Ayop, R.; Lau, K.Y.; Moh’d Dobi, A. A rule-based power management strategy for Vehicle-to-Grid system using antlion sizing optimization. J. Energy Storage 2021, 41, 102913. [Google Scholar] [CrossRef]
  21. Bampoulas, A.; Karlis, A. Real-time energy storage management system of a nanogrid integrating photovoltaics and V2G operation. J. Eng. 2019, 2020, 32–40. [Google Scholar] [CrossRef]
  22. Van Der Kam, M.; van Sark, W. Smart charging of electric vehicles with photovoltaic power and vehicle-to-grid technology in a microgrid; a case study. Appl. Energy 2015, 152, 20–30. [Google Scholar] [CrossRef] [Green Version]
  23. Harrabi, I.; Maier, M. Performance analysis of a real-time decentralized algorithm for coordinated PEV charging at home and workplace with PV solar panel integration. In Proceedings of the 2014 IEEE PES General Meeting|Conference & Exposition, National Harbor, MD, USA, 27–31 July 2014; pp. 1–5. [Google Scholar] [CrossRef]
  24. Acharige, S.S.; Haque, M.E.; Arif, M.T.; Hosseinzadeh, N.; Saha, S. A Solar PV Based Smart EV Charging System with V2G Operation for Grid Support. In Proceedings of the 2021 31st Australasian Universities Power Engineering Conference (AUPEC), Perth, Australia, 26–30 September 2021; pp. 1–6. [Google Scholar] [CrossRef]
  25. Qt Creator, Version 4.11.1. Based on Qt 5.14.1 (MSVC 2017, 32 bit). The Qt Company: Espoo, Finland, 2020.
  26. DIgSILENT PowerFactory, Version 2019; DIgSILENT GmbH: Gomaringen, Germany, 2018.
  27. DIgSILENT PowerFactory 2019 Technical Reference PV System (ElmPvsys, TypPvpanel); DIgSILENT GmbH: Gomaringen, Germany, 2019; pp. 1–18. Available online: https://www.digsilent.de/en/newsreader/powerfactory-2019-release.html (accessed on 20 October 2022).
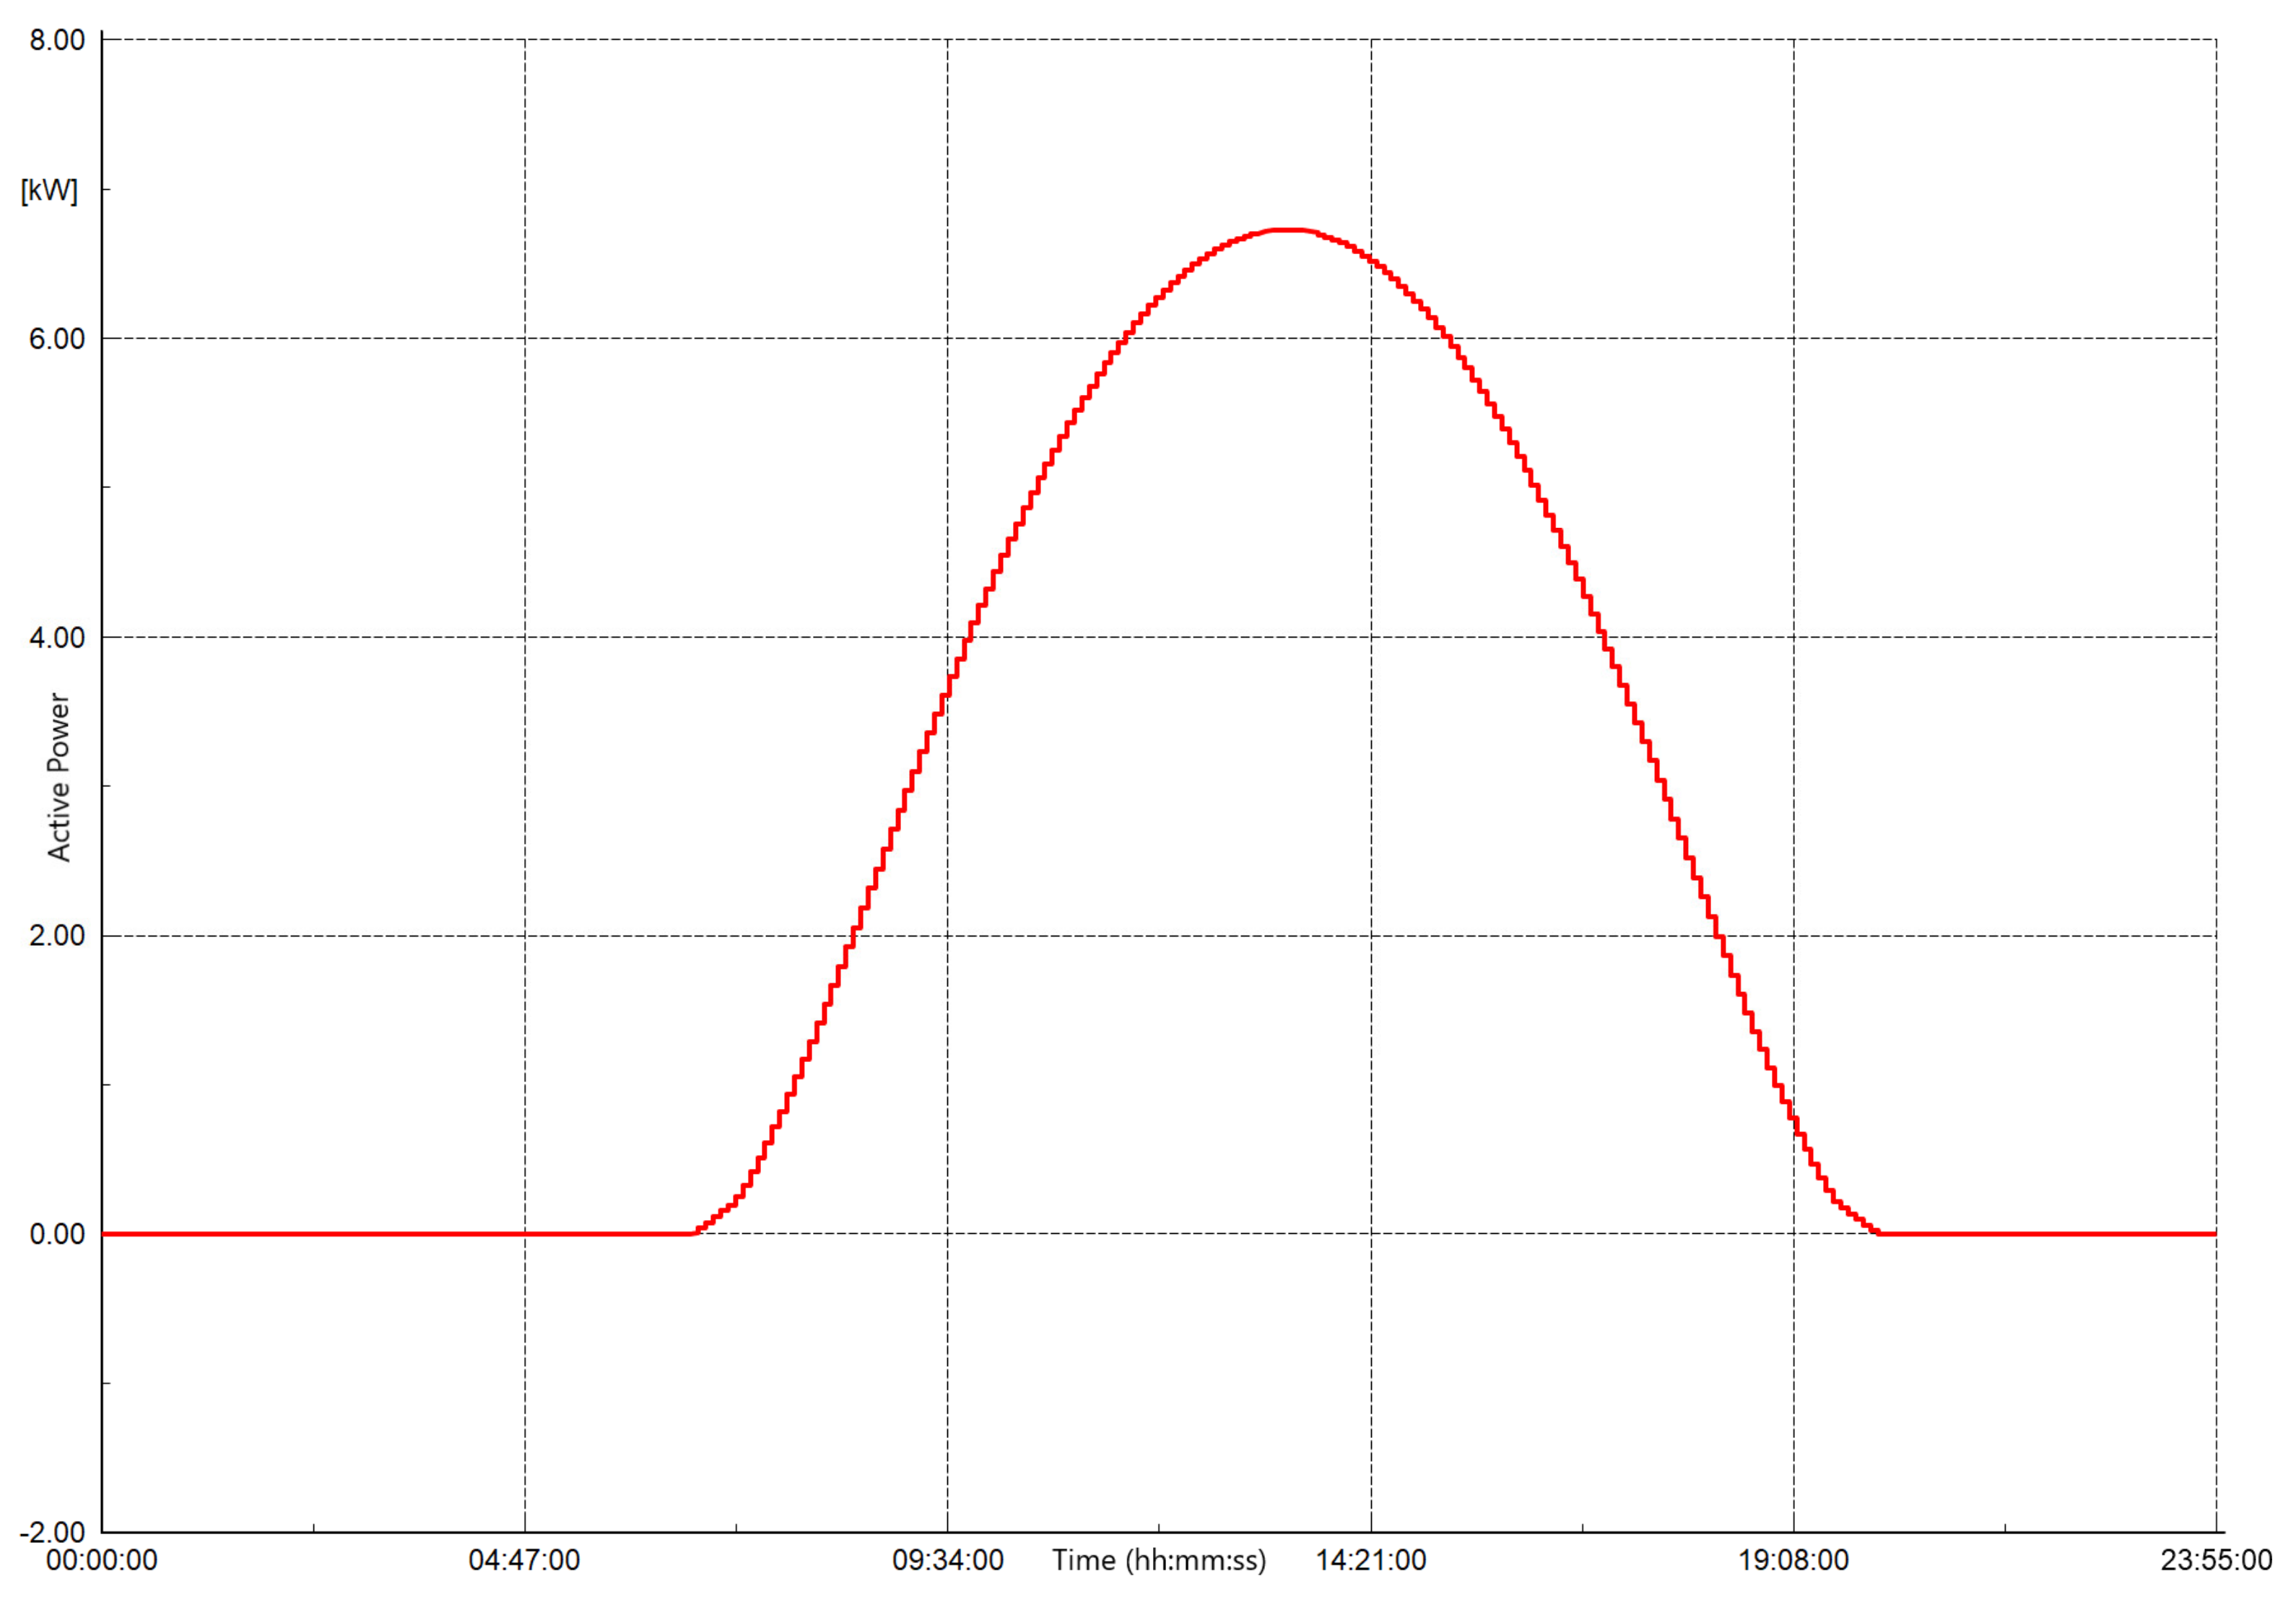
Figure 1. Active power of Aleo PV system.
Wevj 13 00218 g001
Figure 2. Structure of data collection in the V2G application.
Wevj 13 00218 g002
Figure 3. Single line diagram of Feeder 067 in DIgSILENT PowerFactory with 50% penetration of EVs.
Wevj 13 00218 g003
Figure 4. The EVs profiles in: (a) scenario 2; (b) scenario 3; (c) scenario 4; (d) scenario 5.
Wevj 13 00218 g004aWevj 13 00218 g004b
Figure 5. The load profiles of Feeder 067 in all scenarios.
Wevj 13 00218 g005
Figure 6. The comparison of infeed power in all scenarios.
Wevj 13 00218 g006
Table 1. Simulation parameter settings.
ParameterValue
P C S V 2 G 11 kW
C b E V 50, 60, and 70 kWh
P r a t e E V 11 kW
S O C m a x M o b i l e A p p 80%
S O C m i n M o b i l e A p p 30%
η1
Aleo PV panel’s peak power190 W
Number of panels in a single Aleo PV system52
Bosch PV panel’s peak power180 W
Number of panels in a single Bosch PV system56
Peak load hours for household loads17:00–24:00
Peak load hours for commercial loads9:00–13:00
a for charging at home and workplace, respectively16:00 and 7:30
b for charging at home and workplace, respectively20:00 and 9:00
T d e p u s e r , when charged at home8:00
T d e p u s e r , when charged at workplace17:00
PV peak hours11:00–16:00
Simulation period1 September 2021 00:00–3 September 2021 00:00
Step size5 min
Table 2. Active powers for Feeder 067.
ScenarioLoad, Min.
(kW)
Load, Avg.
(kW)
Load, Max.
(kW)
Infeed, Min.
(kW)
Infeed, Avg.
(kW)
Infeed, Max.
(kW)
#121.35549.42983.90819.48034.21455.682
#221.35554.598129.97419.48039.461111.233
#321.35551.934103.78921.40936.73958.671
#421.35558.865184.97419.48043.834168.373
#521.35555.510152.968−1.06440.393109.879
Table 3. Transformer loading.
ScenarioLoading, Min. (%)Loading, Avg. (%)Loading, Max. (%)
#13.5796.0909.765
#23.5796.87018.147
#33.5796.4339.962
#43.5797.54927.114
#53.5797.13617.836
Table 4. Maximum loading along Feeder 067.
ScenarioMax. Loading, Min. (%)Max. Loading, Avg. (%)Max. Loading, Max. (%)
#112.14431.56266.886
#212.14433.22466.886
#312.14431.55266.886
#412.14435.40091.998
#512.14431.55266.886
Publisher’s Note: MDPI stays neutral with regard to jurisdictional claims in published maps and institutional affiliations.