Article

Analysis of Electric Moped Scooter Sharing in Berlin: A Technical, Economic and Environmental Perspective

Chair of Methods for Product Development and Mechatronics, Technische Universität Berlin, Straße des 17. Juni 135, 10623 Berlin, Germany
*
Author to whom correspondence should be addressed.
World Electr. Veh. J. 2021, 12(3), 96; https://doi.org/10.3390/wevj12030096
Submission received: 8 June 2021 / Revised: 25 June 2021 / Accepted: 28 June 2021 / Published: 2 July 2021
(This article belongs to the Special Issue Electric Vehicles Integrated with Green Energy Sources)

Abstract

:
Electric moped scooter sharing services have recently experienced strong growth rates, particularly in Europe. Due to their compactness, environmental-friendliness and convenience, shared e-mopeds are suitable for helping to reduce the environmental impact of urban transport. However, its traffic-related, economic and environmental effects are merely represented in academic research. Therefore, this study investigates the ability of an e-moped sharing system to substitute passenger car trips, and the resulting economic and environmental effects. First, we model fleets of 2500, 10,000 and 50,000 shared e-mopeds in Berlin, based on a passenger car scenario generated by the multi-agent transport simulation framework MATSim. Afterwards, the total cost of ownership and a life cycle assessment are conducted. The results indicate that a substantial part of all passenger car trips in Berlin can be substituted. The larger the fleet, the more and longer trips are replaced. Simultaneously, the efficiency in terms of fleet utilization decreases. The scenario with 10,000 e-mopeds offers the lowest total distance-based costs for sharing operators, whereas a fleet consisting of 2500 vehicles exhibits the lowest environmental emissions per kilometer. Already with today’s grid mix, the use of shared e-mopeds results in a significant reduction in environmental impact compared to conventional and battery-electric passenger cars.

1. Introduction

The German government has committed itself under international law to reduce greenhouse gas emissions in the transport sector by 40% to 42% by 2030, compared to 1990 [1]. To date, these emissions have stagnated [2]. Recently, new mobility concepts, such as shared mobility with battery electric vehicles (BEV), have emerged, indicating an environmentally friendly solution [3,4]. In contrast to privately owned cars, which are parked on average for 95% of their lifetime [5], the means of transport in a shared fleet can be accessed by multiple individuals on a short-term and as-needed basis [6]. The resulting advantages are higher utilization rates as well as production emissions and total costs of ownership spread among the users [7,8]. One of the shared vehicles utilized are electric moped scooters (e-mopeds), which have gained popularity in urban areas lately, particularly in Europe [9,10]. An e-moped requires a small parking space, causes low particulate matter emissions by abrasion and offers sufficient velocity and battery capacity to meet the average daily demand in mobility in Germany [11].
In contrast to the many contributions on other shared forms of transport, including car, electric scooter or bike sharing [12], only a few studies have been conducted on e-moped sharing services so far [10]. Some non-academic reports have described the concept, state of implementation and regulation schemes of these sharing systems [13,14,15,16]. First market reports were conducted in 2017 and 2018 by Howe [17,18], who have continued the report at a German e-moped manufacturer to date [9,19]. Two broad-based research projects have investigated the usage behavior and environmental impact of privately owned e-mopeds. Here, the focus of Hofmann et al. [20] lays on the technology and promotion measures, whereas the Austrian Energy Agency [21] carried out the total cost of ownership (TCO) compared to conventional motor scooters. However, to the best of our knowledge, only two academic studies on e-moped sharing systems have been done: Degele et al. [22] identified and clustered customer segments using data sets of a German e-moped sharing operator. Aguilera-García et al. [10] explored the key drivers to the adoption of e-moped sharing systems in Spanish urban areas based on an online survey. Considering the preceding academic literature regarding e-moped sharing, a lack of traffic-related, economic or environmental analyses can be identified. Being a mobility phenomenon with massive recent growth in traction in urban areas all over the world, its potential impact is highly uncertain. A transport simulation seems justified to better understand different outcomes on the urban landscape. As pointed out by Aguilera-García et al. [10], urban livability would benefit from e-moped sharing in the case that it substitutes motorized private transport. The more that research data are publicly available, the better that municipalities, urban planners and entrepreneurs are able to decide the role of e-moped sharing when moving urban mobility toward sustainability.
Consequently, this study investigates the ability of an e-moped sharing system to substitute passenger car transport in Berlin by developing a respective sharing simulation. Based on the generated data, it also provides holistic environmental and economic views through a cradle-to-grave life cycle impact for the fleet and a total cost analysis for a sharing operator.

2. Methodology

The baseline data originate from a scenario of the multi-agent transport simulation framework MATSim [23]. As indicated in Figure 1, it serves as input for the sharing simulation generating the traffic data of the shared e-moped fleet. The results are then used for the TCO and life cycle assessment (LCA).

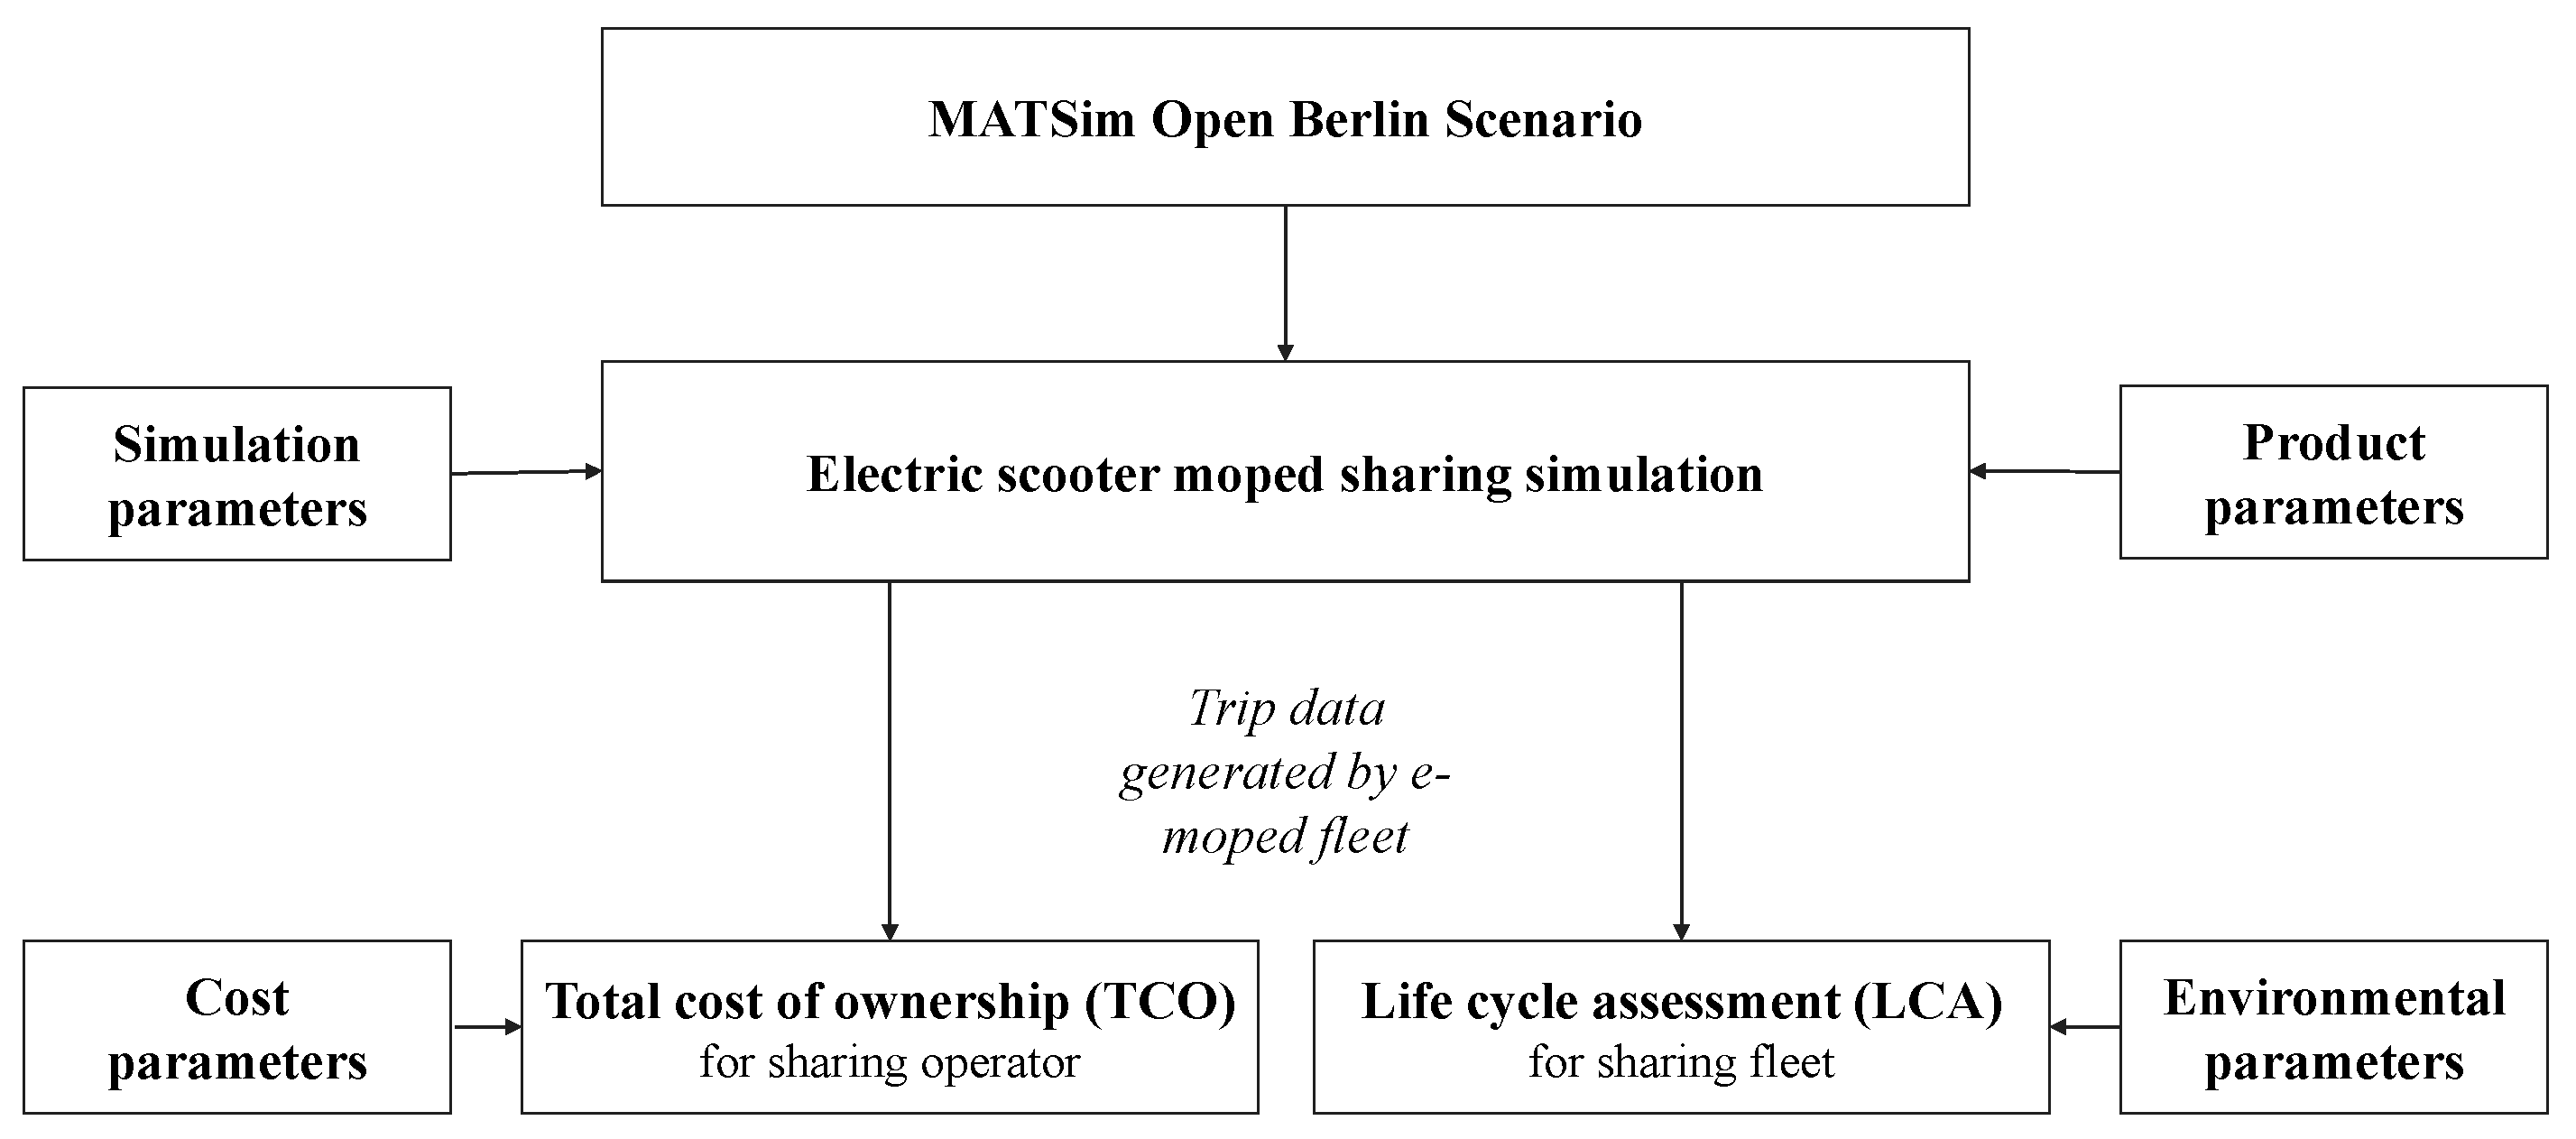
2.1. Multi-Agent Transport Simulation

The MATSim Open Berlin Scenario provides the data for the sharing simulation [24]. It is a scenario for the Berlin metropolitan area, which is generated using the agent-based transport simulation framework MATSim. As an extendable, open-source software based on OpenStreetMap and demand, resulting from open data such as traffic census data or commuter statistics, it is spatially flexible and can be used to emulate the large-scale traffic behavior of city populations. The agents, resembling inhabitants, perform quotidian professional or leisure activities according to a personal plan. To reach these activities, the agents must select a transportation mode, such as car, public transport or bicycle. At the end of the day, the agents evaluate the score associated with their activity chain, which is generally increased the higher the duration spent at an activity. The score is diminished by transport depending on, inter alia, travel time, monetary costs and deviation from real-world traffic observations. After each daily run of plans, a certain share of agents is allowed to alter their plan in order to optimize their individual score. This process is iterated until a stochastic user equilibrium is reached [23,24]. In this study, the equilibrium state of version 5.3 of the 10% sample of the Open Berlin Scenario is used.

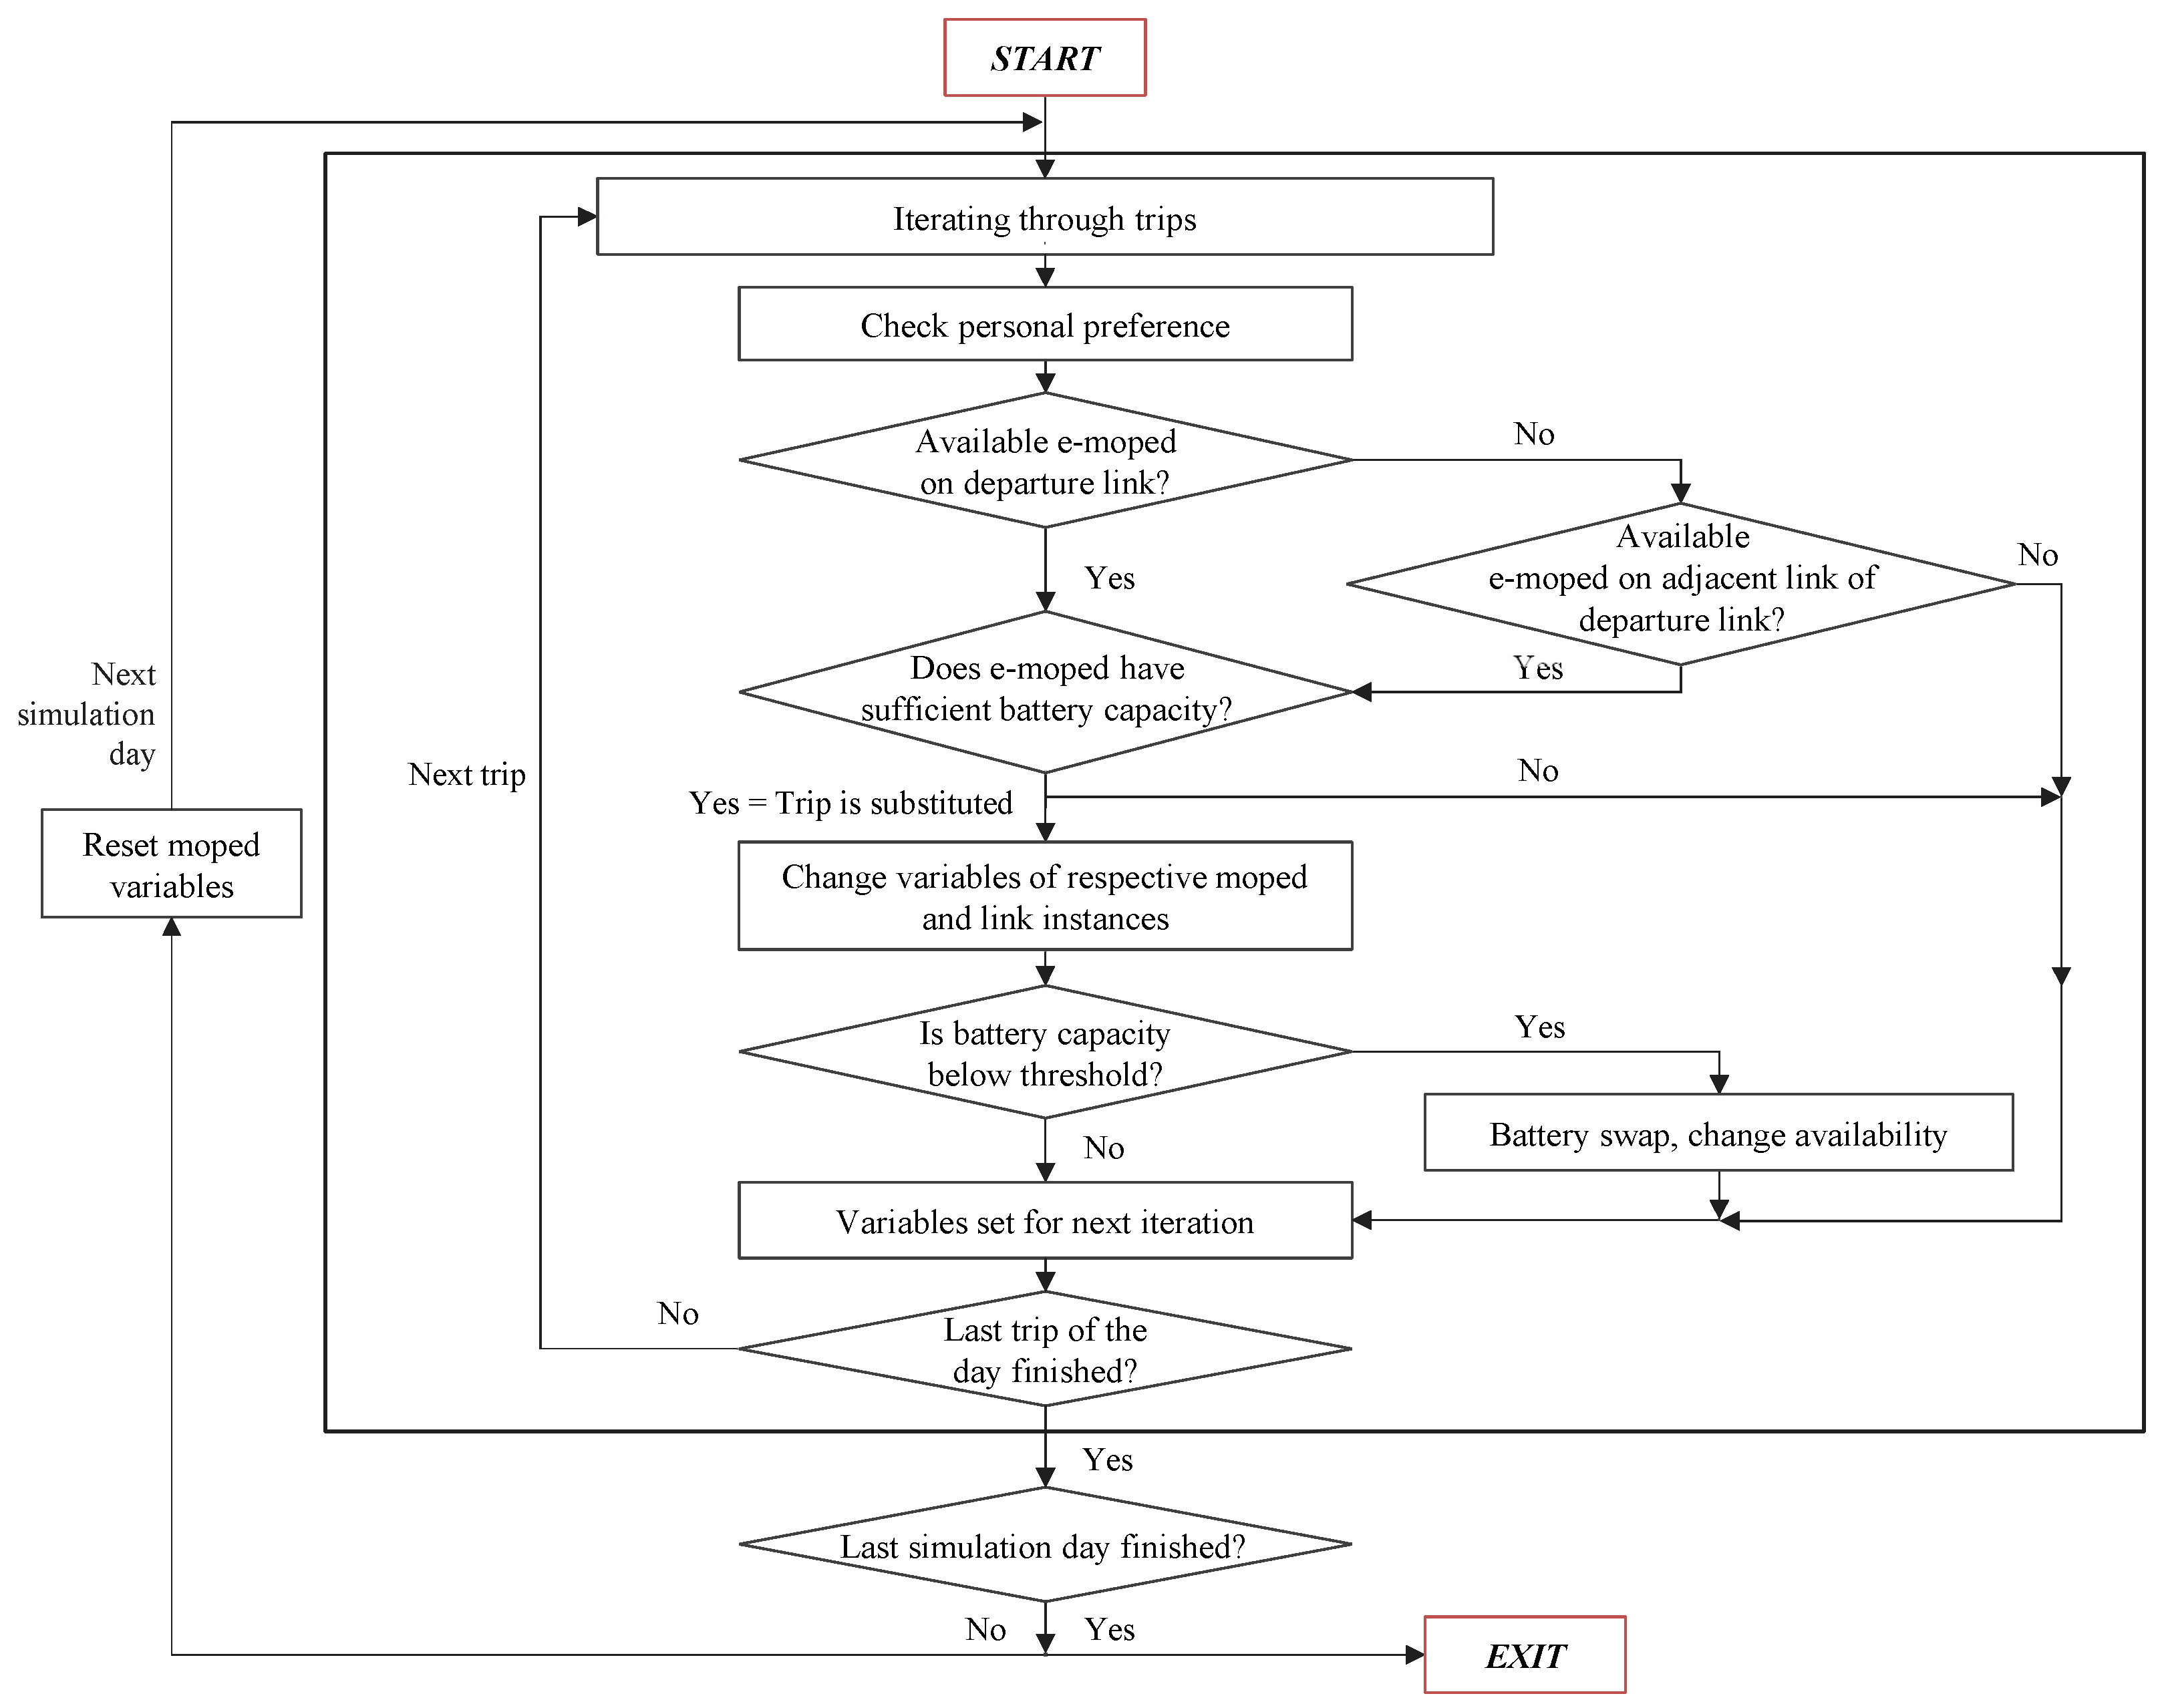
2.2. Sharing Simulation

Prior to the actual sharing simulation, the MATSim results are preprocessed and transformed into a link network and a trip plan database. In MATsim, a link resembles a street between two intersections. The link network database contains every link in Berlin and a respective list of reachable links for a selected distance. This list is used to check if an agent walks to a shared e-moped or if the distance to the vehicle’s location is considered to be too far. The trip plan consists of departures, turns and arrivals, representing all trips with departure or arrival within Berlin for the calculated day. As a last initializing step before the sharing simulation starts, the vehicles of the fleet have to be attached to their starting links. For randomization reasons, the vehicles are positioned based on the respective departure link of every third trip on that day. The decision model for the simulation is shown in Figure 2. The simulation process iterates over the trip plan consisting of chronological trips conducted on the day.
Each trip iteration contains the same steps: First, a parameter called the personal factor is checked. In general, this factor is set to 1, meaning that every iterated trip can be potentially substituted by an agent. This is explained in detail in Section 3.1. Second, the agent determines if an e-moped is available at the current link. If that is not the case, the links within the selected walking distance are checked for available mopeds. A vehicle is declared available when its arrival of a previous trip occurs before an agent checks for e-mopeds. This check precedes the actual departure time in MATSim. The time difference equals the duration that is necessary to approach and unlock/lock the e-moped. This mechanism is implemented to ensure that the agent arrives at the same time at the destination as in the original plan in which the passenger car is taken. In the next step, it is examined whether the e-moped battery capacity is sufficient for the upcoming journey, including a safety buffer. The safety buffer mirrors an agent’s concern to have slightly more battery capacity than needed for the trip. If the state of charge (SoC) of the battery is too low, the iteration for the trip is terminated here, and the next trip is analyzed. In the case that the battery capacity fulfills the trip requirements, the trip is successfully substituted, and variables, such as the e-moped time of availability, the SoC or current link, are updated accordingly. After each successful e-moped trip, the algorithm checks whether the battery capacity has fallen below a certain threshold, which signals that the battery must be swapped. In the case that the defined threshold is undercut, the e-moped is not available for trips for the duration that is set for the battery swapping procedure. After the battery swapping duration, the e-moped is declared available again. This process is repeated for every trip within 24 h of a simulation day. After the last trip has been analyzed, e-mopeds that were not used during the day are repositioned individually on links, according to the ranking of the demand heatmap. This heatmap lists all links with the highest total daily demand of trips in descending order. To offset potential outliers and create more realistic trip substitutions, the daily activities are reiterated and averaged over 250 consecutive days. The resulting trip information is then scaled to 100 percent to resemble all transport activities on an average weekday.

2.3. Total Cost of Ownership

To evaluate the economic impact for an e-moped sharing operator, a life cycle cost analysis in the form of total cost of ownership (TCO) is conducted, according to the approach in [25]. The cost components and their values are based on literature research, real sharing operator data and well-founded calculations, while the trip data used for the TCO are generated by the sharing simulation.

2.4. Life Cycle Assessment

For the assessment of the environmental footprint of an e-moped sharing system, a cradle-to-grave life cycle assessment (LCA) based on the generated traffic data from the simulation [26] is conducted. This type of LCA examines the impact on the environment of products and services, including resource extraction, production, use phase and disposal. The objective of the LCA in this study is to determine the environmental emissions directly caused by the e-moped fleet over the expected lifetime of a shared e-moped. Indirect emissions, for example, caused by warehouse activities or vehicles used for battery swapping are not integrated. For the reason of comparability, the functional unit is set to one kilometer driven by the fleet. We used ecoinvent 3.6. Cutoff Unit as the database [27,28]. The vehicle-specific parameters and the life cycle inventory data used for the LCA will be described in Section 3. According to Clémence Siret et al. [29], the impact categories global warming potential (GWP) and cumulative energy demand (CED) are the two most significant ones for electric vehicle batteries, contributing 32% and 26% of the total environmental impact [29]. For Temporelli et al. [30], the most used impact categories are the GWP, acidification potential (AP), eutrophication potential (EP) and the particulate matter formation potential (PMFP) [30]. Since the battery plays a crucial role for the LCA of BEV [30], the lifetime GWP, AP, EP, PMFP and CED are investigated. The impact assessment method for the CED is ‘Cumulative Energy Demand (LHV)’. The ‘ReCiPe 2016 Midpoint (H)’ is chosen for the calculation of the other mentioned impact factors [31]. In this method, the freshwater/marine EP and terrestrial AP are considered. The values of other impact indicators in this assessment method, such as photochemical ozone creation or stratospheric ozone depletion, are also determined but not discussed in this study. The details can be found in Tables S1–S4 in the Supplementary Materials and thus can be utilized in other use cases.

3. Case Study

In this section, the rationale for the substitution of passenger car traffic with an e-moped sharing system and its economic and environmental assessment are illustrated. Figure 3 presents the sensitivity analysis and the additional scenarios.

3.1. Sharing Simulation

To investigate the impact of the fleet size, three main scenarios with different numbers of shared e-mopeds are constructed. The base scenario with 2500 vehicles represents the approximate number of shared e-mopeds in Berlin at the end of 2019, according to Bath [32]. To map medium- and long-term plans and strategies in Berlin toward more sustainable urban development, a medium and maximum expansion scenario with 10,000 and 50,000 vehicles are considered [33,34].
The results from the MATSim Open Berlin Scenario originally comprise 36 h of an average weekday, starting at midnight. Weather conditions are not represented. To represent one day, it is cut to 24 h. Therefore, all activities by agents who conduct at least one transport activity after midnight are removed. The ratio of these trips compared to all trips considered in the scenarios is negligible with less than 0.3%. To serve as input for the TCO and the LCA, the traffic data generated by the respective fleet sizes must be transformed from a single weekday to annual data. The transformation is defined by integrating three factors. The first factor represents the weekend traffic, which amounts to 81.94% of the weekday traffic [35]. Furthermore, it is assumed that no e-moped rides are taken during rainy hours. The proportion of non-rainy hours is calculated to be 87.08% of all hours in Berlin, based on weather data of the last four years from Deutscher Wetterdienst measured at the meteorological station at Berlin-Alexanderplatz [36]. The third factor is calculated on the expected economic life of a shared e-moped. For privately used e-mopeds, this value is set to seven years, according to the German Federal Ministry of Finance [37]. However, due to the high utilization of vehicles in the simulation, shared e-mopeds face higher stress. Following real-world experiences by Govecs and sharing operators, the battery life is the crucial factor for the e-moped lifetime. For high-quality batteries without deep discharging, it is either determined by the number of charge cycles (1500 cycles) or the aging process of its chemical substance (five years) [38].
For all main and the additional scenarios, it is thus determined to be five years. We assume in this study that other e-moped components will be repaired or replaced with parts from decayed mopeds in the case of malfunction. Whereas the simulation model is calculated with the constant value of 2500, 10,000, or 50,000 e-mopeds (active fleet), the actual fleet considered in the TCO and LCA differs by two parts. The first part resembles the number of e-mopeds that are not fully operational at any given point time because they are in repair, without a helmet, or out of the business area. This operational fleet factor is set to be 14.5% p.a. of the total fleet. The second share includes the broken, vandalized, or stolen mopeds, which is represented by the decay rate which is 0.25% per month of the total initially purchased fleet size. To maintain a constant fleet size, these vehicles are replaced immediately in the case of decay. Both factors stem from the experiences of a German e-moped sharing operator. The resulting number of vehicles used for the TCO and LCA are displayed in Table 1.
Regarding the electric energy used for charging the e-mopeds over these five years, the German electricity mix of the year 2019 is applied. Due to various laws and decisions, such as the nuclear power plant or coal phase-out, more renewable energies will be used in the coming years [39]. To reflect this influence on the environmental balance, LCAs of all main scenarios based on a power grid mix consisting exclusively of renewable energies are carried out. As Figure 3 indicates, three additional cases are investigated for the main scenarios. In the first additional scenario, a simulation with a fleet size of 500 vehicles is analyzed to mirror a stricter e-moped sharing regulation scheme in Berlin and/or a lack of user interest in this kind of service. Cases two and three exhibit the same fleet size as the base scenario, but investigate two different parameters. For additional scenario two, a personal factor is integrated. This factor aims to reflect the personal preference of the agents toward using this type of sharing system, due to various reasons, such as security concerns, lack of comfort or spatial requirements, or a financial unwillingness to pay for such services. The value is set to 1/3, which means that every third trip of all trips suitable for e-mopeds can be potentially substituted by an agent. The third case explores the traffic effects of a service operator who assigns low priority to the availability of the e-mopeds. This is reflected by a longer battery swapping duration, which is set to eight hours in comparison to 60 min, based on the scenario with 2500 vehicles.
The chosen e-moped model is the Govecs Flex, which is designed for sharing purposes and deployed by several e-moped sharing operators in Europe [40]. It is powered by a 2 kW nominal power hub motor, drives up to 45 km/h, and thus requires an associated driver’s license [41]. Although the vehicle has two seats, each trip in this simulation represents one person because trips in MATSim are conducted by single agents. The vehicle contains two swappable lithium-ion batteries with a total capacity of 3.4 kWh. Taking a 10% capacity fade over its full lifetime into consideration and a consumption of 3.4 kWh/100 km, the range is presumed to be 90 km per battery set [40,42]. One battery set consists of two batteries. The selected battery swap threshold amounts to 15% to avoid deep discharging. Since the average e-moped trip distance in this case study is between 3.6 and 4.1 km (see Section 4), the SoC of the battery mostly stays between 10% to 90% after the initial two to three trips after charging. During this range, the charging curve can be seen as almost linear, according to Dearborn [43]. Hence, we consider linear battery discharging. Furthermore, the safety buffer is set to 20%. As mentioned in the sharing simulation part of Section 2, this means that a trip length of 10 km needs a battery capacity of 12 km. Since the examined e-moped model is prohibited to be driven on specific road types in Germany, such as highways and trunk roads, trips including these road types or with a speed limit higher than 50 km/h are excluded [41]. To cover the Berlin metropolitan area, only transport activities with departure and arrival located in Berlin are considered. The maximum walking distance for agents to a shared e-moped is chosen as 500 m, based on an e-moped sharing user survey [10]. MATSim does not offer exact locations on a specific street, so it is assumed that the agent is standing halfway down the link when calculating the distance from an agent to a shared e-moped. This leads to the elimination of links with a length above 1 km, which is less than 0.1% of all links considered. Furthermore, of all trips done by private passenger cars within the Berlin metropolitan area, only those with a length between 1.5 and 30 km are considered. The minimum distance of 1.5 km is chosen based on our own calculations: At distances starting from this value, shared e-moped trips provide a lower travel duration in comparison to walking. The selected maximum distance is derived from the majority of trip distances of a small-scale study regarding privately-owned e-mopeds [20]. The above-mentioned modifications displayed in Table 2 lead to a decrease in the daily number of passenger car trips, which can be theoretically substituted by the e-moped sharing system, from 2,874,220 to 1,013,930.

3.2. Total Cost of Ownership

Here, a TCO of the costs incurred within the expected lifespan of a shared e-moped is conducted for each of the main scenarios. To enable comparability, the costs are represented per kilometer driven by the fleet on average. The most relevant assumptions are displayed in the following. The purchase price of all capital assets is offset as a loss in value or depreciation, according to the straight-line method over their respective economic life. The annual inflation rate is set to 1.71% as based on the average inflation rate in Germany from 1992 to 2019 [44]. To approximate the present value for recurring costs, a discount rate of 3.5% p.a. is applied, according to [45]. In this calculation, no costs of capital are considered. Besides the server facilities and the driver’s license verification process, which are outsourced, every service is done in-house, such as software development or vehicle maintenance. Every asset is purchased. The core workforce is permanently employed and for a fleet size of 2500 vehicles, it consists of a team of 15 employees, resembling the average number of a German mobility startup in 2020 [46]. Additionally, there are personnel that are highly dependent on the fleet size, such as the battery swappers, customer service representatives, mechanics and cleaning personnel. The resulting total company size varies from 82 (for 2500 vehicles) to 817 employees (50,000). For detailed information on the personnel and their wages, see Tables S6 and S7 in the Supplementary Materials.
To reduce complexity, the whole setup, including the fleet and mobile app, is operational from day one of the market launch (no ramp-up). When the SoC of a vehicle battery passes the threshold of 15% in the simulation, the battery is swapped within 60 min by battery swapping personnel who work three shifts per day. The batteries are swapped by 70% electric light commercial panel vans and 30% electric cargo bikes. The number of vans and cargo bikes, their electricity consumption and the personnel related to the battery swapping are considered as calculated in Tables S7–S9 in the Supplementary Materials. To ensure enough batteries for swapping are provided, 50% additional battery sets must be bought. This number is based on the number of empty battery sets during peak shifts. The price charged for the electricity consumption is 0.1844 EUR/kWh to resemble the electricity price for industrial customers in 2019 [47]. Furthermore, it should be noted that no costs for the disposal at the end of life (EoL) and no salvage value at the end of an e-moped’s lifetime are included. The components of the TCO can be divided into initial and recurring expenses. Table 3 and Table 4 present the cost distribution of the relevant capital and operating cost components associated with the three main scenarios. For the capital costs, all scenarios exhibit the purchase of the e-moped (including telematics and delivery) as the most expensive cost component, amounting to more than 71%, followed by the costs for additional batteries, accounting for about 14.8 to 16.3% depending on the fleet size (Table 3).
Besides the purchase of the e-van for the battery swapping, two other significant capital cost components are marketing and driver’s license verification. The latter are costs for checking the users’ licenses for validity. Both components are directly dependent on the user base. The total user base is calculated by dividing the total monthly rides by the monthly rides per active user ratio, which is derived from the real-world experiences of an e-moped sharing operator. It is also assumed by the sharing operator that the actual total user base is double the number of active users. The above-mentioned values for the main scenarios are presented in Table 5. For the marketing costs, the total user base is multiplied by the average user acquisition costs for creating an account [48]. In this case study, the user base is considered to be at its maximum level directly at market launch. Hence, the costs related to the user base are attributed to the capital costs.
Regarding the recurring expenses, the costs related to personnel constitute the majority of the total operating costs, contributing from 68.3% for a fleet with 2500 vehicles over 59.8% (5000 vehicles) to 52.4% (50,000 vehicles) as can be seen in Table 4. The following most essential expenses are costs related to electric consumption, maintenance and connectivity, which are at about the same cost level of 7.3% to 8.0% for the base scenario. The connectivity fee is imposed per vehicle by the e-moped manufacturer for the permanent connection of the vehicle with the fleet management software [40]. Except for the marketing costs, the share of the capital cost components does not differ as much throughout the scenarios as compared to the operating cost items. According to Table 4, the costs related to maintenance, connectivity and insurance grow on a linear gradient with an increasing number of vehicles deployed. On the other side, components such as energy costs or e-moped decay are dependent on the utilization rate (UR), which indicates the daily trips per e-moped. These decrease the larger that the fleet size becomes (see Section 4). Due to their cost structure, the personnel costs and rent of the office and warehouse do not increase at the same speed as the fleet size.

3.3. Life Cycle Assessment

This study performs an LCA of the shared e-moped system, depending on the fleet size and the electricity mix. To ensure an up-to-date analysis and meeting the current characteristics of the e-moped or energy production, several processes are modified or added manually, founded upon academic research studies. The existing ecoinvent process “electric scooter production, without battery” by Del Duce et al. [49] is used. The respective weight ratio is adjusted to match the characteristics of Govecs Flex. Since the investigated model is charged via the off-board charger, the onboard charger is removed and the process “charger production, for electric scooter” is included and aligned. The process “market for transport, freight train” is added to cover the transport of the e-moped and charger by freight train from the production facility in Wroclaw (Poland) to the e-moped operator in Berlin. The battery is realized with the process “battery production, Li-ion, rechargeable, prismatic” and its subprocesses, which include the battery pack, module, and cells as well as the battery management system and cables. This process is premised on a lithium-ion battery with a cathode made of lithium manganese oxide (LiMn2O4) by Notter et al. [50], which deviates from the lithium nickel manganese cobalt oxide (NMC) batteries as confirmed by the manufacturer. Due to the lack of public scientific data for this battery, the life cycle inventory for the cathode materials, according to Zhao and You [51], is used. Its input to make one kilogram of the cathode material is displayed in Table 6.
The components of the NMC battery pack are scaled to match the Govecs battery capacity of 3.4 kWh, based on Dai et al. [52]. On account of the upscaling process, the weight of the battery pack increases from 18.8 kg to 23.9 kg, resulting in an overall increase in e-moped weight of 4.75%. This change is considered in all processes, except in the electric consumption or design of the vehicle. For the use phase, significant emitters are the electricity consumption, maintenance and different wear emissions. The used ecoinvent processes “treatment of tire wear emissions”, “treatment of road wear emissions” and “treatment of brake wear emissions” were created for a passenger car. Since the weight is the crucial factor for these types of emissions, given the same driving and material characteristics, the original data are changed to the e-moped weight plus the weight of an average person in Germany [53,54,55]. Regarding the fleet’s battery charging, the German power grid mix of the year 2019 is used. The associated ecoinvent processes for electricity production in 2014 at low, medium and high voltage levels, as well as other emissions caused by transformation, are altered based on the gross electricity generation and power trading in Germany in 2019 [56,57]. According to Icha and Kuhs [58], it is assumed that the exported power consists of the same electricity mix as the gross electricity generation. The original ratios related to the transformation to the low voltage level and transmission losses as well as the ratio for the electricity production within the sector of hydropower, photovoltaics and onshore wind are maintained. The resulting electricity mix is presented in Table 7.
For the electricity mix consisting fully of renewable energies, the electricity mix of 2019 is adapted to match the technical–environmental potential for renewable energies, forecasted by the German Federal Environment Agency [39]. In this calculation, neither power imports nor exports are considered. The data are displayed in Table 8.
For reasons of simplicity, we assume that all vehicles of the fleet are disposed of when they pass their expected lifetime, and for the battery, we assume recycling. The shredding of the glider is depicted in the ecoinvent process “treatment of used glider, electric scooter, shredding”. The “treatment of used powertrain for electric scooter, manual dismantling” contains the dismantling and treatment in the scrap recycling facility. The battery undergoes hydrometallurgical and pyrometallurgical treatment in equal parts, according to the processes “treatment of used Li-ion battery, pyrometallurgical treatment” and “treatment of used Li-ion battery, hydrometallurgical treatment”.

4. Results

The following section displays the results of the sharing simulation, the TCO and the LCA. First, the trip data generated in the e-moped sharing simulation (Table 9, Table 10, Table 11 and Table 12) and the TCO (Figure 4, Figure 5, Figure 6 and Figure 7) of the main and the additional scenarios are presented. Subsequently, the LCA of the main scenarios are shown (Figure 8, Figure 9, Figure 10, Figure 11 and Figure 12).

4.1. Traffic Data

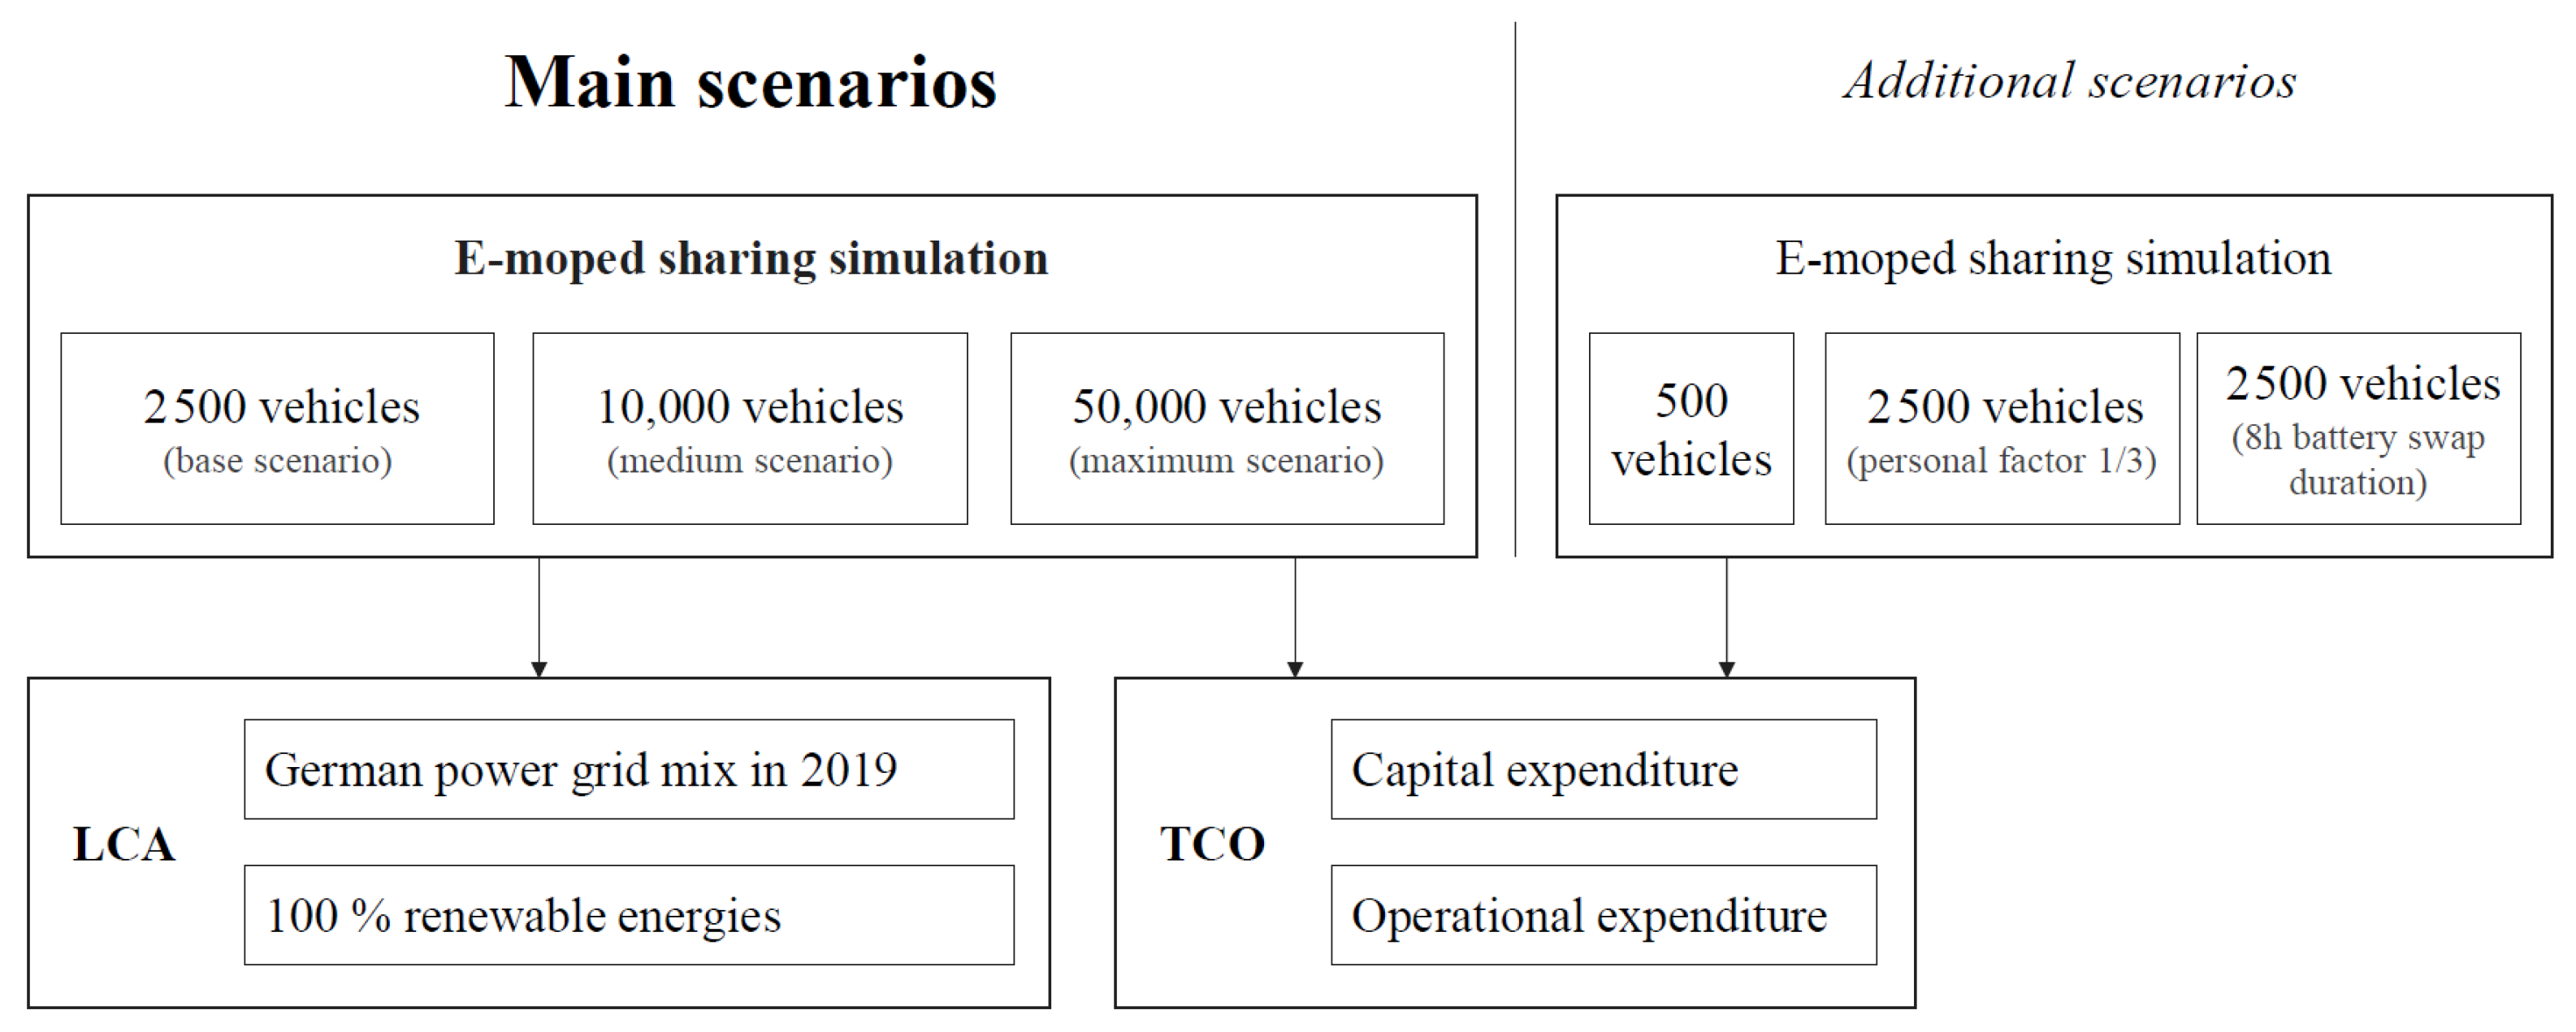
4.1.1. Main Scenarios

In Table 9, the averaged trip information on a weekday with no rain for the fleet sizes of 2500, 10,000 and 50,000 mopeds are compared. With 2500 vehicles deployed, 55,951 trips are conducted in Berlin in 24 h, and 2547 battery sets are swapped. The data point out that the larger the fleet size, the more total trips are conducted. A total of 1.95% of all passenger car trips in Berlin on that day can be replaced by the fleet of the base scenario. This percentage grows to 23.33% for the maximum scenario. At the same time, the distribution of direct and adjacent trips changes. When more mopeds are deployed, the ratio of direct trips based on all trips conducted increases from 25.0% to 33.0%, comparing the base to the maximum scenario. Table 9 also exhibits that a smaller ratio of mopeds must undergo daily battery swapping when the fleet size is increasing. This value decreases from 101.9% (2500 vehicles) over 96.0% (10,000) to 69.8% (50,000). At the same time, the utilization rate (UR) cuts down from 22.38 over 20.48 to 13.41. Simultaneously, the parameter representing the e-mopeds that were not used by agents that day grows from 1.8% over 2.5% to 5.0% based on the total fleet size.
The underlying lifetime trip data of the main scenarios for the TCO and LCA are displayed in Table 10. Due to weekend traffic and weather conditions, the UR is lower than shown in the daily sharing simulation results. It decreases from 18.48 for the base scenario, over 16.91 for the medium scenario to 11.08 for the maximum scenario. The total lifetime mileage per vehicle decreases by 31.2% from 89,846 km (2500 vehicles) to 61,826 (50,000 vehicles). The electric consumption per e-moped drops by the same rate from 3053 kWh to 2102 kWh.

4.1.2. Additional Scenarios

Table 11 indicates the results of the sharing simulation for the additional scenarios. In the scenario with 500 active vehicles, 10,934 e-moped trips are done, which represent 0.38% of all daily passenger car trips in Berlin. Several such values, including the total trips, the number of battery set swaps or the daily inactive mopeds, are approximately five times smaller, compared to the base scenario with five times more vehicles. Here, the average trip distance with 3.52 km/trip and the UR with 21.87 are slightly lower than the base scenario. The other two scenarios of sensitivity have the same fleet size as the base scenario. For the personal factor scenario, three iterating sequences can be distinguished, depending on the starting position of the substituted trip: the first, the second and the third trip. Thus, the average of the results of the three sequences are displayed in Table 11. It shows 25,229 total e-moped trips on that day with a UR of 10.09, which both are 54.9% lower than the base scenario. The average trip distance per trip is 4.11 km and the number of daily inactive vehicles is 139. The 8 h battery swap reveals 44,963 total trips by the sharing system, which is 21.3% lower than the original 2500 vehicle scenario. While the average trip distance per e-moped trip is 3.51 km is about the same level, the UR is 19.6% lower.
For the additional scenarios, the lifetime trip data can be found in Table 12. The UR, total lifetime mileage and electric consumption per e-moped are the highest for the 500 vehicle scenario followed by the 2500 vehicle scenario with 8 h battery swap duration and the personal factor scenario. Here, the UR decreases from 18.06 over 14.85 to 8.33. While each vehicle in the 500 vehicle scenario drives 85,939 km in a lifetime on average, this value goes down by about 46.0% to 46,383 km for the personal factor scenario. The electric consumption per e-moped drops by the same rate from 2922 kWh to 1577 kWh.

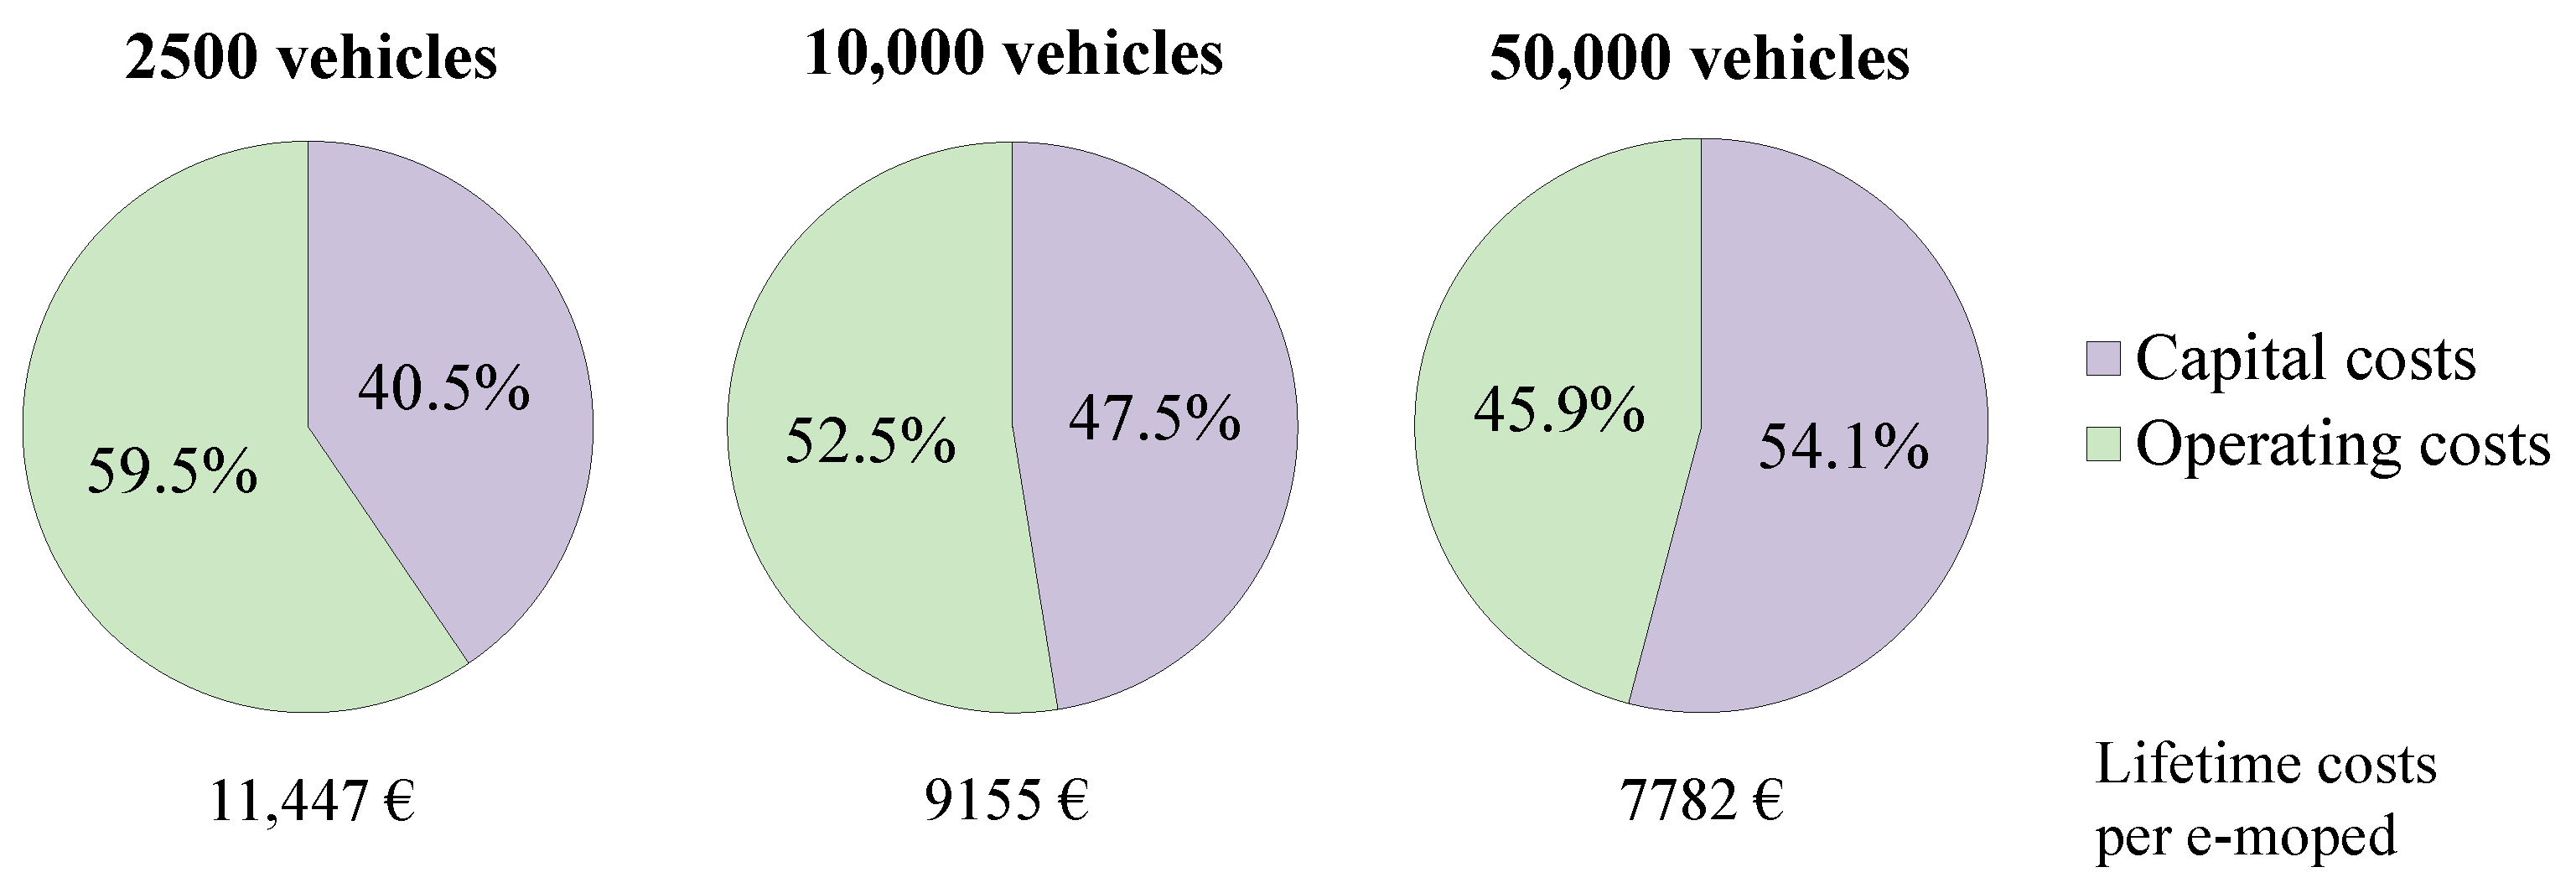
4.2. Total Cost of Ownership

4.2.1. Main Scenarios

Figure 4 exhibits the share of the lifetime capital and operative costs for the e-moped fleets of the main scenarios. As discussed in the TCO part of Section 3, it highlights that the bigger the fleet size, the higher the share of capital costs based on the total costs. Here, the capital cost shares rise from 40.5% (base scenario) over 47.5% (medium scenario) to 54.1% (maximum scenario). Breaking down the total lifetime costs on the actual number of e-mopeds used in the fleet, the biggest fleet size offers the lowest value with EUR 7782, compared to EUR 9155 for 10,000 vehicles and EUR 11,447 for 2500 vehicles (Figure 4).
Figure 5 illustrates the distance-based total costs for the sharing operator for the three main scenarios based on the respective expected e-moped lifetimes. The chart highlights that the fleets with the least and most vehicles exhibit the most expensive costs per kilometer with 0.127 EUR/km and 0.126 EUR/km. The medium scenario shows the best cost per distance ratio with 0.108 EUR/km.

4.2.2. Additional Scenarios

Figure 6 exhibits the share of the lifetime capital and operative costs for the e-moped fleets of the additional scenarios. In the 500 vehicle scenario, 26.3% of the lifetime costs per e-moped are related to the one-time expenses of the capital costs. This is lower than in the other two scenarios. The share of the operating costs are 56.3% in scenario with 8 h battery swap duration and 53.7% in the base scenario with personal. Regarding the lifetime costs per e-moped, the scenario with the smallest fleet size offers the highest value with EUR 18,901, compared to EUR 9890 for the personal factor scenario and EUR 10,525 for the 8 h battery swap scenario.
Figure 7 displays the distance-based total costs for the sharing operator for the three additional scenarios based on the respective expected e-moped lifetimes. The diagram exhibits that both the fleets with 500 vehicles and the personal factor scenario offer the highest costs per kilometer with 0.220 EUR/km and 0.213 EUR/km. The base scenario with 8 h battery swap duration shows costs per distance of 0.149 EUR/km.

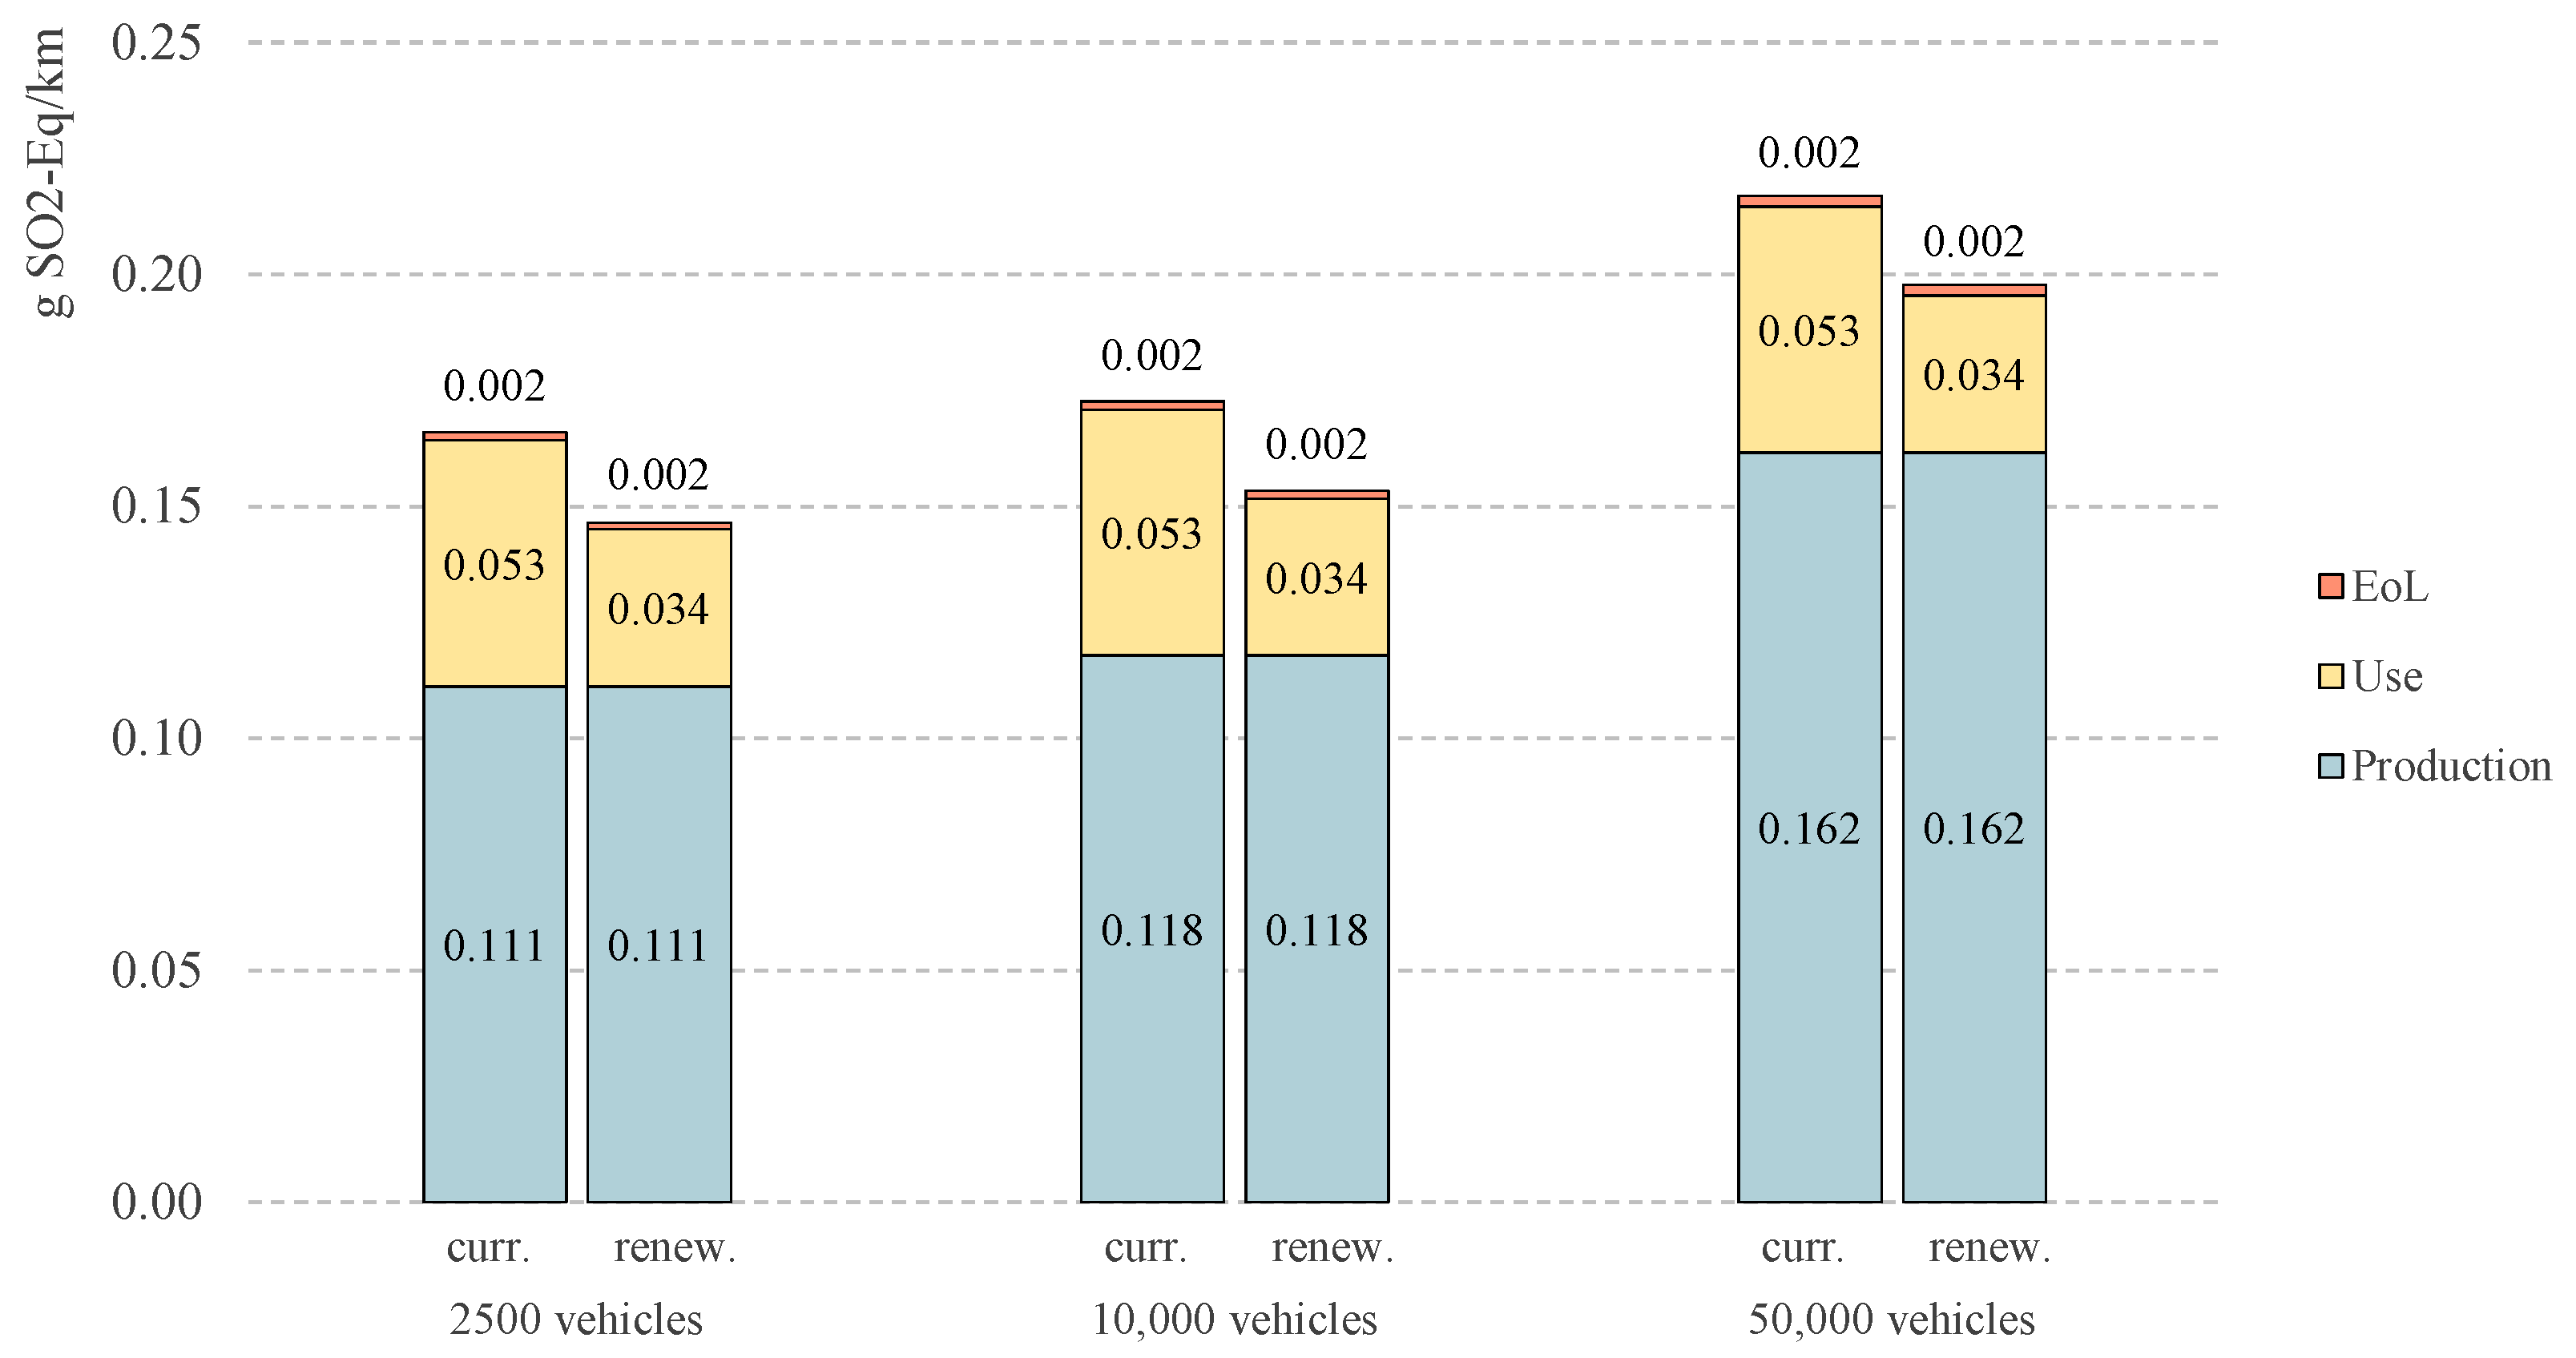
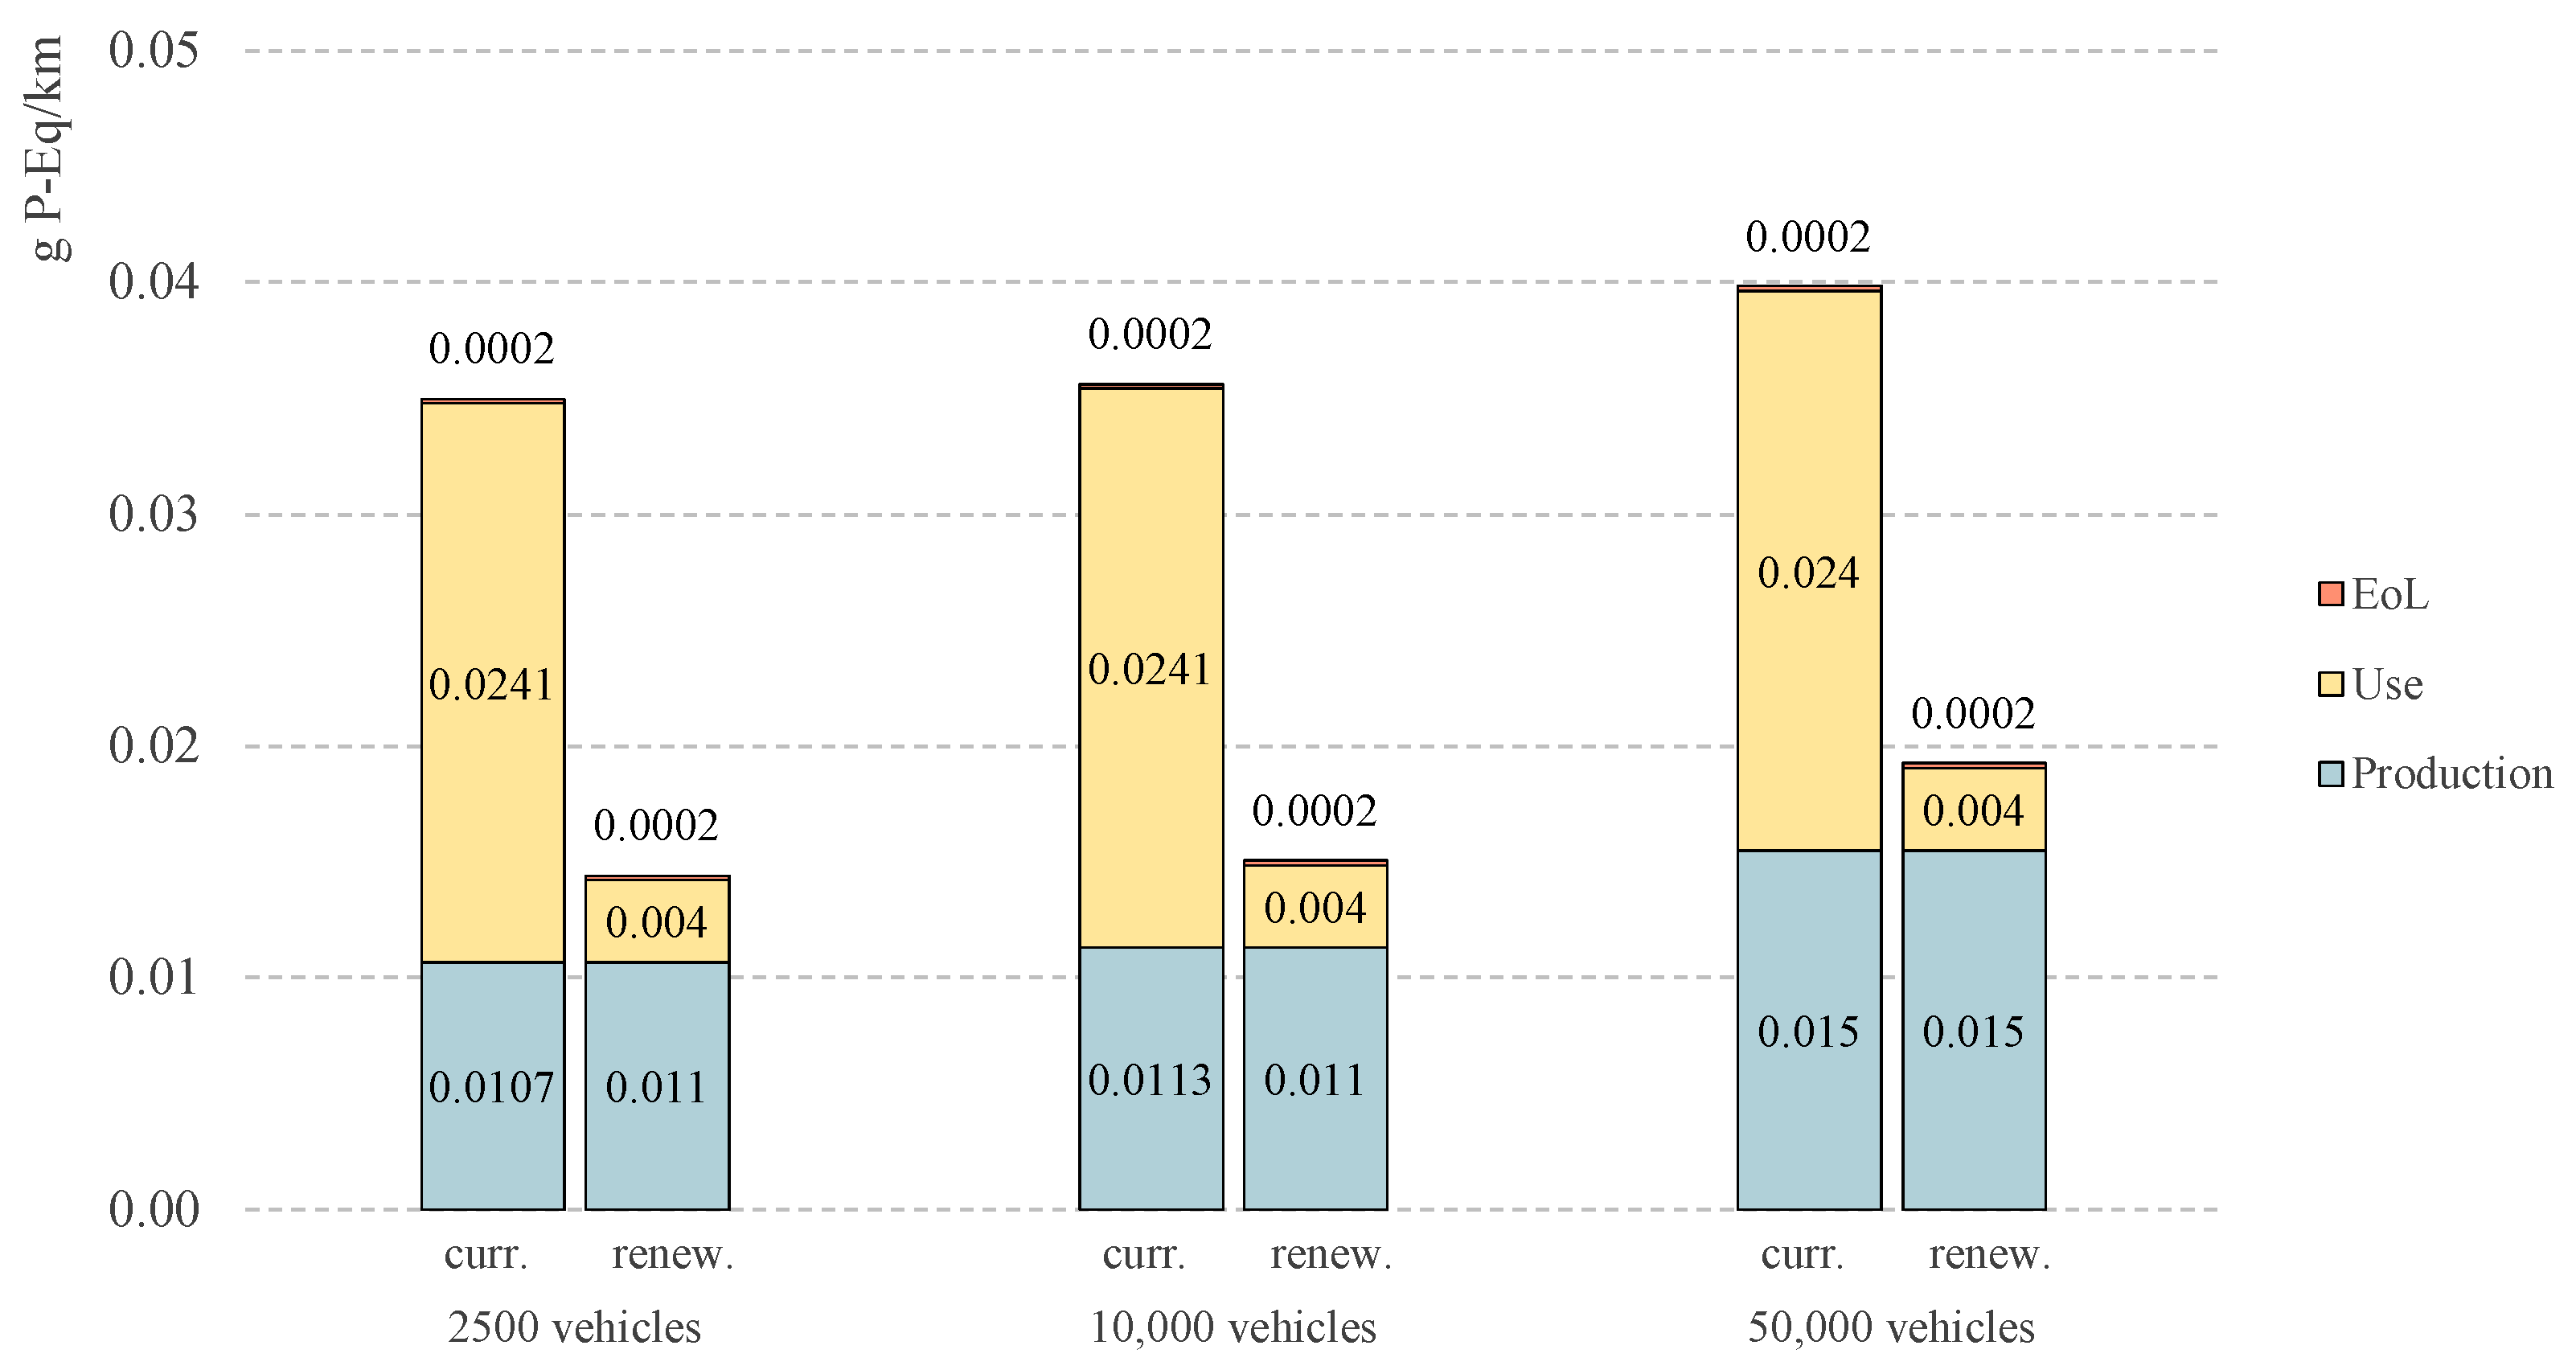
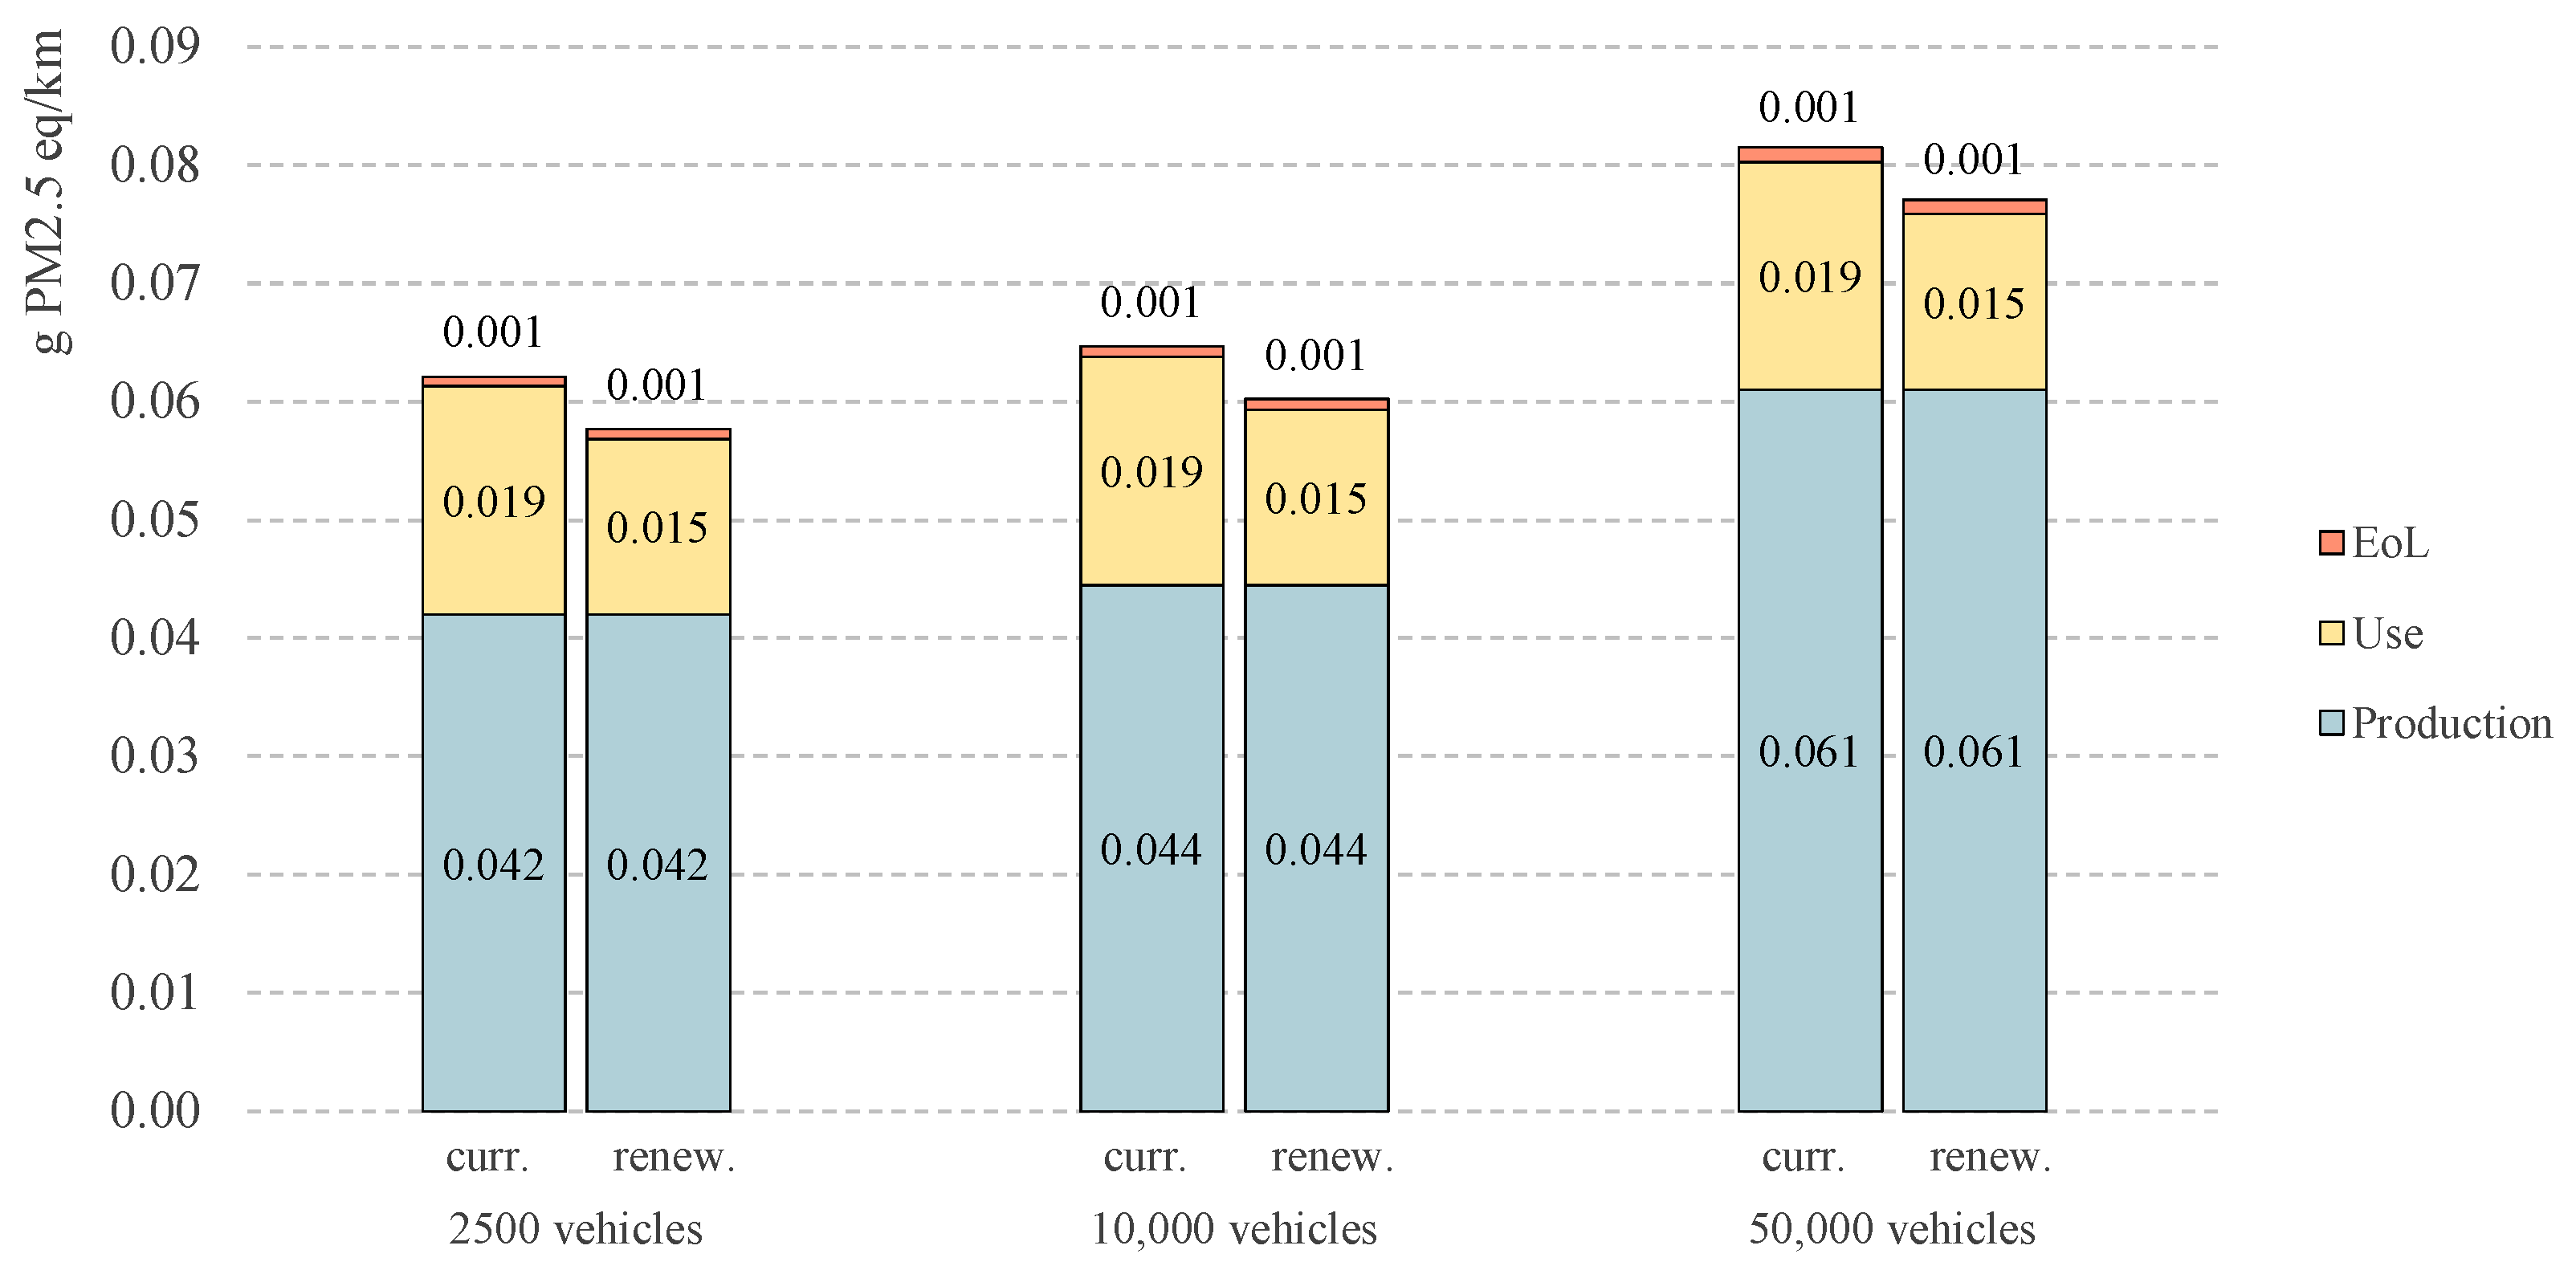
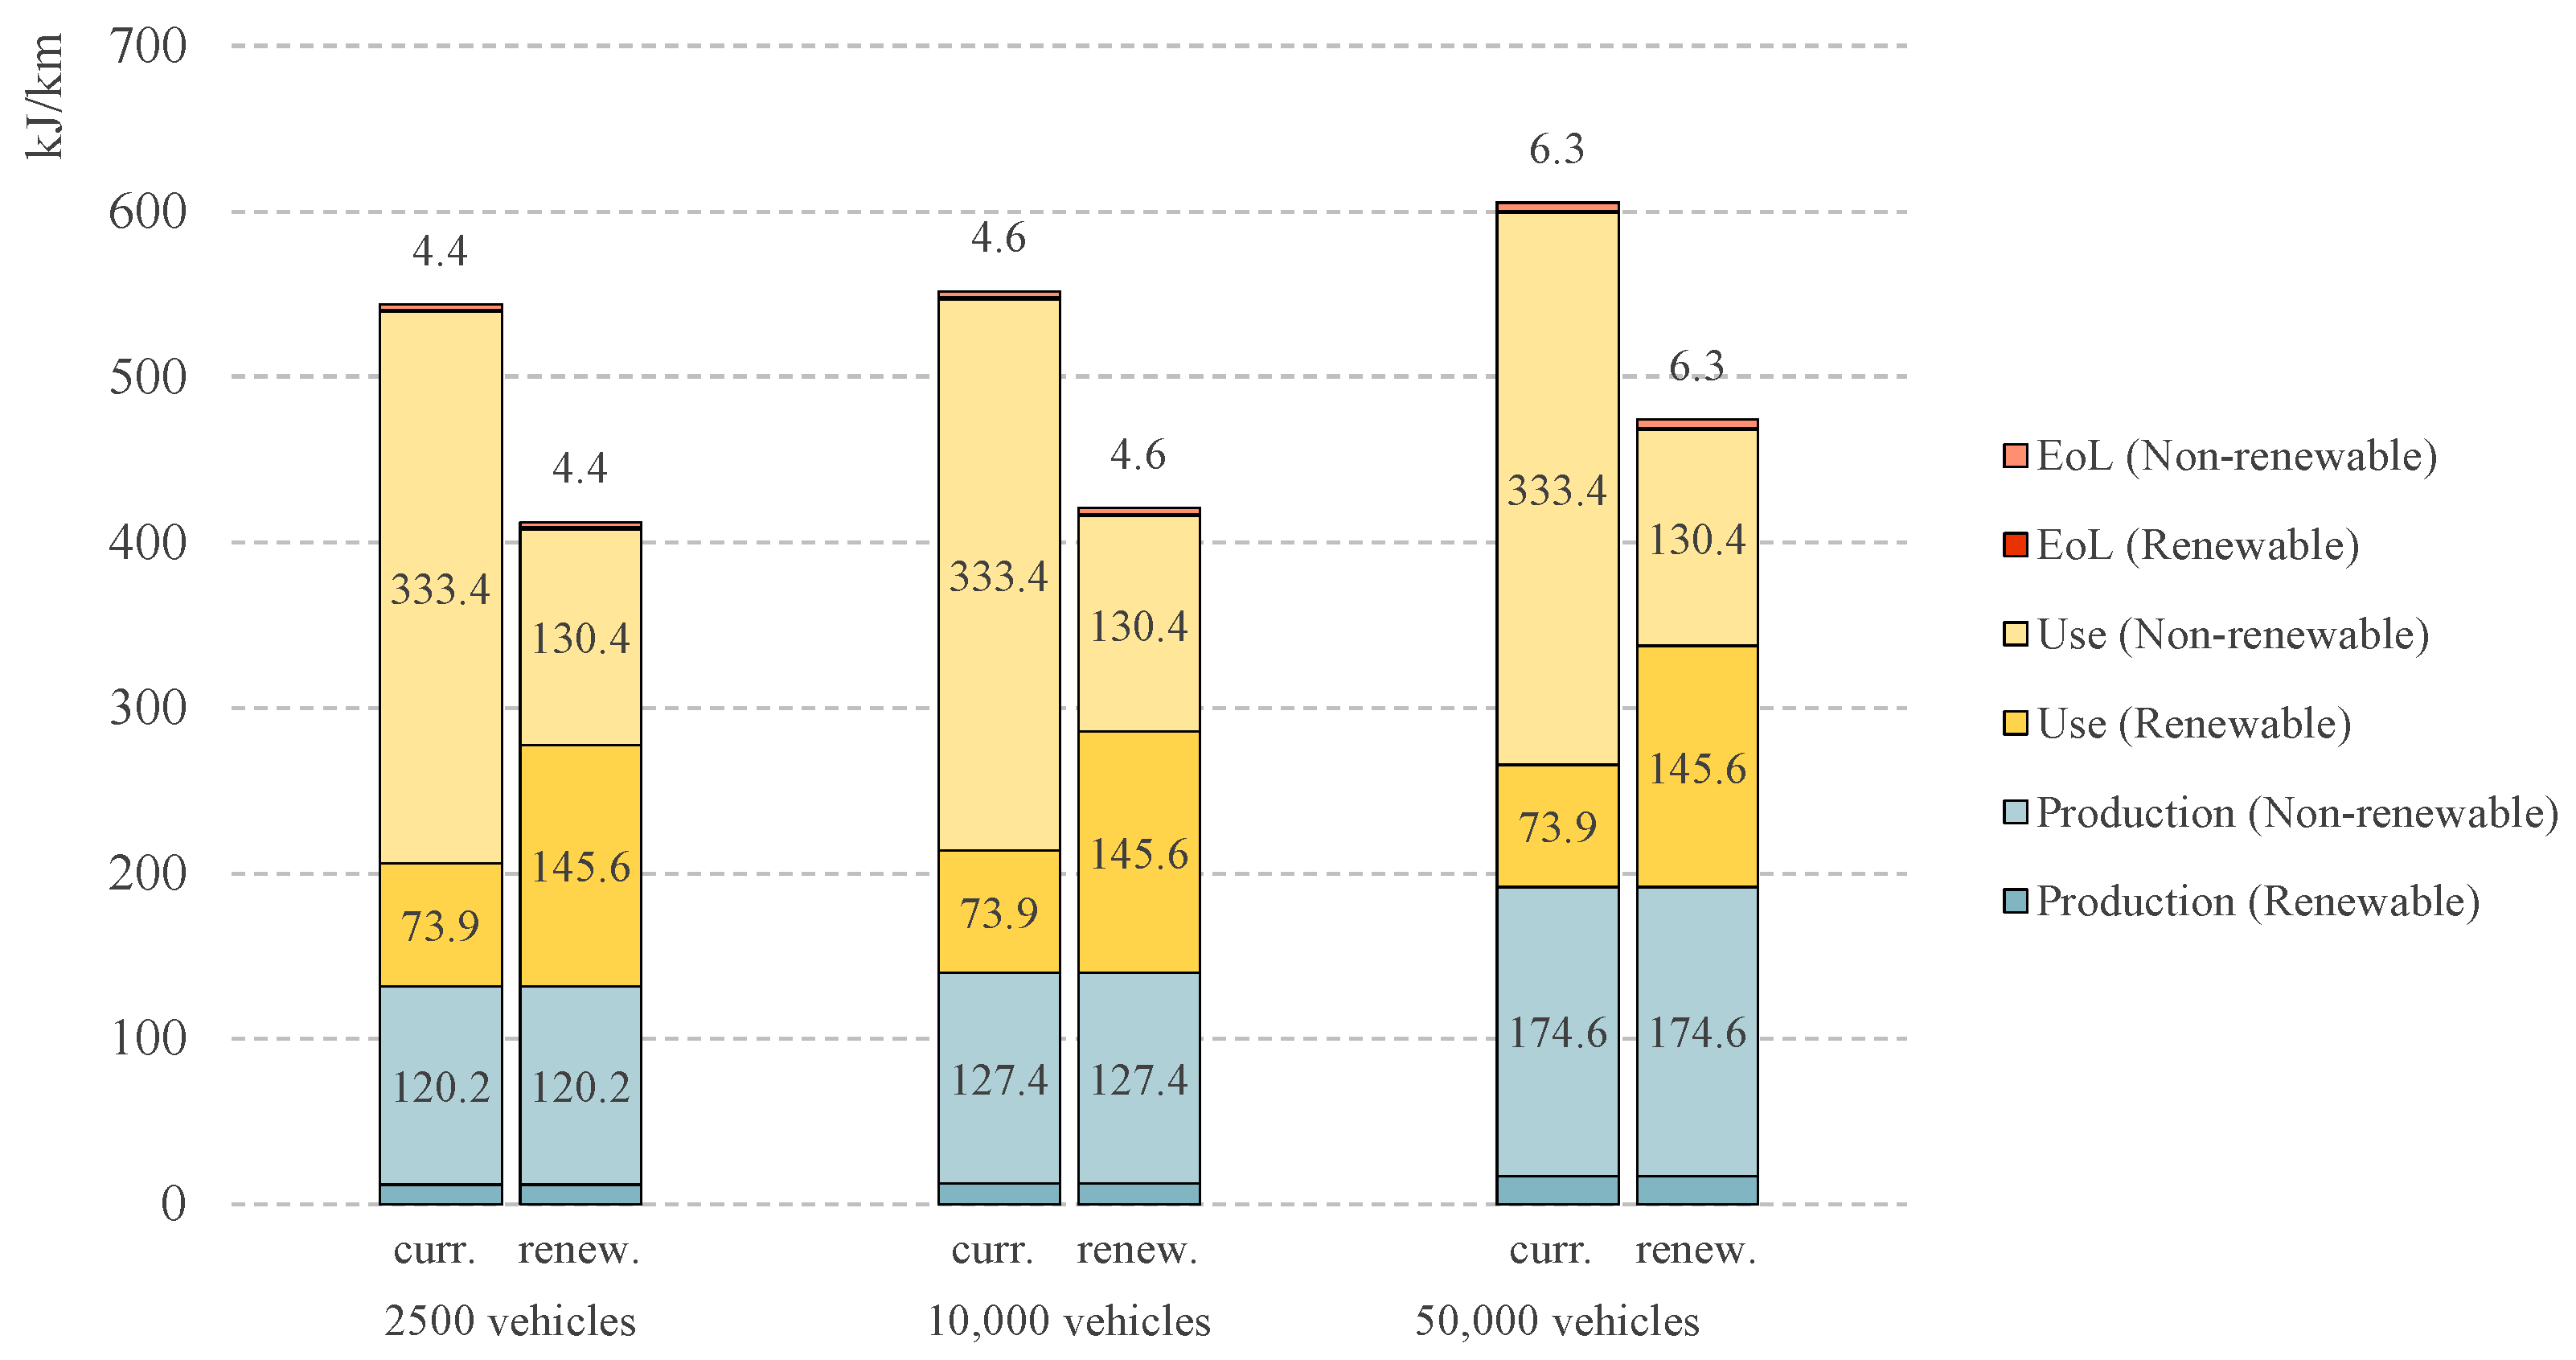
4.3. Life Cycle Assessment

In the following, the results of the LCA of the shared e-moped fleets are presented. The results vary for the impact categories, the scenarios and the electricity generation. They are further subdivided into production, use phase and EoL (Figure 8, Figure 9, Figure 10, Figure 11 and Figure 12). Figure 8 illustrates the impact factor for the lifetime GWP. The CO2 equivalent emissions of 2500 e-mopeds with the current electricity mix are 32.3 g CO2-eq/km. Major contributors are the electricity consumption during the use phase (main contributors: electricity from hard coal and lignite) and vehicle production (particularly battery production). Due to an increase in emissions related to production and disposal, this amount grows by 1.8% to 32.9 g CO2-eq/km and by 13.3% to 36.7 g CO2-eq/km, compared to a fleet size of 10,000 and 50,000 vehicles. Note that the distance-based GWP for the use phase is constant for the respective electricity generation because the e-moped’s emissions (electricity consumption) are linear to the driven distance. Concerning the GWP based on the electricity mix of 100% renewable electricity, the environmental output for production and EoL stay the same, whereas the CO2 equivalent emissions related to the use phase decrease by 59.7%. This leads to an overall decline of emissions per kilometer by 42.1%, given the base scenario with 2500 vehicles. For a fleet of 10,000 vehicles, the value amounts to 41.4%, whereas it equals 37.2% for 50,000 vehicles.
As highlighted in Figure 9, the emissions regarding the AP for the base scenario with 2500 e-mopeds charged with the current electricity mix are 0.166 g SO2-eq/km. It shows an increase of approximately 4.0% (10,000) to 30.8% (50,000). In comparison to the results based on an electricity generation of 100% renewable energies, the overall sulfur dioxide equivalent emissions are between 8.9% and 11.6% lower. In all scenarios, most emissions are extruded during the production phase.
For the EP, the results for the base scenario exhibit emissions of 0.035 g P-eq/km, given the current power grid mix. This value increases by 1.8% for the medium scenario and by 14% to 0.040 g P-eq/km for the maximum scenario (Figure 10). The change from current electricity generation to 100% renewable energies leads to an overall decrease in freshwater eutrophication of about 51.6% (50,000 vehicles) to 58.8% (2500).
The PMFP results are displayed in Figure 11. A fleet consisting of 2500 vehicles emits 0.062 g PM2.5 eq/km for the German power grid mix of 2019, which grows by 4.1% to 0.064 g PM2.5 eq/km for 10,000 vehicles and by 31.2% to 0.081 g PM2.5 eq/km for 50,000 vehicles. For all scenarios, the production phase is the major contributor, being about two to four times larger than all other emissions combined. With renewable energy as an electricity source, the total emissions in particulate matter decrease to 0.058 g PM2.5 eq/km (base scenario), to 0.060 g PM2.5 eq/km (medium scenario) and to 0.077 g PM2.5 eq/km (maximum scenario).
The CED is presented in the form of the distance-based required primary energy. According to Figure 12, the major contributor is the use phase amounting to 67.3% (50,000 e-mopeds) and to 74.9% (2500), given the current electricity mix. The fleet of the base scenario consumes 543.6 kJ/km, which grows by 11.3% to 605.3 kJ/km for the maximum scenario. Changing the energy source to 100% renewables, the energy required for the use phase decreases by 32.2% for every main scenario. The primary energy for the production and EoL remain constant.

5. Discussion

In this study, the original traffic data were calculated with MATSim, which was described or utilized in various publications so far [23,24,26,59,60]. Whereas there is always a degree of uncertainty related to simulation models, this framework offers the favorable characteristic of matching real-world traffic data with individual utility optimization. Based on the procedure regarding the integration of LCAs into MATSim-generated traffic scenarios as described by Syré et al. [26], it enables easy customization of input parameters and automated generation of results. An investigation on the basis of only real-world data sets as done by Degele et al. [22] would be more significant for the actual fleet size deployed by the operator but might lead to more uncertain and less valid outcomes when upscaling the traffic data to investigate different fleet sizes, such as 10,000 or 50,000 vehicles—this is one essential goal in this study.

5.1. Traffic Data

The different scenarios show that the bigger the fleet size, the more passenger vehicle trips that can be successfully substituted with an e-moped sharing system in the Berlin metropolitan area. However, it is noticeable that a shared fleet consisting of 10,000 e-mopeds is only able to increase the total trips by 3.66, compared to the four-times-lower base scenario. When pointing out the maximum scenario with 20 times more vehicles, only 12.0 more total trips can be conducted. This is reflected by the number of inactive mopeds and the UR, which are by far the lowest for the largest fleet. One explanation for the drop in fleet efficiency is the higher vehicle density. This leads to more situations in which the agents have more than one e-moped to choose from when departing and thus, leave some mopeds with little or no use for that day. However, having a higher vehicle density also seems to equal a higher number of e-mopeds with higher battery capacity, which would explain the longest average trip distance of all fleet sizes. While this circumstance leads to more absolute trips being possible in theory, the comparatively low UR does not offset the better cost distribution (economies of scale) per e-moped and finally becomes one of the main drivers for the second-highest costs per kilometer. Although a trend toward higher UR with decreasing fleet size can be observed, the scenario with 500 e-mopeds (first additional scenario) exhibits a slightly lower UR than the base scenario. One reason for this might be that with a certain vehicle density, the probability of situations in which agents are not able to find an e-moped in walking distance surpasses the previously explained effect of having too many mobility options to walk to. This is a useful insight for the selection of the fleet size for a sharing operator. Changing the battery swapping duration in the base scenario from one to eight hours, as investigated in the third additional scenario, leads to a considerable decrease in total conducted trips by 20%. For the personal factor scenario, only one every third trip (meaning 33.3% of all possible trips) could be substituted. However, the results show only a trip and UR reduction of around 55%, compared to the base case. This smaller reduction can be explained by the fact that more suitable e-mopeds are available for the agents. This argumentation is underlined by the 200% higher number of inactive mopeds and the higher average trip distance, which indicates higher average SOC of the e-moped batteries (compare Table 9 and Table 11). Citing the average UR per day described by Howe and Jakobsen [19] in 2019, even the lowest daily UR rate calculated in this study (being 11.1 as the UR for the average day based on a year for a fleet with 50,000 vehicles) is still 39% higher. However, since the year of publication, the global user base of e-moped sharing operators has increased by 81% and is expected to grow further [15]. When multiplying the average trip distances from the main scenarios with the average inner-city travel speed in Berlin [61], an average trip duration can be calculated. Here, it ranges from 12.2 (2500 vehicles) to 14.0 min (50,000 vehicles). These values correspond to the results of Aguilera-García et al. [10] but are below the 15 to 20 min researched for the average ride time per rental by Howe and Jakobsen [19]. Applying the average UR of the main scenarios to the average trip duration (see Table 9), the daily time in which the e-moped is actively used sums up to 155 to 225 min, depending on the fleet size. This means that an average shared e-moped is in use for about 10.7% to 15.6% of the time per day. Compared to the average time of 5% during which a car is not parked [5], the shared e-moped is utilized, on average, more than two times as much. According to a research study by Gerike et al. [62], the modal split of urban motorized two-wheelers (moped, motorcycle and scooter) based on all trips made is 0.5% on an average working day in Berlin in 2019. However, the share of these modalities equals to 2.56% when taking the passenger car driver traffic as a basis—as done in this study. Compared to the ratio of 1.95% of all passenger car trips in Berlin that can be replaced by the e-moped fleet in the base scenario, these values are in the same range. Although factors such as rain and lower weekend traffic are included in the study’s simulation, it should be noted that the current simulation settings display the maximal possible substitutions of passenger vehicle traffic with a shared e-moped fleet in Berlin. Major factors, such as seasonality effects or the agent’s personal preference/aversion toward the use of a shared e-moped are not covered. When comparing to passenger vehicles, aversive factors toward this type of mobility concept are (security) concerns when driving two-wheelers, higher spatial requirements needed for bulk purchases, or the financial willingness of the users to pay for this service, just to name a few examples.

5.2. Total Cost of Ownership

The medium scenario and not the base scenario offers, with 0.108 EUR/km, by far the best cost position for the operator. Two main factors are identified: the relatively high UR compared to the base scenario and its respective cost advantage for expenses, such as personnel or office rent per kilometer, which decrease on a linear gradient with the fleet size. It should be noted that a TCO analysis for a theoretical e-moped sharing service is always associated with uncertainties. The underlying assumptions of the cost components are heavily dependent on factors such as the design of the fleet operations or the public accessibility of data, especially when determining the costs for the scenarios with 10,000 or 50,000 vehicles. Parameters such as the moped decay ratio or operational fleet factor have a major influence on the investment costs of the e-moped fleet (which represent more than 70% of all capital costs) but vary greatly depending on the selected vehicle model or the sharing operator’s prioritization of operations and maintenance. This is particularly evident in the battery swappers’ salaries, which alone account for 38.9% (base scenario) to 44.9% (maximum scenario) of all operating costs (see Tables S5 and S6 in the Supplementary Materials). Depending on how much value an operator places on the availability of the mopeds (as indicated in the additional scenario), large cost differences arise, for example, for the total battery swapper salaries. The TCO of the additional scenario with an 8 h battery swap shows that although the share of operator costs reduces from 59.5% to 56.3%, the absolute costs, both operator and capital costs, are higher. The same uncertainty applies to costs that rely on the user base. Although the user base calculation for the base scenario was derived from one sharing operator and matched with public data from another operator [63], no comparisons could be made with figures for scenarios with large fleets because of the lack of suitable and available data for individual sharing systems from 10,000 vehicles upwards. To provide an initial scope for a possible pricing scheme for an e-moped sharing service, an operator might refer to the costs for the private use of an average, medium-sized car. For a Volkswagen ID.3 Pro (58 kWh) with a total mileage of 100,000 km over 5 years, the total distance-based costs amount to 35.5 ct/km. This represents an increase of 177%, compared to the 12.8 ct/km of the base scenario. However, it should be noted that these means of transport cannot be adequately compared simply because of different ownership models and different functionalities.

5.3. Life Cycle Assessment

As expounded by the Austrian Energy Agency, the GWP related emissions over the lifetime of a privately used e-moped were calculated as 59.1 g CO2-eq/km (53.4) for the average Austrian electricity mix in 2015 (for a fully renewable electricity mix) [21]. Although covering the same cradle-to-grave phases, these are about 74% (162%) higher than the average e-moped fleet emissions, given the German power grid mix in 2019 (100% renewables). Regarding the CED, the total required energy is 56% (45% for the 100% renewable power grid mix) higher in this study. However, the Austrian study exhibits differences in the investigated moped properties and the prevailing conditions of the LCA. The battery weighs 26.5% more than the one used in this study and LMO is used as a cathode material instead of the more up-to-date NMC. The total mileage with 10,000 km is six to nine times lower, and two batteries are used in the considered 10 years. These factors might explain the higher emissions. The low reduction rate when changing the power generation to fully renewables can be explained by the currently low share of fossil energy of 24% in Austria. In another study, Hofmann et al. [20] determined the greenhouse gas emissions for a comparable e-moped as 32 g CO2-eq/km [20]. This value lies in a tolerable range to the 34 g CO2-eq/km for the current power grid mix in this study. However, the Swiss power grid mix in 2013 emits only 148 g CO2-eq/kWh, while the German mix in 2019 produces 401 g CO2-eq/kWh [64]. Compared to the calculated 20.4 g CO2-eq/km in the 100% renewable case, the amount in Hofmann et al. [20] is 57% higher. The reason for this deviation could be the lower lifetime mileage (50,000 km), the different impact assessment method (IPCC 100a), a varying battery model (cathode material: LMO) and its higher total weight (32 kg). Compared to other results based on MATSim simulations, the study by Syré et al. [26] can be introduced. It investigated the environmental distance-based impact of electric cars, given the same MATSim Open Berlin Scenario and the same impact assessment method. The vehicles in the study are privately owned passenger cars and, therefore, are not comparable in usage time and lifetime mileage. Therefore, we refrain from comparing the emissions of the entire life cycle. However, a well-to-wheel comparison shows the differences in electricity and fuel consumption. In the study by Syré et al. [26], the average well-to-wheel emissions for one kilometer driven in the transport system are 197 g CO2-eq/km for the ICEV case and 124 g CO2-eq/km for the BEV case. With renewable energies, the BEV case reduces to 10 g CO2-eq/km. In this study, regarding only WTW emissions, the e-mopeds emit 23 g CO2-eq/km (current electricity mix) and 9 g CO2-eq/km (renewable electricity mix). With the current electricity mix, the WTW emissions of e-mopeds are significantly lower than the emissions by ICEVs and BEVs. For a renewable grid mix, the reduction compared to ICEVs logically becomes larger. However, the reduction compared to BEVs is rather small. Syré et al. [26] considered less renewable energy (4.5 percentage points) and more hard coal and lignite (3 percentage points each) for the current scenario, which lead to higher environmental emissions. For the fully renewable energy scenario, only wind energy and large PV systems (which require fewer mounting structures) were used, whereas this study considers also geothermal, biogas and water energy. Another important impact category for road transport is the particulate matter formation potential: in the use phase, the e-mopeds emit 0.019 g PM2.5 eq/km (current grid mix) and 0.015 g PM2.5 eq/km (renewable grid mix). The battery electric passenger cars in the study by Syré et al. [26] emit 0.221 g PM2.5 eq/km (current grid mix) and 0.119 g PM2.5 eq/km (renewable grid mix). The results show that, especially in the upcoming years in which the grid mix will not be completely renewable, e-mopeds can help to significantly reduce emissions from road transport, as long as the trips replace passenger car trips and not bicycle or pedestrian trips.

6. Conclusions

E-moped scooter sharing systems have gained momentum in urban areas recently. To better assess their traffic-related, economic and environmental impact, a sharing simulation for the potential substitution of urban motorized private transport based on MATSim results is developed. Three different fleet sizes (2500, 10,000 and 50,000 e-mopeds) and two additional scenarios are introduced, and their underlying rationale is illustrated. The respective effects are investigated, given the current and a 100% renewable energy power grid mix. The simulation results show that the base scenario theoretically can substitute 1.95% of all passenger car trips done in Berlin. The larger the fleet, the more and longer the trips that can be substituted. At the same time, the efficiency in terms of fleet utilization decreases by 40%, comparing the base scenario of 2500 e-mopeds to the scenario with 50,000 vehicles. For the maximum scenario, the comparatively low utilization rate and daily mileage per e-moped cannot outweigh the cost savings due to economies of scale. With 0.126 EUR/km, it is only 1.2% lower than the highest distance-based costs for a sharing operator of the scenarios considered. As a result, the scenario with 10,000 sharing vehicles offers by far the lowest total costs per kilometer, with 0.108 EUR/km. For all listed impact categories in the life cycle assessment, the base scenario offers the lowest environmental impact per kilometer regardless of the electricity source. When increasing the fleet size to 10,000, these emissions increase slightly by 2.6% on average. For 50,000 vehicles, this value grows by 20.1% based on the base scenario. With only renewable energy in the power grid mix, the shared fleets gain additional advantages due to the emission reduction during the use phase, particularly for the global warming and eutrophication potential. In these categories, the environmental output per kilometer reduces by 59.7% and 85.2%, resulting in an overall distance-based decline of 40.2% and 56.1%. At the same time, the total primary energy use per kilometer can be lowered by 23.2%.

7. Outlook

As we conclude, for further research to create more real-world close sharing simulations, future approaches will focus on different aspects of substitution: while this study displays the maximal possible substitution potential, the seasonality effects, personal preference/aversion toward this relatively new mobility option or the effects of specific revenue models should be considered. With the knowledge generated by user surveys on mobility behavior, more precise investigations can be conducted. This can be easily integrated as a general factor in the decision model of the sharing simulation and would enable more realistic comparisons of environmental emissions between modes of transport on the basis of substituted vehicles, and not only on a trip level as done in this study. Here, the influence of other sharing systems, such as car sharing or electric scooter sharing, can be investigated, given the available data. Due to the modular structure of the developed sharing simulation, the usage of other databases and/or traffic simulations is possible with little effort. As a result, it would allow transport policymakers and entrepreneurs all over the world to make well-founded decisions about the role of e-moped sharing toward more sustainable urban mobility. Moreover, the used method can be applied to other forms of transport and be used by researchers to implement case studies for other cities, if the needed data are available.

Supplementary Materials

The following are available online at https://www.mdpi.com/article/10.3390/wevj12030096/s1, Table S1: LCIA for e-moped fleets with German electricity mix of 2019; Table S2: LCIA for e-moped fleets with renewable electricity mix; Table S3: CED for e-moped fleets with German electricity mix of 2019; Table S4: CED for e-moped fleets with renewable electricity mix; Table S5: Personnel cost structure for e-moped fleets for main scenarios; Table S6: Personnel cost structure for e-moped fleets for additional scenarios (PF—personal factor, BS—8 h battery swap); Table S7: Cross-scenario operation parameters for e-moped fleets; Table S8: Scenario-specific operation parameters for e-moped fleets for main scenarios; Table S9: Scenario-specific operation parameters for e-moped fleets for additional scenarios (PF—personal factor, BS—8 h battery swap).

Author Contributions

Conceptualization, C.W., A.M.S. and A.G.; methodology, C.W., A.M.S. and A.G.; software, C.W.; validation, C.W., A.M.S. and A.G.; formal analysis, C.W.; investigation, C.W.; resources, D.G.; data curation, C.W.; writing—original draft preparation, C.W.; writing—review and editing, C.W., A.M.S., A.G. and D.G.; visualization, C.W.; supervision, A.M.S., A.G. and D.G.; project administration, A.M.S., A.G. and D.G.; funding acquisition, D.G. All authors have read and agreed to the published version of the manuscript.

Funding

This work was funded by the Deutsche Forschungsgemeinschaft (DFG, German Research Foundation) as project number 398051144.

Data Availability Statement

Transport simulation scenario: https://github.com/matsim-scenarios/matsim-berlin (accessed on 29 June 2021).

Acknowledgments

We acknowledge support by the German Research Foundation and the Open Access Publication Fund of TU Berlin for the open access publication.

Conflicts of Interest

The authors declare no conflict of interest. The funders had no role in the design of the study; in the collection, analyses, or interpretation of data; in the writing of the manuscript, or in the decision to publish the results.

References

  1. Bundesministerium für Umwelt, Naturschutz und nukleare Sicherheit. Klimaschutzplan 2050: Klimaschutzpolitische Grundsätze und Ziele der Bundesregierung. 2016. Available online: https://www.bmu.de/fileadmin/Daten_BMU/Download_PDF/Klimaschutz/klimaschutzplan_2050_bf.pdf (accessed on 14 December 2020).
  2. Breitkopf, A. Energiebedingte CO2-Emissionen durch den Verkehr in Deutschland in den Jahren 1990 bis 2018. 2019. Available online: https://de.statista.com/statistik/daten/studie/12188/umfrage/co2-emissionen-durch-verkehr-in-deutschland-seit-1990/ (accessed on 14 December 2020).
  3. Meilă, A.D. Sustainable urban mobility in the sharing economy: Digital platforms, collaborative governance, and innovative transportation. Contemp. Read. Law Soc. Justice 2018, 10, 130–136. [Google Scholar]
  4. Helms, H.; Kämper, C.; Biemann, K.; Lambrecht, U.; Jöhrens, J.; Meyer, K. Klimabilanz von Elektroautos: Einflussfaktoren und Verbesserungspotenzial. Available online: https://www.agora-verkehrswende.de/fileadmin/Projekte/2018/Klimabilanz_von_Elektroautos/Agora-Verkehrswende_22_Klimabilanz-von-Elektroautos_WEB.pdf (accessed on 14 December 2020).
  5. Shoup, D.C. The High Cost of Free Parking; Planners Press, American Planning Association: Washington, DC, USA, 2005. [Google Scholar]
  6. Shaheen, S.; Chan, N. Mobility and the Sharing Economy: Potential to Facilitate the First- and Last-Mile Public Transit Connections. Built Environ. 2016, 42, 573–588. [Google Scholar] [CrossRef]
  7. Wappelhorst, S.; Sauer, M.; Hinkeldein, D.; Bocherding, A.; Glaß, T. Potential of Electric Carsharing in Urban and Rural Areas. Transp. Res. Procedia 2014, 4, 374–386. [Google Scholar] [CrossRef] [Green Version]
  8. Namazu, M.; MacKenzie, D.; Zerriffi, H.; Dowlatabadi, H. Is carsharing for everyone? Understanding the diffusion of carsharing services. Transp. Policy 2018, 63, 189–199. [Google Scholar] [CrossRef]
  9. Howe, E.; Jakobsen, F.J. unu Global Moped Sharing Market Report 2020. Available online: https://share.unumotors.com/global-mobility-sharing-market-reportf (accessed on 15 December 2020).
  10. Aguilera-García, Á.; Gomez, J.; Sobrino, N. Exploring the adoption of moped scooter-sharing systems in Spanish urban areas. Cities 2020, 96, 102424. [Google Scholar] [CrossRef]
  11. Nobis, C.; Kuhnimhof, T. Mobilität in Deutschland—MiD: Ergebnisbericht. Available online: http://www.mobilitaet-in-deutschland.de/pdf/MiD2017_Ergebnisbericht.pdf (accessed on 15 December 2020).
  12. Boglietti, S.; Barabino, B.; Maternini, G. Survey on e-Powered Micro Personal Mobility Vehicles: Exploring Current Issues towards Future Developments. Sustainability 2021, 13, 3692. [Google Scholar] [CrossRef]
  13. Kafyeke, T. Sharing Is Caring: The Rise of Electric Scooters|Urbanity. 2017. Available online: https://en.reset.org/blog/sharing-caring-rise-electric-scooters-03032017 (accessed on 15 December 2020).
  14. Stephanou, K. The rise of scooter sharing. In Comodule: IoT Solutions for Bicycles and Scooters; Comodule: Tallinn, Estonia, 2017. [Google Scholar]
  15. Howe, E. Moped Sharing Regulation Schemes around the World: A Brief Look at the Status quo. 2020. Available online: https://medium.com/unu-share-mobility-insights/moped-sharing-regulation-schemes-around-the-world-a-brief-look-at-the-status-quo-f71c9763faf6 (accessed on 15 December 2020).
  16. Nefzger, E. Elektrische Motorroller: Das Verkehrsmittel der Stunde. DER SPIEGEL. 2020. Available online: https://www.spiegel.de/auto/elektrische-motorroller-das-verkehrsmittel-der-stunde-a-ad7551a2-84cc-46c6-907f-01f06494c9c0 (accessed on 15 December 2020).
  17. Howe, E. Global Scootersharing Market Report 2017; UNU: Berlin, Germany, 2017. [Google Scholar]
  18. Howe, E. Global Scootersharing Market Report 2018; UNU: Berlin, Germany, 2018. [Google Scholar]
  19. Howe, E.; Jakobsen, F.J. Unu Global Scooter Sharing Market Report 2019; UNU: Berlin, Germany, 2019. [Google Scholar]
  20. Hofmann, H.; Kaufmann, R.; Tschopp, O.; Widmer, R.; Gauch, M.; Haefeli, U.; Schwegler, U. E-Scooter: Sozial- und naturwissenschaftliche Beiträge zur Förderung leichter Elektrofahrzeuge in der Schweiz: Schlussbericht 2013. Available online: https://www.newride.ch/documents/Forschungsprojekt_E-Scooters_2013/Schlussbericht_E-Scooter_2013.pdf (accessed on 15 December 2020).
  21. Österreichische Energieagentur—Austrian Energy Agency. E-MOTO—Aktions- und Motivationsplan zur Etablierung der E-Mobilität bei Jungen ZweiradlenkerInnen. Available online: https://www.klimafonds.gv.at/wp-content/uploads/sites/6/B570650-E-Modellregionen-E-Moto-KR15EM8K12961-Endbericht.pdf (accessed on 15 December 2020).
  22. Degele, J.; Gorr, A.; Haas, K.; Kormann, D.; Krauss, S.; Lipinski, P.; Tenbih, M.; Koppenhoefer, C.; Fauser, J.; Hertweck, D. Identifying E-Scooter Sharing Customer Segments Using Clustering. In Proceedings of the 2018 IEEE International Conference on Engineering, Technology and Innovation (ICE/ITMC), Stuttgart, Germany, 17–20 June 2018; pp. 1–8. [Google Scholar] [CrossRef]
  23. Horni, A.; Nagel, K.; Axhausen, K.W. The Multi-Agent Transport Simulation MATSim; Ubiquity Press: London, UK, 2016. [Google Scholar] [CrossRef]
  24. Ziemke, D.; Kaddoura, I.; Nagel, K. The MATSim Open Berlin Scenario: A multimodal agent-based transport simulation scenario based on synthetic demand modeling and open data. Procedia Comput. Sci. 2019, 151, 870–877. [Google Scholar] [CrossRef]
  25. Göhlich, D.; Nagel, K.; Syré, A.M.; Grahle, A.; Martins-Turner, K.; Ewert, R.; Miranda Jahn, R.; Jefferies, D. Integrated Approach for the Assessment of Strategies for the Decarbonization of Urban Traffic. Sustainability 2021, 13, 839. [Google Scholar] [CrossRef]
  26. Syré, A.M.; Heining, F.; Göhlich, D. Method for a Multi-Vehicle, Simulation-Based Life Cycle Assessment and Application to Berlin’s Motorized Individual Transport. Sustainability 2020, 12, 7302. [Google Scholar] [CrossRef]
  27. Wernet, G.; Bauer, C.; Steubing, B.; Reinhard, J.; Moreno-Ruiz, E.; Weidema, B. The ecoinvent database version 3 (part I): Overview and methodology. Int. J. Life Cycle Assess. 2016, 21, 1218–1230. [Google Scholar] [CrossRef]
  28. Ecoinvent Version 3.6. 2019. Available online: https://v36.ecoquery.ecoinvent.org (accessed on 15 December 2020).
  29. Siret, C.; Tytgat, J.; Ebert, T.; Mistry, M.; Thirlaway, C.; Schutz, B.; Xhantopoulos, D.; Wiaux, J.-P.; Chanson, C.; Tomboy, W.; et al. PEFCR—Product Environmental Footprint Category Rules for High Specific Energy Rechargeable Batteries for Mobile Applications. Available online: https://ec.europa.eu/environment/eussd/smgp/pdf/PEFCR_Batteries.pdf (accessed on 15 December 2020).
  30. Temporelli, A.; Carvalho, M.L.; Girardi, P. Life Cycle Assessment of Electric Vehicle Batteries: An Overview of Recent Literature. Energies 2020, 13, 2864. [Google Scholar] [CrossRef]
  31. Huijbregts, M.A.J.; Steinmann, Z.J.N.; Elshout, P.M.F.; Stam, G.; Verones, F.; Vieira, M.; Zijp, M.; Hollander, A.; van Zelm, R. ReCiPe2016: A harmonised life cycle impact assessment method at midpoint and endpoint level. Int. J. Life Cycle Assess. 2017, 22, 138–147. [Google Scholar] [CrossRef]
  32. Bath, D. Coup in Berlin Stellt Service ein. Berliner Morgenpost. 26 November 2019. Available online: https://www.morgenpost.de/berlin/article227744113/E-Motorroller-Anbieter-Coup-stellt-Service-in-Berlin-ein.html (accessed on 8 December 2020).
  33. Berliner Senatsverwaltung für Umwelt, Verkehr und Klimaschutz. Masterplan für Nachhaltige und Emissionsarme Mobilität des Landes Berlin. Available online: https://www.bmvi.de/SharedDocs/DE/Anlage/K/Masterplaene-Green-City/berlin.pdf?__blob=publicationFile (accessed on 8 December 2020).
  34. Berliner Senatsverwaltung für Umwelt, Verkehr und Klimaschutz. Berliner Mobilitätsgesetz: MobG. Available online: http://gesetze.berlin.de/jportal/?quelle=jlink&query=MobG+BE&psml=bsbeprod.psml&max=true&aiz=true (accessed on 8 December 2020).
  35. Bäumer, M.; Hautzinger, H.; Pfeiffer, M.; Stock, W.; Lenz, B.; Kuhnimhof, T.; Köhler, K. Fahrleistungserhebung 2014—Inlandsfahrleistung und Unfallrisiko; Bundesanstalt für Straßenwesen: Bergisch Gladbach, Germany, 2017. [Google Scholar]
  36. Aktuelle Stündliche Niederschlagshöhe, Gemessen an Stadtklimastation Berlin-Alexanderplatz (Station ID 399). Available online: https://opendata.dwd.de/climate_environment/CDC/observations_germany/climate_urban/hourly/precipitation/recent/ (accessed on 8 December 2020).
  37. AfA-Tabelle für die Allgemein Verwendbaren Anlagegüter (AfA-Tabelle “AV”). 2000. Available online: https://www.bundesfinanzministerium.de/Content/DE/Standardartikel/Themen/Steuern/Weitere_Steuerthemen/Betriebspruefung/AfA-Tabellen/Ergaenzende-AfA-Tabellen/AfA-Tabelle_AV.html (accessed on 8 December 2020).
  38. Grübel, T. Battery Swap Threshold/Shared e-Moped Lifetime. 15 November 2020. [Google Scholar]
  39. Klaus, T.; Vollmer, C.; Werner, K.; Lehmann, H.; Müschen, K. Energieziel 2050: 100% Strom aus Erneuerbaren Quellen. Available online: https://www.umweltbundesamt.de/sites/default/files/medien/378/publikationen/energieziel_2050.pdf (accessed on 8 December 2020).
  40. GOVECS AG. GOVECS FLEX Sharing Solution Offer. Available online: https://www.govecsgroup.com/en/ (accessed on 18 December 2020).
  41. Bundesministerium für Verkehr und digitale Infrastruktur. Straßenverkehrs-Zulassungs-Ordnung: StVZO. Available online: https://www.gesetze-im-internet.de/stvzo_2012/BJNR067910012.html (accessed on 23 December 2020).
  42. Keil, P.; Jossen, A. Aging of Lithium-Ion Batteries in Electric Vehicles: Impact of Regenerative Braking. World Electr. Veh. J. 2015, 7, 41–51. [Google Scholar] [CrossRef] [Green Version]
  43. Dearborn, S. Charging Li-ion Batteries for Maximum Run Times: An Understanding of Battery-Charging Fundamentals and System Requirements Enable Designers to Choose a Suitable Linear or Switch-Mode Charging Topology and Optimize Battery Performance in the Application. 2005. Available online: https://www.yumpu.com/en/document/read/19291646/charging-li-ion-batteries-for-maximum-run-times-power-electronics (accessed on 15 December 2020).
  44. Statista Research Department. Inflationsrate in Deutschland bis 2019. 2020. Available online: https://de.statista.com/statistik/daten/studie/1046/umfrage/inflationsrate-veraenderung-des-verbraucherpreisindexes-zum-vorjahr/#professional (accessed on 27 December 2020).
  45. Mottschall, M.; Hacker, F. Costs of the energy supply infrastructure for trucks with alternative driving system from a user and macroeconomic perspective in Germany. In Proceedings of the 3rd Electric Road Systems Conference, Frankfurt am Main, Germany, 7–8 May 2019. [Google Scholar]
  46. Bailly, S. Who Are the Mobility Startups in Europe? European Startup Prize. Available online: https://startupprize.eu/who-are-the-mobility-startups-in-europe/ (accessed on 7 January 2021).
  47. Bundesverband der Energie- und Wasserwirtschaft e.V. Strompreis für die Industrie. 2019. Available online: https://www.bdew.de/service/daten-und-grafiken/strompreis-fuer-die-industrie/ (accessed on 13 December 2020).
  48. Clement, J. Average Mobile App User Acquisition Costs Worldwide from September 2018 to August 2019, by User Action and Operating System. Available online: https://www.statista.com/statistics/185736/mobile-app-average-user-acquisition-cost/ (accessed on 9 January 2021).
  49. Del Duce, A.; Widmer, R.; Gauch, M.; Hans-Jörg, A. Ökoinventare für E-Scooter: Stand des Forschungsprojekts. 2013. Available online: http://www.ikaoe.unibe.ch/forschung/e-scooter/BGF_fes_empa_09042013.pdf (accessed on 15 December 2020).
  50. Notter, D.A.; Gauch, M.; Widmer, R.; Wäger, P.; Stamp, A.; Zah, R.; Althaus, H.J. Contribution of Li-ion batteries to the environmental impact of electric vehicles. Environ. Sci. Technol. 2010, 44, 6550–6556. [Google Scholar] [CrossRef] [PubMed]
  51. Zhao, S.; You, F. Comparative Life-Cycle Assessment of Li-Ion Batteries through Process-Based and Integrated Hybrid Approaches. ACS Sustain. Chem. Eng. 2019, 7, 5082–5094. [Google Scholar] [CrossRef]
  52. Dai, Q.; Kelly, J.C.; Gaines, L.; Wang, M. Life Cycle Analysis of Lithium-Ion Batteries for Automotive Applications. Batteries 2019, 5, 48. [Google Scholar] [CrossRef] [Green Version]
  53. Penkała, M.; Ogrodnik, P.; Rogula-Kozłowska, W. Particulate Matter from the Road Surface Abrasion as a Problem of Non-Exhaust Emission Control. Environments 2018, 5, 9. [Google Scholar] [CrossRef] [Green Version]
  54. Wahid, S.M.S. Automotive brake wear: A review. Environ. Sci. Pollut. Res. 2018, 25, 174–180. [Google Scholar] [CrossRef] [PubMed]
  55. Grigoratos, T.; Martini, G. Non-Exhaust Traffic Related Emissions—Brake and Tyre Wear PM: Literature Review; EUR, Scientific and Technical Research Series; Publications Office of the European Union: Luxembourg, 2014; Volume 26648. [Google Scholar]
  56. Agora Energiewende. Die Energiewende im Stromsektor: Stand der Dinge 2019. Rückblick auf die Wesentlichen Entwicklungen sowie Ausblick auf 2020. Available online: https://www.agora-energiewende.de/fileadmin2/Projekte/2019/Jahresauswertung_2019/171_A-EW_Jahresauswertung_2019_WEB.pdf (accessed on 8 December 2020).
  57. Statistisches Bundesamt. Bruttostromerzeugung in Deutschland. 2019. Available online: https://www.destatis.de/DE/Themen/Branchen-Unternehmen/Energie/Erzeugung/Tabellen/bruttostromerzeugung.html#fussnote-2-103884 (accessed on 8 December 2020).
  58. Icha, P.; Kuhs, G. Entwicklung der Spezifischen Kohlendioxid-Emissionen des Deutschen Strommix in den Jahren 1990–2018. Available online: https://www.umweltbundesamt.de/publikationen/entwicklung-der-spezifischen-kohlendioxid-5 (accessed on 8 December 2020).
  59. Martins-Turner, K.; Grahle, A.; Nagel, K.; Göhlich, D. Electrification of Urban Freight Transport—A Case Study of the Food Retailing Industry. Procedia Comput. Sci. 2020, 170, 757–763. [Google Scholar] [CrossRef]
  60. Maciejewski, M.; Nagel, K. Simulation and Dynamic Optimization of Taxi Services in MATSim. 2013. Available online: https://www.researchgate.net/publication/236630715_Simulation_and_dynamic_optimization_of_taxi_services_in_MATSim (accessed on 15 December 2020).
  61. INRIX. Innerstädtische Durchschnittsgeschwindigkeit im Autoverkehr in Deutschen Städten 2018. 2019. Available online: https://de.statista.com/statistik/daten/studie/994676/umfrage/innerstaedtische-durchschnittsgeschwindigkeit-im-autoverkehr-in-deutschen-staedten/ (accessed on 22 December 2020).
  62. Gerike, R.; Hubrich, S.; Ließke, F.; Wittig, S.; Wittwer, R. Tabellen zum Forschungsprojekt Mobilität in Städten—SrV 2018. 2019. Available online: https://changing-cities.org/wp-content/uploads/2020/03/Berlin_Tabellen_Berlin_gesamt.pdf (accessed on 5 November 2020).
  63. Knoblach, J. Millionen-Investition: Emmy Verdoppelt Seine Berliner E-Roller-Flotte. Available online: https://www.berliner-zeitung.de/wirtschaft-verantwortung/emmy-wird-im-naechsten-fruehjahr-seine-flotte-in-berlin-verdoppeln-li.129158 (accessed on 10 January 2021).
  64. Bilanz 2019: CO2-Emissionen pro Kilowattstunde Strom Sinken Weiter: Deutschland Verkauft mehr Strom ins Ausland als es Importiert. 2021. Available online: https://www.umweltbundesamt.de/presse/pressemitteilungen/bilanz-2019-co2-emissionen-pro-kilowattstunde-strom (accessed on 12 January 2021).
Figure 1. Flow chart of the methodology used.
Wevj 12 00096 g001
Figure 2. Decision model of sharing simulation.
Wevj 12 00096 g002
Figure 3. Schematic representation of the scenarios.
Wevj 12 00096 g003
Figure 4. Share of lifetime capital and operative costs of e-moped fleets of main scenarios.
Wevj 12 00096 g004
Figure 5. Total cost per kilometer of e-moped fleets of main scenarios.
Wevj 12 00096 g005
Figure 6. Share of lifetime capital and operative costs of e-moped fleets of additional scenarios (PF—personal factor, BS—8 h battery swap).
Wevj 12 00096 g006
Figure 7. Total cost per kilometer of e-moped fleets of additional scenarios (PF—personal factor, BS—8 h battery swap).
Wevj 12 00096 g007
Figure 8. Lifetime global warming potential of e-moped fleets per kilometer; curr.—current German power grid mix of 2019, renew.—power grid mix resembling 100% renewable energies.
Wevj 12 00096 g008
Figure 9. Lifetime acidification potential of e-moped fleets per kilometer; curr.—current German electricity mix of 2019, renew.—power grid mix resembling 100% renewable energies.
Wevj 12 00096 g009
Figure 10. Lifetime eutrophication potential of e-moped fleets per kilometer; curr.—current German electricity mix of 2019, renew.—power grid mix resembling 100% renewable energies.
Wevj 12 00096 g010
Figure 11. Lifetime particulate matter formation potential of e-moped fleets per kilometer; curr.—current German electricity mix of 2019, renew.—power grid mix resembling 100% renewable energies.
Wevj 12 00096 g011
Figure 12. Lifetime cumulative energy demand of e-moped fleets per kilometer; curr.—current German electricity mix of 2019, renew.—power grid mix resembling 100% renewable energies.
Wevj 12 00096 g012
Table 1. Vehicle fleet sizes for the TCO and LCA.
Active Fleet2500 Vehicles10,000 Vehicles50,000 Vehicles
Total fleet size over lifetime336913,47667,375
Table 2. Simulation parameters.
ParameterValueSource
Weekend traffic81.94%Based on [35]
Non-rainy hours87.08%Based on [36]
Max. walking distance (m)500Based on [10]
Max. link length (m)1000Derived from [10]
Min. Trip distance (km)1.5Own estimate
Max. Trip distance (km)30Derived from [20]
Battery swap threshold15%Own calculation
Batter safety buffer20%Own calculation
Economic life (years)5%Based on [38]
Total passenger car trips in Berlin in 24 h2,874,220Own calculation based on [24]
Scenario car trips in Berlin in 24 h1,013,930Own calculation based on [24]
Table 3. Capital cost components for the main scenarios.
Active Fleet2500 Vehicles10,000 Vehicles50,000 Vehicles
Capital cost componentShare of total capital costs
E-mopeds (incl. telematics)71.5%76.3%78.8%
Additional batteries in depot14.8%15.8%16.3%
Marketing costs5.9%2.3%0.7%
E-vans for battery swapping2.7%2.3%1.7%
Driving license verification2.4%1.0%0.3%
Charging infrastructure0.9%1.0%1.0%
Helmets0.7%0.8%0.8%
App development0.5%0.1%0.03%
E-cargo bikes for battery swapping0.4%0.4%0.3%
Others0.2%0.2%0.1%
Lifetime capital costs [€]15,612,79358,570,925283,665,414
Table 4. Operating cost components for the main scenarios.
Active Fleet2500 Vehicles10,000 Vehicles50,000 Vehicles
Operating cost componentShare of total operating costs
Personnel68.3%59.8%52.4%
Electric consumption (e-mopeds)8.0%10.7%10.5%
Maintenance7.4%10.4%14.1%
Connectivity fee7.3%10.3%13.9%
Office rent2.7%1.0%0.5%
E-moped insurance2.2%3.0%4.1%
E-moped decay2.0%2.6%2.3%
Warehouse rent1.3%1.6%1.7%
App infrastructure0.5%0.2%0.04%
Electric consumption (e-vans)0.4%0.4%0.3%
Others0.03%0.03%0.04%
Operating costs in first year (EUR)4,757,64113,433,51849,886,878
Table 5. Parameters related to riders and user base.
Active Fleet2500 Vehicles10,000 Vehicles50,000 Vehicles
Monthly rides/rider92248
Total active users158,576233,968349,403
Total user base317,152467,935698,806
Table 6. Material input needed for one kilogram of NMC cathode [51].
InputUnitValue
Lithium hydroxidekg2.5 × 10−1
Nickel sulfatekg5.42 × 10−1
Cobalt sulfatekg5.42 × 10−1
Manganese sulfatekg5.23 × 10−1
Sodium hydroxidekg8.36 × 10−1
Table 7. Shares of German power grid mix in 2019 [56].
SourceShareSourceShareSourceShare
Lignite17.18%Nuclear Energy11.32%Others4.18%
Wind18.98%Photovoltaics8.04%Water3.03%
Hard Coal8.61%Biogas7.54%Oil0.77%
Natural Gas13.72%Imports6.62%Geothermal0.03%
Table 8. Shares of power grid mix of 100% renewable energy [39].
SourceShareSourceShareSourceShare
Wind51.06%Geothermal7.09%Biogas3.26%
Photovoltaics35.18%Water3.40%
Table 9. Daily sharing simulation results for main scenarios.
Active Fleet2500 Vehicles10,000 Vehicles50,000 Vehicles
E-moped trips, direct link13,96553,720221,318
E-moped trips, adjacent link41,985151,097449,338
E-moped trips, total55,951204,817670,655
Energy consumption (kWh)682525,76893,959
Battery set swaps2547960234,896
Inactive e-mopeds452512492
Share of total e-moped trips of scenario trips5.52%20.20%66.14%
Share of total e-moped trips of total trips1.95%7.13%23.33%
Average trip distance (km)3.593.74.12
Average e-moped utilization rate22.3820.4813.41
Average mileage per e-moped (km)80.2975.7955.27
Table 10. Lifetime sharing simulation results for main scenarios.
Active Fleet2500 Vehicles10,000 Vehicles50,000 Vehicles
Average e-moped utilization rate18.4816.9111.08
Mileage per e-moped (km)89,84684,73261,826
Electric consumption per e-moped (kWh)305328822102
Table 11. Daily sharing simulation results for additional scenarios (PF—personal factor, BS—8 h battery swap).
Active Fleet2500 Vehicles10,000 Vehicles50,000 Vehicles
(PF)(BF)
E-moped trips, direct link2826542411,311
E-moped trips, adjacent link810819,80533,652
E-moped trips, total10,93425,22944,963
Energy consumption (kWh)130935275370
Battery set swaps48913112005
Inactive e-mopeds613929
Share of total e-moped trips of scenario trips1.08%2.49%4.43%
Share of total e-moped trips of total trips0.38%0.88%1.56%
Average trip distance (km)3.524.113.51
Average e-moped utilization rate21.8710.0917.99
Average mileage per e-moped (km)77.0241.5063.19
Table 12. Lifetime sharing simulation results for additional scenarios (PF—personal factor, BS—8 h battery swap).
Active Fleet2500 Vehicles10,000 Vehicles50,000 Vehicles
(PF)(BF)
Average e-moped utilization rate18.068.3314.85
Mileage per e-moped [km]85,93946,38370,589
Electric consumption per e-moped [kWh]292215772400
Publisher’s Note: MDPI stays neutral with regard to jurisdictional claims in published maps and institutional affiliations.

