Abstract
Electric vehicle cell industry is an emerging area with fierce competition on technical innovation, in which the patent holder can choose different innovation diffusion options to maximize the return; however, the strategy is unclear in certain scenarios. We tried to explain the question of how to maximize the patent holder’s return by appropriate patent license strategy to promote EV cell innovation diffusion, when competition and patent licensing relationship exist in the supply chain. A multistage and multichannel diffusion model of EV cell comprising the patent holder, EV cell producer and EV producers is developed; the evolutionary game is analyzed considering the competition among same stage players and patent licensing relationship among different stage players; and an optimization algorithm is introduced to find the maximum weighted object function of the patent holder. We established the multistage and multichannel diffusion model and found a nonlinear complex relationship between patent holder object function and the key factors including patent royalty pricing and innovation advantage coefficient; in addition, an optimization algorithm is developed based on adopters’ decision-making related with competition and patent licensing.
1. Introduction
EV (electric vehicle) cell producer and EV producers are key players that comprise the supply chain. While advantage EV cell technology emerges with patent protection, the patent holder can choose to produce the EV cell for its own EV factory use, sell for external EV producers, or license the patent to the external EV cell producer. However, among the EV cell producers, there is a competition relationship; therefore, as the EV cell producer, if the patent holder also owns an EV cell producer and EV producer, what is the way to maximize the return of the patent holder? Is there any algorithm to find the optimal return of the patent holder considering the adoption decision? As the core component of electric vehicle which is critical for Eco-innovation [1,2,3], the adoption decision of EV cell producers and EV producers on the patented EV cell impacted by patent royalty, return and cost, competition is related with the number of producers that adopted patented EV cell technology. The patent licensing strategy played a critical role on how to promote the innovation diffusion, which is an interesting problem to be solved [4]. We tried to explore this question by evolutionary game analysis and optimization algorithm to find the most favorable strategy. The existing literature considers patent licensing when outsourcing production to competitors in different supply chain scenarios and perspectives [3,4,5,6,7,8,9,10,11]; however, the supply chain structure and scenarios are different than the EV industry, and there is a lack of an optimization algorithm, which is as necessary as it is difficult to find optimal return considering the nonlinear relationship with several factors, which is multidimensional decision space.
This paper aims to explore the conceptional and mathematical model of the interplay between patent and innovation diffusion of EV cell industry. Based on different innovation diffusion channels with different layered players in the supply chain and taking into account the patents factor that impact market entry and market adoption [12,13,14,15], an integrated model of EV cell innovation diffusion was established. To analyze the payoff and strategy of innovator and adopter, the evolutionary game mathematical model and ESS (Evolutionary Stable Strategies) strategy were introduced. To find the local and global optimization strategy in the strategy space, we developed an optimization algorithm based on innovator’ patent strategy and adopters’ interaction and competition.
The paper is organized as follows. Section 2 gives a review on literature that in relation to the topics that focused on our study. Section 3 describes the conceptional and mathematical models. In Section 4, we display the process of evolutionary game modeling and equilibrium analysis, with simulation and discussions. Section 5 presents the optimization algorithm. Finally, in Section 6, a summary of major conclusions, policy implications and further proposed research in this area is presented.
2. Literature Backgrounds
Liu et al. studied the outsourcing strategy, considering patent licensing, the model and analysis is the target on an electronic product supply chain composed of a patent holder, an OEM and a contract manufacturer (CM) [5]. Bagchi and Mukherjee studied the profits of technology holders under product differentiation and market competition, impacted by the factors of different patent licensing forms [6]. Chen and Dimitrov studied green patent technology licensing issue and found that green product firms could lose their competitive advantage through patent licensing [3]. Hill analyzed whether firms should license patents to their potential competitors and found that licensing fees play a critical role in patent licensing [7]. Wang et al. studied the decision of technology-supplier’s licensing in networked supply chain. Wang tried to answer the question on how to choose fixed licensing fee or unit licensing fee based on the duopoly Cournot competition [8]. Wu constructed a dynamic game model to study the price competition and patent technology licensing of differentiated competitive enterprises, taking into account of the random market demand. Yan and Yang studied different forms of patent licensing contracts and how patent holders should choose licensing contracts [9]. Yang et al. studied the patent-holding supplier’s willingness to license its technology to a competitive supplier considering two forms of the fees, which is affected by the risk of supply disruption [10]. Zhang et al. studied the optimized patent licensing strategy of OEM for a supply chain consist of an OEM and a contract manufacturer, considering the joint R&D investment of two firms to improve the quality of product [11].
Unlike most of the research on patent licensing being studied from the perspective of the patent-holder’s authorization, this paper studies the patent licensee adoption decision and competition from three-stages supply chain, also to develop the optimization algorithm for decision-making, which contributes to literature on patent licensing strategy in the EV cell industry.
The hypothesis of our study is if there is patent holder that owns its EV cell producer and an EV producer which engaged in the downstream competition, the patent holder can choose patent licensing, produce the EV cell for its own EV producer use, or produce EV cell for external EV producer use, or a combination of the above two or three options. Under these scenarios, the patent holder can obtain return through patent licensing royalty or selling EV cell or EV; however, as the competition relationship exist, how to make decision is a complex issue that the adoption is decision making of patentee, which is in dynamic changing as competition exists. In addition, multiple influencing factors in this relationship are nonlinear.
This paper aims to answer the following questions:
- (1)
- How will the relationship of key players evolve under certain innovation diffusion channels if the patent holder also owns the EV cell producer and EV producer?
- (2)
- What is the way to maximize the return of the patent holder considering the adoption decision making, technology features, patent royalty and competition relationship?
To answer the above two questions, we firstly establish the conceptional model to clarify the supply chain structure and innovation diffusion channels [16], the model integrated the patent holder, EV cell producer and EV producers as key players, and then we use evolutionary game analysis, considering the adoption decision making and considering their payoff and its ESS (Evolutionary Stable Strategies) of adoption ratio (innovation diffusion ratio). Furthermore, based on the ESS (Evolutionary Stable Strategies) analysis, we develop an optimization algorithm to find the maximum weighted object function of the patent holder.
3. Conceptional and Mathematical Model
3.1. The Innovation Diffusion Channel of EV Cell
In this paper, from the perspective of the upstream and downstream of the supply chain, we listed the EV cell patent holder, battery producer, vehicle producer, and EV market as the layered innovation diffusion channel structure.
The patent holder developed an innovative EV cell which can have better performance and safety characteristics than its competitors, and the patent holder can produce for its own EV use, and/or produce the EV cell then sold to the external vehicle producers, and/or licensing the patent to the external EV cell producers, which can have competition with external EV cell producers and EV producers, the diffusion channel diagram as shown in Figure 1.
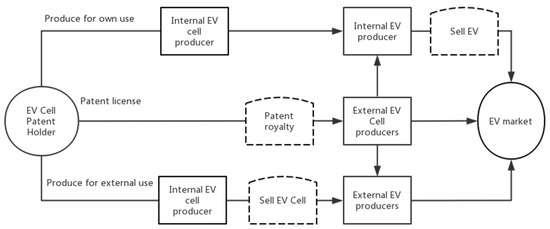
Figure 1.
Innovation diffusion channel of EV cell.
3.2. Hypothesis
(1) Market potential hypothesis: assuming that each electric vehicle is equipped with one set of EV cell, this paper takes the overall potential market size after the long-term evolution, and the actual market size is logistic model based on the competition and reproduction of end user market.
(2) Safety and performance hypothesis: the patented EV cell technology has relative competitive advantage, such as higher safety level, faster charging time, longer battery life, etc., the ratio of market share of patented EV cell is a: the market share; the other competitive EV cell is 1 − a, both range of [0, 1].
(3) Patent licensing hypothesis: EV cell patent holders license patents only to EV cell producers, but not directly to EV producers, and patented EV cell producers can sell to any EV producers without licensing limitation.
(4) Firms hypothesis: Suppose there is one dominant EV cell patent holder in the industry (which owns one EV producer and one EV cell producer), and n EV producers (excluding one battery holder owns EV producer), m EV cell producers (excluding one patent holder own EV cell producer).
(5) Adoption decision-making hypothesis: producers adoption decision-making is rational weighing the benefits and costs [17].
3.3. Payoff of Players
As the relationship between produce for own use and producer for external use is relatively simple, secondly, it is not common to choose to produce for own use and patent license channels at the same time, as there is a conflict of patent holder’s intentions between these two options. Therefore, this paper focused on the analysis of the relationship between produce for own use and patent license options. The pay-off matrix is listed in Table 1 and Table 2, which is EV cell producers and EV producers, respectively.

Table 1.
Pay-off table of EV cell producer.
Table 2.
Pay-off table of EV producer.
The pay-off of each producer is listed in Formulas (1)–(4), the adoption pay-off is impacted by each other, as the market share of market is under competition. The total return of the patent holder is calculated as Formula (5):
To set the parameters for simulation, the initial values are set by the reference of public resources, such as listed EV cell and EV company reports, details are shown in Table 3.
Table 3.
Parameter table.
3.4. Replicator Dynamic Equation
External EV cell producer:
and its derivative equation:
External EV producer:
and its derivative equation:
Based on the replicator dynamic equation and its derivative equation in Formulas (6)–(9), we find the equilibrium point of y and x, also the analysis of the stability of each point, based on the derivative value and conditions, respectively, as shown in Table 4 and Table 5.
Table 4.
Stability table of EV cell producer.
Table 5.
Stability table of EV producer.
4. Simulation
The system dynamic model was established to simulate the proportion x and y variation with time under the impact of different sets of factors, based on the Formulas (6) and (8), the initial values refer to Table 3, the detailed diagram is shown in Figure 2.
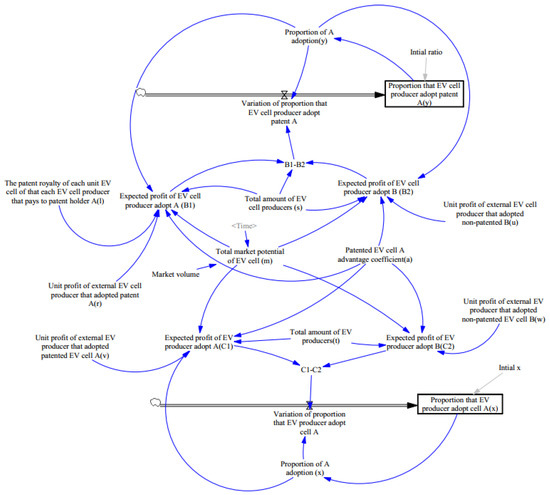
Figure 2.
Dynamic system simulation diagram.
4.1. Sensitivity Analysis of Factor r: Unit Profit of External EV Cell Producer That Adopted Patent A
After adopting patented battery technology of EV cell A, the external EV cell producers pay patent royalty, and the impact of changes in battery sales, profits on the evolution process are simulated. Compared with other battery profits, when the relative profits are small, there will be no external EV cell producers choose to adopt the EV cell patent A. With the increase in profit delivered to the EV cell producer, the innovation diffusion ratio rises to close to 100%, as shown in Figure 3.
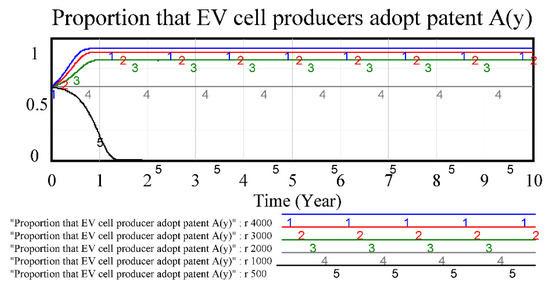
Figure 3.
Sensitivity test of factor r that impacts EV cell producer.
4.2. Sensitivity Analysis of Factor u: Unit Profit of External EV Cell Producer That Adopted Non-Patented B
Similarly, EV cell producers adopt other battery technologies B which need not pay patent royalty, and the diffusion ratio decreases when factor u increases. When the profit of other EV cell is 1000, then the adoption of patent EV is near 90%; when the profit of EV cell B is more than 5000, then the innovation ratio of EV cell A decreases to less than 50%, as shown in Figure 4.
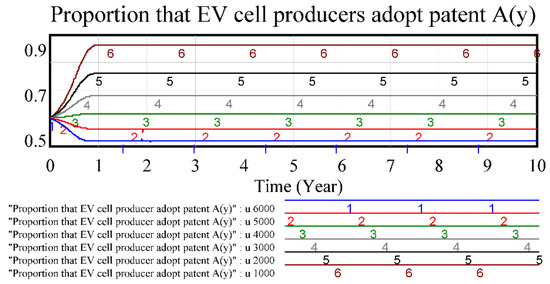
Figure 4.
Sensitivity test of factor u that impacts EV cell producer.
4.3. Sensitivity Analysis of Factor l: The Patent Royalty of Each Unit EV Cell of Each EV Cell Producer That Pays Patent Holder A
When the patent royalty is too high, the rational choice of EV cell producers is not adopting patent technology, and the diffusion ratio decreases with the rise of the patent royalty. For example, when the royalty is 2000, then most EV cell producers will rationally not choose patented EV cell. However, if the royalty is less than 1500, then the innovation diffusion ratio is higher than 60%. The patent royalty played a key role on external EV cell producers adopting patented technology, as shown in Figure 5.
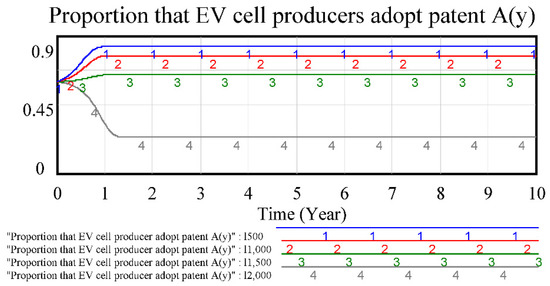
Figure 5.
Sensitivity test of factor l that impacts EV cell producer.
4.4. Sensitivity Analysis of Factor a: Patented EV Cell an Advantage Coefficient
In the case that patent battery can occupy most power battery market under the competition of market, with the changing of the advantage coefficient, most EV cell producers choose to adopt patented battery technology. The patent holder can invest R&D to increase the technology advantages over its competitors’ technology, as the patent licensing strategy can play significant roles on market entry and adoption, as shown in Figure 6.
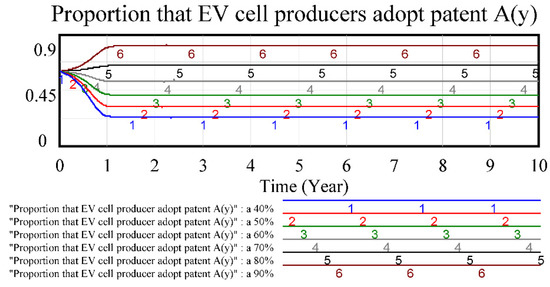
Figure 6.
Sensitivity test of factor a that impacts EV cell producer.
4.5. Sensitivity Analysis of Factor v: Unit Profit of External EV Producer That Adopted Patented EV Cell A
After the external EV producers adopted the patented EV cell products A, the impact of the EV sales profit on the evolution process is analyzed, and the simulation showed that when the profit v has a nonlinear relationship with the diffusion ratio x, the ESS (Evolutionary Stable Strategies) points depends on the relationship of total EV producer numbers, profit v and w. The diffusion ratio x at factor v 900 is higher than when v is from 950 to 1000, but lower than when v is 1500; the diffusion x at v 950 is lower than when v is 900, 980, 1000 and 1500, as shown in Figure 7.
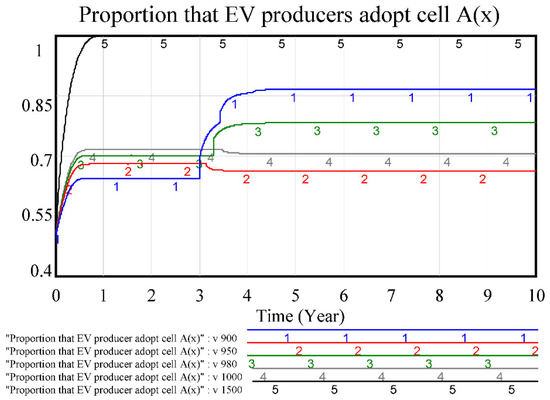
Figure 7.
Sensitivity test of factor v that impacts EV producer.
4.6. Sensitivity Analysis of Factor w: Unit Profit of External EV Producer That Adopted Non-Patented EV Cell B
Similarly, as the competitive product of EV cell A, if the external EV producers adopted the non-patented EV cell products B, the impact of the EV sales profit on the evolution process is analyzed, and the simulation showed that the external EV producers have incentive to adopt EV cell B if the profit is significant. The diffusion ratio of patented EV cell increases when profit w decreases from 2100 to 1000; however, the diffusion ratio was at ESS (Evolutionary Stable Strategies) point when w is 2200 is higher than 2100, which is a reverse relationship compared with when w is in range from 2100 to 1000, as shown in Figure 8.
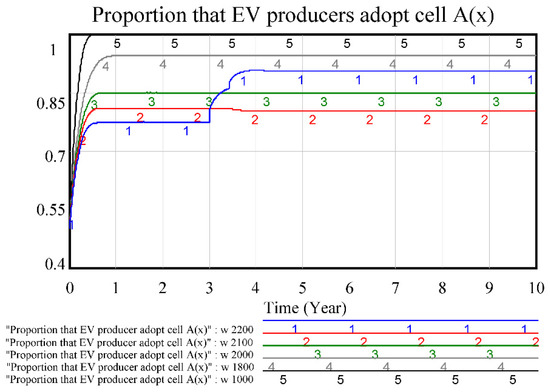
Figure 8.
Sensitivity test of factor w that impacts EV producer.
5. Optimization Algorithm
For patent holder firm, optimal licensing strategy is a critical decision-making [18]. The decision-making space includes three major directions: adjusting patent royalty, indirectly affecting the profit of patented battery A of EV cell producers and increasing the advantage coefficient by investment in R&D. Thus, the objective function can be weighted objective function based on adoption ratio and patent holder’s profit. The lower limit of adoption ratio in the objective function can be set by enterprises, such as expecting more than 50% of EV cell producers adopting the patent technology A, so as to achieve a wider diffusion of innovation.
Due to the limitation of simulation on changing parameters, it is necessary to solve the maximum value of the objective function in the three-dimensional strategy space through the targeted optimization algorithm.
The following is the Algorithm 1:
| Algorithm 1 Optimization algorithm pseudo code |
|
In Table 6, the weighted object function = 0.8 × profit/max potential market + 0.2 × diffusion ratio, the step of unit profit of EV cell producer is 1000, range (1000, 4000), the step of patent royalty is 1000, range (500, 3500), the advantage coefficient step is 20%, in range [0.2, 0.8], and the lower limit of diffusion ratio is 50%.
Table 6.
Local and global optimization object function of EV patent holder.
The maximum weighted object function is 1.24, which under 80% advantage ratio, with 3500 patent royalty and 4000 unit profit that can delivered to EV cell producer.
6. Conclusions
This paper tried to explain that how to maximize the patent holder’s return by patent license strategy under different innovation diffusion channels, and we found that under the condition of participating in the market competition of downstream firms, patent holder return is influenced by the vertical and horizontal dynamic relationship among the downstream firms. The vertical competition reduced the return from product sales profits, while patent licensing royalty increased the patent holder’s return. The downstream producers return is impacted by patent royalty, profit that adopts different technology, number or proportion of adopted producers, and patented technology advantage coefficient, which changed the final ESS and diffusion ratio. The diffusion ratio is also one of the factors that impacts the patent holder’s return. According to the analysis of evolutionary stability strategy, it was found that EV cell producers’ patent royalty, profits of different EV cells and advantage coefficient are key factors. The profit of the patent holder is affected by the sales profits, patent royalty, advantage coefficients and diffusion ratio.
The innovation points of this paper mainly include the following aspects, which extends the previous literature research methods in the EV cell industry; firstly, the EV cell industry supply chain structure is different than other industries such as electronic product in the previous literature, and the patent licensing relationship and competition from three-stages supply chain of EV cell industry which the players and its competition relationship are explored. Secondly, this paper studied the patent licensee adoption decision, considering the evolutionary game analysis. Thirdly, an optimization algorithm for decision making of patent holders that considers key factors and ESS (Evolutionary Stable Strategies) strategy of key players would contribute to the literature on patent licensing strategy in the EV cell industry.
- (1)
- Based on the diffusion theory of technological innovation, a multistage and multichannel diffusion model of technological innovation is constructed, which unifies horizontal and vertical innovation diffusion, comprising a patent holder and downstream players.
- (2)
- From the point of view of a multiparty game of three-layered supply chain of patent holder, EV cell producers and EV producers, this paper analyzes the dynamic game relationship of the players under different technological innovation diffusion channels, such as patent license, produce for own use, and produce for external uses, based on the integrated model, and analyzes the influence of different parameters on evolutionary stability strategy.
- (3)
- An optimization algorithm based on weighted object functions is developed to solve local and global optimal solutions under different decision parameter spaces, and the weight and step size can be adjusted accordingly to meet the varying needs of different firms’ criteria.
Nevertheless, there are some limitations of this study: innovation and innovation diffusion are complex processes impacted by technology, institution, adopters, the interaction and interplay among the stakeholder; the adopter’s decision making can be heterogeneous and can also be impacted by the network structure; in addition, the simulation is not real data from certain companies rather than average values referred to open data sources such as stock market documents. For certainty, we could perform the empirical data collection and case analysis based on the model and simulation, this can be further discussed with certain EV cell and EV producers; therefore, future research will be extended from these perspectives.
Author Contributions
Conceptualization, W.S. and Z.Z.; methodology, W.S.; software, W.S.; validation, Z.Z.; formal analysis, W.S.; investigation, W.S.; resources, Z.Z.; data curation, W.S.; writing—original draft preparation, W.S.; writing—review and editing, W.S.; visualization, W.S.; supervision, Z.Z.; project administration, Z.Z.; funding acquisition, Z.Z. All authors have read and agreed to the published version of the manuscript.
Funding
This research was funded by National Natural Science Foundation of China, grant number 71371124.
Institutional Review Board Statement
Not applicable.
Informed Consent Statement
Not applicable.
Data Availability Statement
Not applicable.
Acknowledgments
We would like to thank editors and reviewers very much for their valuable comments in improving this article.
Conflicts of Interest
The authors declare that they have no known competing financial interests or personal relationships that could have appeared to influence the work reported in this paper.
References
- Loučanová:, E.; Šupín, M.; Čorejová, T.; Repková-Štofková, K.; Šupínová, M.; Štofková, Z.; Olšiaková, M. Sustainability and Branding: An Integrated Perspective of Eco-innovation and Brand. Sustainability 2021, 13, 732. [Google Scholar] [CrossRef]
- Loucanova, E.; Parobek, J.; Kalamarova, M.; Palus, H.; Lenoch, J. Eco-innovation performance of Slovakia. Procedia Econ. Financ. 2015, 26, 920–924. [Google Scholar] [CrossRef] [Green Version]
- Chen, J.Y.; Dimitrov, S. Eco-innovation with opportunity of licensing and threat of imitation. J. Clean. Prod. 2017, 147, 306–318. [Google Scholar] [CrossRef]
- Chuffart-Finsterwald, S. Patent Markets: An Opportunity for Technology Diffusion and FRAND Licensing? Marq. Intellect. Property L. Rev. 2014, 18, 335. [Google Scholar]
- Liu, J.; Sun, R.; Liu, F. Outsourcing strategy with patent licensing in an electronic product supply chain. IEEE Access 2021, 8, 98359–98368. [Google Scholar] [CrossRef]
- Bagchi, A.; Mukherjee, A. Technology licensing in a differentiated oligopoly. Int. Rev. Econ. Financ. 2014, 29, 455–465. [Google Scholar] [CrossRef] [Green Version]
- Hill, C.W. Strategies for Exploiting Technological Innovations: When and When Not to License. Organ. Sci. 1992, 3, 428–441. [Google Scholar] [CrossRef]
- Wang, X.H. Fee versus royalty licensing in a Cournot duopoly model. Econ. Lett. 1998, 60, 55–62. [Google Scholar] [CrossRef]
- Wu, C.H. Price competition and technology licensing in a dynamic duopoly. Eur. J. Oper. Res. 2018, 267, 570–584. [Google Scholar] [CrossRef]
- Yang, F.; Jiao, C.; Ang, S. The optimal technology licensing strategy under supply disruption. Int. J. Prod. Res. 2019, 57, 2057–2082. [Google Scholar] [CrossRef]
- Zhang, Q.; Zhang, J.; Zaccour, G.; Tang, W. Strategic technology licensing in a supply chain. Eur. J. Oper. Res. 2018, 267, 162–175. [Google Scholar] [CrossRef]
- Fang, Y.; Wei, W.; Mei, S.; Chen, L.; Zhang, X.; Huang, S. Promoting electric vehicle charging infrastructure considering policy incentives and user preferences: An evolutionary game model in a small-world network. J. Clean. Prod. 2020, 258, 120753. [Google Scholar] [CrossRef]
- Thomas, V.J.; Maine, E. Market entry strategies for electric vehicle start-ups in the automotive industry–Lessons from Tesla Motors. J. Clean. Prod. 2019, 235, 653–663. [Google Scholar] [CrossRef]
- Kang, B.; Motohashi, K. Essential intellectual property rights and inventors’ involvement in standardization. Res. Policy 2015, 44, 483–492. [Google Scholar] [CrossRef]
- Kim, D.; Lee, H.; Kwak, J. Standards as a driving force that influences emerging technological trajectories in the converging world of the Internet and things: An investigation of the M2M/IoT patent network. Res. Policy 2017, 46, 1234–1254. [Google Scholar] [CrossRef] [Green Version]
- Rogers, E.M. The Diffusion of Innovations; Free Press: Glencoe, IL, USA, 1962. [Google Scholar]
- Wang, J.; Xu, X.; Krishnan, V. Decision Structure and Performance of Networked Technology Supply Chains. Manuf. Serv. Oper. Manag. 2017, 20, 99–216. [Google Scholar] [CrossRef] [Green Version]
- Yan, Q.; Yang, L. Optimal licensing in a differentiated Bertrand market under uncertain R&D outcomes and technology spillover. Econ. Model. 2018, 68, 117–126. [Google Scholar]
Publisher’s Note: MDPI stays neutral with regard to jurisdictional claims in published maps and institutional affiliations. |
© 2021 by the authors. Licensee MDPI, Basel, Switzerland. This article is an open access article distributed under the terms and conditions of the Creative Commons Attribution (CC BY) license (https://creativecommons.org/licenses/by/4.0/).