1. Summary
This study quantifies the economic impact of electric trucks on a $/mile basis for fleet operators compared to diesel-powered trucks. Different vehicle classes and component sizes will be considered to determine which application and design are most likely to achieve ownership cost parity with diesel trucks. In addition, sensitivities related to the cost of the battery, fuel, and electricity affecting the economic viability of electric trucks will be assessed. Class 4 delivery trucks will be considered as an example to demonstrate how design choices and use cases affect electric truck purchase price and efficiency. We will demonstrate that, while a short payback period is possible for electric trucks, a full utilization of the battery energy is critical.
2. Introduction
Several studies and reports predict that the medium duty and heavy duty market will be ready for electric vehicles in the near future [
1,
2,
3]. Löfstrand et al. assigned future fuel prices to establish a time frame for electric truck adoption in the European market. North American Council for freight efficiency has stated that electric trucks are a viable choice for ‘return to base’ urban operations where the range is predictable and economic overnight charging is possible [
4,
5]. Instead of using prototype or early battery electric vehicles (BEVs) in the markets, this study examines simulated models of electric trucks with similar performance and cargo capacity to conventional trucks. The work quantifies the monetary impact for the vehicle owners due to changes in fuel and energy prices. This paper will also examine the importance of reducing battery cost for achieving the parity in Total Cost of Ownership (TCO).
United States Department of Energy expects to bring down battery pack cost to
$125/kWh within a few years and reduce it to less than
$100/kWh in the long term [
6]. This work will help us understand how lower battery cost, combined with fuel and energy prices, will shape the commercially viable rollout of electric trucks in the US market.
The commercial feasibility of BEVs depends on various factors, starting with vehicle specifications, use cases, cost of electricity, and fossil fuels. The importance of appropriate sizing of the battery was discussed by Neubauer et al. [
7] as well as Feng et al. [
8]. This work includes the sensitivity to the daily driving range and examines how the TCO changes if we were to design the vehicle specifically for lower or higher ranges. Understanding the sensitivity of TCO to each of these factors allows fleets to decide when it would be appropriate to adopt these new vehicles.
In the US, commercial trucks are primarily classified according to their weight class. The vocation for which trucks are designed serves as a secondary classification. The truck usage determines its requirements in terms of cargo mass, driving speed, range, electrical, and mechanical accessories, etc. The vehicle technical specifications, in turn, determines the powertrain component size requirements. In this study, we studied 5 trucks across multiple classes and applications. To ensure a fair comparison between two powertrains, a set of common performance criteria was established for each type of truck, as shown in
Table 1.
Both diesel trucks and electric truck’s powertrain components are sized to match or exceed the acceleration and speed requirements. The range specified in the above table is the minimum distance the trucks are expected to drive before stopping for refueling or recharging the battery packs. It was estimated from various real-world surveys, such as Vehicle Inventory and Use Survey (VIUS) [
9] and FleetDNA [
10], as well as feedback from the industry. The default tank sizes on diesel trucks allow those trucks to exceed this distance easily. Electric trucks are designed with battery packs to match the range requirement.
This study uses Autonomie [
11] to model and simulates the different vehicle designs considered. Autonomie is a commercially available simulation tool that includes vehicle models for all these trucks and provides the component and control libraries for modeling conventional and electric variants. The powertrain sizing logic used to size the powertrain components is described in a prior work [
12]. To simplify the cost and weight estimates, it is assumed that parts of the vehicle not directly related to the powertrain, such as chassis, body, wheels, etc. will remain unchanged between the conventional and electric trucks. The component sizes for each truck are summarized in
Table 2.
For all five vehicles, the engine size of the conventional vehicle is comparable to that found in production vehicles. Medium duty trucks often span multiple weight classes and share the same engine. This paper explores the cost of owning these trucks and examines the necessary price points for diesel, electricity, and energy storage systems for electric trucks to be economically attractive.
3. Vehicle Purchase Price
3.1. Main Component Costs
The manufacturing cost assumptions used in this study are described in the following section. We assume that the batteries and electric machines used for light-duty applications will have to be redesigned to withstand the more demanding duty cycles expected in trucks. Current batteries manufacturing cost is estimated at
$270/kWh, if they are produced in sufficient volume. However, for trucks, the production volume is expected to be low, at least in the initial years, and this could result in a higher
$/kWh value for those packs. This study considers battery cost ranging from
$350/kWh to
$80/kWh to examine the sensitivity. The baseline cost values for various components such as batteries and motors are summarized in
Table 3. These values are based on the assumptions and calculations explained in an earlier report from Argonne National Laboratory [
13].
3.2. Vehicle Purchase Price Estimation
Vehicle cost is estimated by adding up the manufacturing cost of the components and applying a retail price equivalent factor. For truck application, this factor is assumed to be 1.2. In this analysis, we do not assume any grants or incentives for electric trucks. The estimated purchase price of trucks considered in this study is shown in
Table 4.
It should be noted that these values are provided as an example of the difference in vehicle costs. As we change the component cost assumptions in the sensitivity analysis, these values will change.
4. Vehicle Energy Consumption
Fuel costs play an important part in the overall truck operational cost. For class 8 sleeper trucks, the fuel cost could even outweigh the truck purchase price. The vehicle energy consumption is measured on three separate drive cycles, as prescribed by U.S. EPA in their proposed regulatory framework for medium and heavy duty vehicles [
14]. Two of these cycles represent highway driving, and the third cycle represents the transient driving observed in urban conditions. Based on the purpose for which each truck is used, the results from the three drive cycles are weighted differently. The weighing method put forth by U.S. EPA considers the share of vehicle operation within each cycle. For example, the Class 8 Sleeper trucks run mostly on highways. Thus for that type of truck, higher weight is given to the two cycles representing highway operations, and only 5% weightage is given to the transient operations. The weighted fuel consumption for each truck used to examine its economic viability is summarized
Table 5. The electrical consumption values are converted to diesel equivalent fuel economy for easy comparison.
Fuel Cost
Since predicting future fuel cost is difficult, BEVs economic viability is examined for a range of diesel and electricity prices. Diesel cost varies from $2.5/gallon to $4/gallon while electricity cost varies from 10 c/kWh to 30 c/kWh. When combined with the different battery prices, we can determine under which conditions BEVs will become economically attractive.
5. TCO Analysis
This section quantifies the difference between diesel and electric truck ownership costs. Some TCO factors, such as driver wages, registration costs, tolls, etc., are assumed to be identical across vehicle designs. The two main factors are
In the commercial truck market any technology will have to be economically viable for achieving wider acceptance by fleets. TCO expressed as
$/mile is widely used as a metric to measure this economic feasibility. Many industry groups [
5,
15] use this metric and have quantified the cost of operating trucks in US. Thus, this work will be using a similar approach for comparing the economic feasibility of BEVs and compare that with the ownership cost of conventional trucks.
5.1. Annual Vehicle Miles Travelled (VMT) Assumption
We assume the vehicles are used for 20 days a month for the designed daily driving distance for the entire service period. This gives us VMT estimates shown in
Table 1. It is assumed that battery replacement will not be needed during the service period of the vehicle. Later sections of the paper will examine the impact of VMT on TCO parity.
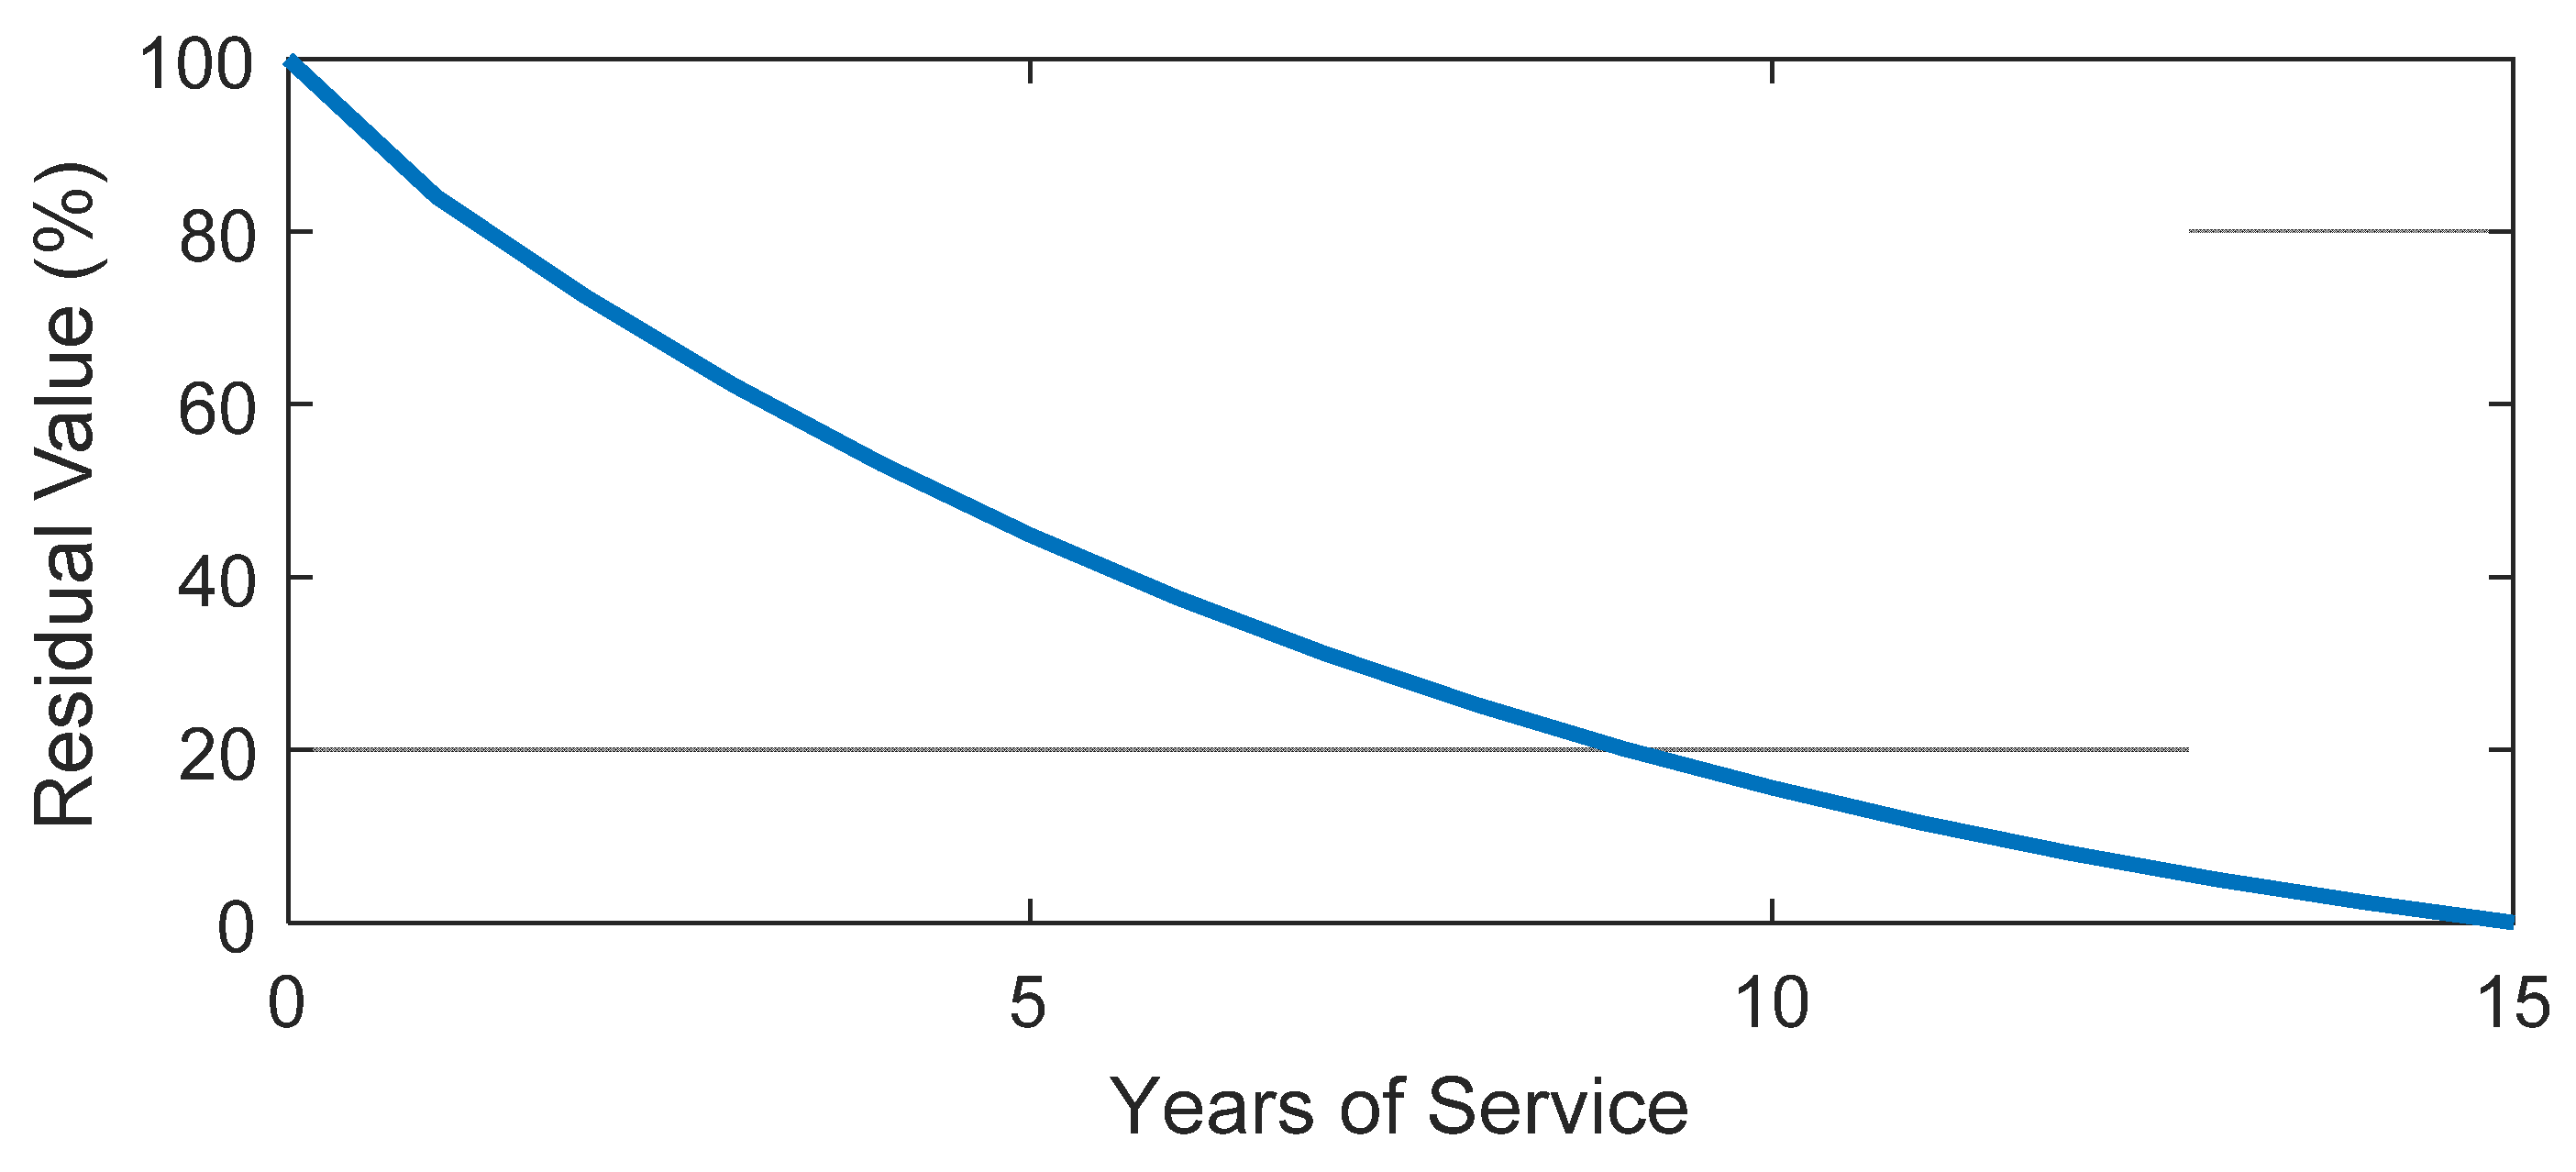
5.2. Vehicle Service Period Assumption
The service period changes for different types of trucks. The vehicle lifetime is expected to be 15 years for all trucks except Class 8 Sleeper. Typical sleeper trucks are used for long haul for less than 5 years. After the initial 5 years, they get used in regional or short-haul operations. We assume the sleeper trucks to have a residual value of 45% of purchase price when the fleets dispose of them at the end of 5 years. If trucks are used for their full lifetime of 15 years, there is no residual value expected at the end of their service period. The variation of residual values as a function of the service time is shown in
Figure 1.
With the assumptions shown in
Table 6, Autonomie estimates that the sum of the purchase price and fuel costs over the service period for a class 8 sleeper is
$0.62/mile. This is similar to the estimate made by American Transportation Research Institute (ATRI) as well [
15].
The actual cost of battery packs, diesel, and electricity charges could vary for every fleet. The range considered here would help account for such variations.
6. Results
This section summarizes the TCO parity comparison for all trucks. Sensitivity related to battery and energy cost, along with daily trip distance and associated electric range, will be considered. Based on
Figure 2,
Figure 3 and
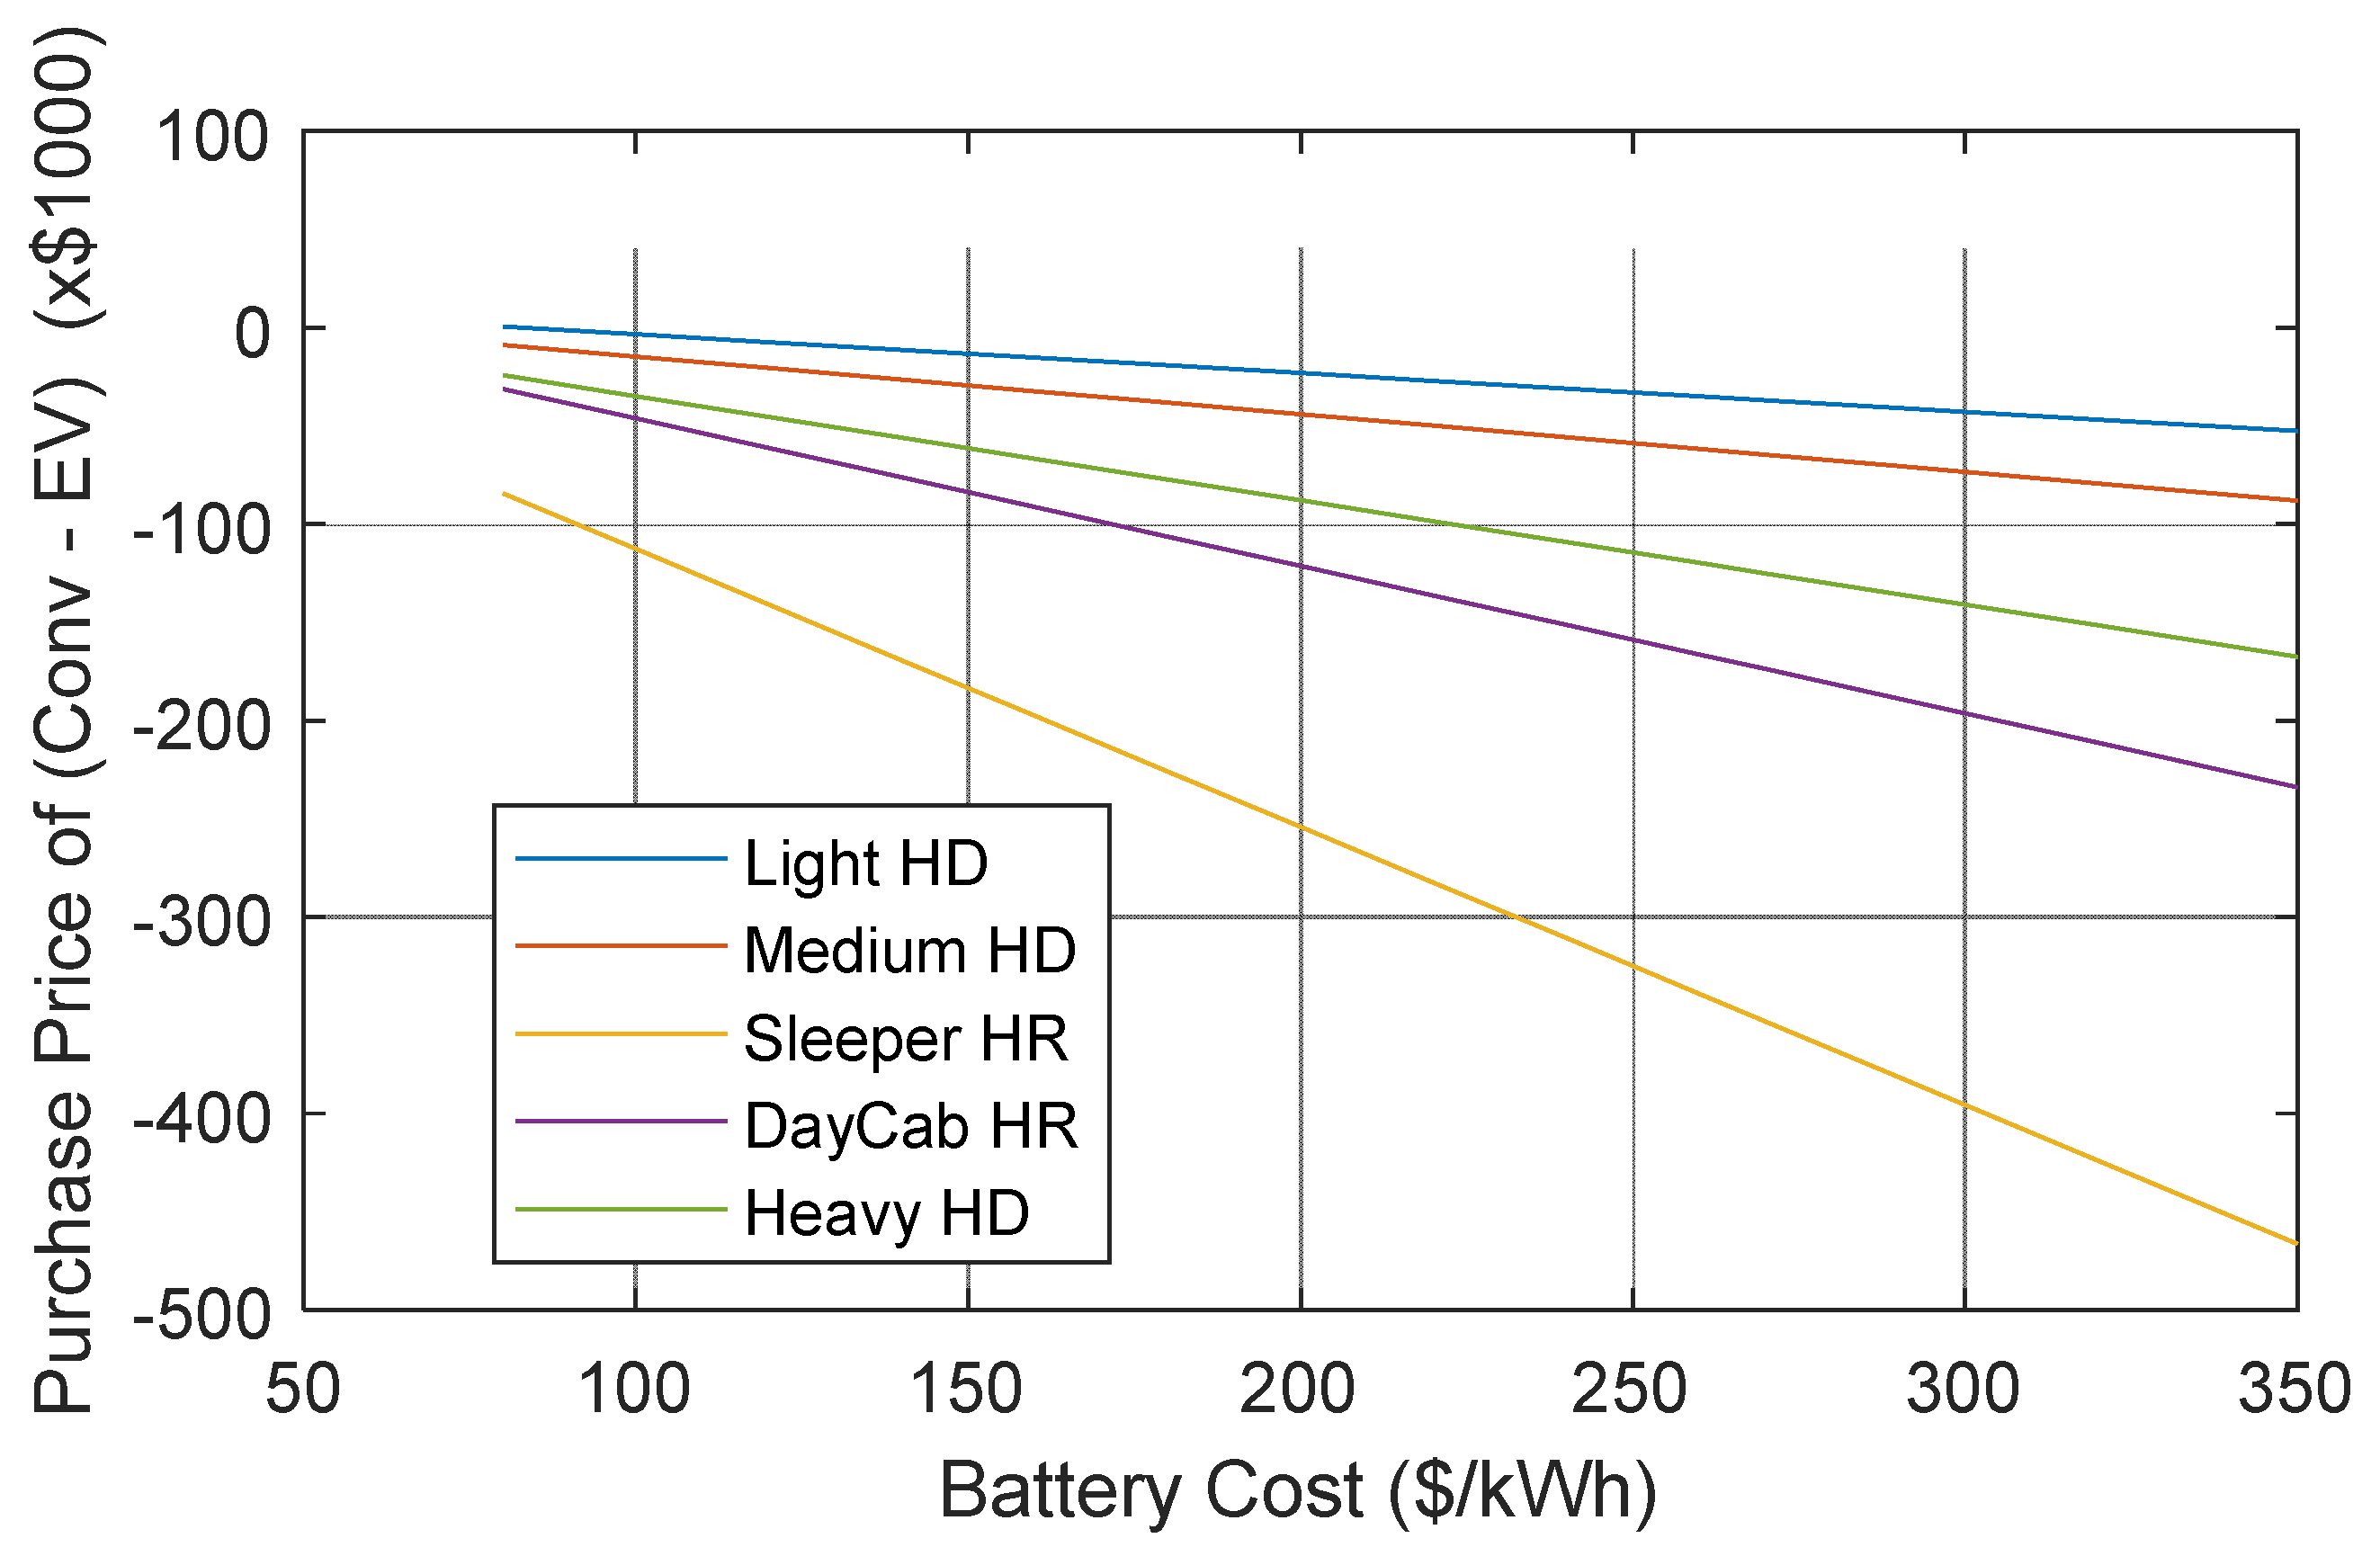
Figure 4, it can be inferred that among the vehicles considered, the most promising candidate to achieve purchase price parity with diesel trucks is the smaller (Classes 2 to 4) electric delivery trucks. Classes 5–6 and larger trucks face a tougher challenge due to the need for larger battery packs.
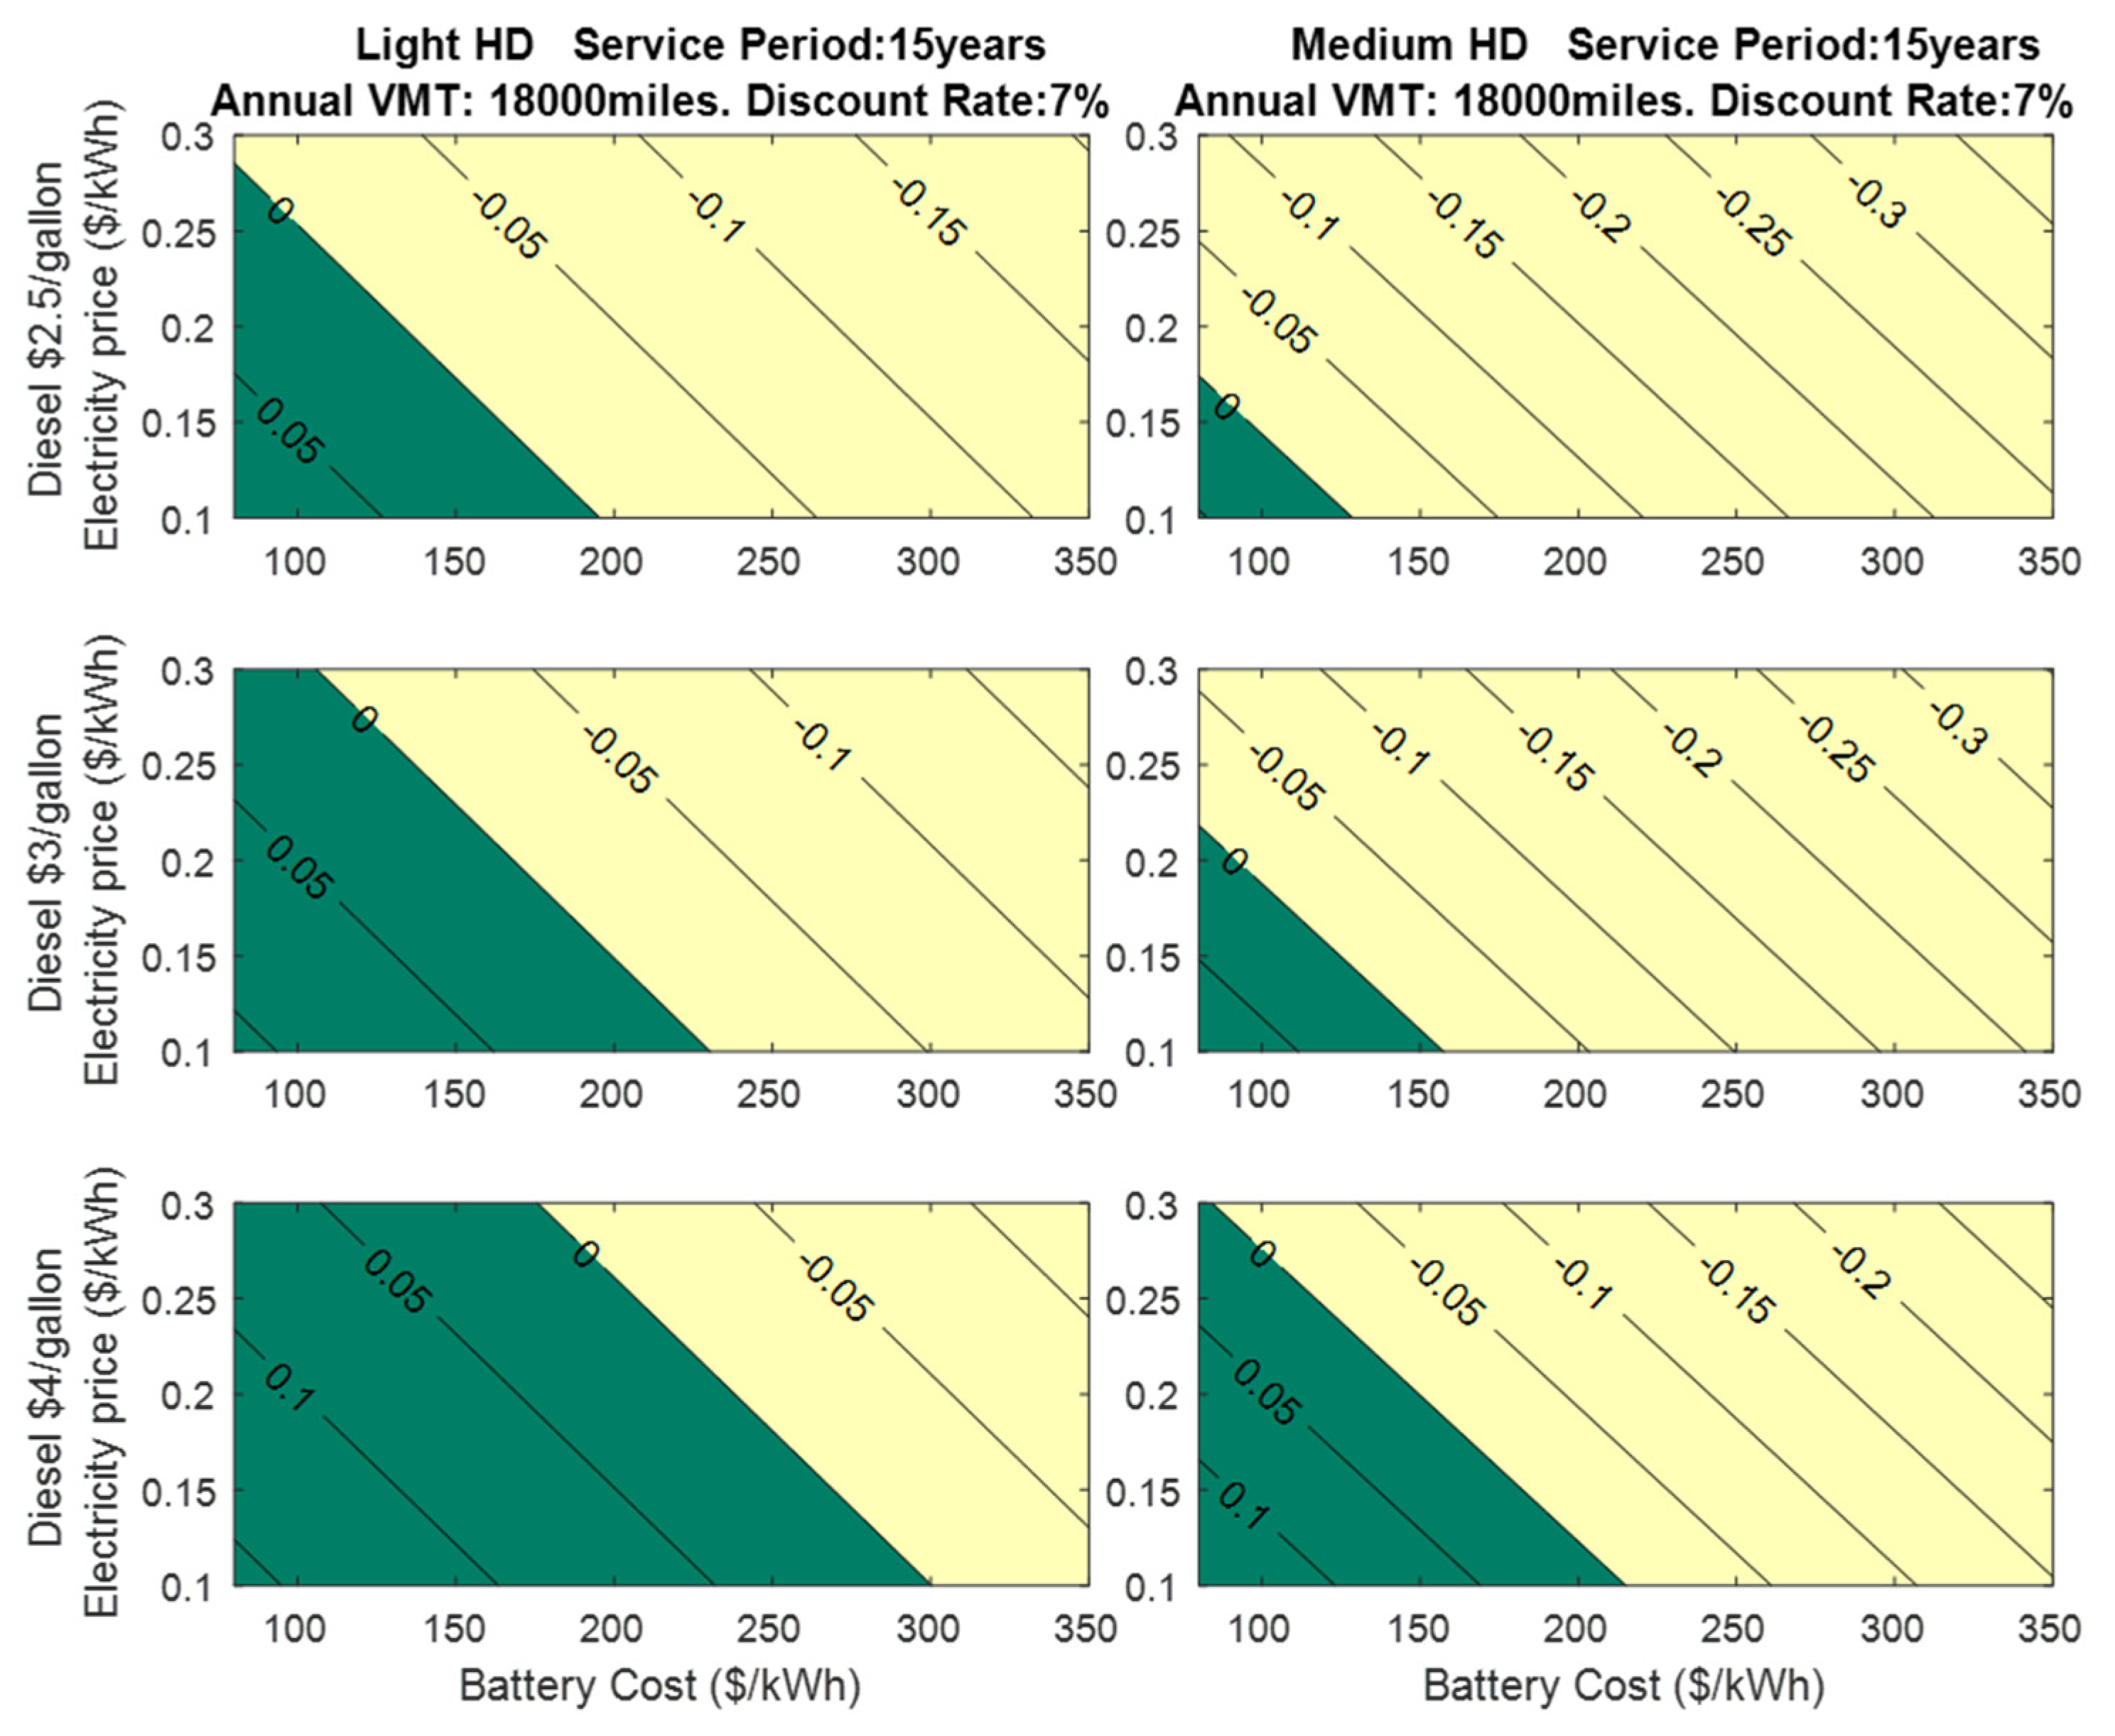
Figure 2 shows the difference in purchase price between diesel and electric trucks. Values under zero show that EVs are more expensive than diesel trucks. Light HD trucks could see purchase price parity when battery pack cost drops to
$80/kWh. Light HD trucks can achieve TCO parity with diesel even with costlier battery packs, as shown in
Figure 3.
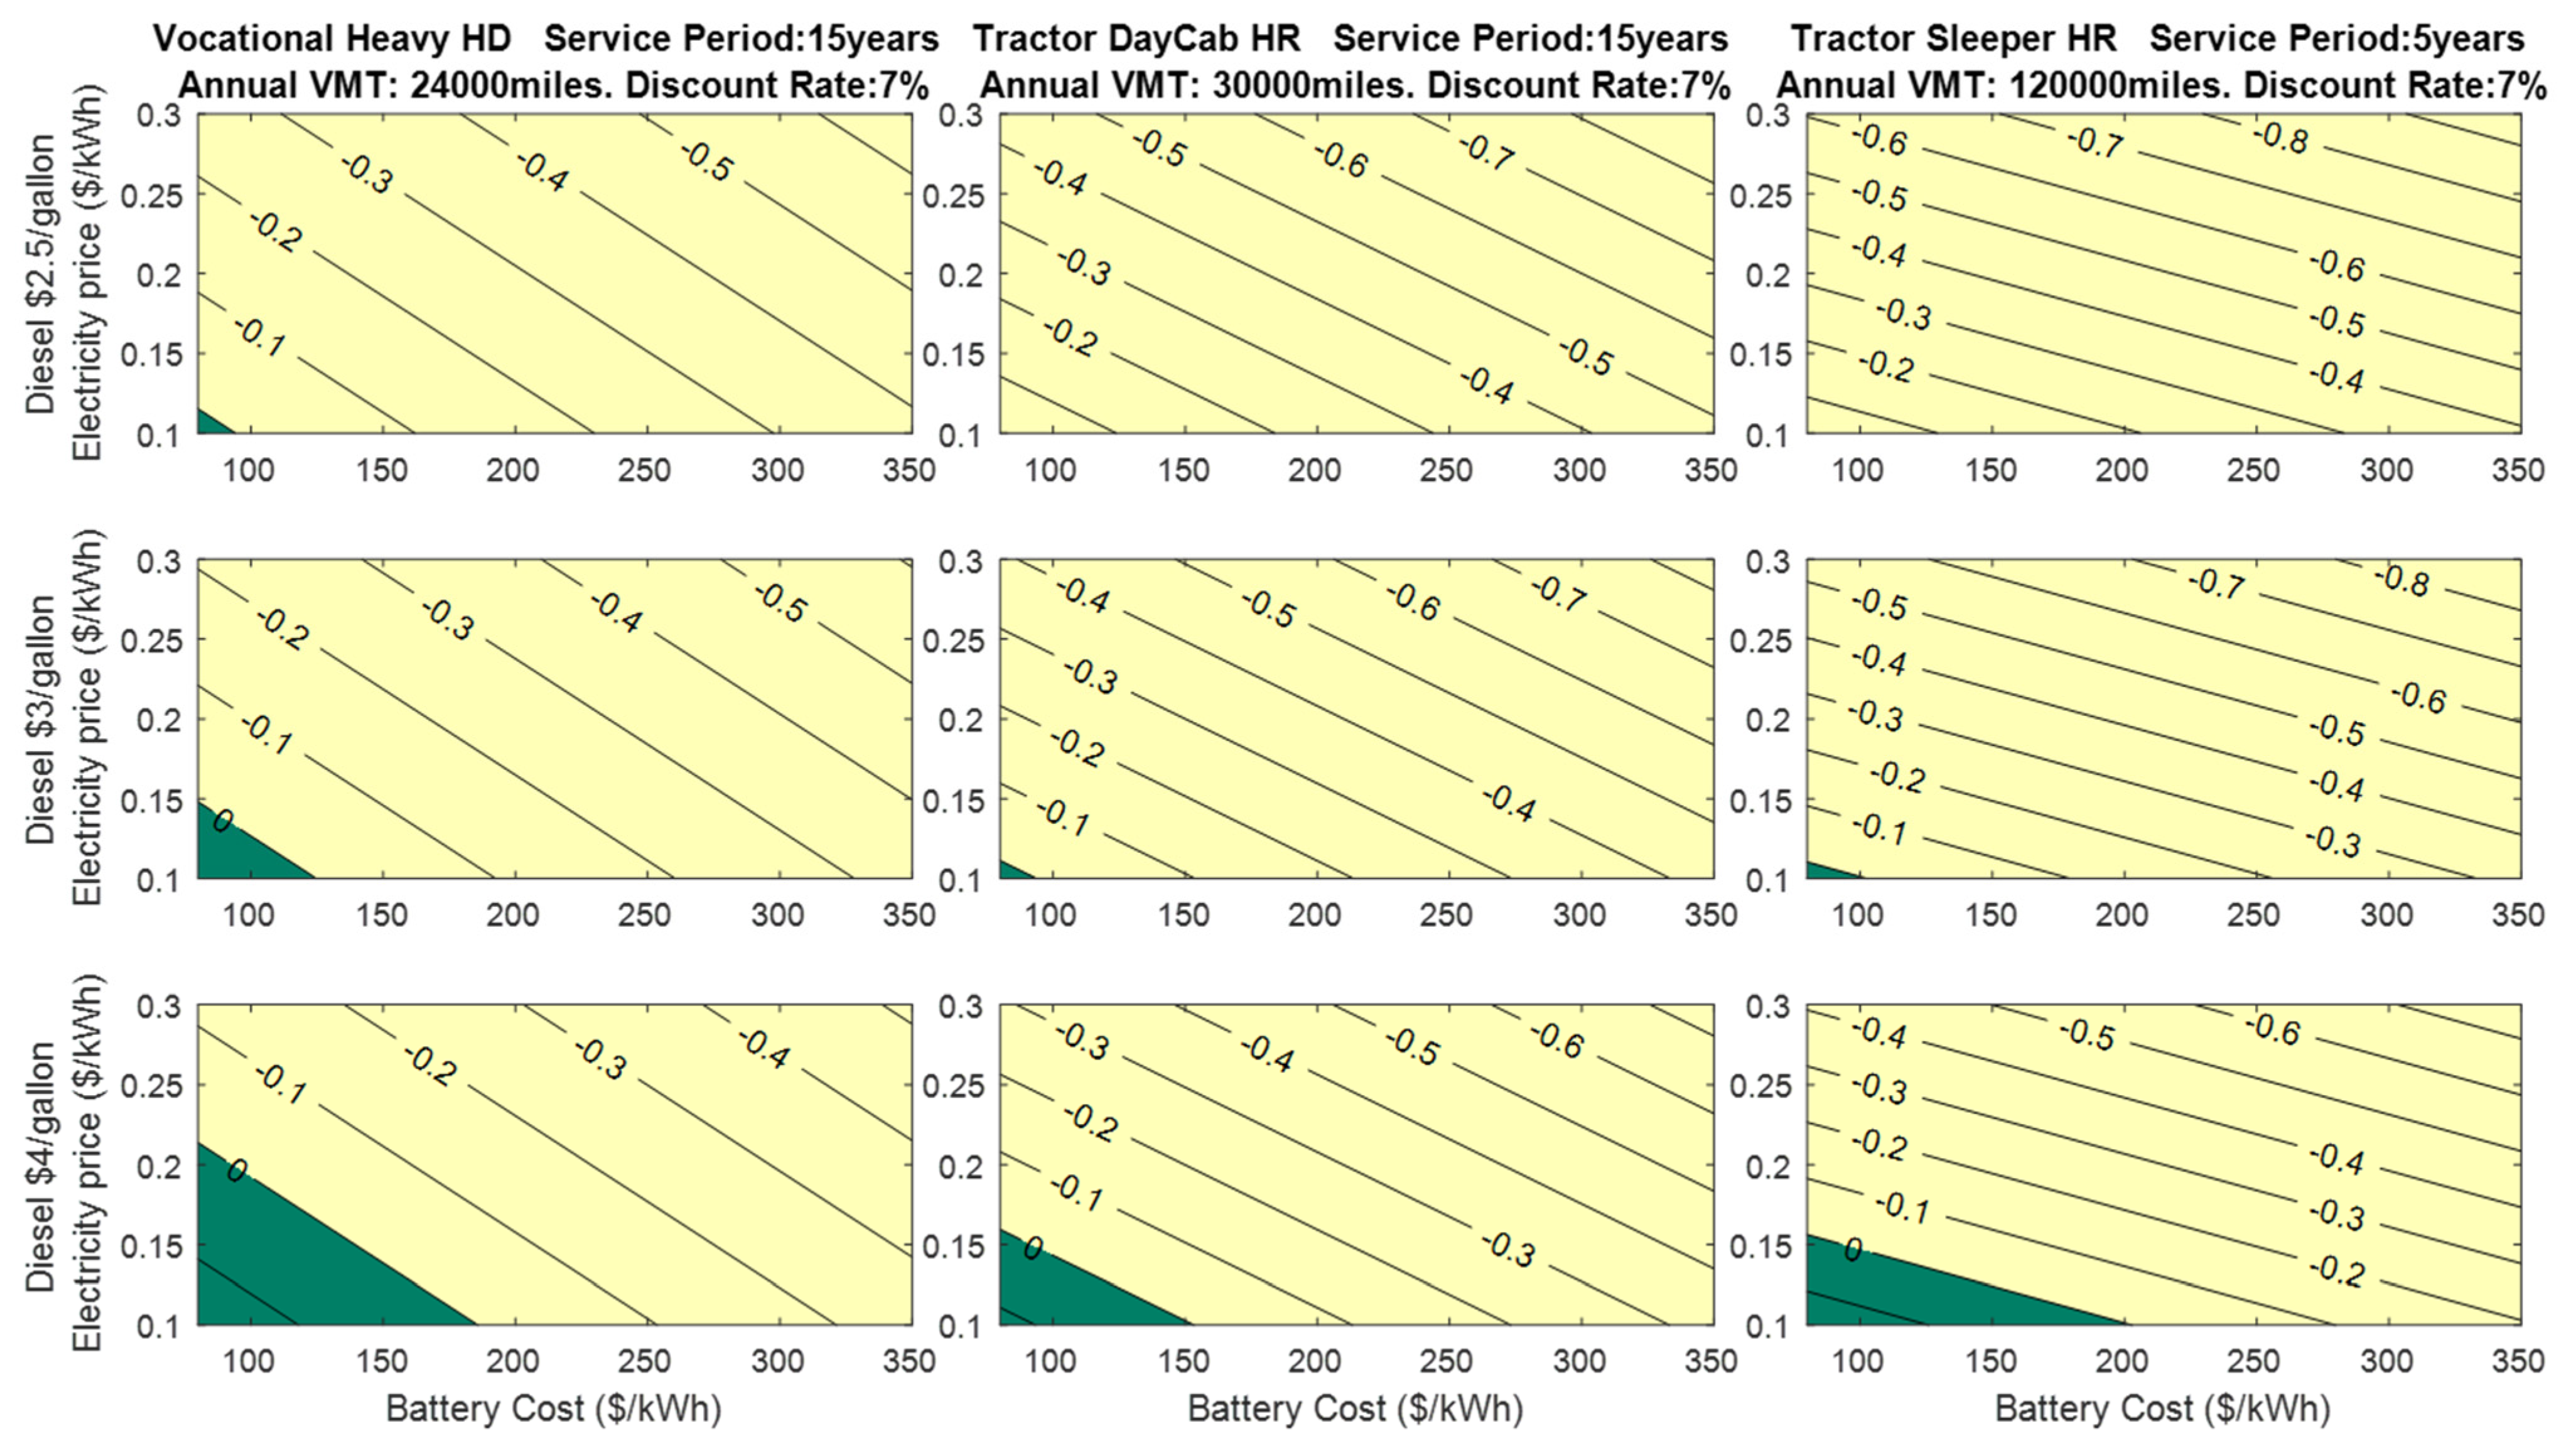
The profit or loss associated with operating an electric delivery truck is quantified in terms of $/mile in this figure. The green region indicates conditions where the electric truck is profitable. With present diesel prices at $3/gallon, class4 (Light HD) delivery trucks could see TCO parity if the battery pack cost is at $225/kWh.
Figure 4 shows a similar analysis for class 8 trucks designed as Vocational, DayCab, and Sleeper. The heavier electric trucks in this analysis will be cost-effective only if battery pack cost drops under
$100/kWh or if diesel prices rise to
$4/gallon or higher.
This shows that for today’s diesel price and cost of batteries, early adopters of these vehicles might incur a loss varying from 5 c/mile to 30 c/mile based on the type of truck they operate if they do not receive any grants or tax incentives to offset the cost of acquiring these trucks.
6.1. Impact of Driving Range and Daily Trip Distance on TCO
The above figures show purchase price parity will be difficult to achieve for most trucks even if the battery pack cost reaches the lower limits considered in this study. This means that fuel savings are critical to achieving TCO parity. Fuel savings are directly linked to the distance driven by the trucks. This brings the focus to the assumptions electric truck will be driven for the full designed driving range during its service period.
If the daily trip distance is shorter than the designed electric range, it means that the expensive battery pack in EVs are not being fully utilized. The price of diesel trucks is largely unaffected by such variations in daily trip distance. If the daily trip distance is lower than the designed range of the EV, it reduces the potential for fuel savings and makes an EV less economically attractive. For this analysis, we will focus on class 4 delivery vans and the class 8 Daycab trucks. We will examine how the TCO parity is affected if VMT is reduced.
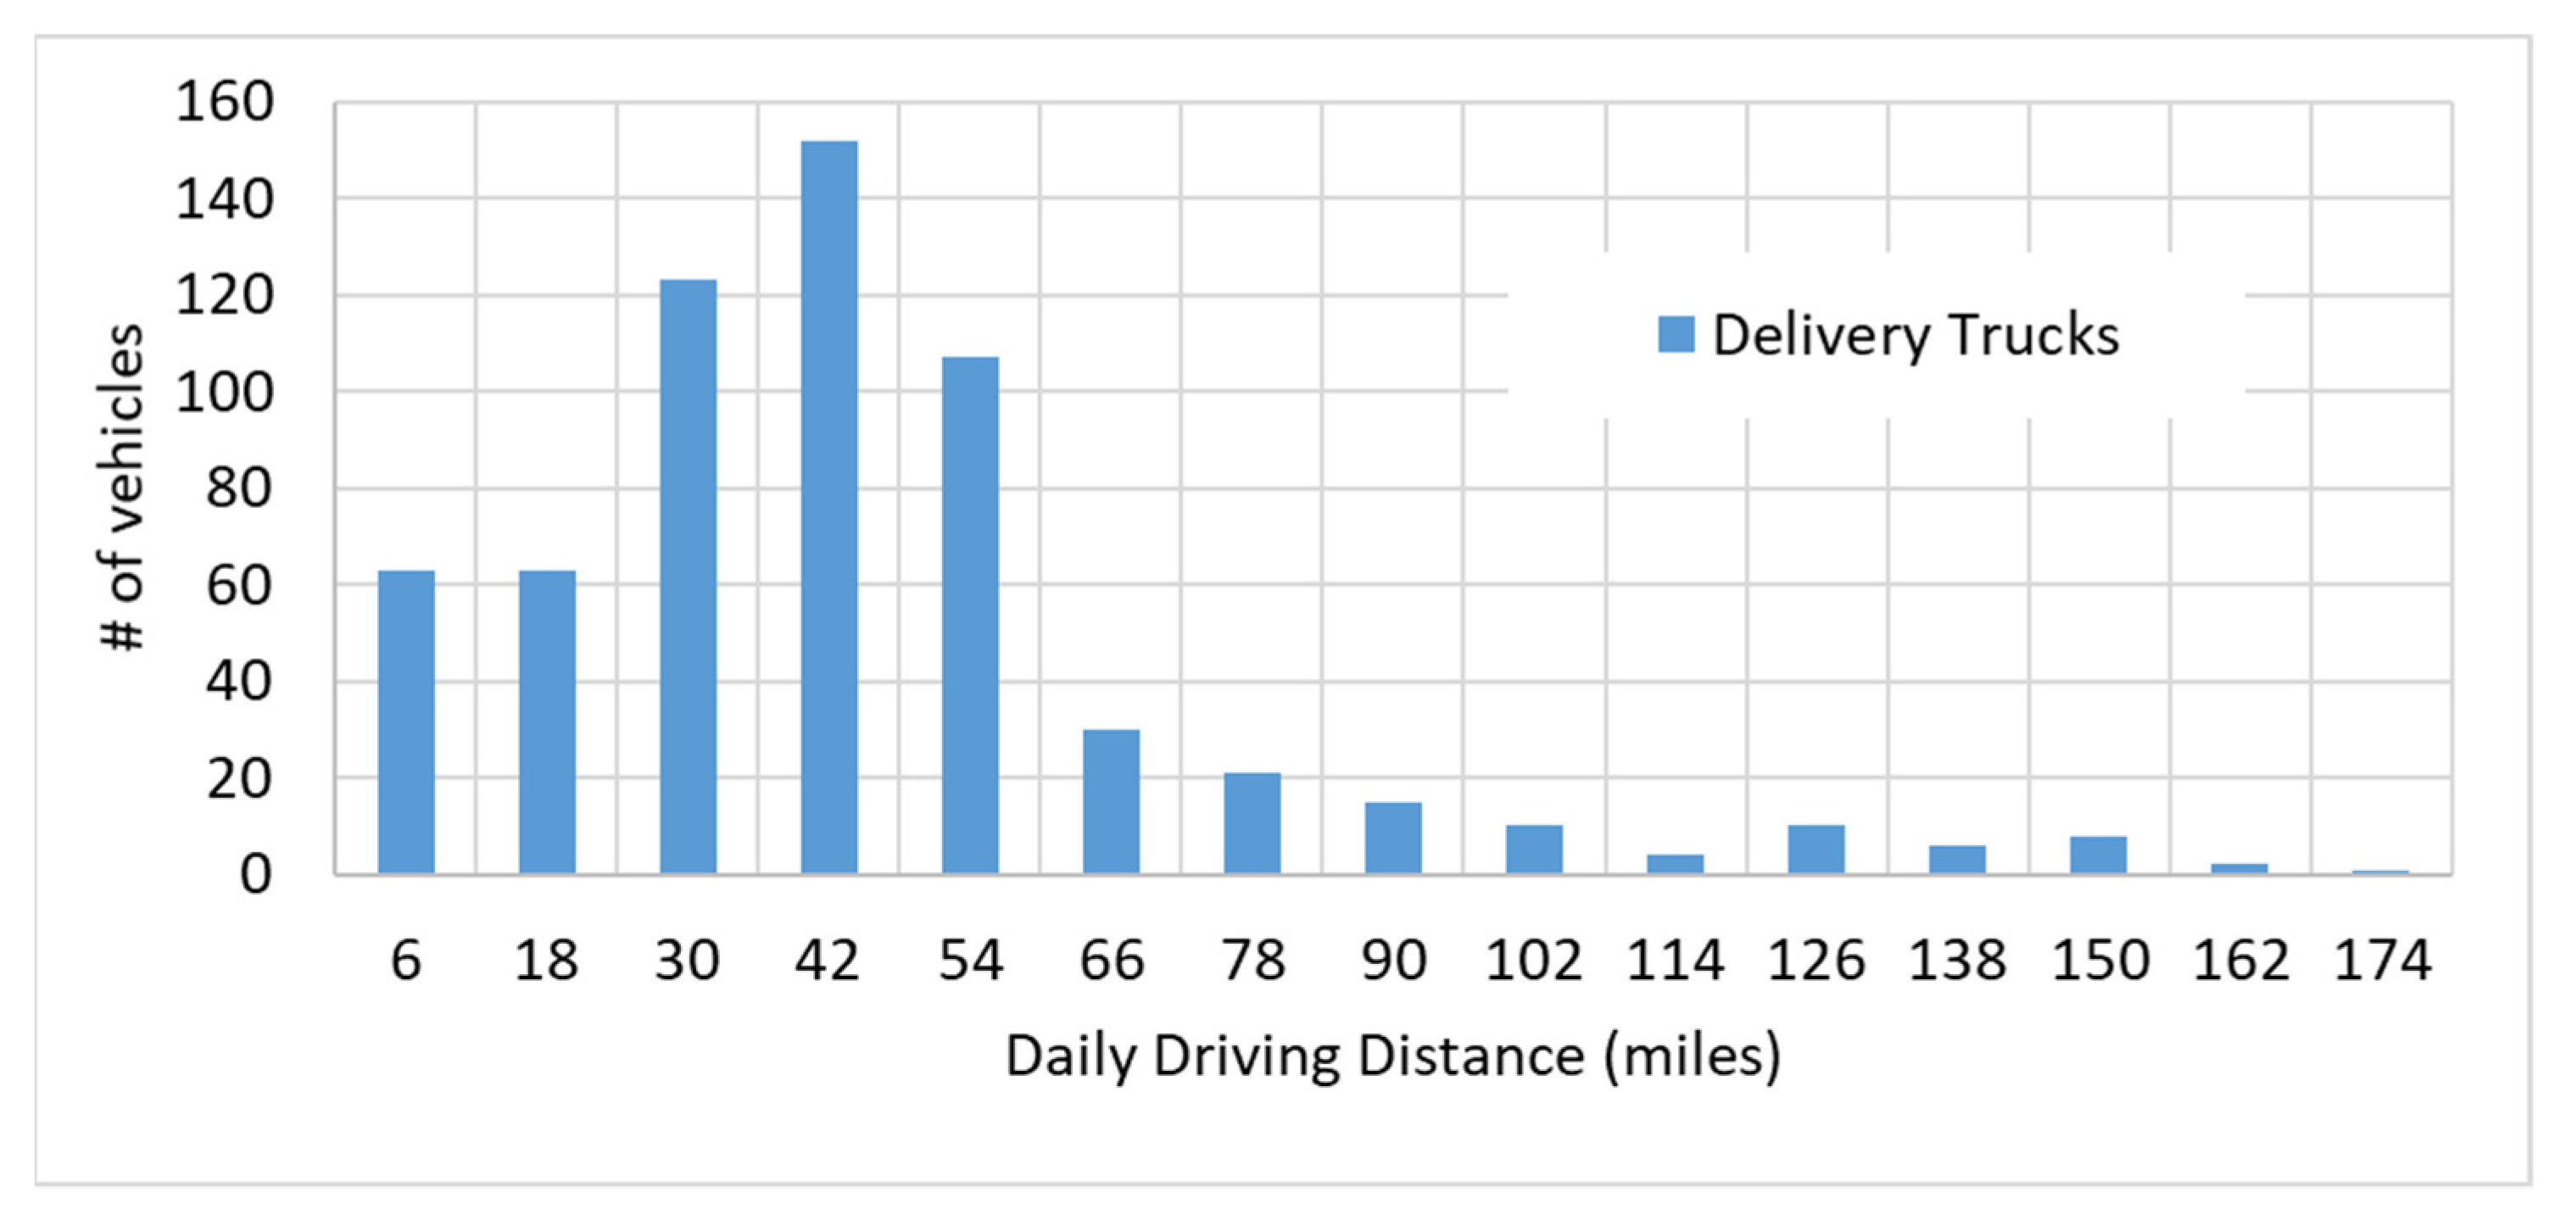
FleetDNA data shows that a designed range of 150 miles is sufficient to cover most of the delivery truck use cases, but a majority of those routes are under 75 miles, as shown in
Figure 5. Similar trends are found for other types of trucks too.
6.1.1. Case 1: Designed for 150 Miles but Used for Shorter Daily Driving
We consider two additional cases to examine the sensitivity to VMT, where the daily trip distance is set to 45 miles and 75 miles, respectively, to evaluate a 50th percentile and 90th percentile case from FleetDNA. This changes the annual vehicle miles used for the TCO estimate to 4800 miles and 9000 miles, respectively. If we assume a diesel cost of
$3/gallon, TCO parity can be observed for a light HD delivery van only if the battery pack costs less than
$125/kWh and
$150/kWh, respectively. This is illustrated in
Figure 6.
The shaded regions represent the lines represent the conditions where the electric truck has a lower TCO over the diesel counterpart.
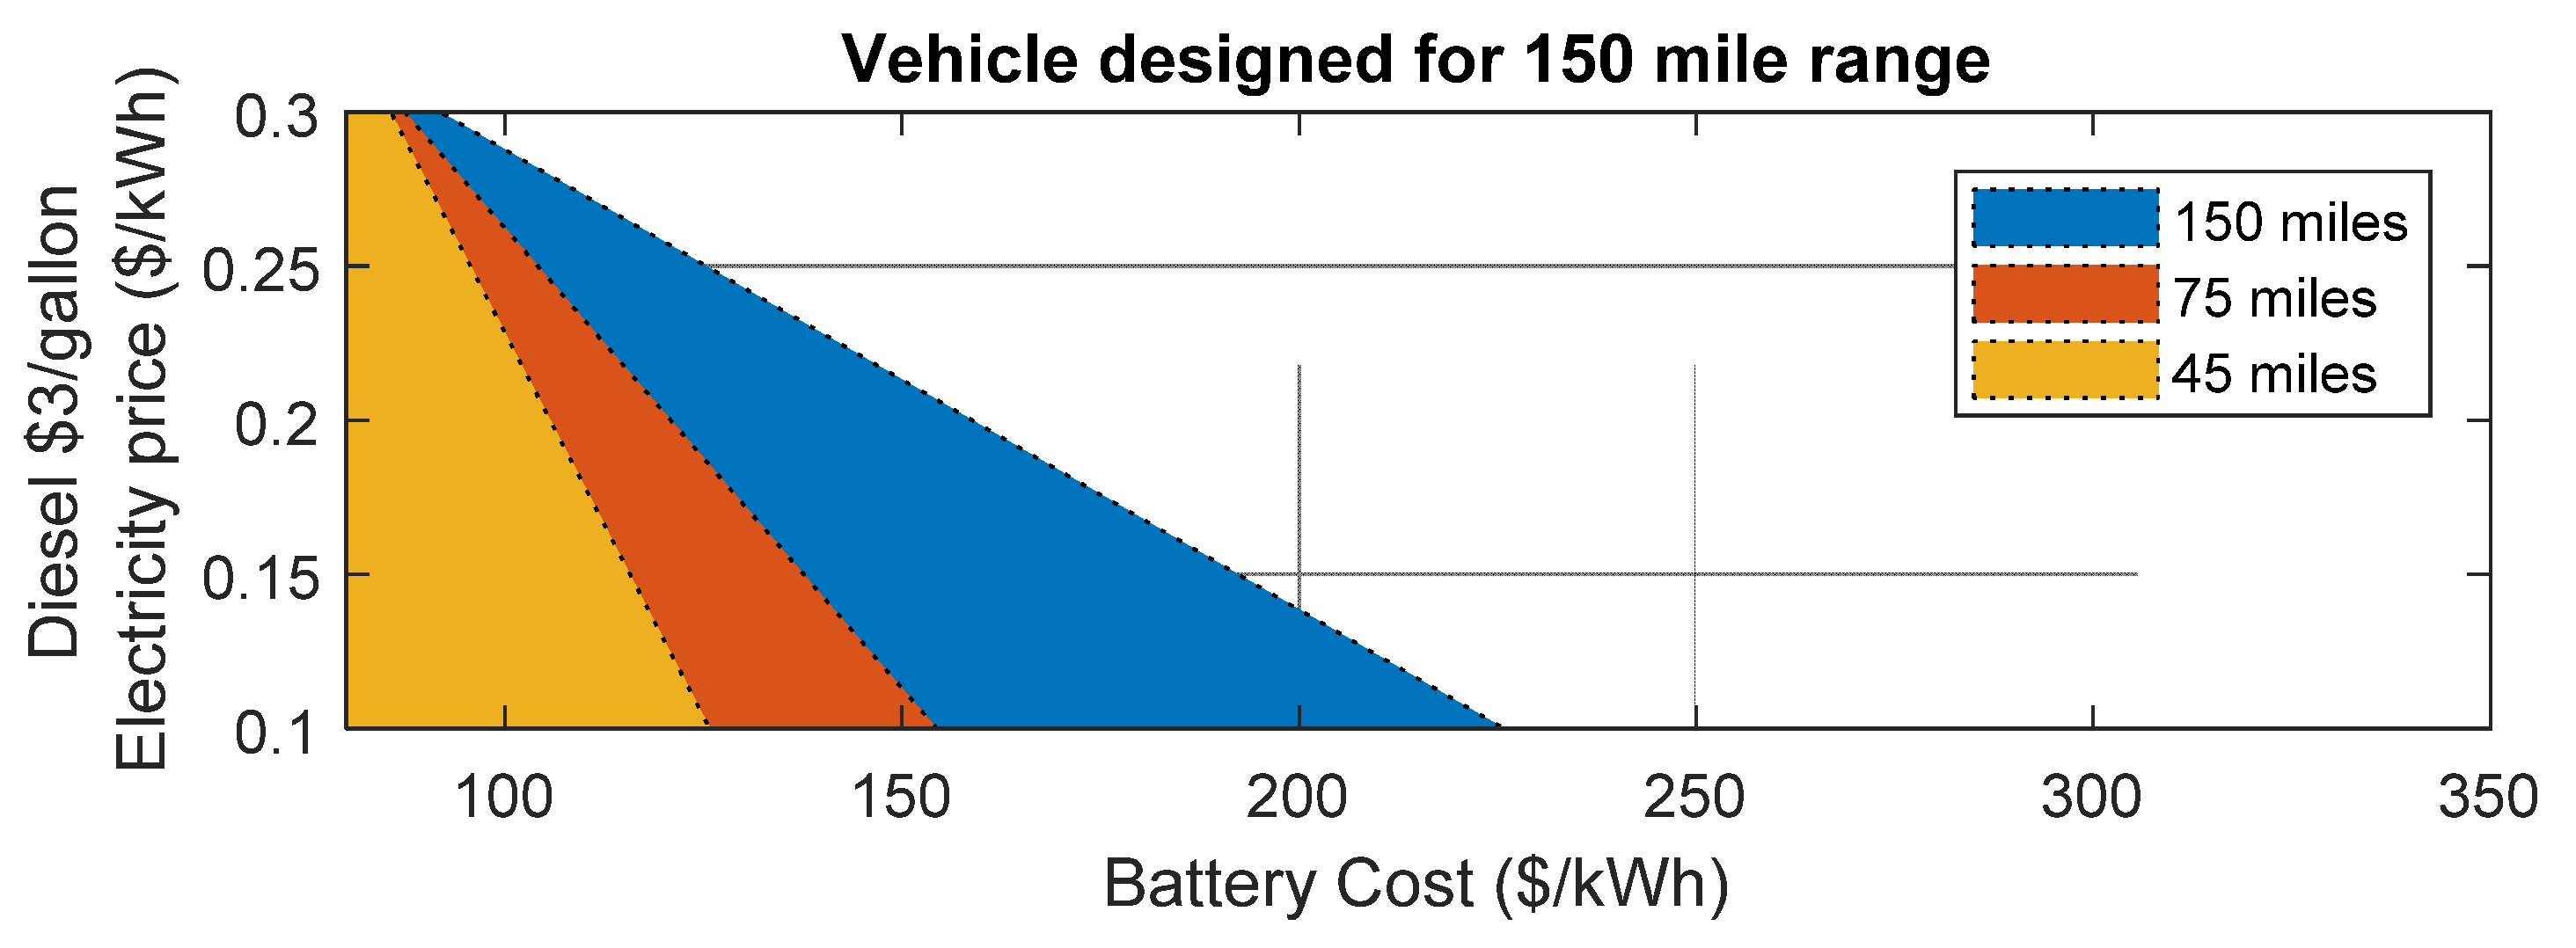
6.1.2. Case 2: Designed and Used for Shorter Daily Driving
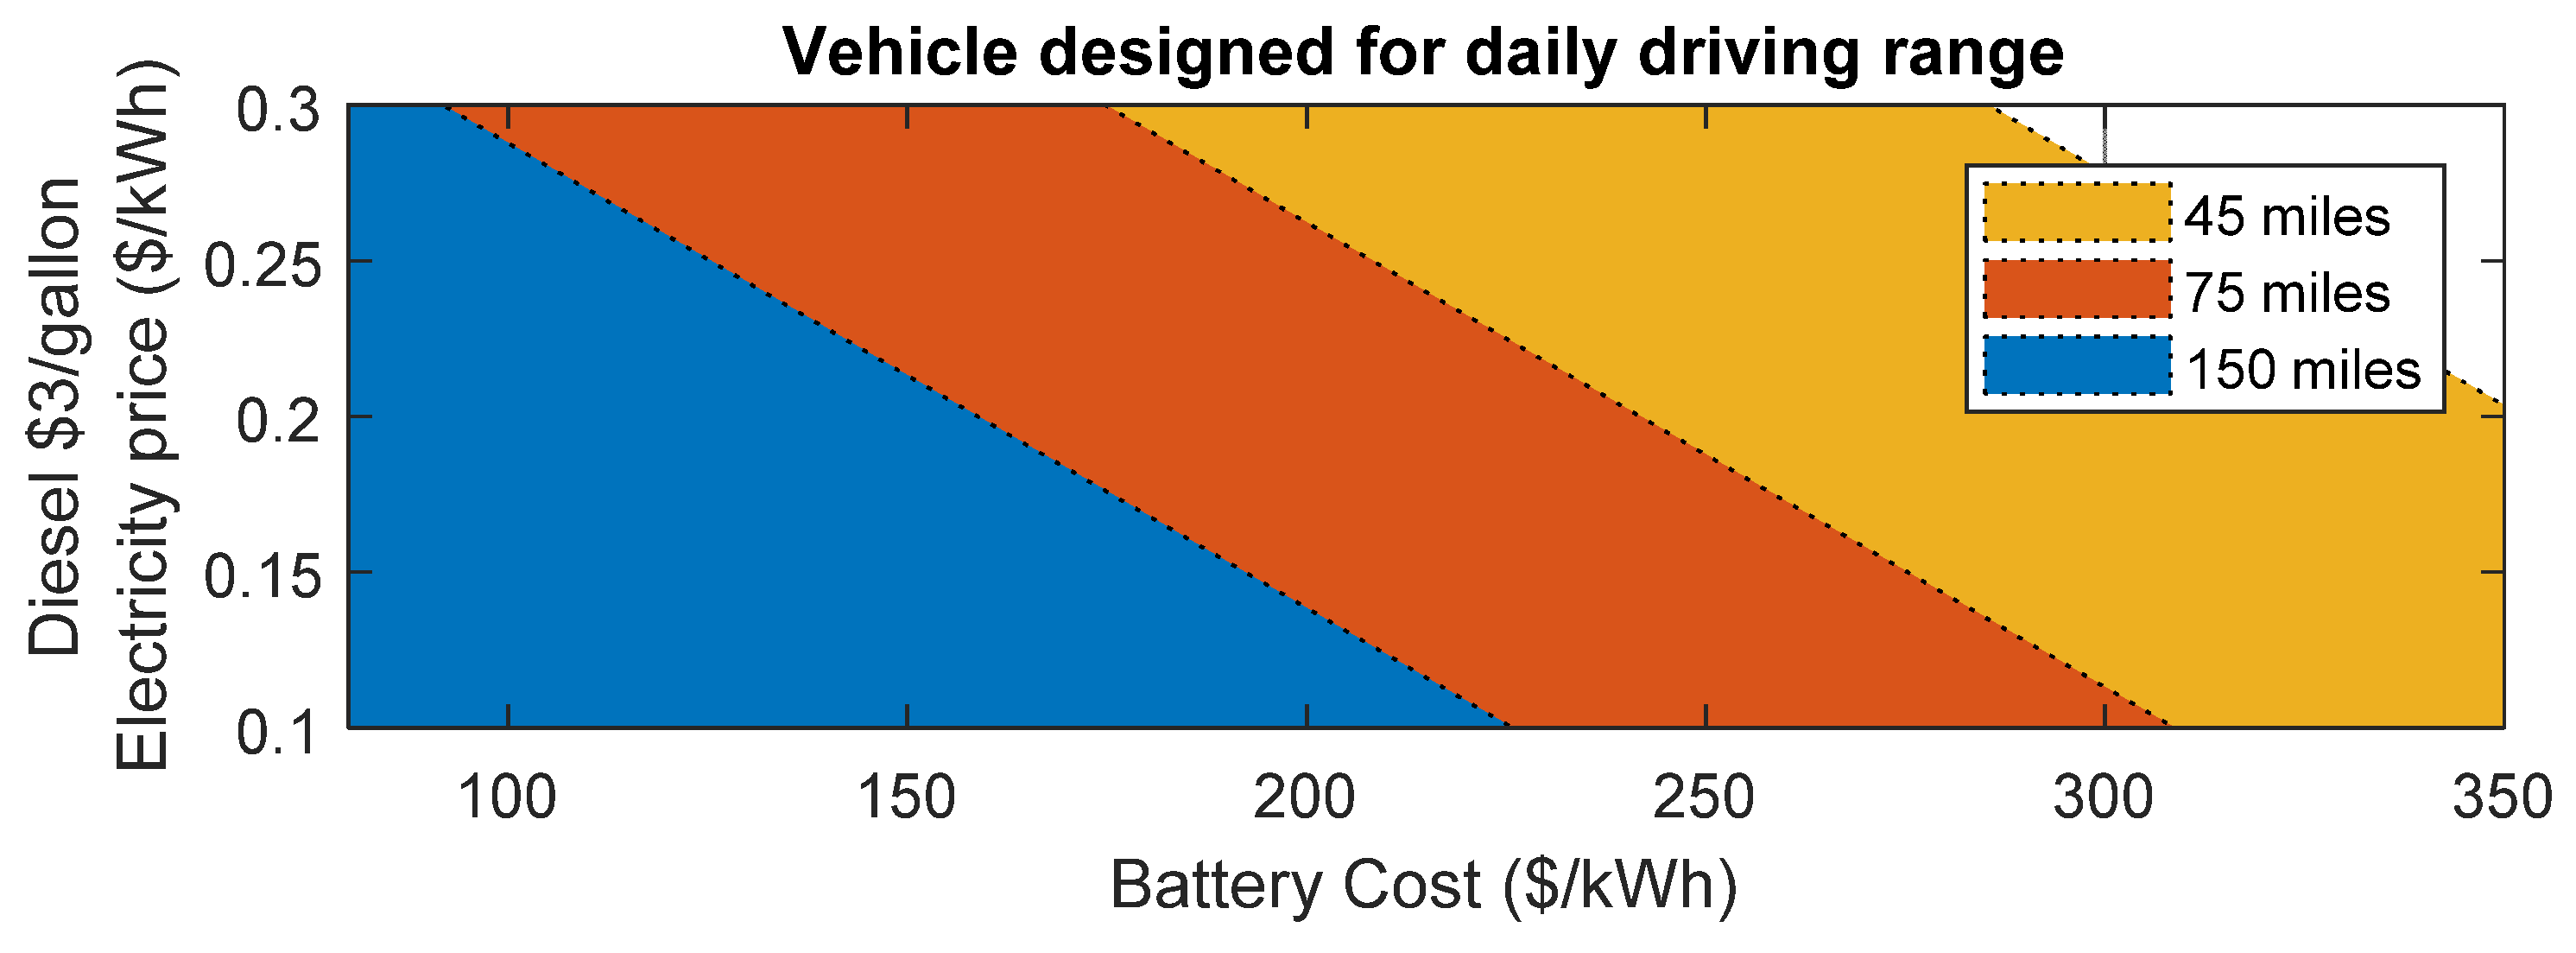
This case assumes a scenario where the battery is sized to specifically meet the daily driving requirements. As we see from FleetDNA data, about half of the daily trips are under 45 miles. If we have three use cases where daily driving distances are 150, 75, and 45 miles, respectively, we can obtain vans that are designed with smaller battery packs, just for those distances. Under such a situation, the electric truck will be economically attractive even under the present-day cost of battery packs and diesel. This is shown in
Figure 7.
If a delivery truck is designed for 75 mile range and driven 75 miles every day, it would have TCO parity with a diesel truck even if the battery cost is $300/kWh, if the recharging of battery could be achieved at 10–12 cents per kWh.
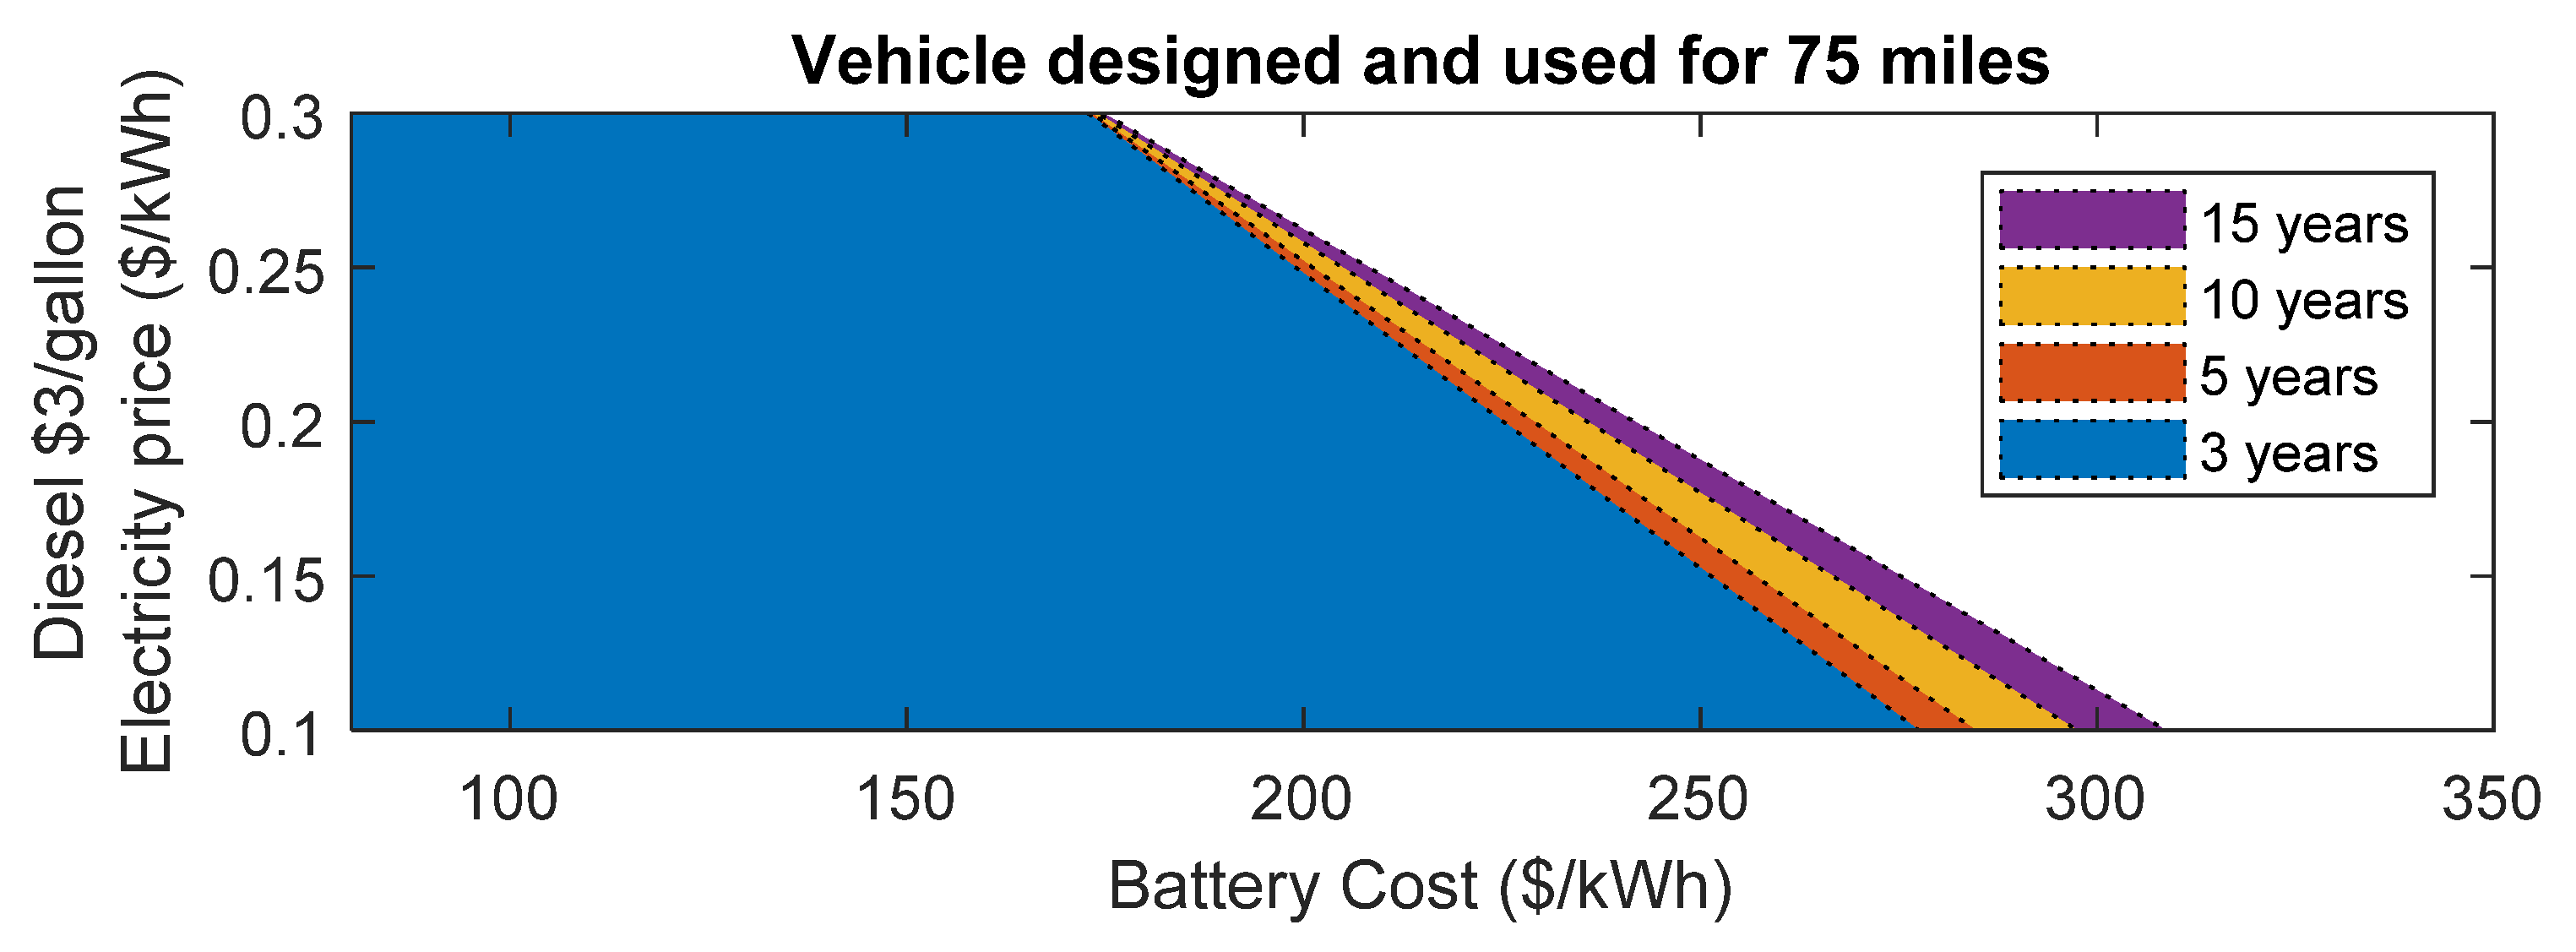
6.2. Impact of Shorter Service Period
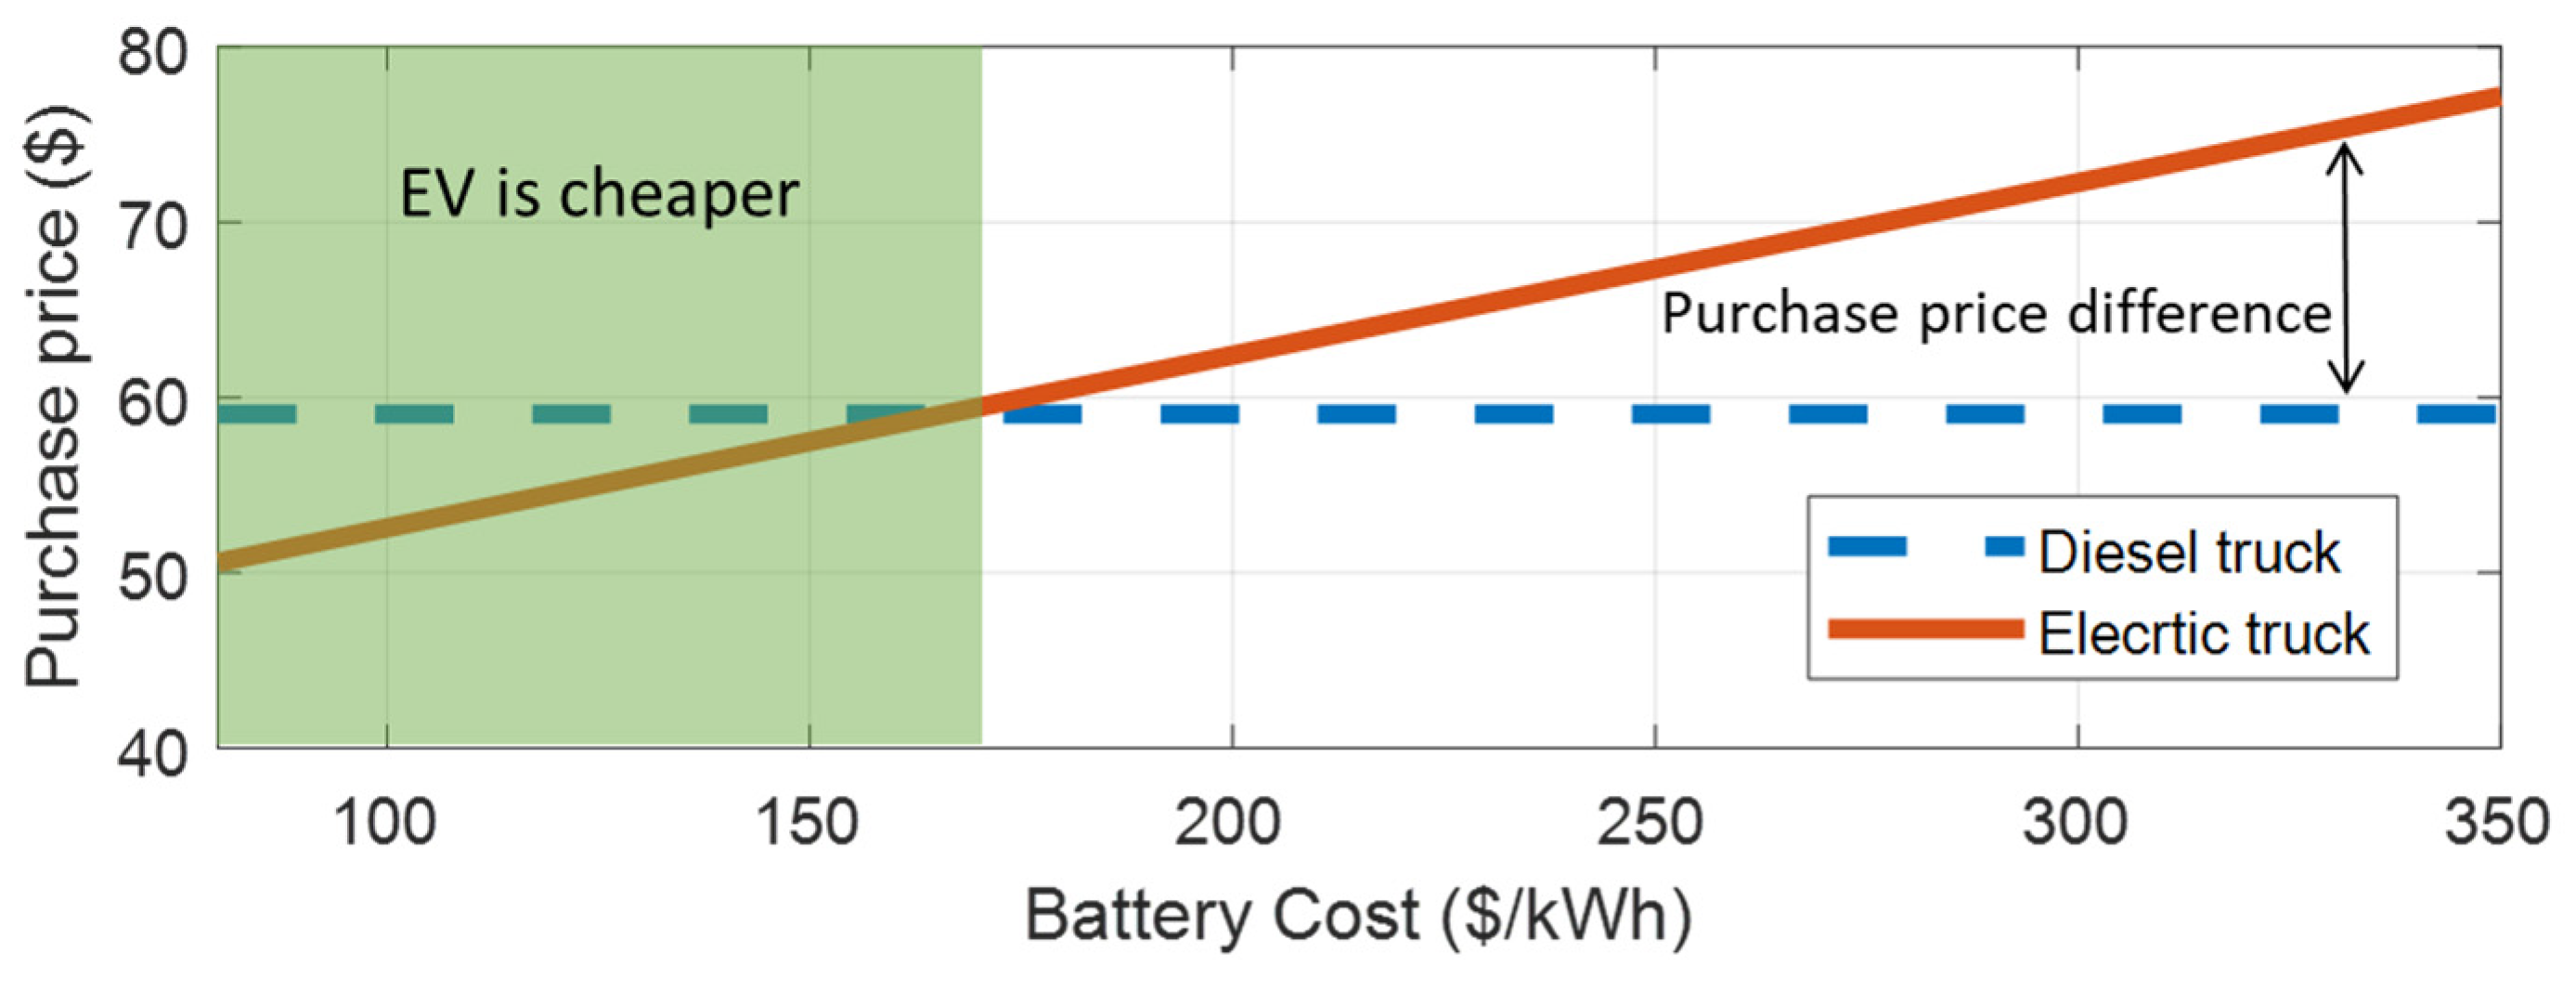
This study assumes a service period of 15 years for medium-duty trucks. While it is true that many fleets own the vocational trucks for the entire lifetime of the trucks, the fleets would want to see a shorter payback time for their additional investment in electric trucks. This payback period could be as low as 3 years. Class 4 delivery truck designed and driven for a daily trip of 75 miles is used for this analysis.
Figure 8 shows the purchase price estimates and the difference between the diesel and electric truck prices. If battery cost drops below
$170/kWh, then an electric truck is cheaper to purchase.
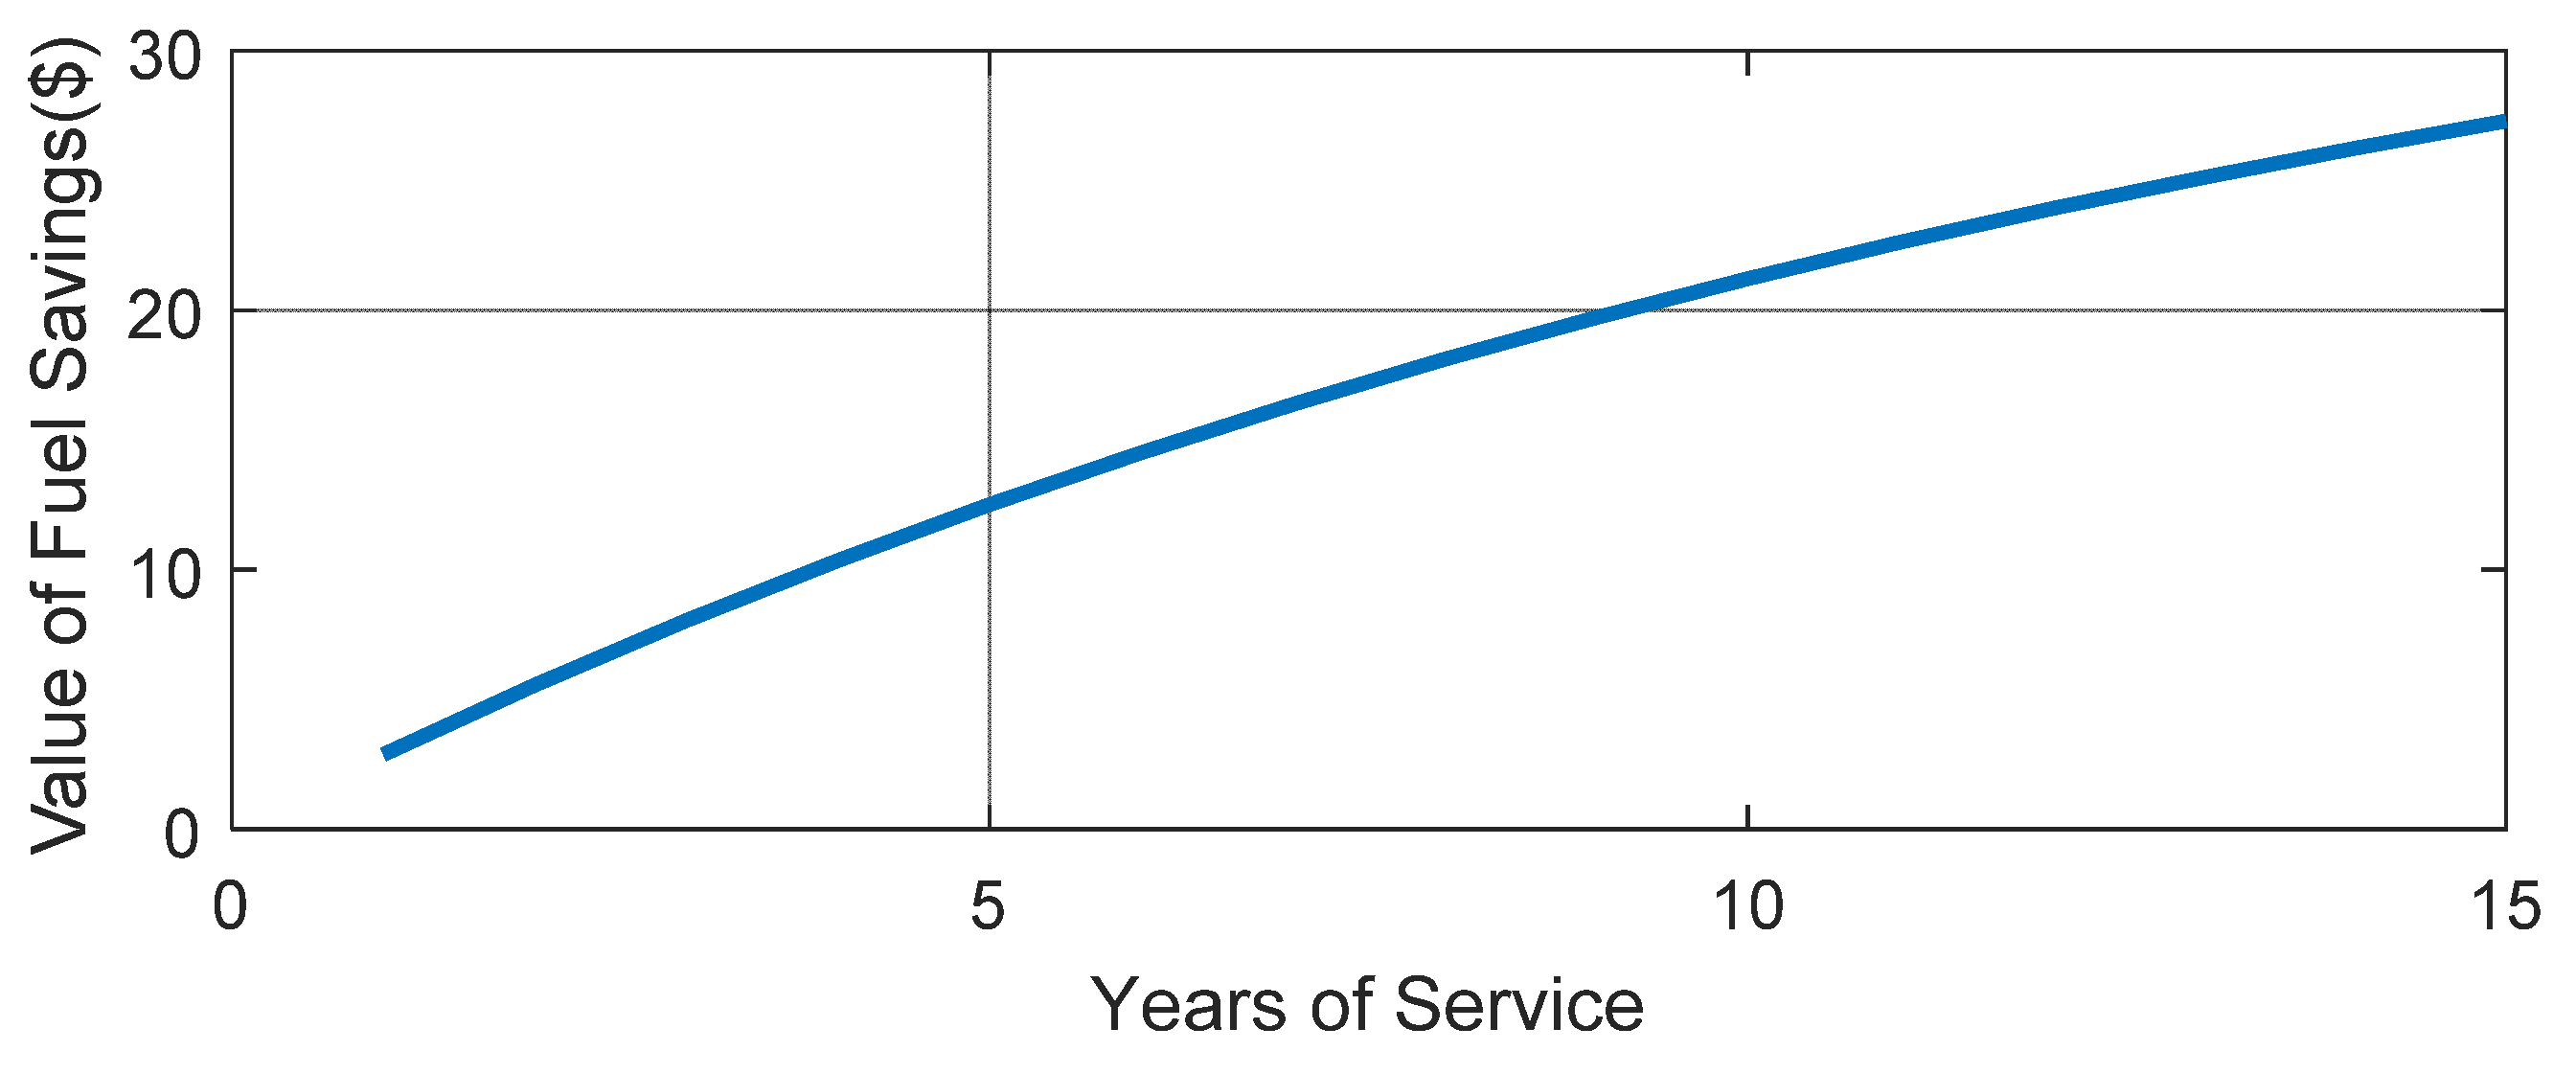
We estimate the energy consumption of 770 Wh/mile for the delivery truck. The operating cost associated with this is roughly 8 c/mile if the price of electricity is assumed as 10 c/kWh. For a diesel truck, the fuel cost will be 24 c/mile to operate at
$3/gallon. For every mile, the EV will save 16 c for the operator. At 18,000 miles a year, savings for the operator is
$2900 per year. The present value of such savings over the future years is quantified as shown in
Figure 9.
If the value of fuel savings exceeds the purchase price difference we see in
Figure 8, then the investment on an electric vehicle is a good investment. If the payback period is set at 5 years, then it would be justifiable to pay about
$12,000 more for the electric truck.
For various service durations, the TCO parity with diesels is achieved in the shaded region shown in
Figure 10. A vehicle that will be used for 15 years can save close to
$26,000 in fuel cost over the service period, and it will be viable even if battery costs
$300/kWh, but if the electric truck should achieve TCO parity in 3 years, the battery cost will have to drop to
$275/kWh.
7. Conclusions
This study shows that ‘Light HD’ trucks are the most promising among the vehicles considered in this study to achieve TCO parity with diesels. Class 8 long haul operations are the most challenging use case for electric trucks to achieve economic parity with diesels.
Economic disadvantages in having a generic design that can meet a 99 percentile use case is illustrated in this work. An underutilized battery is a major hurdle in achieving TCO parity. For class 4 delivery trucks, it was found that TCO parity could be achieved, even with current battery prices, if the vehicle is designed and used for short routes. Such a design may not meet the needs of all fleets, but there could be real-world users who can successfully adopt electric trucks, even if the payback period is relatively short. This also points to the need for modular battery sizes based on specific needs.
This study highlights the need for additional research by considering real-world use cases and explore how additional powertrains compare to conventional vehicles in the near future. Variations in daily driving distance may be unavoidable for many use cases. Fast charging EVs or PHEVs could be explored as the solution to address range uncertainties.
Author Contributions
Conceptualization, methodology, and formal analysis was carried out by R.V. Project administration, funding acquisition and review was provided by A.R. All authors have read and agreed to the published version of the manuscript.
Funding
This work was supported by the U.S. Department of Energy (DOE), Vehicle Technology Office, under the direction of J. Ward, under contract DE-AC02-06CH11357. The submitted manuscript has been created by UChicago Argonne, LLC, Operator of Argonne National Laboratory (“Argonne”). Argonne, a DOE Office of Science laboratory, is operated under Contract No. DE-AC02-06CH11357. The U.S. Government retains for itself, and others acting on its behalf, a paid-up, nonexclusive, irrevocable worldwide license in said article to reproduce, prepare derivative works, distribute copies to the public, and perform publicly and display publicly, by or on behalf of the Government. Authors would also like to thank their colleagues who provided the necessary support and feedback in making this study possible.
Conflicts of Interest
The authors declare no conflict of interest.
References
- Löfstrand, S.; Hellgren, J.; Thulin, N.; Engdahl, H.; Pettersson, S.; Williamsson, J.; Sandoff, A. Feasibility of electrifying urban goods distribution trucks. SAE Int. J. Commer. Veh. 2013, 6, 24–33. [Google Scholar] [CrossRef]
- Tryggestad, C.; Sharma, N.; van de Staaij, J.; Keizer, A. “New Reality: Electric Trucks and Their Implications on Energy Demand”. McKensey Energy Insights. 1 September 2017. Available online: https://www.mckinsey.com/industries/oil-and-gas/our-insights/a-new-reality-electric-trucks# (accessed on 15 January 2020).
- Moultak, M.; Lutsey, N.; Hall, D. “Transitioning to Zero Emission Heavy Duty Freight Vehicles”. ICCT. 26 September 2017. Available online: https://theicct.org/publications/transitioning-zero-emission-heavy-duty-freight-vehicles (accessed on 15 June 2019).
- Mihelic, R.; Roeth, M. “Electric Trucks—Where They Make Sense”. 2018. North American Council for Freight Efficiency. Available online: https://nacfe.org/emerging-technology/electric-trucks/ (accessed on 15 January 2020).
- Mihelic, R.; Roeth, M.; Lund, J.; Ballschmidt, B. “Medium Duty Electric Trucks—Cost of Ownership”. 2018. North American Council for Freight Efficiency. Available online: https://nacfe.org/emerging-technology/medium-duty-electric-trucks-cost-of-ownership/ (accessed on 15 January 2020).
- DOE Battery Goals. Available online: https://www.energy.gov/sites/prod/files/2016/06/f32/es000_howell_2016_o_web.pdf (accessed on 1 June 2019).
- Neubauer, J.; Brooker, A.; Wood, E. Sensitivity of battery electric vehicle economics to drive patterns, vehicle range and charge strategies. J. Power Sources 2012, 209, 269–277. [Google Scholar] [CrossRef]
- Feng, W.; Figliozzi, M. Conventional vs electric commercial vehicle fleets: A case study of economic and technological factors affecting the competitiveness of electric commercial vehicles in the USA. Procedia Soc. Behav. Sci. 2012, 39, 702–711. [Google Scholar] [CrossRef] [Green Version]
- U. S. Census Bureau. Vehicle Inventory and Use Survey. United States Census Bureau. 2002. Available online: http://www.census.gov/svsd/www/vius/2002.html (accessed on 15 January 2019).
- Fleet DNA Project Data. National Renewable Energy Laboratory. 2019. Available online: www.nrel.gov/fleetdna (accessed on 15 January 2019).
- Autonomie. Available online: www.autonomie.net (accessed on 1 December 2018).
- Vijayagopal, R.; Rousseau, A.; Vallet, A. Fuel consumption and performance benefits of electrified powertrains for transit buses. SAE Tech. Pap. 2018. [Google Scholar] [CrossRef]
- Vijayagopal, R.; Nieto Prada, D.; Rousseau, A. Fuel Economy and Cost Estimates for Medium-and Heavy-Duty Trucks; Report to the US Department of Energy; Argonne National Laboratory: Lemont, IL, USA, 2019; Contract ANL/ESD-19/8.
- US Environment Protection Agency. Final Rule for Greenhouse Gas Emissions and Fuel Efficiency Standards for Medium- and Heavy-Duty Engines and Vehicles—Phase 2; US EPA: Washington, DC, USA, 2016.
- Hooper, A.; Murray, D. An Analysis of the Operational Costs of Trucking: 2018 Update; American Transportation Research Institute (ATRI): Arlington, VA, USA, 2018. [Google Scholar]
| Publisher’s Note: MDPI stays neutral with regard to jurisdictional claims in published maps and institutional affiliations. |
© 2021 by the authors. Licensee MDPI, Basel, Switzerland. This article is an open access article distributed under the terms and conditions of the Creative Commons Attribution (CC BY) license (https://creativecommons.org/licenses/by/4.0/).


