Article

Comparing Options to Electrify Heavy-Duty Vehicles: Findings of German Pilot Projects

Fraunhofer Institute for Systems and Innovation Research ISI, Breslauer Str. 48, 76139 Karlsruhe, Germany
*
Author to whom correspondence should be addressed.
World Electr. Veh. J. 2021, 12(2), 67; https://doi.org/10.3390/wevj12020067
Submission received: 31 March 2021 / Revised: 19 April 2021 / Accepted: 24 April 2021 / Published: 27 April 2021

Abstract

:
While the electrification of passenger vehicles is in full swing, for the decarbonization of heavy-duty trucks still various challenges exist. Especially the high energy consumption in combination with high daily driving ranges makes battery electric operation much more difficult than for passenger cars. Accordingly, a broad set of different drivetrains is discussed, inter alia hydrogen trucks, catenary hybrid trucks and synthetic fuels. One main advantage of the direct use of electricity in trucks is the high energy efficiency. Still, for heavy duty trucks different concepts for electrification do exist. Here, we compare battery electric trucks with a fast charging option, full electric catenary trucks and battery swap trucks. For a broad perspective, we use seven different comparative dimensions ranging from total cost of ownership to more qualitative but not less important aspects such as necessity of standardization, which would reduce manufacturer’s decision-making freedom. We base our comparison on findings from German pilot projects. While battery electric trucks or battery swap are advantageous since they can be operated in niche operations and thus allow a demand driven rollout of charging infrastructure, catenary infrastructure needs high investments upfront which entails financial risks, but allows for lowest cost if utilized to capacity.

1. Introduction

This paper is based on and updates the publication of the same name presented at the 33rd Electric Vehicle Symposium (EVS33) [1]. Electric vehicles with electric energy from renewable sources are often discussed as an important instrument to reduce greenhouse gas emissions in the transport sector. However, most studies focus on passenger cars. Nevertheless, heavy road transport is responsible for about one third of CO2 emissions of all vehicles in Germany and it is expected to grow in emissions beyond the passenger car sector [2]. Therefore, electrification is also under discussion for heavy-duty vehicles.

1.1. Current Research Status

One research direction examines the technical feasibility to electrify heavy-duty vehicles, taking into account road freight data. Usually, the battery electric range is identified as a critical factor. Based on continuous road freight surveys, Reference [
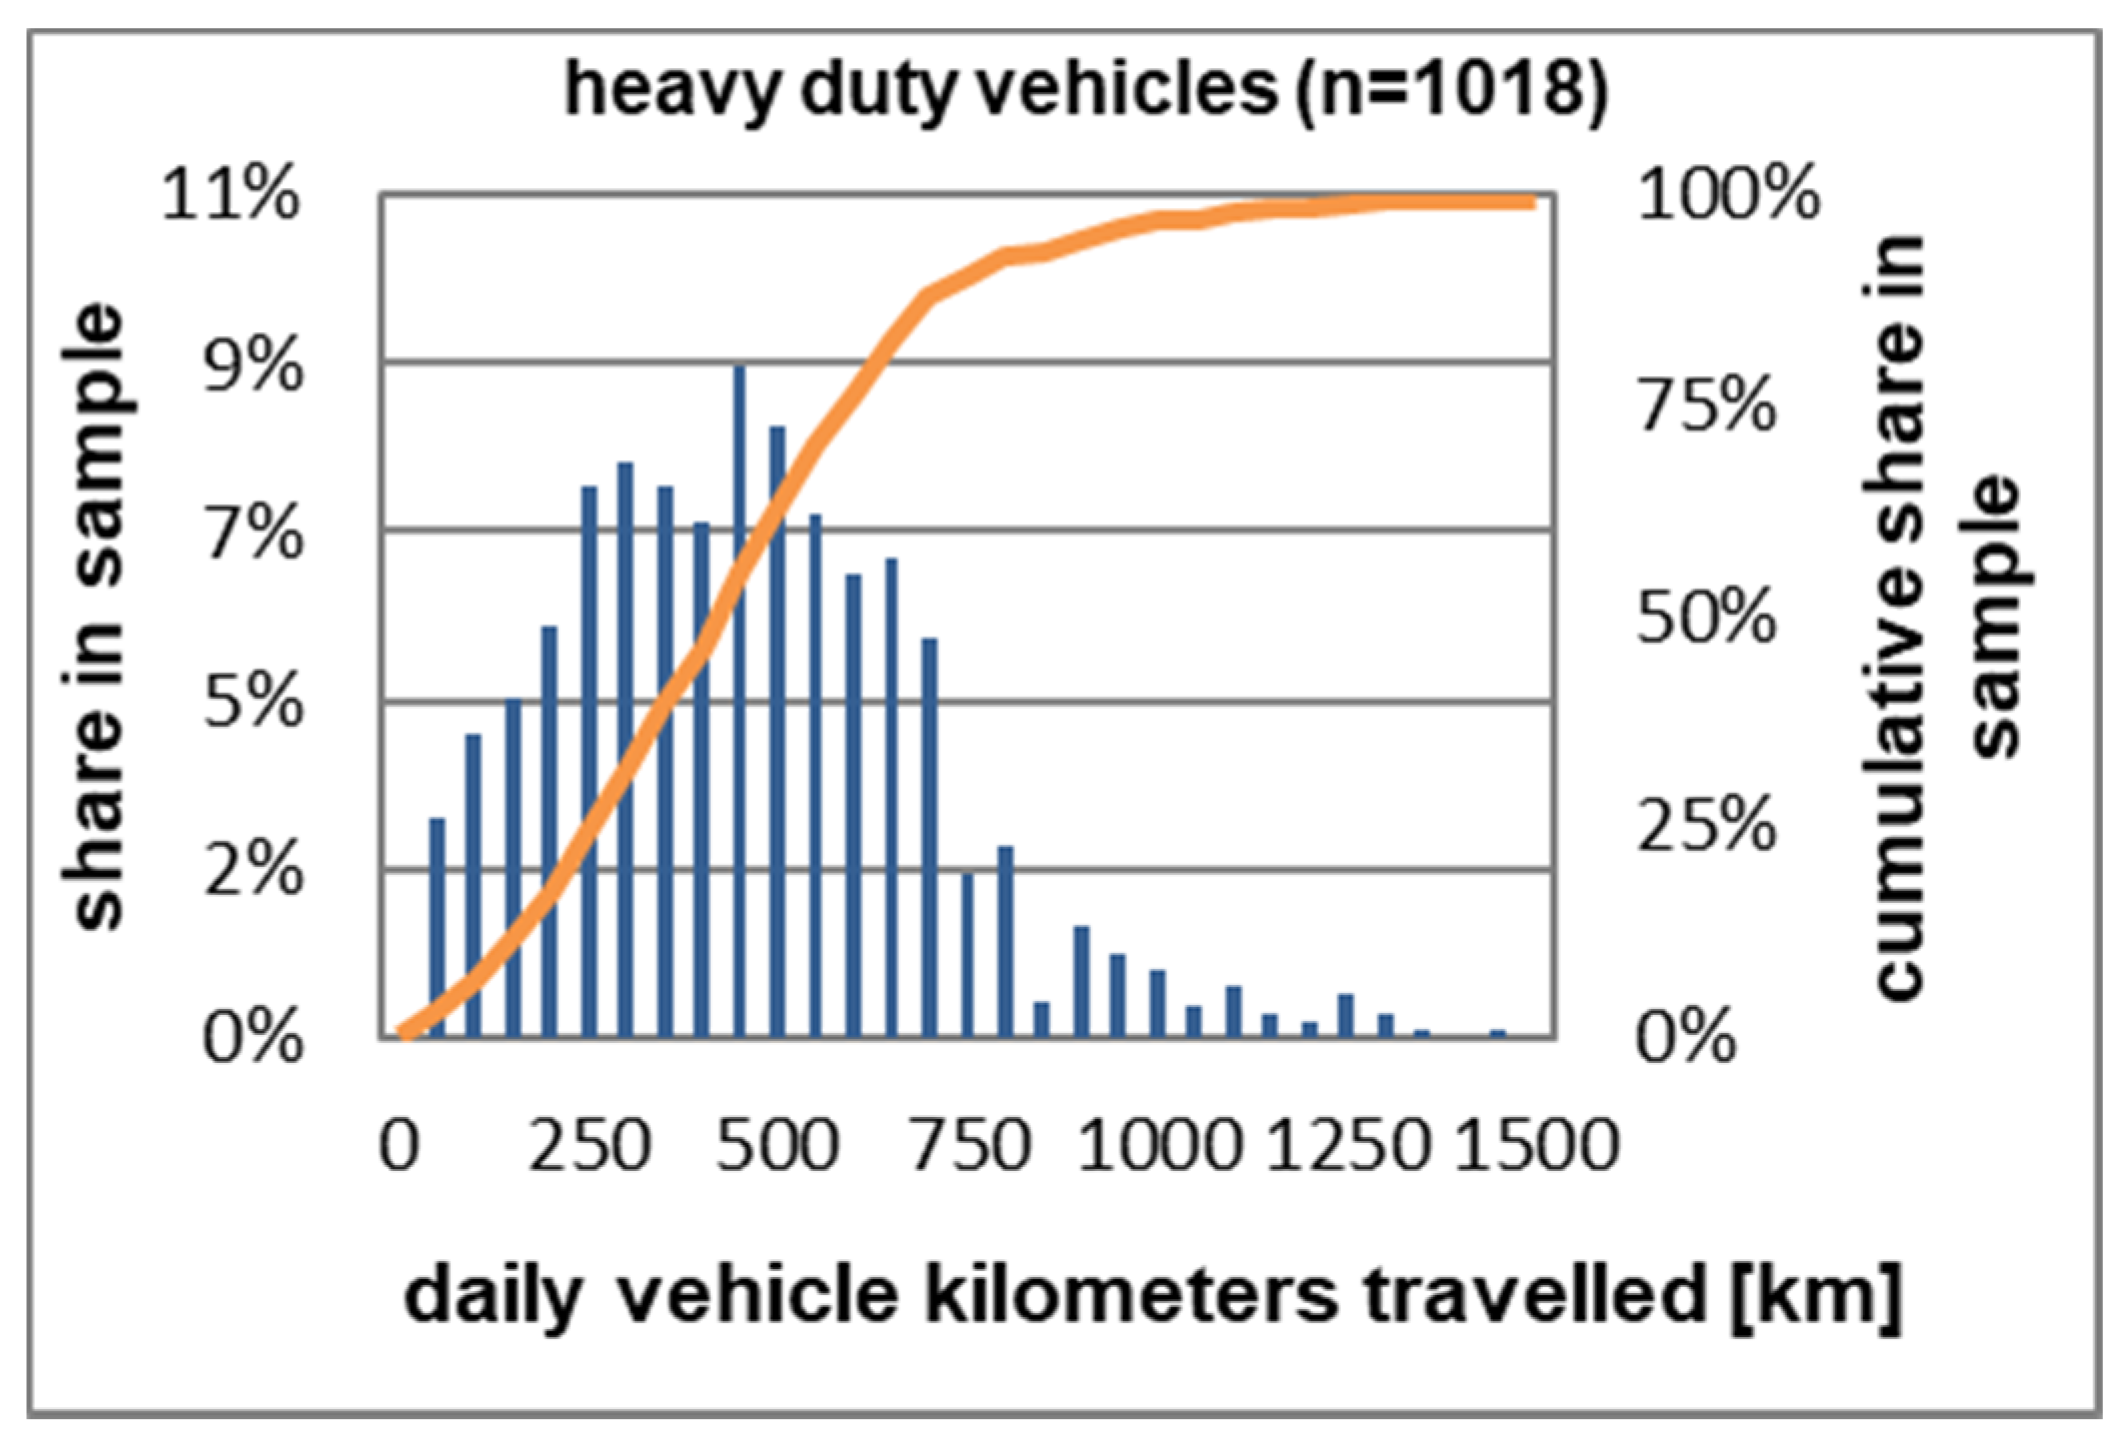
3] identifies 71% of Swiss road freight transport and 35% of Finnish road freight transport as electrifiable by battery electric trucks (BEV). To achieve this, charging power of up to 400 kW is assumed in the long term. The study states 300 km range as a minimum requirement. A full electric range of 300 km would already allow to electrify 30% of the German semitrailer truck fleet (according to Germany’s largest survey for heavy-duty vehicle traffic [4]) (Figure 1). Still, this would make a battery capacity of more than 300 kWh necessary which would weight more than 1.4 tons, even as late as in 2030 [5]. Research from Switzerland shows that battery swapping instead of fast charging can significantly increase fleet electrification, too [6]. The results with battery swap are quite similar to those with fast charging from [3]. A third option to electrify heavy-duty vehicles are overhead catenary trucks. These vehicles charge during travel via a pantograph on an overhead line. Reference [7] assume different rollout scenarios of overhead lines at German highways and calculate energy consumptions and battery sizes. The mentioned studies analyze technical aspects in great detail. However, electrification potential is determined at a high level, e.g., with country-wide fleet samples. Other aspects of feasibility, such as trip-specific requirements or in-depth cost analysis, are mostly excluded from consideration.
Another research direction therefore examines a possible market diffusion of alternative drivetrains for heavy-duty vehicles, taking techno-economic aspects into account. Reference [8] determines, inter alia, costs for battery electric trucks and overhead catenary trucks. Reference [9] operates with a German vehicle sample and determine the techno-economic potential for battery electric trucks and overhead catenary trucks for every driving profile until 2030. Based on this, effects on the energy system can be determined, as shown in [10,11]. Reference [12] used freight flows and vehicle costs to identify the most relevant routes for overhead catenary trucks in Germany. Reference [13] presented total cost of ownership calculations for battery electric trucks and battery swap trucks in China. They find battery electric trucks more cost competitive than battery swap trucks. An additional overview of peer-reviewed studies with regard to the market diffusion of alternative drivetrains for heavy-duty vehicles can be found in [14]. In this research direction, the consideration of costs allows for estimates regarding market success. Nevertheless, important aspects for the success of a technology remain disregarded. For example, the actual readiness of alternative vehicles is neglected. This can lead to market success falling short of expectations and models overstating the opportunities of a technology.
To overcome this limitation, Reference [15] introduced a six-part evaluation, taking technical, economic and environmental aspects into account. They use it to compare diesel trucks, LNG trucks, battery electric trucks, overhead catenary trucks and fuel cell electric trucks. In particular, technology readiness levels make it possible to compare the development status of different vehicle alternatives. However, the dimensions used are only partially suitable for a dedicated comparison of different electrical options.

1.2. Objective

This paper aims to give a comparative overview of pure electric truck alternatives in seven dimensions, to provide a broad basis for a decision-making process with regard to technical and economic aspects. To achieve this, we use the experience gained from two pilot projects. We focus on electric trucks above 12 t gross vehicle weight and take three different types of electric trucks for one specific scenario into account:
(1)
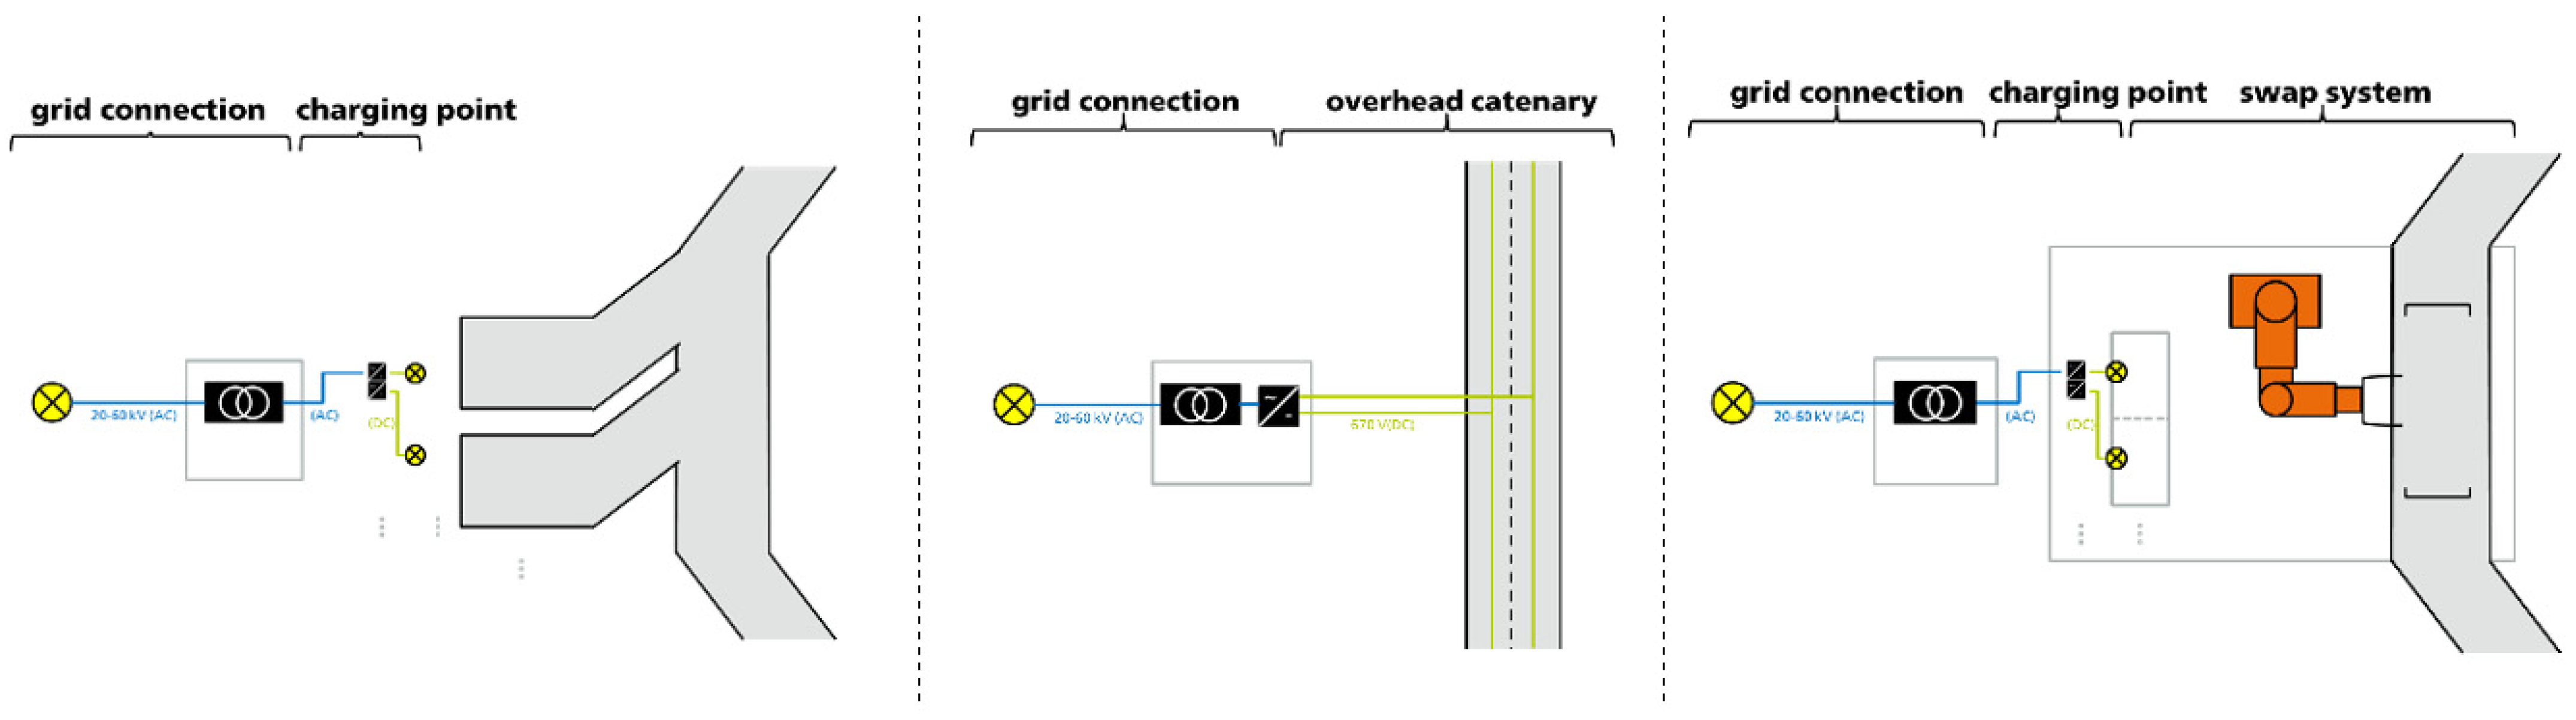
Battery electric trucks with a fast charging option (BEV). All driving energy is stored in the battery that has to be recharged regularly.
(2)
Overhead catenary electric trucks (CV). These trucks can be operated via a pantograph to obtain electricity from the overhead lines. If power supply exceeds driving power, the battery can be recharged during driving. For driving off the line, driving energy might stem from an additional internal combustion engine or a battery that allows for electric driving compared to the battery electric vehicle. Here, we only discuss a full electric CV without an internal combustion engine.
(3)
Electric trucks with a changeable battery (BSV). Operation is similar to battery electric truck. Instead of recharging, the empty battery in the truck is swapped for a fully charged one. Charging these batteries can thus happen slower during times where no battery swap is demanded.
As shown in the literature, mainly technical and economic aspects are of special interest. We compare the aforementioned electric truck drivetrains with regard to the following seven dimensions:
(1)
Technical readiness of the vehicle,
(2)
necessity of vehicle standardization,
(3)
possibility to be operated in niches,
(4)
technical readiness of infrastructure,
(5)
long-term infrastructure cost (per km),
(6)
operational flexibility and
(7)
total cost of ownership (TCO), including both vehicle and charging infrastructure cost.
Our work differs from the existing literature in three aspects. First, we compare all three known options to directly electrify heavy-duty vehicles. Previous work usually compares a maximum of two options. Second, we consider one specific realistic but challenging transportation task to identify weaknesses of the different technologies. In particular, we consider necessary parking periods as trip-specific requirement. This is not possible in studies based on daily mileage. Third, our multidimensional approach allows us to identify barriers that are not detected by a purely economic or technical perspective.
This paper is structured as follows. In Section 2.1, we present three pilot projects that complement our analysis, as well as the derived vehicle usage scenario. Afterwards, in Section 2.2, we describe the methodology and provide in-depth information on the chosen evaluation dimensions. Section 2.3 contains the most important input data. In Section 3, we present our results. Finally, in Section 4, we discuss our findings.

2. Materials and Methods

2.1. Pilot Projects and Setting

Since only prototypes of electric long-haul trucks exist, we base our analysis on pilot projects and literature, which represent the best available data basis for our analysis as described in the following section. Two pilot projects are of particular importance in this context:
(1)
eWayBW: The pilot project consists of 18 km public road (one direction) with 4 km overhead catenary infrastructure in the federal state of Baden-Württemberg in south-west Germany [16]. In the first stage, CVs with an additional diesel engine will be tested. Later, CVs with a battery system as hybrid component will be deployed. Additionally, pure BEVs serve as a reference. The project is one of several national and international catenary projects that are in exchange with each other.
(2)
RouteCharge: The pilot project consists of driving on 250 km public road (one direction) from Berlin in the northeast of Germany to Peine in western Germany, following the Autobahn A2 [17]. The test track is equipped with three battery swap stations (start, middle and end). A battery swap vehicle (BSV) will travel circular traffic on this route.
Another planned pilot project called “HoLa” aims to build fast charging infrastructure for BEV along the German Autobahn A2. The planned infrastructure for the first step until 2023 is quite similar to the assumptions presented in this paper [18]. This project is coordinated by the German Association of the Automotive Industry (VDA). It is supported by all major truck manufacturers in Europe as a prototype pilot project for the electrification of long-haul freight transport. However, since the project has not yet started, it cannot be directly integrated into this comparison.
Following the dimensioning of the pilot projects, our analysis focuses on a trip with a total length of 500 km. As the outward and return routes are identical, the distance to be electrified is 250 km. Considering regular breaks and loading operations in circular traffic, 500 km is a good approximation for daily mileage of a vehicle (Figure 1). For BEV, we assume two charging stations, one at the beginning and one at the end of the track. Since a battery swap is still faster, we assume three swap stations. The additional station is positioned after 125 km. In accordance with [9,19], we assume a CV infrastructure of 100 km (40% of the total track), starting at one end point. Reference [9] contains a geographically referenced countrywide diffusion for infrastructure. Here, we assume a countrywide installation of 2000 km overhead lines, which seems realistic until 2030. We consider the sections on the Autobahn A2 that are relevant for the RouteCharge project. Please note, that our results are highly influenced by the infrastructure design inspired by the pilot projects. The feasibility of a widespread diffusion has to be evaluated. However, this is beyond the scope of the current study and left for future research.
We assume seven vehicles travelling along the route. This is based on the experience from the pilot projects, especially the expert opinion of the involved transport company. It seems to be a valid utilization in an early market diffusion when taking one transport company and one route into account [17]. Since currently the main target of alternative trucks is CO2 reduction, we presume a pure electric drive for all drivetrains. Therefore, the CVs are equipped with batteries too and do not have a diesel engine. The chosen battery range ensures the operation of the vehicle on the given track and considers battery aging.
Figure 2 outlines the assumed infrastructure layout. The overhead catenary system is regularly fed by substations (one station every three kilometers), while the fast charging infrastructure and the battery swap infrastructure are connected to one single grid connection per station. The infrastructure is designed in a way that seven vehicles can be served in 12-min intervals and with a maximum idling time of 60 min at the end points of the route. As public infrastructure, the overhead line has to be designed for a higher number of vehicles, according to [9]. Table 1 summarizes the resulting requirements.

2.2. Methods

Using the seven dimensions from Section 1, we compare the given alternatives for electrification. First we evaluate the current vehicle development from a technical perspective in two dimensions. Second, techno-economic infrastructure aspects are shown. Finally, the combination of both is evaluated in two dimensions. The methodology of each of these dimensions is explained in more detail below.

2.2.1. Technical Readiness of the Vehicle

The technical readiness of the vehicle is important for a potential near-term introduction of electric trucks. In accordance with [15], we focus on technology readiness levels (TRL) as first indicator. There are nine TRL, from basic principles to operational environment. Table 2 sums up their definition according to [20]. We apply the descriptions to the vehicles used in the presented pilot projects. They represent the current state of development for the respective technology. In addition, we consider vehicles currently available on the market as a reference.

2.2.2. Necessity of Vehicle Standardization

In order to ensure interoperability between different manufacturers, standardization of interfaces between the vehicle and its charging environment is necessary. The need for complex interfaces increase the necessity of standardization and thus hamper the market diffusion of the technology in an early stage [21]. It is well known from the passenger car sector that the charging interface in particular is highly relevant in this context [21]. Based on the vehicle design, we evaluate the necessity of standardization to ensure interoperability between different vehicle manufacturers. We identify technical components that have to be harmonized in order to ensure interoperability of the charging system.

2.2.3. Possibility to Be Operated in Niches

Niche applications tend to be a source of knowledge and experience. As long as niche applications do not result in local lock-ins due to different standards, there is a need for local niche projects to enable market diffusion [21]. The possibility of the trucks to be operated in niches might be interpreted as “soft factor” for the technology to be developed and tested independent from market constraints, e.g., since not being dependent on a nationwide built-up of charging infrastructure. While some infrastructure alternatives can be built by individual operators, e.g., logistics companies, others require large infrastructure providers, e.g., governmental agencies. As discussed in [9], the infrastructure investment is a critical aspect in an early market diffusion. To appraise the niche operation possibility, we compare the total investments of the different infrastructures for the given scenario and calculate the number of vehicles that are necessary to bring charging infrastructure cost down to less than 0.2 EUR/km driven at or with the infrastructure.

2.2.4. Technical Readiness of Infrastructure

We compare the technical readiness of fast charging stations (FCS), overhead catenary infrastructure (OC) and battery swap stations (BSS). We gather size, building year and the degree of completion for different pilot projects in Germany and worldwide to determine the technical readiness. Therefore, we use the TRL, as described in Table 2.

2.2.5. Long-Term Infrastructure Cost

Long-term infrastructure cost are decisive for the widespread diffusion and success of the technology [9]. We calculate long-term per-kilometer cost for users for every infrastructure according to Equation (1) and compare the results. Since the operation of a catenary infrastructure in a niche operation of seven vehicles is economically not feasible, we presume a nationwide catenary infrastructure to be in place. For Germany, a network of 2000 km represents a potential early stage infrastructure setup, as described in [9]. We assume the installation of overhead catenaries on the considered highway being part of German-wide 2000 km infrastructure diffusion, since the operation of one OC-highway for seven vehicles can’t be economically feasible. Therefore, the long-term per-kilometer cost for CV are costs per kilometer actually driven under an OC. The cost for the usage of FCS and BSS are calculated per kilometer driven by a vehicle served from the infrastructure:
c i , s = I i , s × ( 1 + i ) T i × i ( 1 + i ) T 1 + c o p e x , i , s V K T i , s × v e h i , s ,
where I i , s is investment for infrastructure i and drivetrain s [EUR], i is interest rate, T i is investment horizon [a], c o p e x , i , s is operative expenditures for infrastructure i for vehicles of drivetrain s [EUR/a], V K T i , s is annual vehicle kilometers travelled by one vehicle of drivetrain s on infrastructure i [km], and v e h s is number of vehicles of drivetrain s driving on infrastructure i [#].

2.2.6. Operational Flexibility

Especially when using one vehicle on different routes operational flexibility is of special interest. We distinguish two types of operational flexibility. On the one hand, we use the autonomous range of the vehicles, e.g., the battery range on a single charge, as an indicator for operational flexibility [15]. As stated in [22], insufficient range causes users to reject the vehicles. On the other hand, there are conflicting priorities between high operational flexibility and load flexibility in the electricity grid. Therefore, we evaluate the different drivetrains in terms of their system-related charging flexibility. Additional batteries, which are needed e.g., for the smooth operation of the battery swap system, can buffer peak loads and promote network integration.

2.2.7. Total Cost of Ownership

The total cost of ownership are the major criteria to decide for or against a vehicle in transport business [9,22]. They determine the economic efficiency of the vehicle concept. We use Equations (2) and (3) to calculate TCO for the three selected drivetrains (BEV, CV and BSV) in the mid-term perspective (2030). The total cost of ownership (TCO) contains cost for the capital expenditure and cost for the operating expenditure. Both are calculated as kilometer-specific cost. In a battery swap station, more than one battery per vehicle is required to ensure the supply with fully charged batteries. Since the batteries in a BSV are interchangeable, the usage time of the battery in battery swap vehicles is independent from vehicle lifetime and thus different from the other vehicles with permanently installed batteries. We assume a longer usage for batteries of BSV than for BEV and CV:
a c a p e x s = ( I s × ( 1 + i ) T × i ( 1 + i ) T 1 + I s , B × b a t × ( 1 + i ) T B × i ( 1 + i ) T B 1 ) × 1 V K T s
where I s is investment for vehicles of drivetrain s without battery [EUR], i is interest rate, T is investment horizon [a], V K T s is annual vehicle kilometers travelled by vehicle of drivetrain s [km], I s , B is investment per battery for vehicles of drivetrain s [EUR],   b a t is number of batteries per vehicle [#], T B is investment horizon for battery [a], c e , s is cost for electric energy for vehicle of drivetrain s [EUR/kWh], e s is energy demand for vehicle of drivetrain s [kWh/km], c i , s is infrastructure usage cost for vehicle of drivetrain s [EUR/km], s h a r e i , s is share driven on infrastructure (1 for BEV and BSV, 0.4 for CV), and c O M , s is operations and maintenance for vehicle of drivetrain s [EUR/km].

2.3. Techno-Economic Assumptions

In general, our assumptions are based on the experience of the pilot projects and additional literature review. Table 3 sums up the estimated vehicle parameters. Assumed infrastructure parameters can be found in Table 4, general parameters in Table 5.
We assume that the considered technologies are commercially available, no prototype prices have to be paid. The data depict a price structure as it can be achieved until 2030.

3. Results

3.1. Results within the Defined Dimensions

3.1.1. Technical Readiness of the Vehicle

Within the framework of the pilot projects presented, no battery electric vehicles could be identified that meet the defined requirements. Today, heavy-duty battery electric trucks are tested under real-world conditions, mainly for inner-city logistics with ranges of 200 km (e.g., Daimler eActros [24]). Vehicles with a range of 250 km and recharging times smaller than one hour are not commercially available today. This implies that prototypes with lower performance requirements are demonstrated in the operational environment (TRL 7). In the planned “HoLa” pilot project [18], vehicles that meet the requirements set out here will be used as prototypes. However, these are currently still under development. Hence, we assume TRL 5 for BEV in the specific use case.
For CV, there are several demonstration projects in Germany and worldwide (cf. Table 6). Within the presented eWayBW project, prototype vehicles are available for testing. Battery capacity is currently still below the requirements of the scenario presented here, but will be expanded with each new generation of vehicles. Therefore, the vehicle technology is demonstrated in the relevant environment (TRL 6).
For BSV, RouteCharge is the only project known to the authors. The vehicle used in the project meets the requirements defined in the setting. In particular, the battery can be changed within the specified time. Currently, a forklift performs the battery change, the process is not yet automated. From a vehicle perspective, the project demonstrated all requirements in the relevant environment (TRL 6).
Please note, that this description is rather indicative.

3.1.2. Necessity of Vehicle Standardization

While all three technologies need standardization of plugs and voltage level, BSV need additional standardization with respect to the swap system. Agreements between manufacturers would be necessary. Hence, the necessity of standardization is more complex for BSV.

3.1.3. Possibility to Be Operated in Niches and Long-Term Infrastructure Cost

The following results refer to the systems described in Figure 2. We assess the niche operation possibility by the number of vehicles that are necessary to bring charging infrastructure cost down to less than 0.2 EUR/km for the given scenario. That corresponds to the infrastructure cost for seven battery swap vehicles. The first three rows of Table 7 sum up the results for an infrastructure as it is described in Table 1. While battery swap stations and fast charging infrastructure might be interesting with a vehicle fleet of seven vehicles, overhead catenary infrastructure cannot be operated within a niche, as indicated by the high number of vehicles that are necessary for low infrastructure cost. Therefore, we assume a German-wide infrastructure diffusion for CV in the long term. The long-term infrastructure cost in Table 7 are calculated with the data from Table 4. If a German-wide CV infrastructure is highly used, it can be clearly cheaper in terms of per kilometer cost than a BEV or a BSV infrastructure. The CV infrastructure has to be prepared for higher usage due to the construction from the very beginning. Therefore, a higher usage will spread almost the same costs over more vehicles.

3.1.4. Technical Readiness of Infrastructure

Today, battery electric trucks are charged with the technology adapted from the passenger car sector with a maximum of 350 kW. Within the project HoLa, vehicle manufacturers plan to improve the charging power to serve use cases as the one given in the setting. In summary, the BEV infrastructure technology is validated in lab (TRL 4). Up to now, there are no industrial standards and no public demonstration projects.
As mentioned in Table 6, overhead catenary infrastructure is demonstrated in the relevant environment (TRL 6) during several demonstration projects.
RouteCharge validates BSV infrastructure in the relevant environment (TRL 5). Today the battery swap works manually. However, applications for port vehicles show that automation of battery swap is possible. Also for BSV infrastructure, fast charging needs to be improved if a larger number of vehicles shall be supplied. Additional batteries are an alternative option, which might be used in the meantime.

3.1.5. Operational Flexibility

The operational flexibility depends on the battery range of the electric truck as well as the idling time of the vehicle for charging. The higher the battery range, the lower the need for a dense charging infrastructure. While charging times must be considered in the operation of a BEV and a BSV truck, catenary trucks allow for charging along the overhead lines while driving. Accordingly, operational flexibility is higher. Since the battery range is higher too, CVs offer the highest flexibility, followed by BEVs and BSVs from a user perspective. From a grid perspective, BSV seems interesting, since the additional batteries in the stations could buffer load peaks. Further investigations within the RouteCharge project show, that grid services are financially interesting, as long as the infrastructure is not highly used.

3.1.6. Total Cost of Ownership

Finally, Figure 3 provides the TCO calculation for all three alternatives. In total, the CV is potentially 5% cheaper than BEV and BSV in the long term. In general, however, the cost differences are quite small.

3.2. Summary

Table 8 summarizes our findings. The main advantage of the electric truck (BEV) is the possibility of niche operation, while the needed high-power charging infrastructure is still to be developed and tested. In this context, the negative assessment of technical readiness of the vehicle is strongly correlated to the required recharging power in the described scenario. The advantages of the battery swap truck (BSV) are comparable, whereby the BSV benefits from lower required charging power. Manufacturers do not seem to be interested in this technology, due to the necessity for standardization of the battery swap system, which has large implications on vehicle design. Finally, the built-up of overhead lines for catenary trucks is challenging due to high investments and the need for heavy use to bring down per kilometer cost. Accordingly, niche operation is not possible. However, once high utilization is reached, this technology allows for lowest total cost.

4. Discussion

Our results represent a wide range of potential electrification options for heavy-duty vehicles. Compared to previous work on electric drivetrains for heavy-duty vehicles, we add the BSV as third alternative compared to pure battery vehicles with fast charging infrastructure (BEV) and CV.
To the best of the authors’ knowledge, this is the first study to compare these three options using information from actual implemented pilot projects. Previous studies were based on announcements by manufacturers (cf. [15]). Our results confirm the assessment of BEV and extend the consideration to include CV and BSV. Our setting is typical for a long-distance shuttle traffic and thus considers a relevant market. Since the technical readiness highly depends on the requirements future studies should consider further settings.
Compared to previous work, we identified standardization as another key aspect of market introduction. Our approach to identify additional components considers the problem on a high level and is characterized by experience from the pilot projects. Future studies could further analyze the vehicles at component level or evaluate beginning standardization processes.
Our analysis on niche applications and long-term infrastructure costs reveal a major conflict in the electrification of HDV. The overhead catenary system, as the most cost-effective solutions in the long-term comes with the highest ramp-up costs. The direct comparison shows that a combination of different electric drivetrains at different stages of market diffusion could be effective. For example, fast charging infrastructure for BEV could be designed as stationary overhead charging points. Then, the CV could charge locally at an early stage of market diffusion, reducing necessary overhead line construction. These considerations need to be evaluated in terms of their cost-effectiveness, but are highly relevant to the infrastructure and vehicle standardization currently under development.
Compared to previous studies, the CV has a large battery capacity. This results from the fact that the route in our setting is only partially equipped with overhead lines. At the same time, the CV gains operational flexibility compared to the alternatives without generating significantly higher overall costs. As shown in [19], further overhead catenary infrastructure could even increase the economic efficiency of CV.
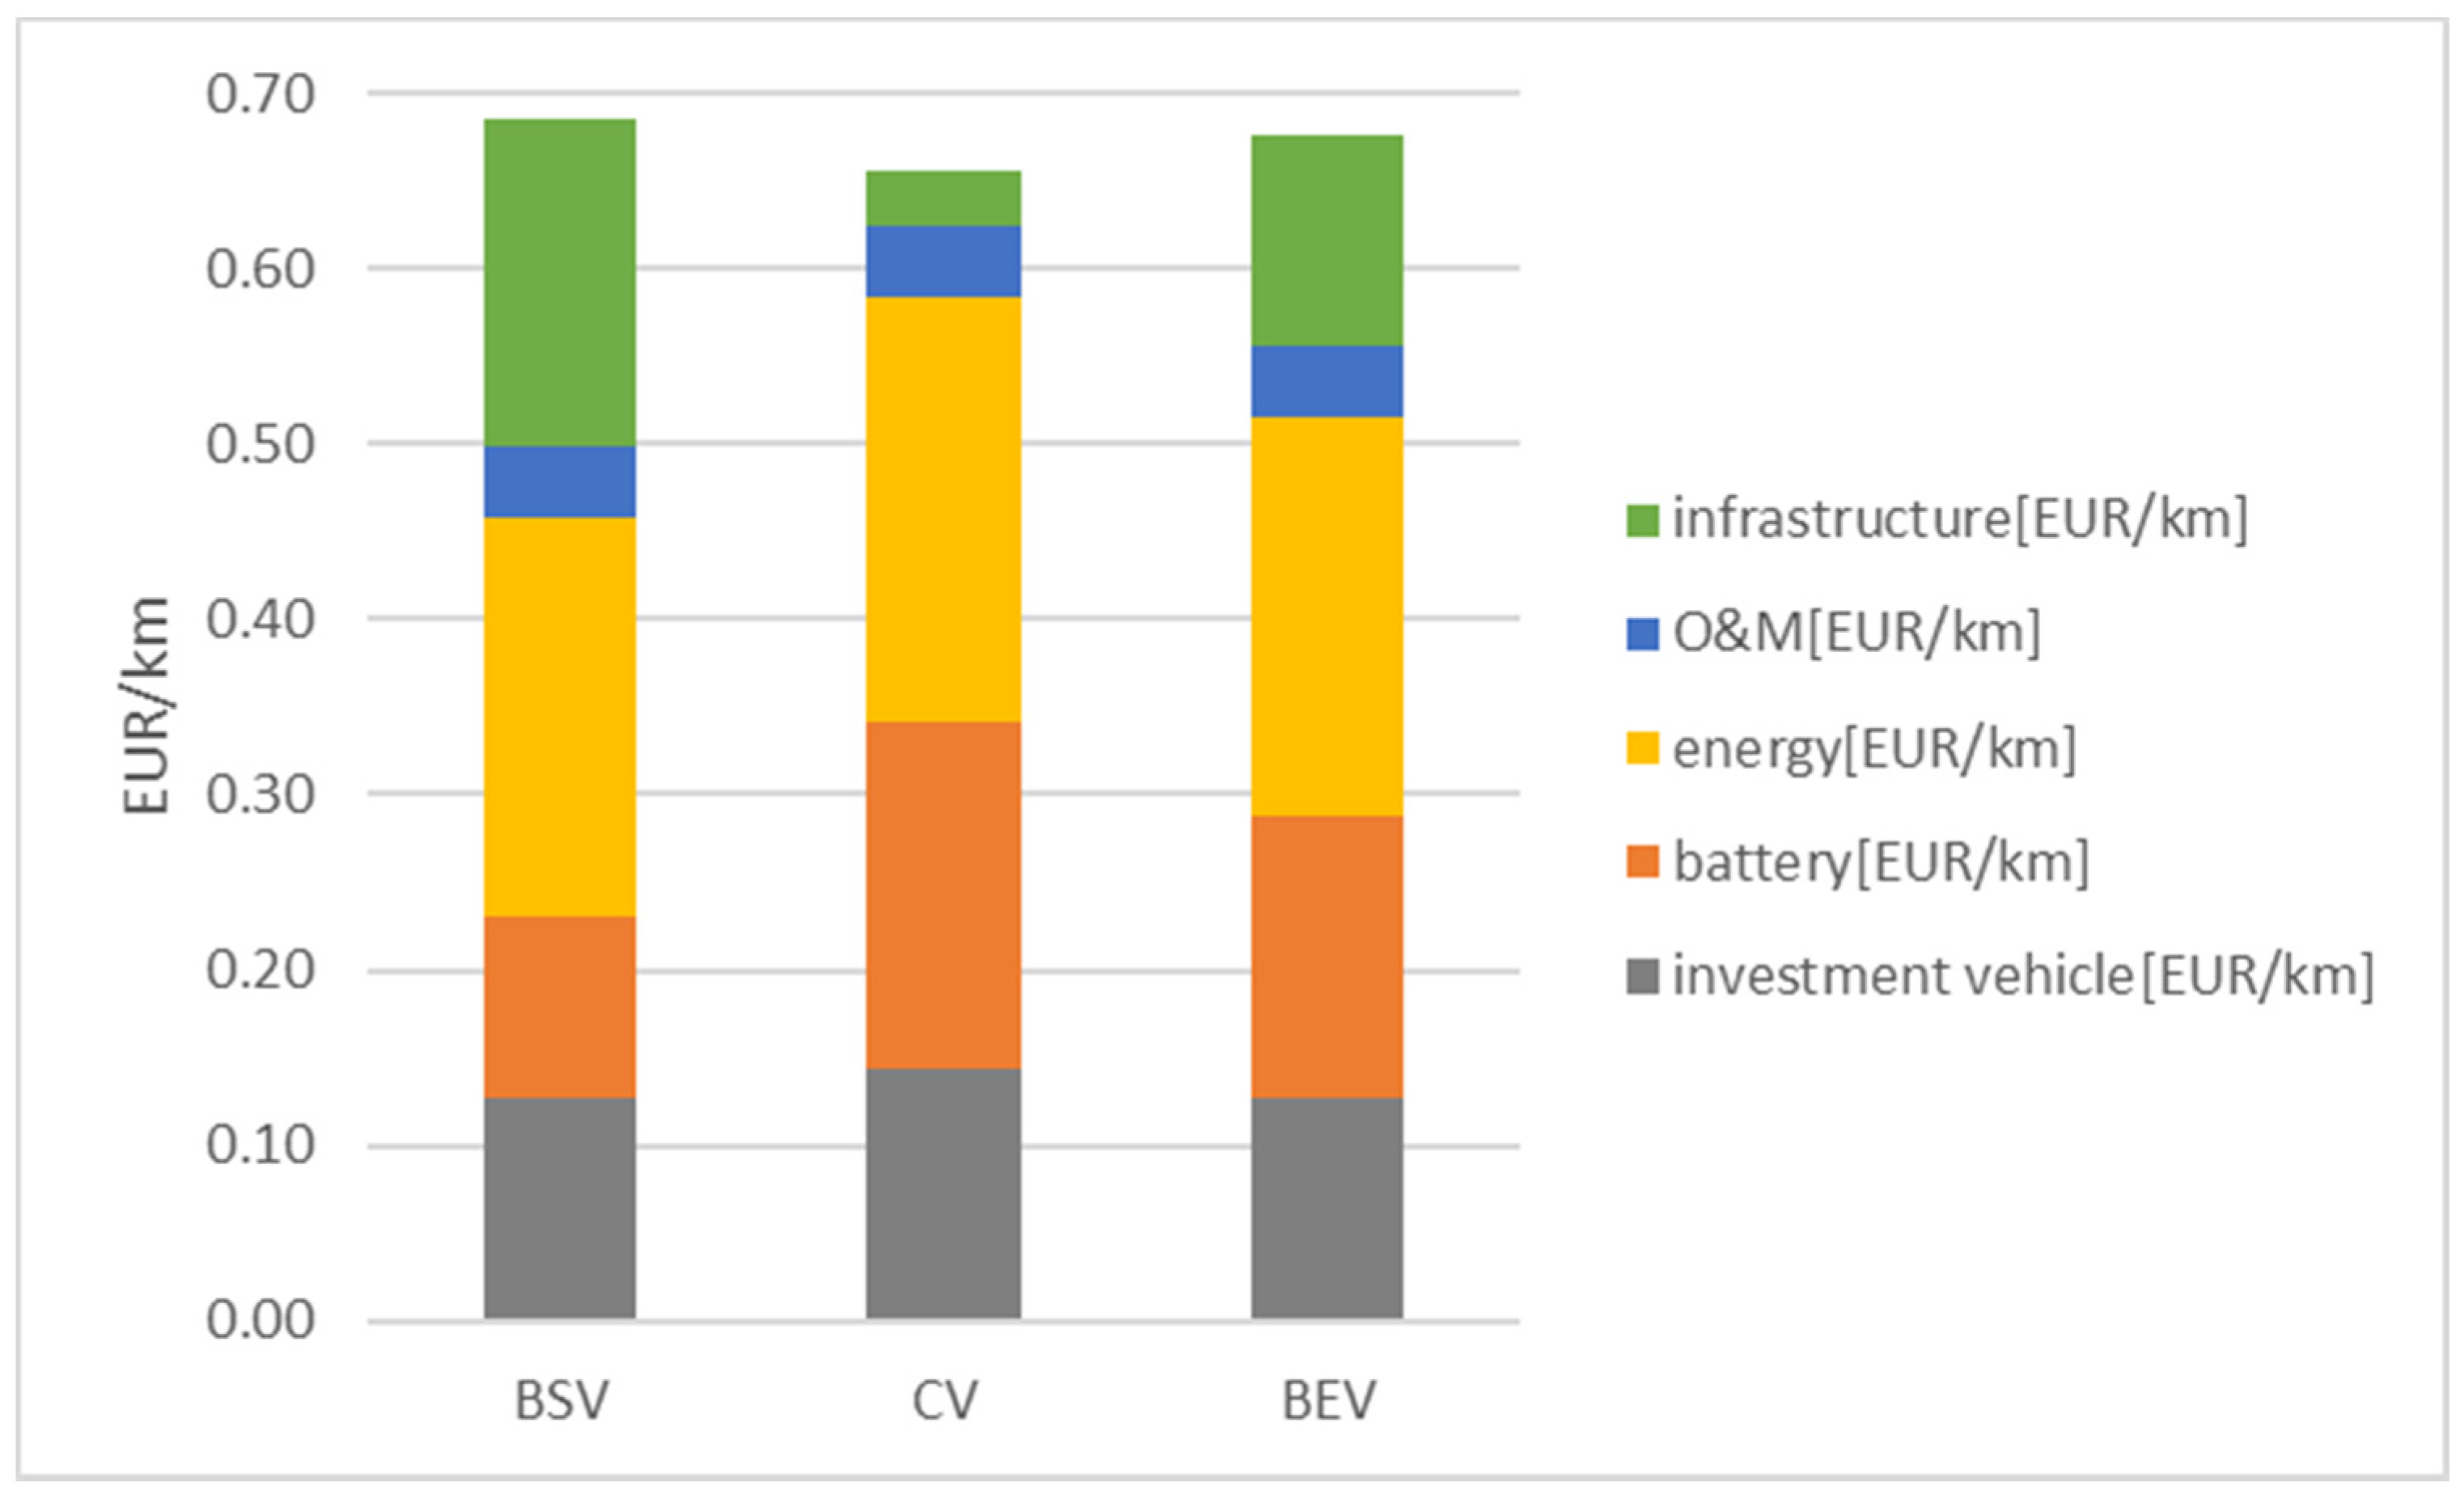
The results show that in the long term all alternatives considered are competitive with each other from a cost perspective. Since energy prices and future battery development in particular are subject to uncertainty, sensitivities were calculated. Despite higher energy consumption of the CV, its slight advantage remains stable. Sensitivity analyses in which the electricity price was increased by 25% reduce its advantage over the alternatives by one percentage point. If the battery price increases by 25%, all alternatives reach cost parity.
All in all, our multidimensional assessment allows insights beyond the pure cost structure. The consideration of various pilot projects provides a practical perspective and can highlight issues that are not identified in techno-economic system studies. However, these advantages also lead to some limitations. Our research represents a momentary snapshot and is based on a predefined setting. This was identified as a typical use case in consultation with freight carriers. However, a significant change in the setting can lead to significant changes in the cost structure. Future studies should examine the applicability to other heavy-duty vehicle operations.
Based on our research, we recommend that decision-makers in politics and business combine the advantages of the alternatives presented here. As a first step, BEV and possibly BSV should be used to bring electric vehicles to market without a large-scale infrastructure. However, a gradual introduction of CV, which is more favorable at high penetration rates, should also be considered. This includes developing both systems interchangeably, for example by making the pantograph the standard technology for stationary charging.

Author Contributions

Conceptualization, D.S. and S.Á.F.; methodology, D.S. and S.Á.F.; validation, D.S. and S.Á.F.; formal analysis, D.S. and S.Á.F.; investigation, D.S. and S.Á.F.; data curation, D.S.; writing—original draft preparation, D.S.; writing—review and editing, S.Á.F.; visualization, D.S.; supervision, S.Á.F.; project administration, S.Á.F. All authors have read and agreed to the published version of the manuscript.

Funding

The findings were retrieved within the projects eWayBW (FKZ 16EM3167-1), funded by the German Federal Ministry for the Environment, Nature Conservation and Nuclear Safety (BMU) and RouteCharge (FKZ 01ME15005A), funded by the German Federal Ministry for Economic Affairs and Energy (BMWi).

Conflicts of Interest

The authors declare no conflict of interest.

References

  1. Speth, D.; Funke, S.Á. Comparing Options to Electrify Heavy-Duty Vehicles. Findings of German Pilot Projects. In Proceedings of the 33rd World Electric Vehicle Symposium & Exposition, Portland, OR, USA, 14–17 June 2020. [Google Scholar] [CrossRef]
  2. European Union (EU). EU28: Reference Scenario (REF2016): Summary Report. Primes Ver. 4 Energy Model. Available online: https://data.europa.eu/euodp/de/data/dataset/energy-modelling/resource/9c3eaead-81b8-4a3d-a23d-4dd4a13f3c6e (accessed on 31 March 2021).
  3. Liimatainen, H.; van Vliet, O.; Aplyn, D. The potential of electric trucks—An international commodity-level analysis. Appl. Energy 2019, 236, 804–814. [Google Scholar] [CrossRef]
  4. KiD. Kraftfahrzeugverkehr in Deutschland 2010; WVI Prof. Dr. Wermuth Verkehrsforschung und Infrastrukturplanung GmbH: Braunschweig, Germany; Institut für Angewandte Verkehrs- und Tourismusforschung e.V.: Heilbronn, Germany; Deutsches Zenbtrum für Luft- und Raumfahrt-Institut für Verkehrsforschung: Berlin, Germany; Kraftfahrt-Bundesamt: Flensburg, Germany, 2010.
  5. Thielmann, A.; Sauer, A.; Wietschel, M. Gesamt-Roadmap Energiespeicher für die Elektromobilität 2030; Fraunhofer ISI: Karlsruhe, Germany, 2015. [Google Scholar]
  6. Çabukoglu, E.; Georges, G.; Küng, L.; Pareschi, G.; Boulouchos, K. Battery electric propulsion: An option for heavy-duty vehicles? Results from a Swiss case-study. Transp. Res. Part C Emerg. Technol. 2018, 88, 107–123. [Google Scholar] [CrossRef]
  7. Mareev, I.; Sauer, D. Energy Consumption and Life Cycle Costs of Overhead Catenary Heavy-Duty Trucks for Long-Haul Transportation. Energies 2018, 11, 3446. [Google Scholar] [CrossRef] [Green Version]
  8. Kühnel, S.; Hacker, F.; Görz, W. Oberleitungs-Lkw im Kontext Weiterer Antriebs- und Energieversorgungsoptionen für den Straßengüterverkehr: Ein Technologie- und Wirtschaftlichkeitsvergleich, Erster Teilbericht des Forschungsvorhabens “StratON–Bewertung und Einführungsstrategien für Oberleitungsgebundene Schwere Nutzfahrzeuge”; Öko-Institut: Berlin, Germany, 2018. [Google Scholar]
  9. Wietschel, M.; Gnann, T.; Kühn, A.; Plötz, P.; Moll, C.; Speth, D.; Buch, J.; Boßmann, T.; Stütz, S.; Schellert, M.; et al. Machbarkeitsstudie zur Ermittlung der Potentiale des Hybrid-Oberleitungs-Lkw: Studie im Rahmen der Wissenschaftlichen Beratung des BMVI zur Mobilitäts- und Kraftstoffstrategie, Auftraggeber: Bundesministerium für Verkehr und Digitale Infrastruktur (BMVI), Fraunhofer Institut für System- und Innovationsforschung; Fraunhofer Institut für Materialfluss und Logistik; PTV Group; MFIVE; Technische Universität Hamburg-Harburg: Karlsruhe, Germany, 2017. [Google Scholar]
  10. Wietschel, M.; Gnann, T.; Plötz, P.; Doll, C. Electric Trolley Trucks—A Techno-Economic Assessment for Germany. WEVJ 2019, 10, 86. [Google Scholar] [CrossRef] [Green Version]
  11. Plötz, P.; Gnann, T.; Jochem, P.; Yilmaz, H.Ü.; Kaschub, T. Impact of electric trucks powered by overhead lines on the European electricity system and CO2 emissions. Energy Policy 2019, 130, 32–40. [Google Scholar] [CrossRef]
  12. Jöhrens, J.; Rücker, J.; Kräck, J.; Allekotte, M.; Jamet, M.; Keller, M.; Lambrecht, U.; Waßmuth, V.; Paufler-Mann, D.; Veres-Homm, U.; et al. Roadmap OH-Lkw: Potentialanalyse 2020–2030: Kurzfristig Realisierbare Potenziale für den Wirtschaftlichen Betrieb von OH-Lkw, Analyse im Rahmen des Verbundvorhabens “Roadmap OH-Lkw”. Institut für Energie- und Umweltforschung Heidelberg (IFEU); PTV Group; Fraunhofer IIS: Heidelberg, Germany, 2018. [Google Scholar]
  13. Yang, L.; Hao, C.; Chai, Y. Life Cycle Assessment of Commercial Delivery Trucks: Diesel, Plug-In Electric, and Battery-Swap Electric. Sustainability 2018, 10, 4547. [Google Scholar] [CrossRef] [Green Version]
  14. Kluschke, P.; Gnann, T.; Plötz, P.; Wietschel, M. Market diffusion of alternative fuels and powertrains in heavy-duty vehicles: A literature review. Energy Rep. 2019, 5, 1010–1024. [Google Scholar] [CrossRef]
  15. Gnann, T.; Plötz, P.; Kühn, A.; Wietschel, M. How to decarbonize heavy road transport? In Consumption, Efficiency & Limits. European Council for an Energy-Efficient Economy; Lindström, T., Ed.; ECEEE Secretariat: Stockholm, Sweden, 2017; pp. 901–909. [Google Scholar]
  16. Ministry of Transport Baden-Württemberg. eWayBW: Pilotprojekt zu Hybrid-Oberleitungs-Lkw auf Öffentlichen Straßen. Available online: https://ewaybw.de/html/content/ewaybw.html (accessed on 31 March 2021).
  17. MC Management GmbH. RouteCharge: Batteriewechselsystem für die Erschließung Mittlerer Distanzen bei der Filialbelieferung mit e-NFZ. Available online: https://www.routecharge.de/ (accessed on 31 March 2021).
  18. Verband der Automobilindustrie (VDA). Branchenübergreifendes Konsortium Reicht Förderantrag zum Megawattladen für Nutzfahrzeuge ein. Available online: https://www.vda.de/de/presse/Pressemeldungen/210309-Branchen-bergreifendes-Konsortium-reicht-F-rderantrag-zum-Megawattladen-f-r-Nutzfahrzeuge-ein (accessed on 31 March 2021).
  19. Speth, D.; Funke, S.Á. A techno-economic comparison of battery swap and electric road systems for heavy road transport. A German case study. In Proceedings of the 3rd Electric Road Systems Conference 2019, Frankfurt am Main, Germany, 7–8 May 2019. [Google Scholar]
  20. European Commission. HORIZON 2020—Work Programme 2014–2015: G. Technology Readiness Levels (TRL). General Annexes, Extract from Part 19-Commission Decision C(2014)4995. Available online: https://ec.europa.eu/research/participants/data/ref/h2020/wp/2014_2015/annexes/h2020-wp1415-annex-g-trl_en.pdf (accessed on 31 March 2021).
  21. Bakker, S.; Leguijt, P.; van Lente, H. Niche accumulation and standardization—The case of electric vehicle recharging plugs. J. Clean. Prod. 2015, 94, 155–164. [Google Scholar] [CrossRef]
  22. Kluschke, P.; Uebel, M.; Wietschel, M. Alternative Powertrains in Road-Bound Heavy-Duty Transport: A Quantitative Determination of User Requirements for Heavy-Duty Vehicles and Their Infrastructure. Work. Paper Sustain. Innov. 2019. Available online: https://www.isi.fraunhofer.de/content/dam/isi/dokumente/sustainability-innovation/2019/WP05-2019_Nutzeranforderungen_Kluschke_en.pdf (accessed on 31 March 2021).
  23. Auf der Maur, A.; Rommerskirchen, S.; Strassburg, S. Aktualisierung des Referenzszenarios für die Einsparpotentiale der Treibhausgas Emissionen und des Endenergieverbrauchs im Verkehr für die Zeithorizonte 2020 und 2050: Aktualisierung der Prognoseergebnisse Sowie Abschätzung und Bewertung Politischer Maßnahmen. Vertraulich. Client: Federal Ministry for Transport and Digital Infrastructure (BMVI); Prognos AG: Basel, Switzerland, 2015. [Google Scholar]
  24. Daimler, A.G. Investor Relations Release: Sustainable, Fully Electric and Quiet: Mercedes-Benz eActros to Roll Out to Customers in 2018. Available online: https://www.daimler.com/documents/investors/news/capital-market-releases/daimler-mercedes-benz-ir-release-en-20180221-1.pdf (accessed on 31 March 2021).
Figure 1. Daily vehicles kilometers travelled by heavy-duty vehicles (semitrailer trucks) in Germany. Data from [4].
Wevj 12 00067 g001
Figure 2. Structure for BEV, CV and BSV charging infrastructure.
Wevj 12 00067 g002
Figure 3. TCO analysis for different drivetrains 2030.
Wevj 12 00067 g003
Table 1. Comparison of the different technologies (assumptions).
AttributeBattery Electric Vehicle (BEV)Catenary Vehicle (CV)Battery Swap Vehicle (BSV)
Daily mileage500 km (one direction: 250 km)
Infrastructure description2 charging points at both end points of the routeOne section of 100 km overhead lines starting at one end point3 swapping stations along the route
Max. capacity of infrastructure5 vehicles/h180 vehicles/h5 vehicles/h
Max. power5 charging points with 450 kW per station1 MW per km2 charging point with 450 kW per station
Max. distance to travel without recharging 250 km300 km125 km
Battery capacity 525 kWh650 kWh275 kWh
Battery range293 km342 km153 km
Table 2. Technology readiness levels (TRL) [20].
TRLDescription
1Basic principles observed
2Technology concept formulated
3Experimental proof of concept
4Technology validated in lab
5Technology validated in relevant environment (industrially relevant environment in the case of key enabling technologies)
6Technology demonstrated in relevant environment (industrially relevant environment in the case of key enabling technologies)
7System prototype demonstration in operational environment
8System complete and qualified
9Actual system proven in operational environment (competitive manufacturing in the case of key enabling technologies; or in space)
Table 3. Techno-economic vehicle parameters.
AttributeAbbreviationUnitBEVCVBSVSource
Investment for vehicles of drivetrain s without battery I s EUR77,59087,59077,590[7,8,9]
Investment horizonTa666[8,9]
Investment per battery for vehicles of drivetrain s I s , B EUR97,650120,90051,150[9]
Investment horizon for battery T B a6610[19]
number of batteries per vehicle b a t #111.86[17]
annual vehicle kilometers travelled by a vehicle of drivetrain s V K T s km120,000120,000120,000[8]
energy demand for a vehicle of drivetrain s e s kWh/km1.421.511.42[8]
operations and maintenance for a vehicle of drivetrain s c O M , s EUR/km0.04110.04110.0411[9]
Table 4. Use case specific infrastructure parameters.
AttributeAbbreviationUnitBEVCVBSVSource
Investment for infrastructure i, drivetrain s I i , s kEUR11763,421,0001849[9,17,19]
Investment horizon T i a303030[9]
operative expenditures for infrastructure i, drivetrain s c o p e x , i , s EUR/a24,00068,420,00037,000[9,17,19]
Annual vehicle kilometers travelled by one vehicle of drivetrain s on infrastructure i V K T i , s km120,00061,900120,000[9]
Number of vehicles of drivetrain s driving on infrastructure i v e h s #761,8757[9,17,19]
Table 5. General parameters for calculation.
AttributeAbbreviationUnitBEVCVBSVSource
Interest rate i %555[9]
cost for electric energy for vehicle of drivetrain s c e , s EUR/kWh0.160.160.16[23]
Table 6. Catenary vehicle projects worldwide.
ProjectRegionPeriodElectrified Section
eHighway USALos Angeles & Long Beach 20171.6 km
eHighway SwedenGävle–Sandviken2016–20182 km
eWayBW GermanyGernsbach–Kuppenheim 2017–20234 km
ELISA GermanyFrankfurt-Darmstadt2017–20226 km
FESH GermanyHamburg-Lübeck2017–20226 km
Table 7. Infrastructure cost.
AttributeUnitBEVCVBSV
Total infrastructure cost for the given scenariokEUR1176171,0501849
infrastructure per-km cost for seven vehicles EUR/km0.1217.320.19
Number of vehicles, if c i , s × s h a r e i , s <0.2 EUR/km#56077
long term infrastructure costEUR/km0.120.030.19
Table 8. Summary assessment in seven dimensions for long-haul trucks.
BEVCVBSV
Technical readiness vehicle−/ooo
Necessity of standardizationoo
Possible niche operation++
Technical readiness infrastructureo
Long-term infrastructure cost per kmo+o
Operational flexibilityo+o
Total cost of ownershipo+o
+ advantage, o neutral, − disadvantage.
Publisher’s Note: MDPI stays neutral with regard to jurisdictional claims in published maps and institutional affiliations.

