1. Introduction
Today’s population shows an increasing need for mobility [
1]. This results in major traffic problems, especially in cities and conurbations. The infrastructure can no longer cope with this increased traffic volume, which ultimately leads to congestion, noise, and overloaded public transport. Additionally, the pollution thresholds are not adhered to due to the increase in individual motorized traffic. In many German cities, driving bans have therefore already been implemented [
2]. To resolve this problem, firstly, the optimization of conventional means of transport and, secondly, the implementation of new means of transportation and mobility, should be considered. However, new mobility solutions do not only have advantages. Many of these new systems also result in negative effects, e.g., in the area of the operation model. One of the most famous examples globally is “O-Bike”, who offered their bike-sharing solution, not only in Germany, but also in Australia and China [
3]. Due to a lack of organizational measures by suppliers, the bikes were indiscriminately parked in cities, thus blocking public footpaths. The city populations reacted with vandalism. Thus, the hoped-for traffic innovation did not appear to find acceptance among the population and the company has since withdrawn from the market.
A new means of transport for the German market is personal light electric vehicles (PLEVs). Due to their small size and portability, PLEVs have significant potential for the interconnection of several means of transport in an intermodal travel chain; for example, it is possible to take a PLEV onto public transport or in cars. As a consequence of this property, this mode of transport is ideal for overcoming the first- and last-mile issue. The most common form of PLEV at present is the e-scooter (e-kick-scooter). This new type of mobility, and its use, are part of the public discourse and discussed in the media. However, media awareness mostly focuses on individual incidents (e.g., accidents) or suspicions. Studies dealing with their use and impact on traffic remain the exception rather than the rule. As a result, this study investigated the potential of e-scooters based on the following research question:
What is the time- and cost-potential of e-scooters for individual users and which influences do they have on the environmental balance?
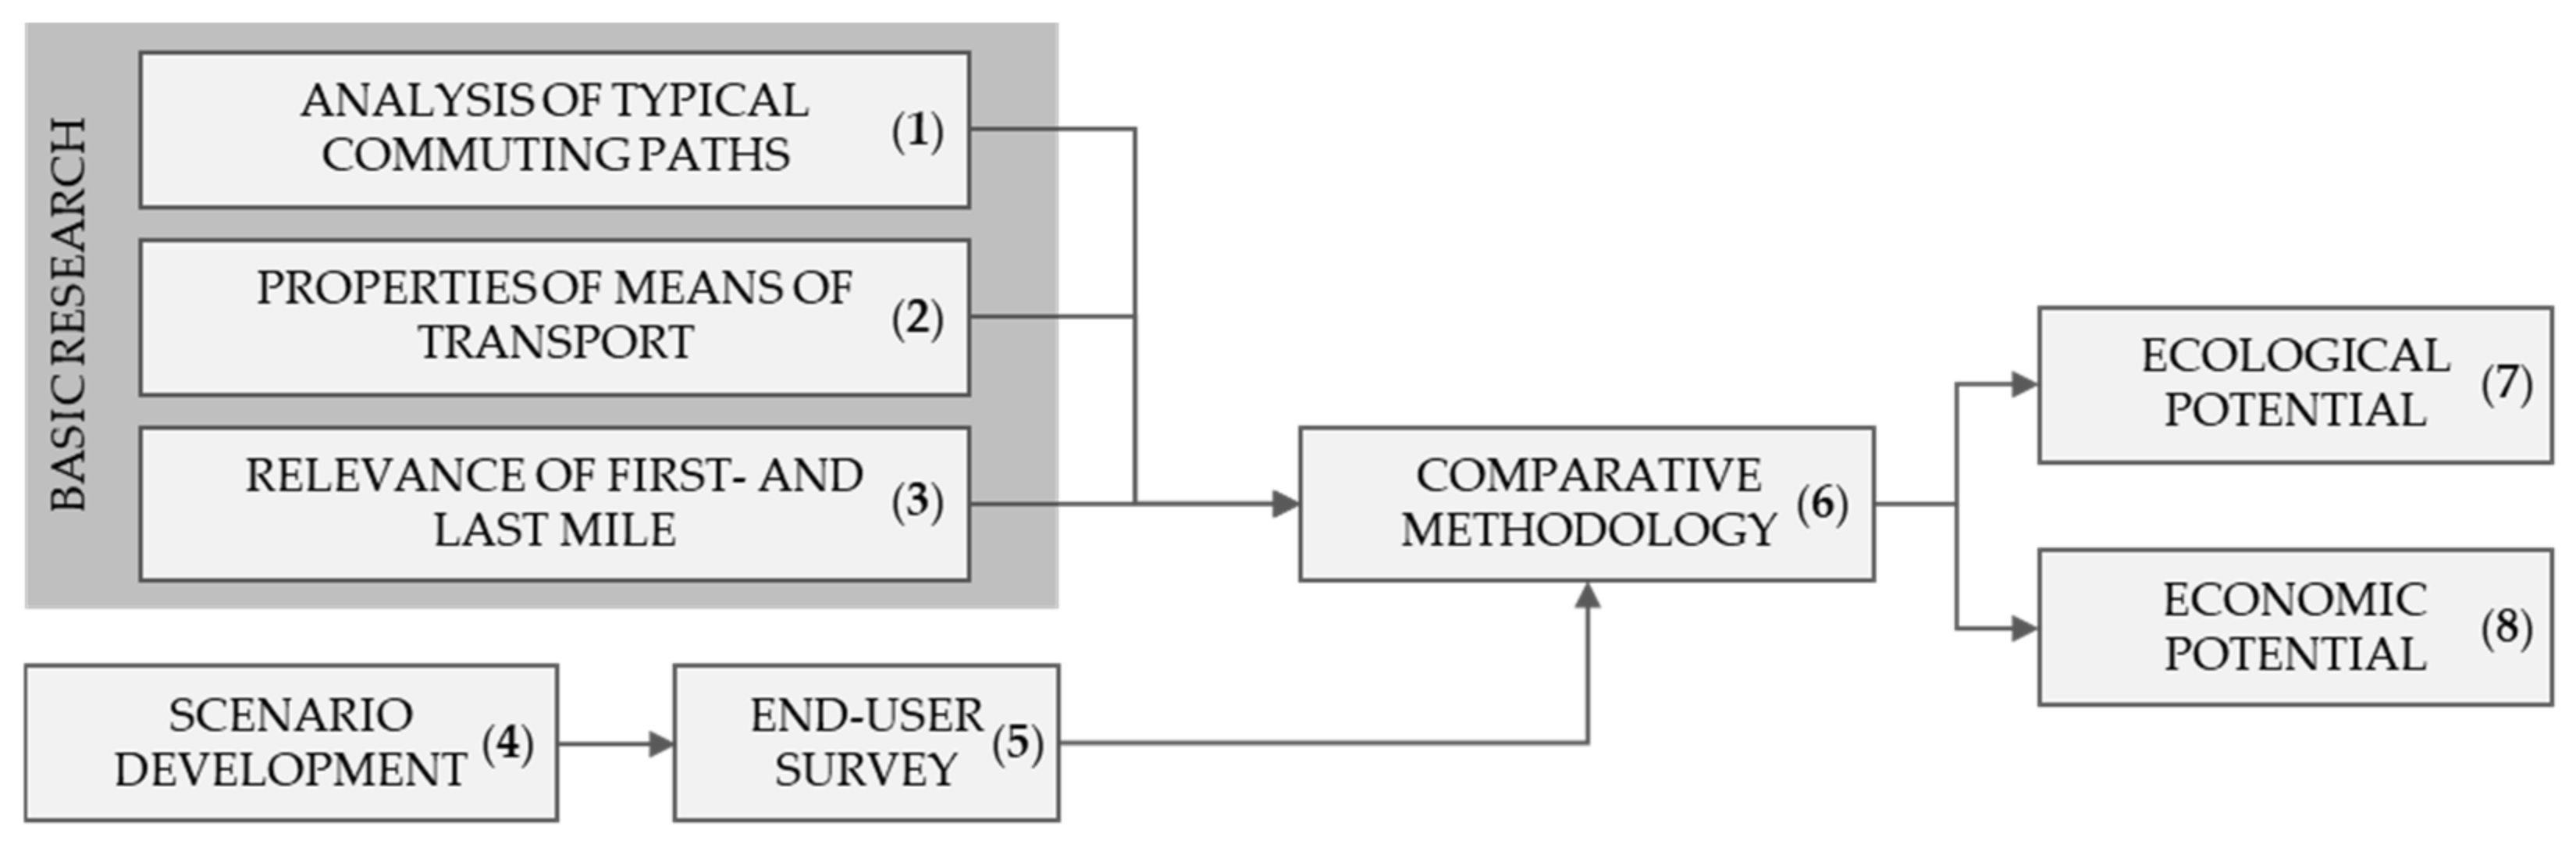
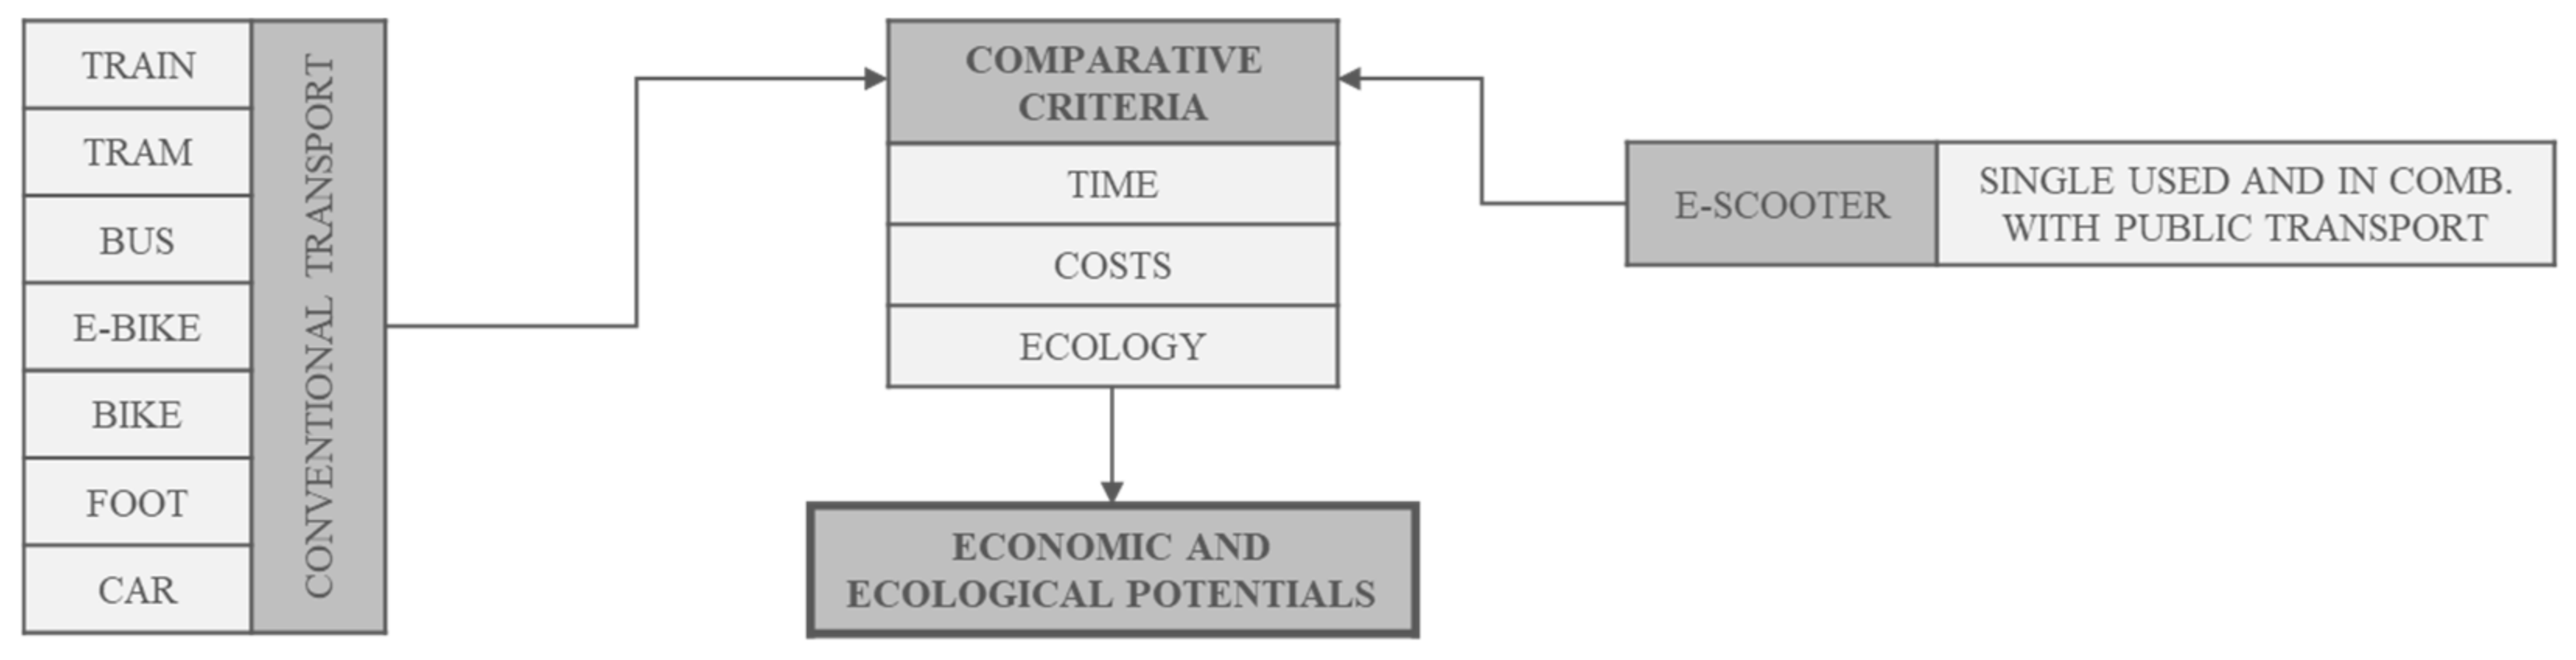
Thus, this study focused on routes to work within the German market. As commuters mostly travel highly optimized routes, any improvements are beneficial. Furthermore, because work paths are already predefined, users were able to provide detailed information in the conducted survey. The overarching research interest lies in the comparison of the use of e-scooters and other means of transport on typical commuting paths. The methodical approach consisted, firstly, of a literature search to identify properties of commutes, means of transport, and the first and last mile. Secondly, the user’s preferences for e-scooters were detected via a survey, which included different mobility scenarios. These data were collated and evaluated in a comparative methodology, in which the ecological and economic potential of e-scooters was derived. The methodology of this study is presented in detail in the following section, followed by the compilation of the state-of-the-art research within this field.
Section 3 focusses on the results of the evaluated datasets, the conducted end-user survey, and the executed calculations. In
Section 4, the results are summarized and the key findings are highlighted. This paper is based on [
4] and shows extended results.
3. Results
The applied method helped analyze the potential of e-scooters on commuting paths. In this section, the results are presented.
3.1. Results of the Basic Research
The analysis of mobility behavior on commuting paths (including vocational training) was based on data of the Federal Ministry of Transport and Digital Infrastructure Germany, collected within the scope of “Mobility in Germany” (MiD) between 2008 and 2017. On average, a respondent commuted 39 km daily in 2017, taking 80 min. Distances up to 5 km represented the highest share, of 47%, whereas the segments of 5–10 km and 10–20 km had shares of 18% each. One-twentieth of commuters cover a distance of more than 50 km a day. Respectively, commutes and other work-related journeys (business trips, journeys to customers, etc.) represent one-third of the total mobility volume. The indicated relevance reveals the need for a representative case to analyze the use of personal light electric vehicles. An examination of the required time suggests that one-third of all commutes take less than 15 min. Another third takes between 15 and 30 min. After describing the distance and duration of typical commuting paths, the chosen means of transport was assessed. A share of 49% of respondents use a car (only MIT as driver and passenger), 18% of whom as a passenger. Public transport, bikes, and journeys by foot, respectively, represented 15%, 13%, and 12% of commuting paths. In contrast, combinations of different modes of transport only played a minor role (
Table 1).
Based on the information about the modes of transport, it was identified if intermodal use was prevalent. A share of 20% claimed that they used two or more means of transport for commuting, whereas 73% only used one. Consequently, the intermodal use of means of transport offers significant potential. These depicted values of commuting paths build the basis for the case study in
Section 3.4, which features typical commuting paths based on data of the MiD study. The applicability of PLEVs was tested for each of these typical paths. The next step in the basic research was the identification of specific properties of means of transport. The average speed, the cost per kilometer, and the GWP per passenger kilometer were determined. To assess the time needed and the average velocity in the case of public transport, the regional timetable was used. The time durations for first and last mile (FLM) were calculated similar to the manner used for the time needed for the main means of transport in Formula (1). Therefore, the velocities of the respective means of transport covering the FLM (e.g., by walking or e-scooter) and the distance of the FLM were used. For connections to train or public transport stations, a time of 5 min for parking and walking to the platform was added when using individual transport (e.g., car, bike, e-scooter). When arriving by foot, only 2 min were added, as no additional vehicle parking is required. As it is already included in the respective routes, the transfer times between means of public transport were not specified. To rate the financial aspect of the different means of transport, the costs in cents (EUR) per passenger kilometer were analyzed. The stated values can vary strongly depending on the means of transport being used. Hence, average values (acquisition cost, maintenance, consumption, duration of use, etc.) were used. The public transport costs depend on regional pricing. To rate the sustainability of the different means of transport, the Global Warming Potential (GWP) was used.
Table 2 shows the values of the included criteria.
Research on the topic of mobility behavior shows that young adults (20–29 years), in particular, aim to use public transport, bicycle, or walk. This is also true for car owners who use their car less often than previously and demonstrate a stronger affinity for multimodal traffic [
20]. Data from a German mobility panel indicates the same constant increase in people with multimodal behavior, from 3–6% in 1997 (depending on age) to 4–9% in 2011. A survey of 170 people in the Rhine-Neckar region suggests that 18% of covered distances are intermodal [
11]. Of these respondents, 82% were found on paths with three stages, mostly with public transport as the main means of transport. Thus, intermodal sections are paths to cover the first and last mile. According to these studies, one can expect the relevance of the FLM to further increase, meaning that research considering the first and last mile is necessary. A study on the behavior of underground railway users in New Delhi analyzed the characteristics of the FLM. Most of the FLM paths were found to be covered by walking (mostly more than 50%). The covered distance for the FLM reached—depending on the location of the station—between 0.7 and 4.2 km [
21]. A study in the USA found that there were significant differences when choosing the means of transport depending on the setting of the public transport station. In the inner city, two-thirds of people reached their station by walking, whereas in the suburbs only 5% arrived on foot (compared to 85% by car). The cause for this seems to be the maximum reasonable walking distance of 400 to 600 meters, which at times can be doubled by using good infrastructure (e.g., safe walkways). For distances over 1.6 km, the share of pedestrians decreased under 10%, whereas the motorized individual transport reached its maximum. The share of cyclists did not depend on the distance, and was in the lower single-digit percentile range overall [
22]. These results underline both the current relevance and the importance of FLM-mobility as a field in future urban mobility.
3.2. General Results of the End User Survey
In the context of this study, 152 people were surveyed in total, 120 online and 32 personally. The share of male participants was 73.0% (111 people) and that of female participants was 26.3% (40 people). One respondent chose the sex “diverse” (0.7%). A sample size of one was not considered further for gender-specific evaluations. As described above, the aim of the survey was to interview people with and without experience with e-scooters and comparable vehicles, to obtain an overview of opinions and estimate their potential as a commuting vehicle. Therefore, the survey was conducted at the “micromobility-expo” fair in Hannover, Germany (3–4 May 2019), and online (10–24 May 2019). In total, 50.7% (77 people) did not have experience with e-scooters, 27.6% (42 people) had tested one, and 21.7% (33 people) either owned a PLEV or used one regularly (e.g., in sharing systems).
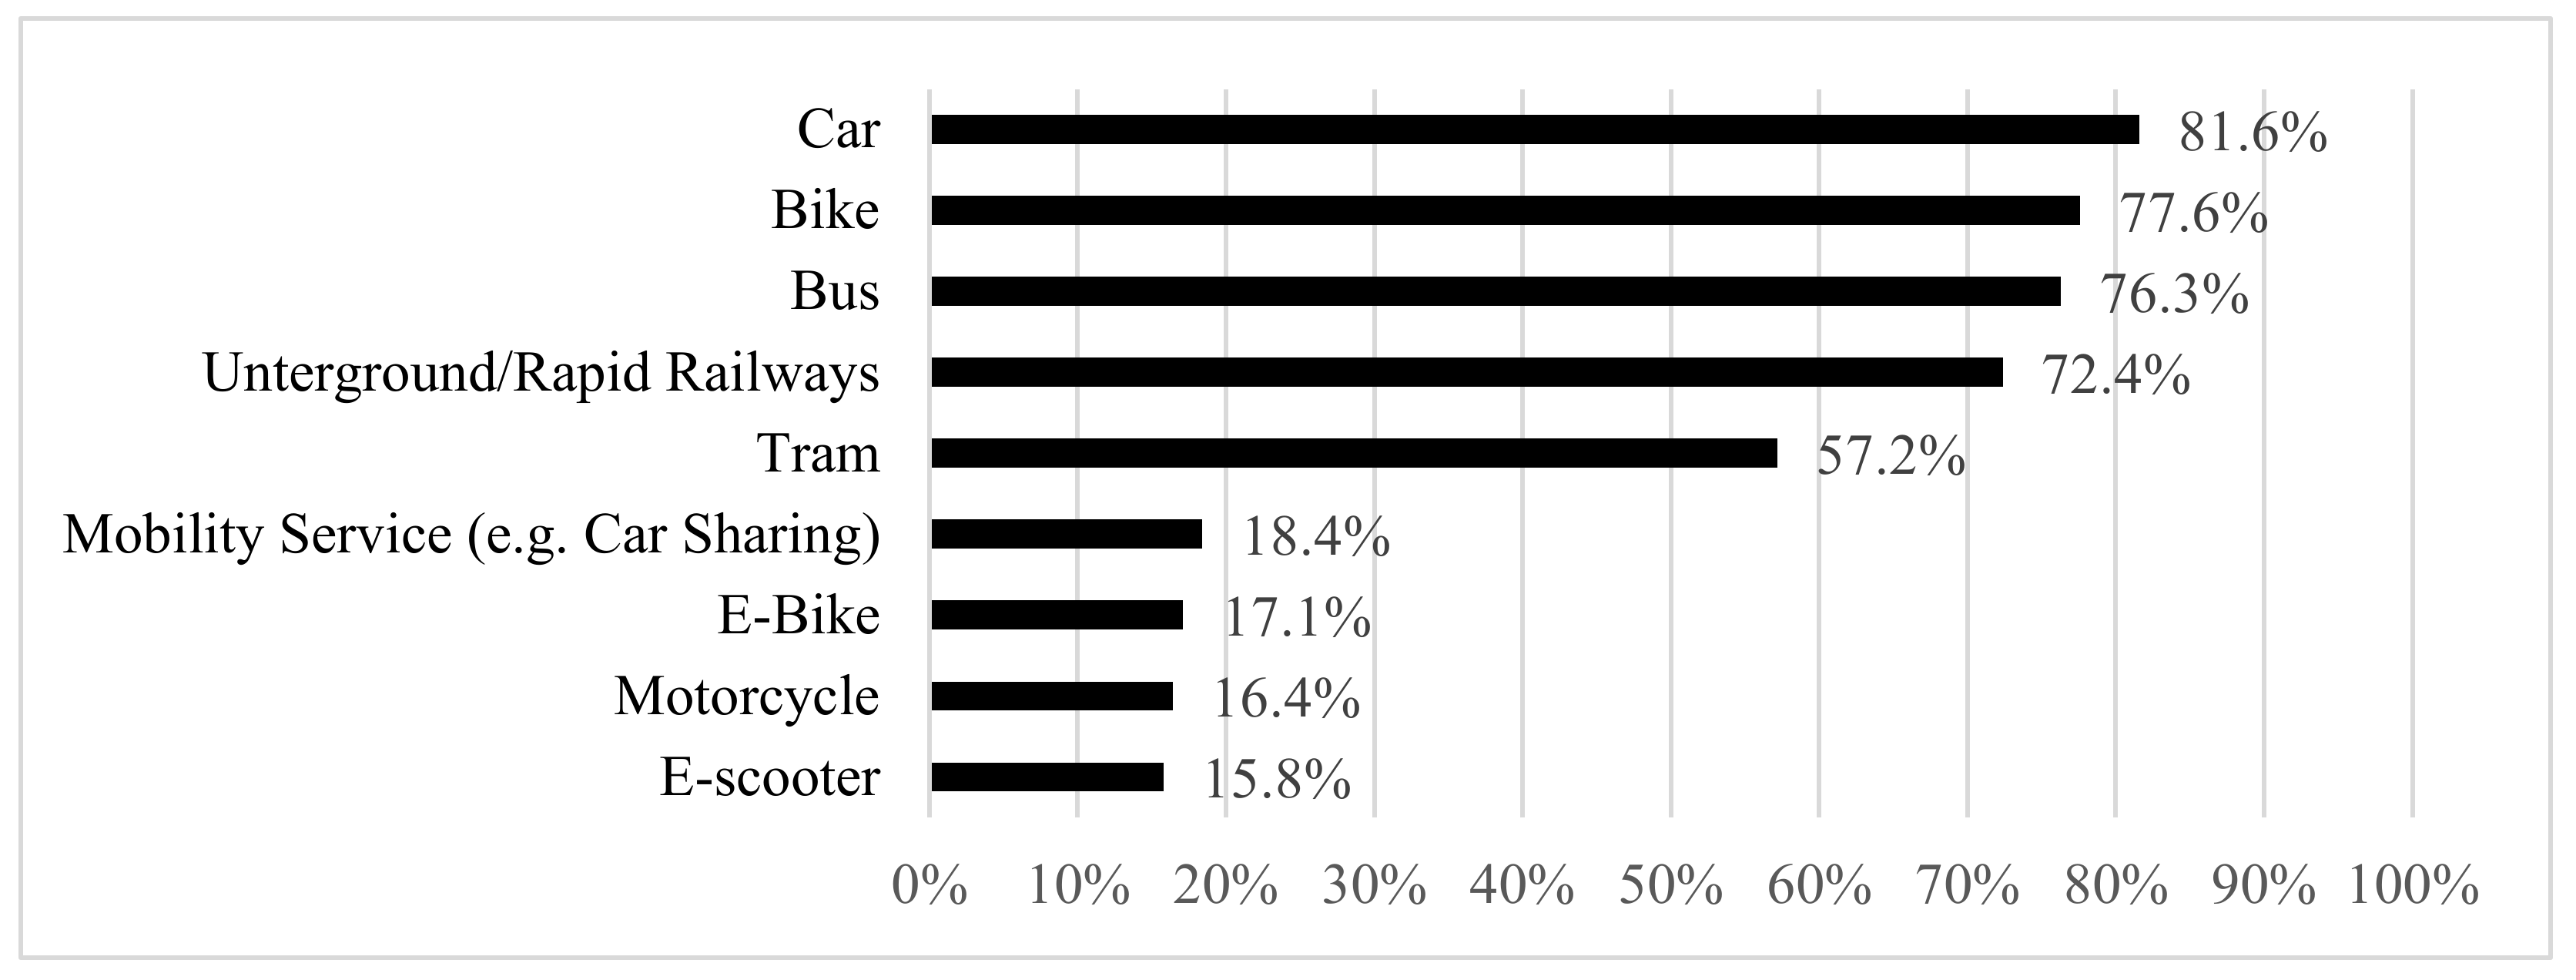
Figure 3 presents the means of transport that that respondents have access to. The means of transport with the greatest access is the, car at 81.6% (
Figure 3), followed closely by bike (77.6%), bus (76.3%), and train (72.4%). As underground and rapid railways are only available in cities, their share (57.2%) was smaller than those of other public means of transport. Additional modes, such as Mobility as a Service (MaaS), e-bikes, or motorbikes were used by less than 20% of the respondents. A share of 15.8% (24 people) owned or had access to a personal light electric vehicle.
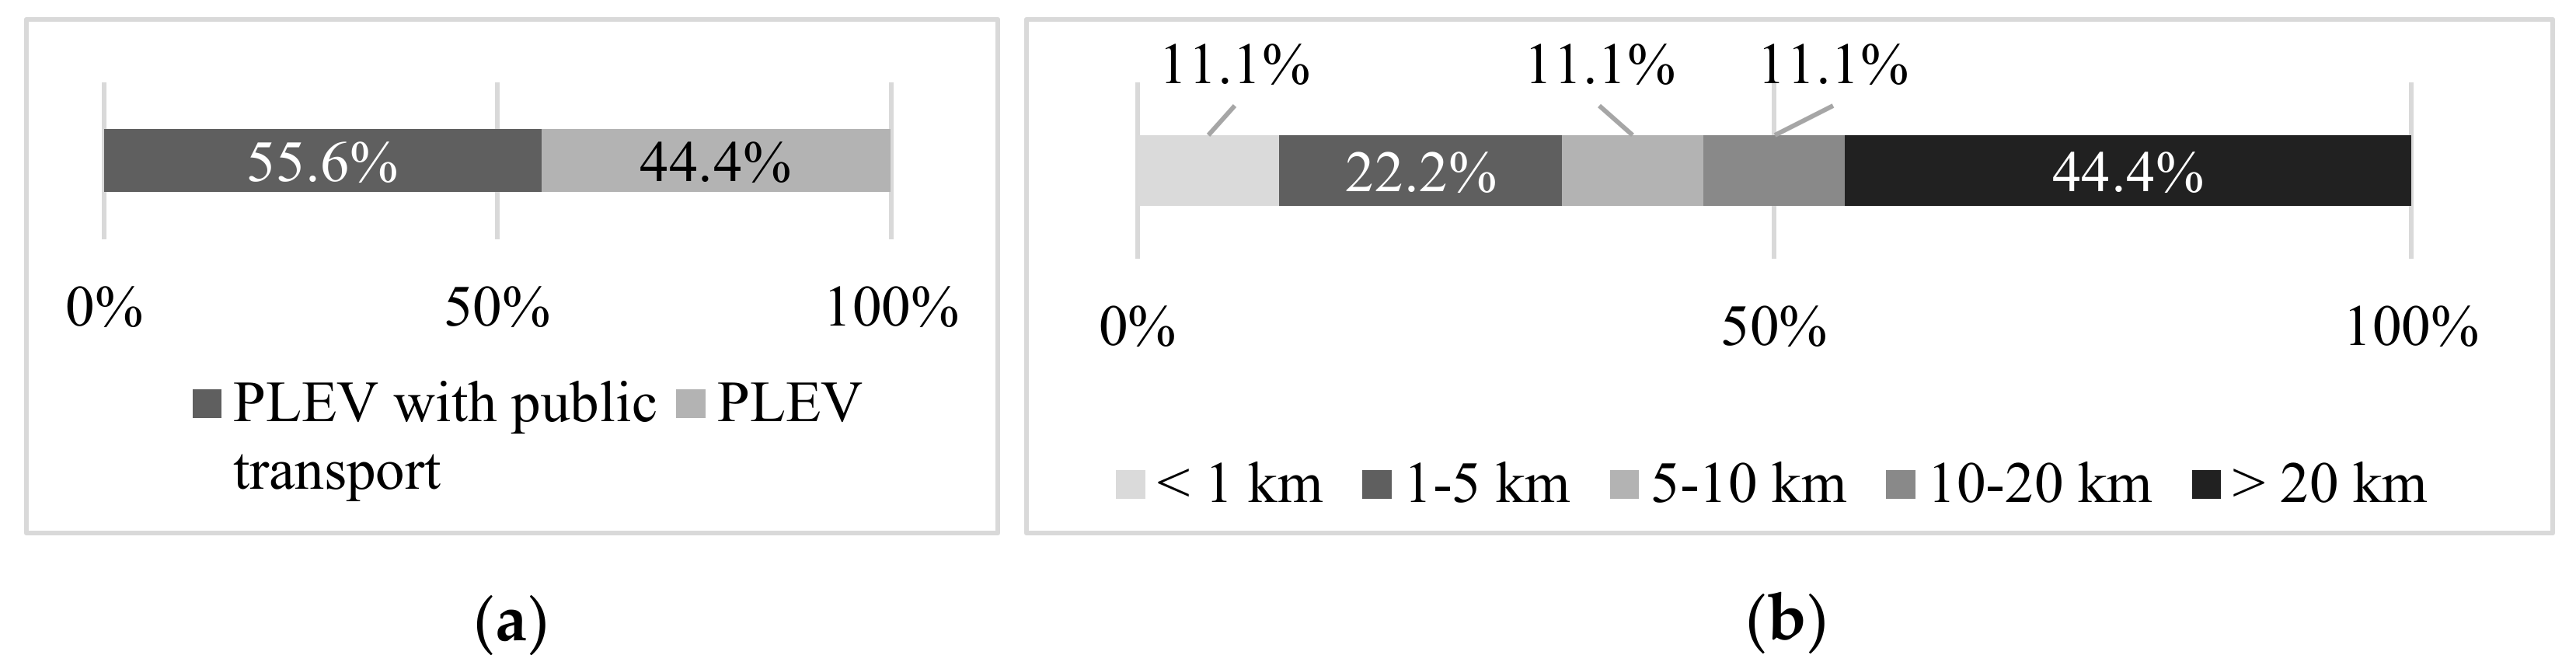
Nine of the respondents were using a PLEV for commuting purposes. Despite this low number, a brief summary indicates considerable differences in usage patterns (
Figure 4). Thus, five people (55.6%) used their PLEV in an intermodal manner in combination with public transport. The remaining four respondents (44.4%) exclusively used the PLEV for the direct commute to work. In addition, the distances of commuting paths covered (partly) with PLEV varied greatly: 44.4% were distances of over 20 km, all of which were combined with the use of public transport systems. Each category with shorter distances was also present, although the PLEV was used exclusively in most of these cases. To conclude, the application of PLEVs was widespread, ranging from unimodal to intermodal use.
Subsequently, participants were asked if they could imagine replacing a means of transport of their commute with a personal light electric vehicle. Slightly more than half of the respondents (53.9%) could not. Another 5.9% already used an e-scooter on their commute. The remaining 40.2% of interviewees could potentially imagine using an e-scooter.
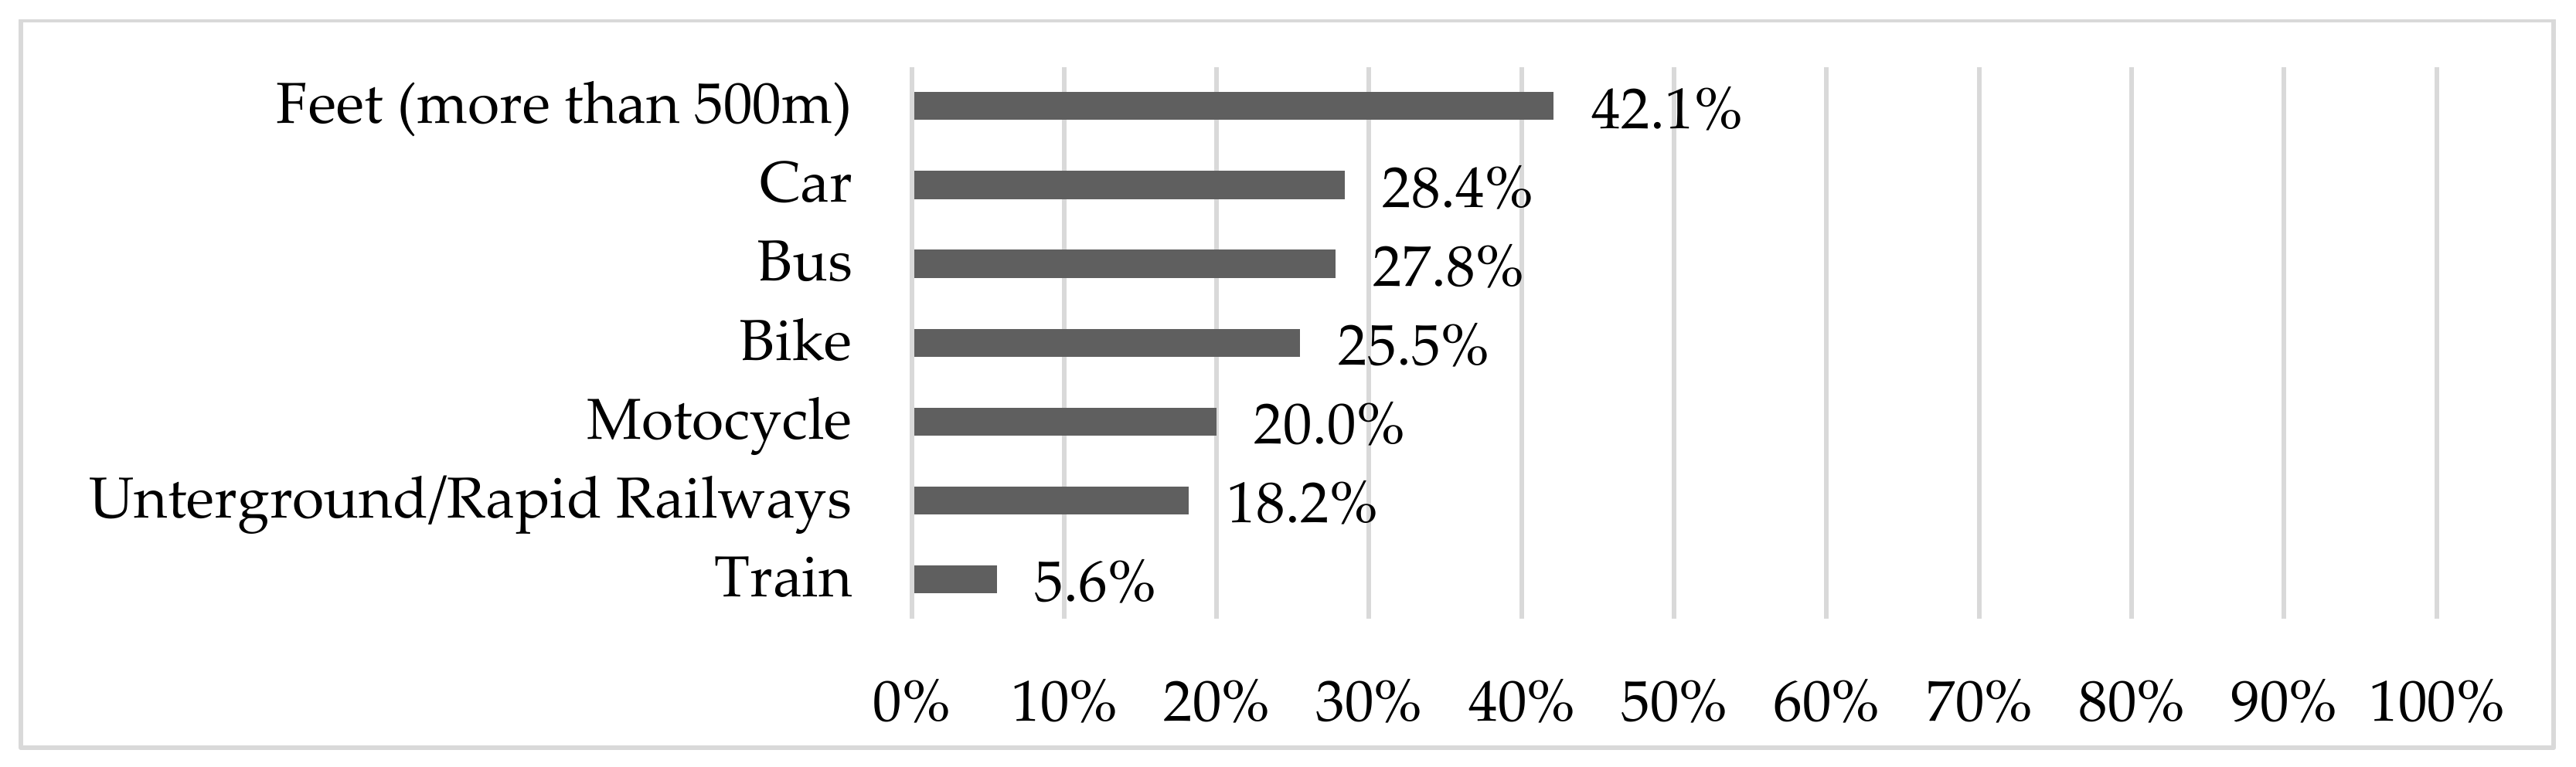
Figure 5 demonstrates the share of potential users of PLEVs within the different means of transport. A share of 42.1% of people walking more than 500 m during their commute would cover this distance with a PLEV. In the case of motorized individual transport, 28.4% would substitute their car with a PLEV and 20.0% would do so with their motorbike/motor scooter. In public transport, the share was almost as high: 27.8% of bus users and 18.2% of underground/rapid railway users were interested in PLEVs. As PLEVs are generally used for short distances, only 5.6% of train users would replace their current means of transport with e-scooters. The respondents also viewed PLEVs as a substitute for bikes: one-quarter of cyclists were interested in switching modes. Therefore, an ecological assessment is difficult because respondents indicated both motorized traffic and trips by bike and foot could be replaced by PLEVs, contradicting the hopes and expectations for this new means of transport.
The maximum time of use of PLEVs also differed notably depending on the experience of the respondents with e-scooters. The data shows that people who use a e-scooter regularly tend to cover longer distances compared to respondents without this experience. In terms of numbers, 33.3% of interviewees with experience would use a PLEV for longer than 45 min; in contrast, only 5.2% of the group with no experience stated that they would drive a PLEV for more than 45 min. This reveals a high acceptance for longer trips among e-scooters users and it is reasonable to assume that, with increasing use of PLEVs, their time of use will increase. Other data supports the assumption that PLEV-users show a more positive attitude towards this means of transport than others. For instance, these users would rather take their PLEV on public transport and focus on the advantages of PLEVs, such as the driving and technical characteristics (range, safety, comfort, transportability, price), and generally worry less about their disadvantages, which are discussed by the public. In conclusion, the results indicate PLEVs are a credible means of transport and therefore should be considered in future mobility systems.
More results were achieved from the end-user survey. For reasons of scope, they are not reflected within this paper. For more information, please contact the authors.
3.3. Results of the Commuting Scenarios
To estimate the impact of ambient conditions on the use of PLEVs, a literature research regarding mobility scenarios was conducted. The chosen scenarios in this paper were based on studies [
23,
24,
25,
26,
27,
28,
29,
30]. They were summarized in three scenarios, which include various key factors regarding PLEV (
Table 3). In the end-user survey, the participants were interviewed regarding their potential future use of PLEVs within the period from now until 2030 based on these scenarios.
Scenario 1 “Business as usual” describes a future with few changes compared to today. The increase in motorized individual transport continues, including further congestions and traffic jams. This is part of the reason that pollution thresholds are exceeded more often and severely in this scenario. PLEVs have not been established and use of public transport is banned. The respondents were given statements about which they could indicate their approval on a scale from 0% to 100%. The interviewees agreed that e-scooters could relieve traffic (68%). The same value was obtained when asking participants if they felt confident using a PLEV on public streets. The questions regarding an increase in accidents and about e-scooters as an alternative to bikes showed slightly less agreement (56% and 58%). The affirmation of the statement “more PLEVs lead to more accidents” was also found to depend on infrastructure, with the interviewees being unsure whether bike paths were adequate for PLEVs; 48% indicated a neutral evaluation, and this result underlines the importance of infrastructure. In addition, use of PLEVs on public transport seemed to be a relevant criterion for potential users. A share of 59% of respondents anticipated a ban of PLEVs on public transport, thus leading to a decrease in usage. However, 37% did not share this opinion. In summary, participants were open to the idea of using PLEVs, although the available infrastructure and potential accidents were also seen as critical aspects.
For scenarios 2 and 3, the respondents were asked to evaluate if the respective key factors would lead to a change in the use of PLEVs. The used scale of the potential use of PLEVs ranged from −100% (greatly reduced utilization) to 0% (no change in utilization) and 100% (greatly increased utilization). The future setting of scenario 2, “Individual, but regulated”, reflects a situation in which problems have been recognized but only met with a small number of individual measures. In this scenario, motorized individual transport is more expensive than today, and PLEVs are financially subsidized. Bike infrastructure has been improved for use of new means of transport (e.g., PLEVs) where possible. Scenario 2 demonstrates that all key factors lead to an increase in the use of e-scooters. In particular, state subsidies result in more people using these modes (64%), whereas an improvement of bike infrastructure convinces fewer respondents (24%) to change their behavior. Some interviewees noted that improved bike paths benefit the attractiveness of cycling, eliminating the necessity of PLEVs. Furthermore, a rise in costs for car usage was indicated as a reason for respondents (38%) to recognize the potential of PLEVs. However, in this case, more than half of the participants (58%) indicated they would continue to use their car or favor different means of transport. In conclusion, scenario 2 still leads to a considerable increase in the use of PLEVs.
Scenario 3 follows a “Holistic approach” to mobility. Therefore, private car traffic is banned from inner cities completely and replaced by car-sharing systems. Public transport is free and expanded greatly. The free space in cities is used to improve bike infrastructure, which can also be used by PLEVs. Due to an increase in vehicle availability, the sharing of PLEVs is established as a real alternative for short paths and the first and last mile. According to 59% of respondents, a ban of car traffic in inner cities would lead to an increased use of PLEVs. This high value originates from frequent car users being forced to switch to another means of transport. The controversially debated idea of free public transport was reflected in a decline (−13%) in PLEV use for the respondents. By removing transportation costs, the attractiveness of public transport increases, thus eliminating a reason for using PLEVs. However, a fifth of respondents (21%) perceive that more attractive public transport would result in greater interest for the intermodal use of PLEVs and, thus, an increased use of these means of transport. The expansion of public transport does not have an influence on the use of PLEVs (−1%). Similar to the effect explained above, users who replace PLEVs with public transport offset those using public transport intermodally with PLEVs, neither increasing nor decreasing the usage intensity. Opinions regarding the impact of an optimized sharing system of PLEVs were also found to be opposing. About one-half (46%) of respondents indicated there was no impact because they were generally not interested in sharing services, whereas the other half (50%) indicated that the attractiveness of these means of transport was increased. The current establishment of sharing service providers, which are expanding in Germany [
31], can continue to increase if offers are presented in an engaging manner (e.g., availability, cost, vehicles). In scenario 3, the use of PLEVs is more widespread than today, but is falling short compared to scenario 2 because changes in public transport (expansion and free use) negatively impact the use of PLEVs. In this context it must be taken into account that the design of the scenarios only includes key factors which are directly related to PLEVs. An indirect impact of other key factors found in the consulted studies (e.g., more home offices, less social value of owning a car, etc.) was not analyzed. Therefore, the conducted survey offers a first glance into the future use of personal light electric vehicles.
3.4. Economic and Ecological Potential
To estimate the potential of e-scooters based on practical commuting paths, five starting points (places of residence) were defined. The Fraunhofer Institute for Industrial Engineering IAO in Stuttgart-Vaihingen serves as the target point (place of work) for each commute. The whole range of possible commuting paths should be represented, hence, both short and long distances within and between cities were considered, according to the results of the survey. A typical commuting path (
Table 4) demonstrates the analysis of the trip from Stuttgart Downtown-West to the Fraunhofer Institute IAO. Thus, in this case, the intermodal use of public transport and e-scooters resulted in an 8% increase in time compared to that from using a car, and a saving of 60% compared to the sole use of public transport. The results of the other studied routes are presented in
Appendix A. Based on the calculated and aggregated paths discussed above, the cases of reasonable use of an e-scooter were evaluated, considering the criteria of cost, time, and ecology. E-scooters were considered both individually and in combination with public transport. Furthermore, a short discussion suggests which users benefit from the switch from conventional means of transport to e-scooters.
Cost of transport: Regarding the cost of transport, the single use of e-scooters is reasonable in comparison with each means of transport, except bike and walking. The most savings (70% per km) were found for distances currently covered by car. E-scooters combined with public transport can also offer considerable savings. Compared to only using public transport, the combination of e-scooters with a train, subway, or bus is more expensive because the first and last mile are covered by e-scooters instead of being walked.
Time: A differential view is required to evaluate the time needed. Individually, an e-scooter is faster than walking, as fast as a bike or e-bike, and slower than a car. In combination with public transport, the time needed to cover distances in inner cities is comparable to the travel time with a car. However, on paths from the suburbs into the city, the car is faster than the intermodal use of e-scooters and public transport. E-scooters offer the most important potential in connection to rapid public transport (e.g., rapid railways). Replacing bus rides from and to the rapid railway promises the most time savings, especially when minimizing transfer and waiting times.
CO2 equivalent: E-scooters have higher emissions of CO2-equivalents than walking or cycling. In contrast, the emissions of public transport and cars are even higher, proving e-scooters are the better alternative. The intermodal use of public transport and e-scooters scores well compared to the use of cars. However, it cannot be assumed that intermodal use has the potential to reduce emissions compared to the unimodal use of public transport because the particular paths and chosen means of transport vary strongly regarding their ecological impacts.
4. Conclusions
Whether e-scooters can improve mobility in a holistic manner could not be definitively clarified because of the complex nature of mobility systems. Other studies have reached the same conclusion [
32]. However, this study indicates how PLEVs might impact commuting in urban areas. Firstly, people using public transport can use e-scooters to cover the first and last mile, in addition to paths taken by foot, which results in significant timesaving. Harmann et al. reached the same conclusion and highlighted the gain in comfort for some users when covering the first and last mile with a PLEV more quickly [
33]. The findings of the literature search show that the relevance of the first and last mile will increase in coming years due to more intermodal routes. This subject will therefore become more important. Secondly, persons who commute by cycling tend to benefit less from e-scooters. By comparison, only the use of public transport is easier and the physical effort is removed. The study of Harmann et al. confirms this and underlines that the free transport of these vehicles in public transport is a major advantage [
33]. Whether the removal of the physical effort results in a benefit largely depends on the individual. Thirdly, for unimodal car users, PLEVs can potentially reduce costs and CO
2-equivalents of commuting paths. However, this relates to an increase in travel time, depending in part on the characteristics of the commuting path. However, it is questionable if e-scooters have the potential to replace car traffic. In accordance with the current findings, the research of Sanders shows that people are more likely to substitute PLEVs for walking trips than car trips [
34]. The above results suggest that e-scooters offer individual benefits for specific groups of users. An ecological perspective also indicates the potential to reduce CO
2-equivalents emissions for some PLEV users, but only if they are used in the right way.
Whether the assumptions about the respondents’ mobility behavior made in the survey correspond to their real usage remains unclear. However, if the given information leads to the expressed change of action, this change in actual mobility behavior will affect the assumed typical commutes used in this study. For instance, a comparison with other international studies shows that the surveyed data about the length of a typical e-scooter trip differs from that shown by our data. Average one-way trips with e-scooters range from 721 m [
35] to 1.2 km [
36] and less than 2 km [
37]. Our respondents stated they would use the e-scooter for trips up to 20 km. When the average trips in Germany have the same order of magnitude as the presented studies, the potential use cases will change. Once this data is available, the need for new calculation of the commuting paths must be estimated.
The comparison between users and non-users of PLEVs indicates that this type of vehicle can be beneficial for everyday use. In general, users tend to be less critical of e-scooters and focus on their advantages. Furthermore, the way the respondents use PLEVs differs significantly in terms of distance, time, and intermodality, which indicates that e-scooters are versatile. As the number of respondents belonging to this group is quite small, these findings should be seen as indications and not as representative.
Limitations of the results mostly relate to the investigated sample. As e-scooters were not approved in Germany for public use at the time of the survey, they were not widely used. Thus, the type of use and users might change when e-scooters become legal. Therefore, a trade fair was visited, in order to interview enough active users of this means of transport. As people attending trade fairs tend to be more technology enthusiastic, an online survey was also conducted to compile different views on e-scooters. Nonetheless, because the group of 14–20 years old was not sufficiently represented in the sample, age-specific evaluations were therefore not possible. This group often has no driving license or access to a car, so this new form of motorized transport could be highly beneficial for them. A survey focusing on younger persons should therefore be conducted. This also applies to the use of PLEVs in rural areas. This was not the focus of this study but should be researched in further investigations.
As commuting paths are highly individual, general statements cannot be made regarding savings of cost, time, and CO
2-equivalent emissions. Further research should evaluate the benefits of e-scooters based on use-cases in a field study. In addition, other soft factors, such as comfort, weather protection, luggage transport, and personal preferences, should be included because they play an important role in the decision to use an e-scooter [
33]. A long-term research goal should be the development of a mobility tool that enables end-users to compare different means of transport for their own commute to identify their best combination.


