1. Introduction
At present, the primary cause of death in China is road traffic casualties [
1]. With the development of intelligent vehicles, the prediction of lane change intention is an important part of the decision planning and control systems of intelligent vehicles. In the dynamic and complex traffic environment, if the lane change intention of surrounding vehicles can be accurately predicted by the ego vehicle, then the optimal decision of the ego vehicle can be made according to the future traffic conditions, and the occurrence of traffic accidents will be avoided.
The prediction of lane change intention of other vehicles has been studied by many scholars at home and abroad. The lateral distance between the predicted vehicle and the center of the original lane, lateral speed, and longitudinal speed of the predicted vehicle are taken as the input of the model, and a probabilistic method is proposed to predict the remaining time of the adjacent vehicle that is about to change lanes on the freeway [
2]. The lane information, speed, and steering angle of the predicted vehicle are taken as the input of the model, and a prediction method of lane change intention of other vehicles based on the Support Vector Machine (SVM) and the Bayesian filter is proposed [
3]. A Hidden Markov Model (HMM) method for the prediction of lane change intention of intelligent vehicles is proposed, based on the speed of the predicted vehicle and the offset between the predicted vehicle and the lane [
4]. The relative lateral position of the ego vehicle and the predicted vehicle, the distance between the predicted vehicle and the center of the lane, and their first and second derivatives are taken as the features. The prediction model of other vehicles’ lane changes, based on the Dual Long and the Short-Term Memory Network, is established [
5]. The parameters of motion state, lane departure data, and the yaw angle of the predicted vehicle are taken as features, and two prediction models of lane change intention of other vehicles, based on the SVM and the artificial neural network, are established [
6]. The results show that the method is superior to the existing methods, in terms of the time and accuracy of the prediction. The image information of the predicted vehicle is captured by the camera of the ego vehicle, and a Convolution Neural Network-based model for predicting the lane change intention of other vehicles is designed [
7]. The motion characteristics of the vehicle in front of the predicted vehicle and the vehicles in the adjacent lane are taken as the prediction features of the model, and the prediction model of lane change intention of other vehicles, based on a combination of the neural network and the Gaussian process, is established [
8]. However, the situation where the vehicle in front of the predicted vehicle is blocked by other vehicles is ignored. The parameters, such as the relative speed of the predicted vehicle and the vehicle in front of it, are taken as the input characteristics of the model, and the prediction model of lane change intention of other vehicles, based on the extended Bayes model, is established [
9]. However, the location of the ego vehicle is ignored, and the problems in reference [
8] will also appear when the lane change intention of other vehicles is predicted by the ego vehicle.
To sum up, the prediction models of lane change intention of vehicles at the present stage are mostly based on the motion state of the predicted vehicle and the location relationship between the predicted vehicle and the lane, and the influence of the motion state of vehicles around the predicted vehicle on the lane change intention of other vehicles is less considered. In particular, the motion state of the front vehicle, which has an important impact on the decision-making of the predicted vehicle, is ignored because it is difficult to obtain the information of the motion state. However, with the development of the technology of vehicular networks, networked vehicles can obtain information on the motion state of surrounding vehicles through the network in real time. Therefore, it is necessary to make comprehensive and systematic use of the obtained information of vehicles to predict the behavior of future movement or the state of vehicles more accurately.
Based on this, the influence of the motion state of the predicted vehicle, the position relationship between the predicted vehicle and the lane, and the motion state of vehicles around the predicted vehicle on the prediction of lane change intention are considered systematically in order to improve the accuracy of the prediction of lane change intention in this paper. The prediction features of lane change intention were screened and the prediction model of vehicles’ lane change intentions was established by a feed-forward neural network. The model established in this paper was respectively compared with the model of common features at the present stage and the model based on SVM. Finally, the model was verified by the virtual driving experiment platform.
2. Feature Screening of Lane Change Intention of Other Vehicles
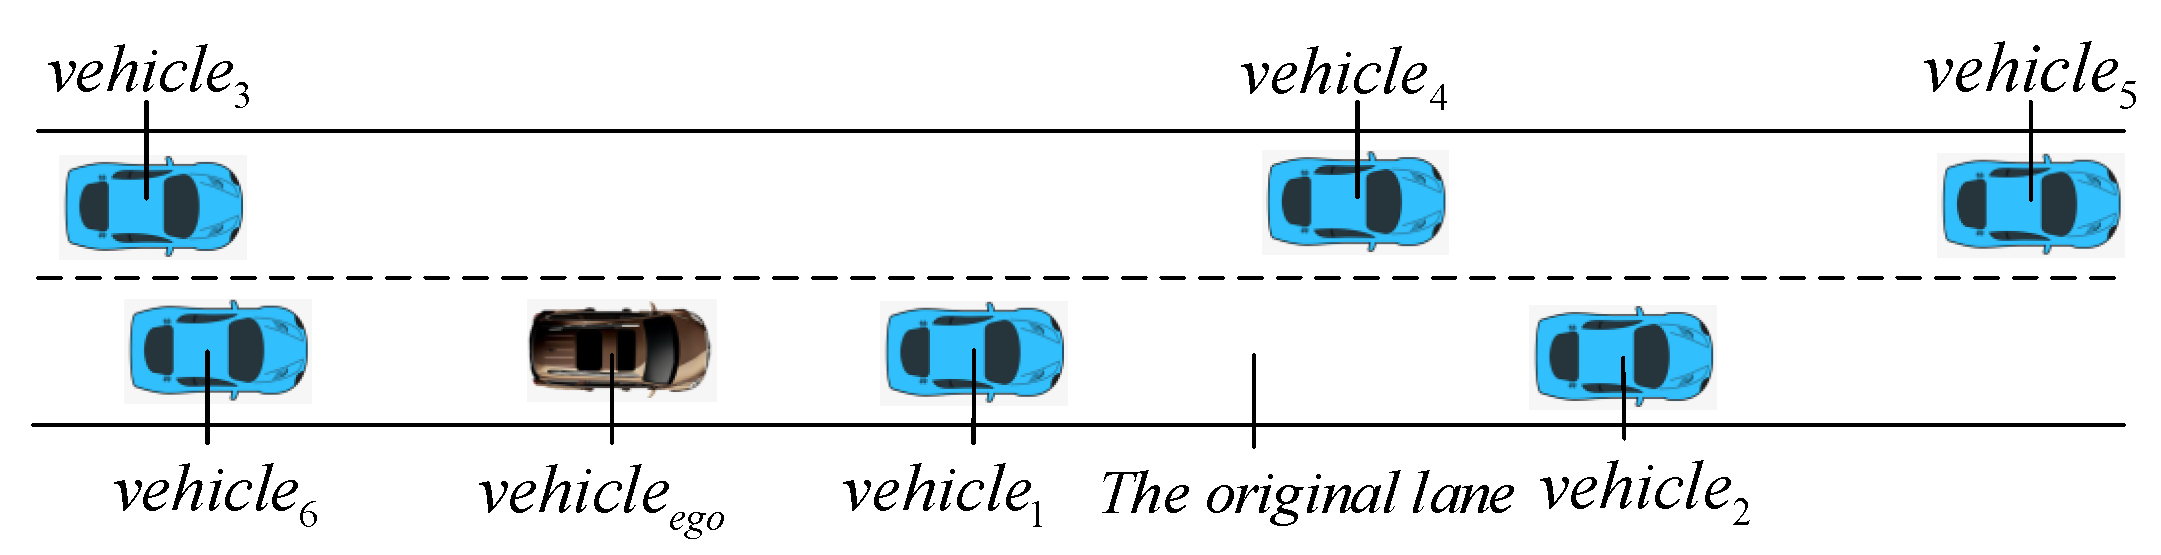
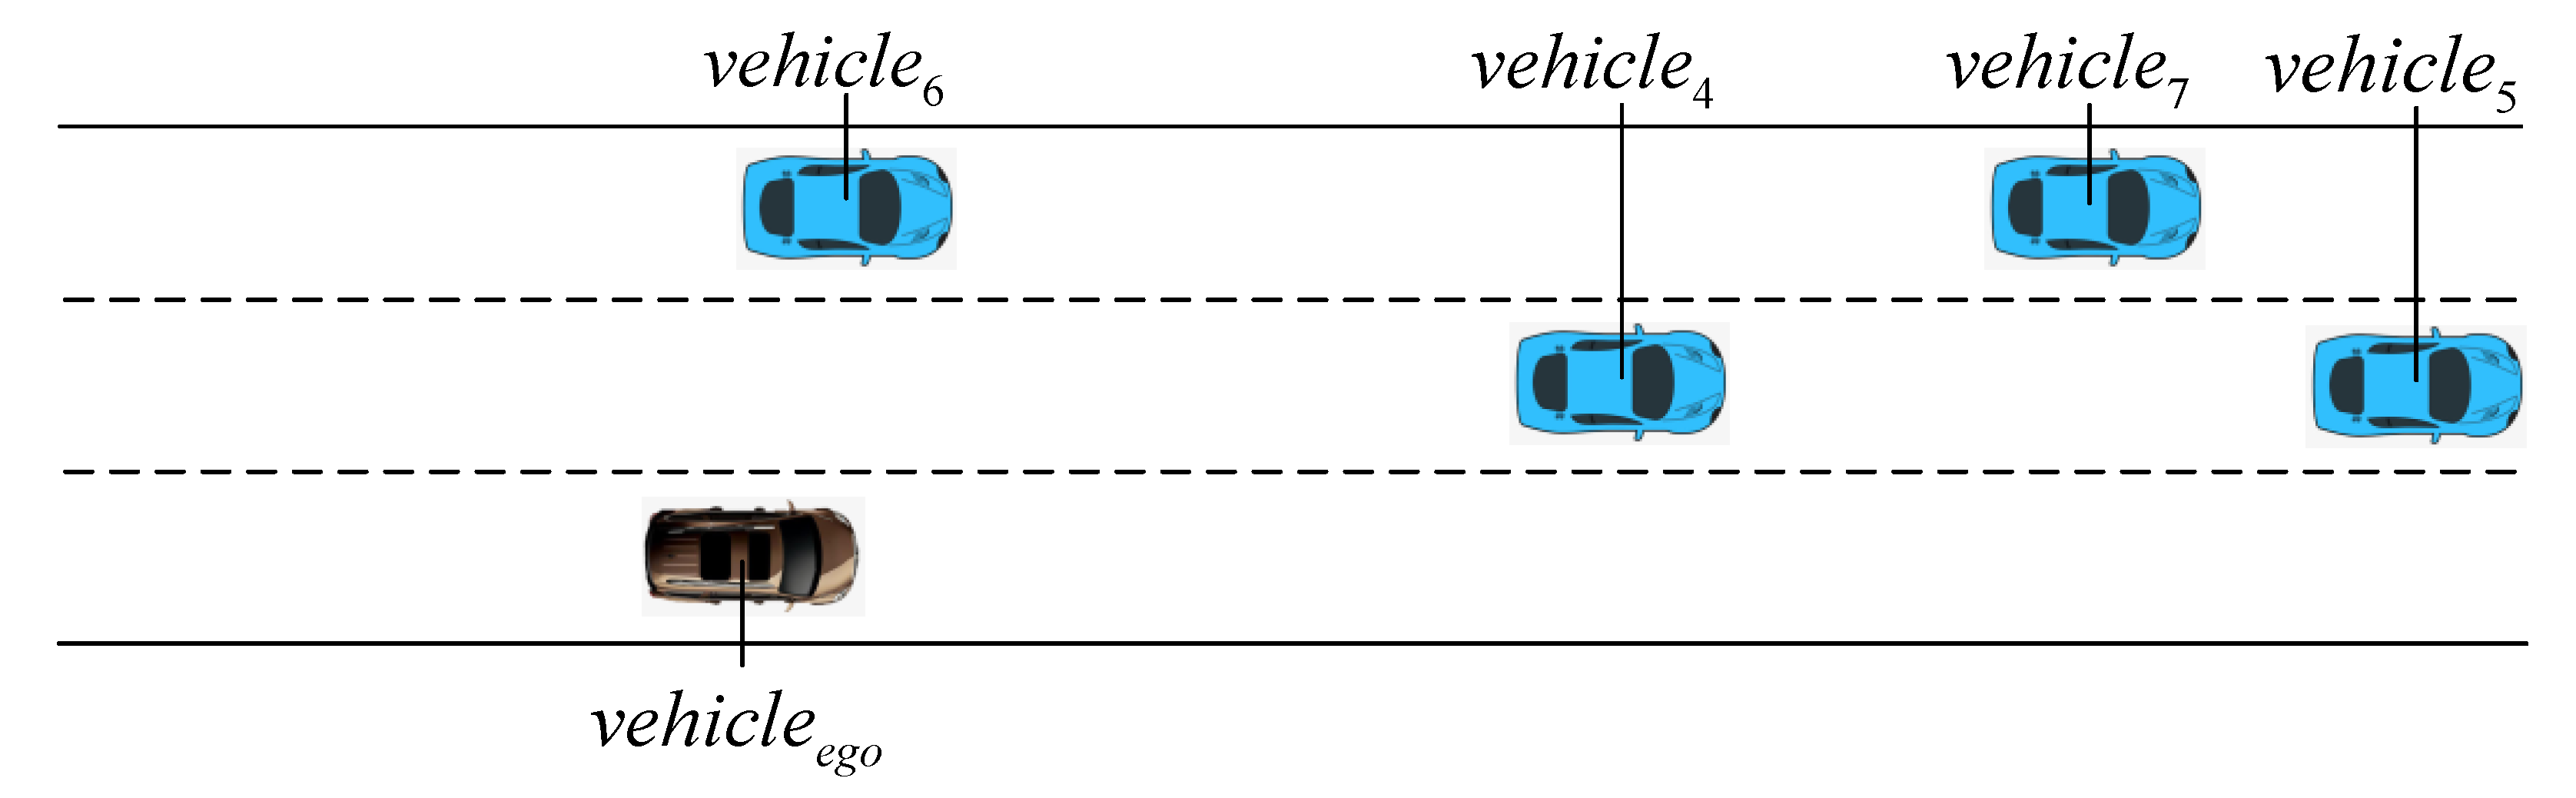
There are three kinds of operation options: a lane change to the left, a lane change going straight, and a lane change to the right, when the vehicle is moving on the road normally. Because the operations of a lane change to the left and a lane change to the right are essentially the same, they are also very similar in consideration of the relationship of the relative motion of the predicted vehicle and the vehicle in front of it, as well as the vehicle in the adjacent lane. Therefore, the predictions of lane changes to the left and straight-going intentions of other vehicles are studied in this paper. The traffic scenario is shown in
Figure 1, and the related variables of vehicles during lane changes are shown in
Table 1.
As shown in
Figure 1, vehicle
1 is the predicted vehicle, and the lane where vehicle
1 goes straight is the original lane. If vehicle
1 intends to change lanes to the left, the left lane of vehicle
1 is the target lane. Vehicle
6, vehicle
ego, vehicle
1, and vehicle
2 are in the right lane; vehicle
3, vehicle
4, and vehicle
5 are in the left lane. The prediction of lane change intention of vehicle
ego is taken as an example in this paper, and the input features of the prediction of lane change intention of other vehicles are explained and screened.
Many characteristics of the vehicle itself will change during the process of going straight to a lane change, such as the yaw rate of the vehicle, the distance from the center of the lane, the lateral and longitudinal speed, acceleration, and so forth. It is necessary to screen out the features that can be used to predict the lane change intention of other vehicles. The yaw rate and lateral acceleration of vehicles are strongly influenced by road shape, so they cannot be used to predict the lane change intention of vehicle
1 [
10]. The change of the distance between vehicle and lane center is the most typical feature of vehicle lane change. The time when the lateral speed is greater than 0.2 m/s is taken as the starting time of the lane change [
11], and the vehicle speed is one of the highest priority variables in the process of a lane change [
12]. To sum up, the distance between vehicle
1 and the center of the original lane (Y), lateral speed (v
y), and vehicle speed (v
c1) are the common features in studies on the prediction of lane change intentions of vehicle
1 at the present stage [
2,
3,
4,
5,
6]. However, vehicles generally decelerate in the exit phase of a lane change, while 59% of vehicles will accelerate in the entry phase of a lane change [
13], which indicates that acceleration can be used as a predictive feature. Before a lane change, the turn signal should be turned on. The opening rate of the turn signal at the beginning of a lane change is 57%, and that which is in the 1 s before a lane change is 25% [
14]. Therefore, the prediction of lane change intention of other vehicles cannot only rely on the status of the turn signal [
15], and it cannot be used as a predictive feature. In this paper, based on the common features of lane change intention of vehicle
1 at the present stage, acceleration (a
c1) of vehicle
1 is also taken as one of the prediction features.
The decision-making of vehicle
1 mainly depends on the motion states of vehicle
2, vehicle
3, and vehicle
4, and in order to predict the lane change intention of vehicle
1 more accurately, the motion states of vehicle
2, vehicle
3, and vehicle
4 should be considered. However, at present, researchers seldom consider this problem, especially the motion state of vehicle
2, which has an important impact on vehicle
1’s decision-making. Because the information of the motion state of vehicle
2 is difficult to obtain, its influence on the decision of vehicle
1 is ignored. Therefore, the information of the motion state of the surrounding vehicles is obtained by networked vehicles in real time through the network. The distance and relative speed among vehicle
1, vehicle
3, and vehicle
4 are common features for the prediction of lane change intention of other vehicles at the present stage [
8,
9]. However, there are other parameters that affect the lane change intention of vehicle
1: distance and collision time among vehicle
1 and vehicle
2, and vehicle
3 and vehicle
4 [
16,
17], while the speed and acceleration of vehicle
2, vehicle
3, and vehicle
4 are greatly related to distance and collision time. Therefore, D
12, D
13, D
14, TTC
12, TTC
13, TTC
14, v
c2, v
c3, v
c4, a
c2, a
c3, and a
c4 are regarded as prediction features in this paper.
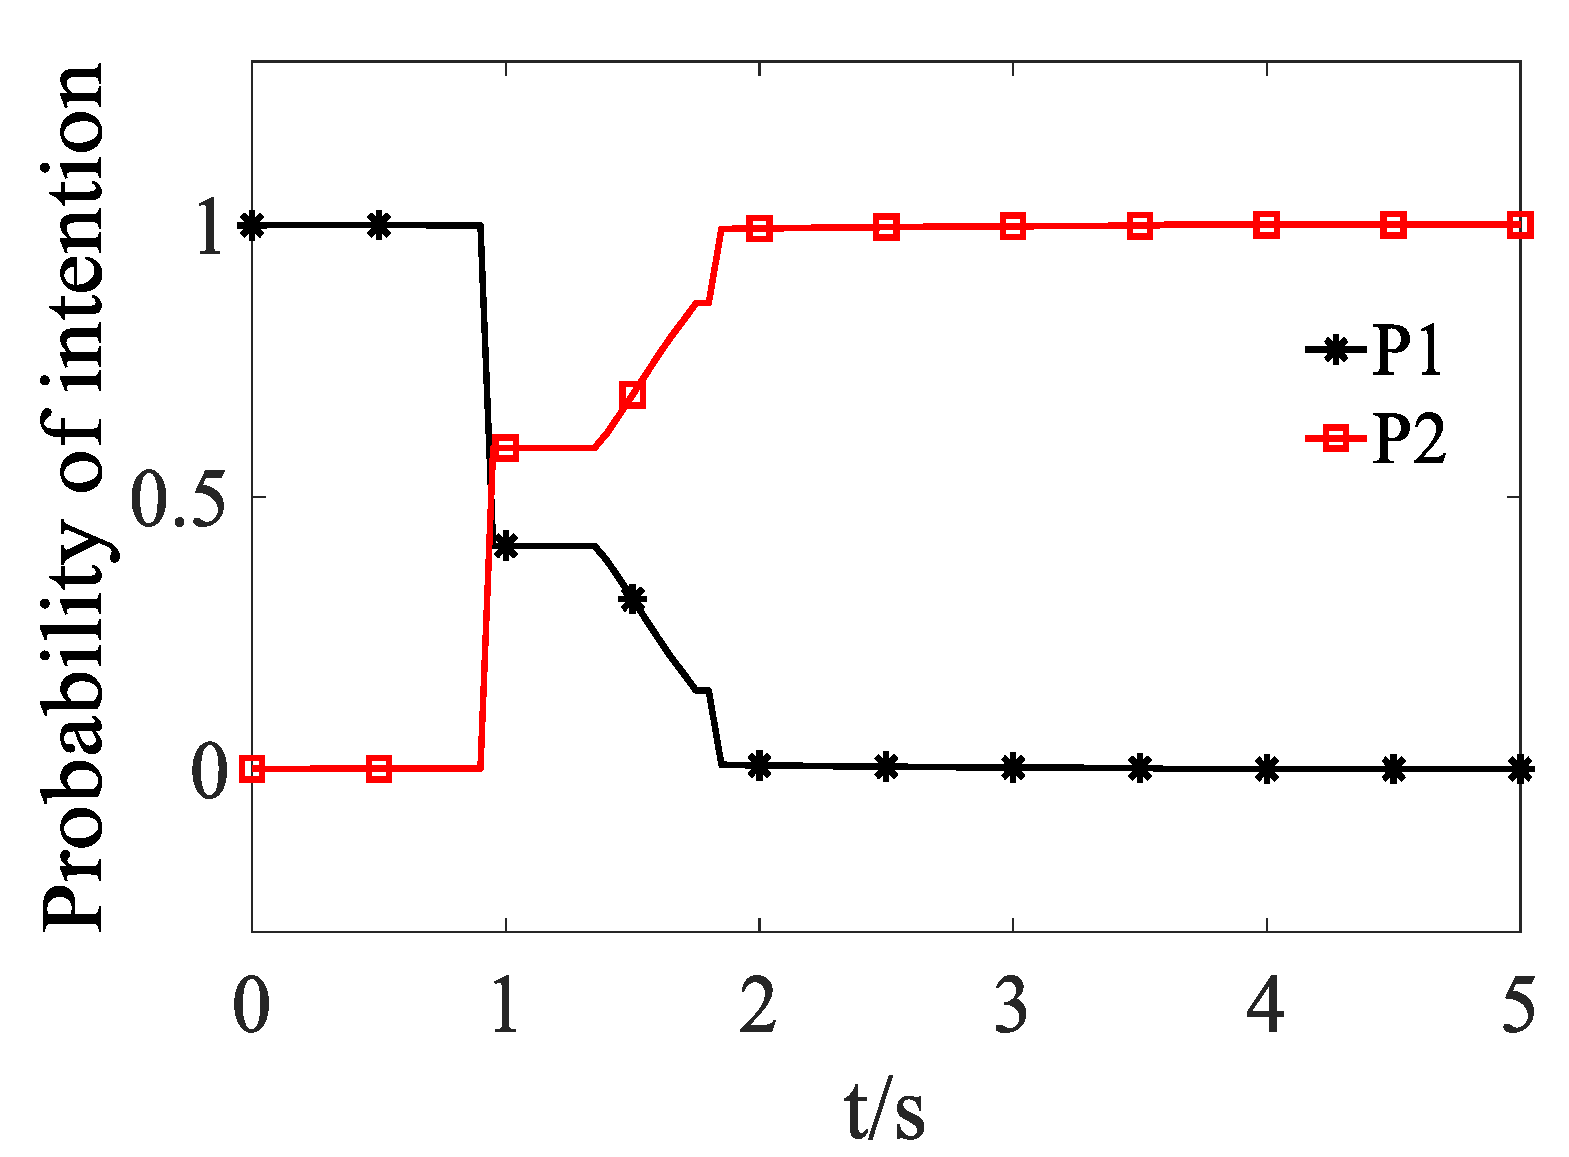
To sum up, there are 7 common features at the present stage: D13, D14, vc13, vc14, Y, vy, and vc1, and 16 prediction features in this paper: Y, vy, vc1, ac1, D12, D13, D14, TTC12, TTC13, TTC14, vc2, vc3, vc4, ac2, ac3, and ac4. The output is the probability of the intention to go straight or change lanes to the left.
3. Establishment of the Prediction Model of Lane Change Intention
An artificial neural network (ANN) is a mathematical model simulating a biological network for information processing. It has strong self-learning, adaptive ability, generalization ability, and fault tolerance, so it has been widely used in intelligent prediction and intelligent driving in recent years. The structure of the feed-forward neural network is simple and can approach any continuous function and square-integrable function with any precision. Therefore, a feed-forward neural network was selected as the prediction model of lane change intention of other vehicles in this paper.
The establishment of a neural network model needs a lot of data. Thus, in this step, the virtual driving experimental platform was built, and then the relevant data were collected and processed. Finally, the neural model was trained by processed data.
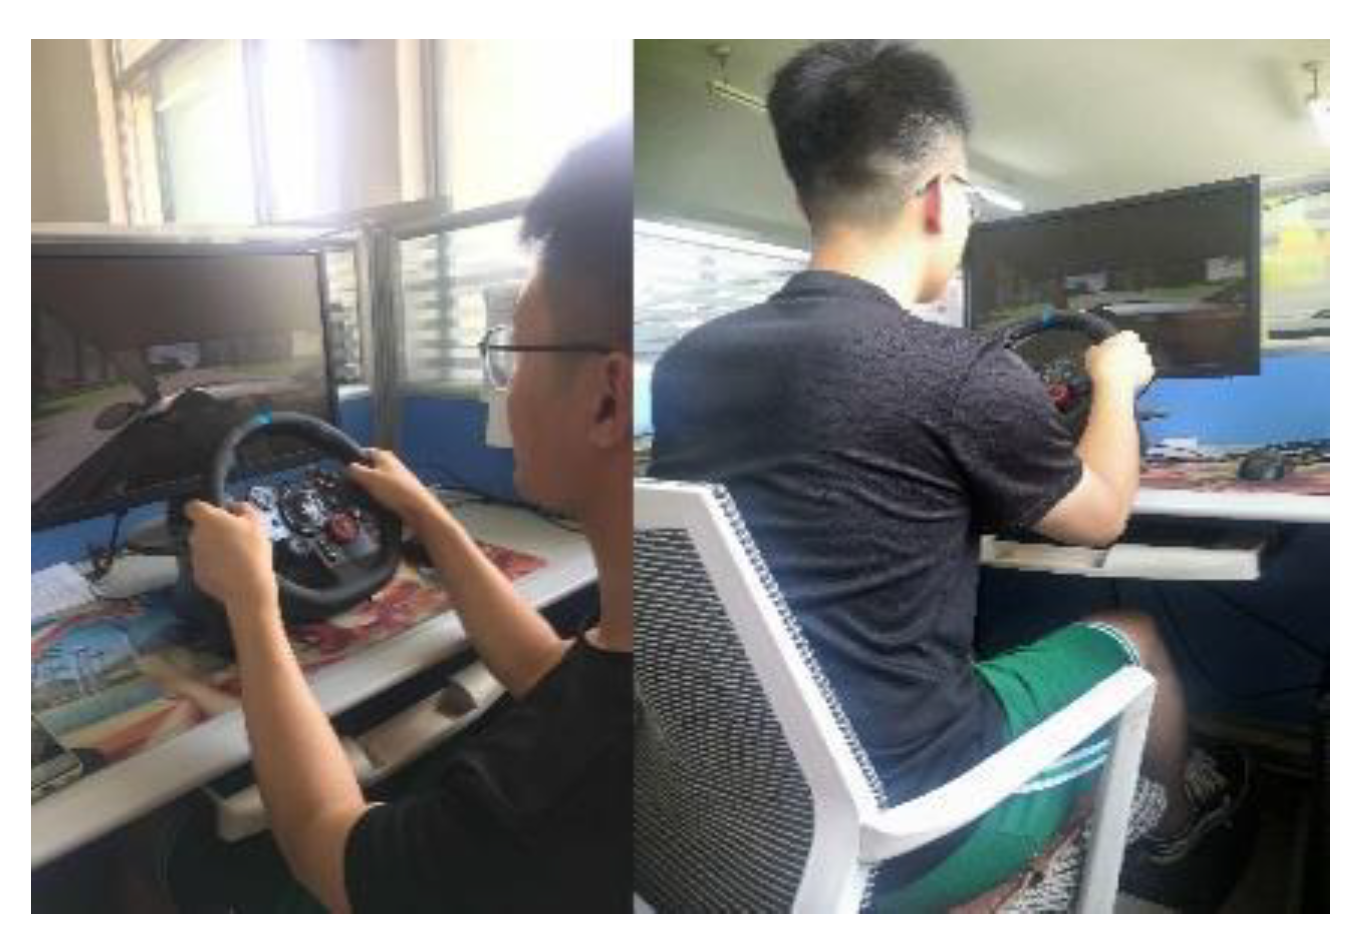
3.1. The Virtual Driving Experimental Platform
The virtual driving experimental platform is an important tool to study “humans–vehicles–roads environments”. Due to its advantages of repeatability, safety, controllability, and environmental protection, it has been developed rapidly in recent years [
18]. The virtual driving experimental platform consists of MATLAB 2016b, Prescan8.4, and Logitech G29. The virtual driving experimental platform is shown in
Figure 2, which is used by drivers to simulate driving.
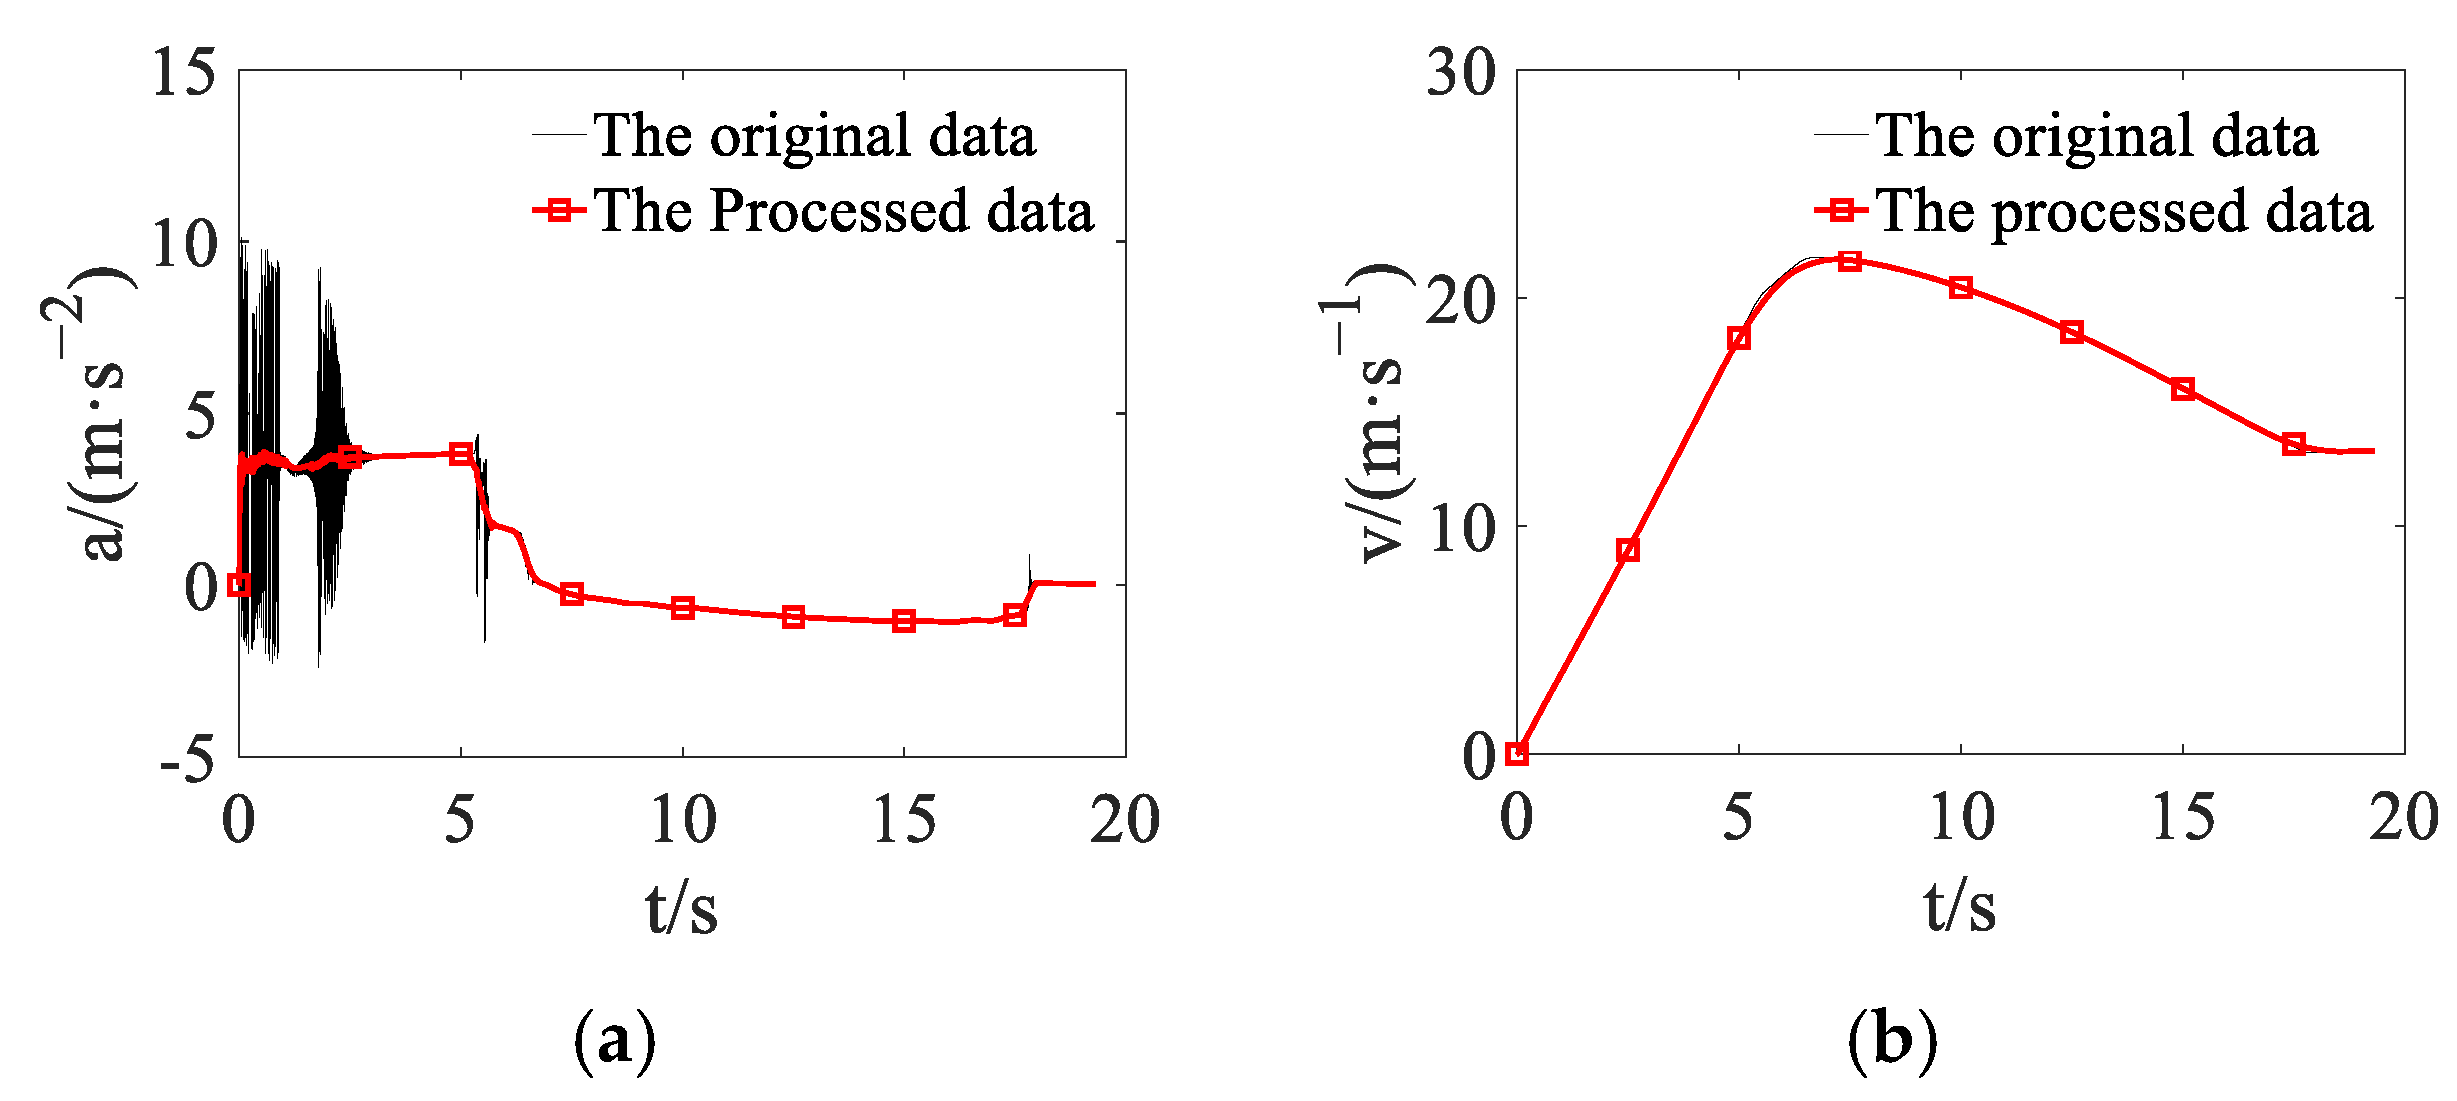
3.2. Data Collection and Processing
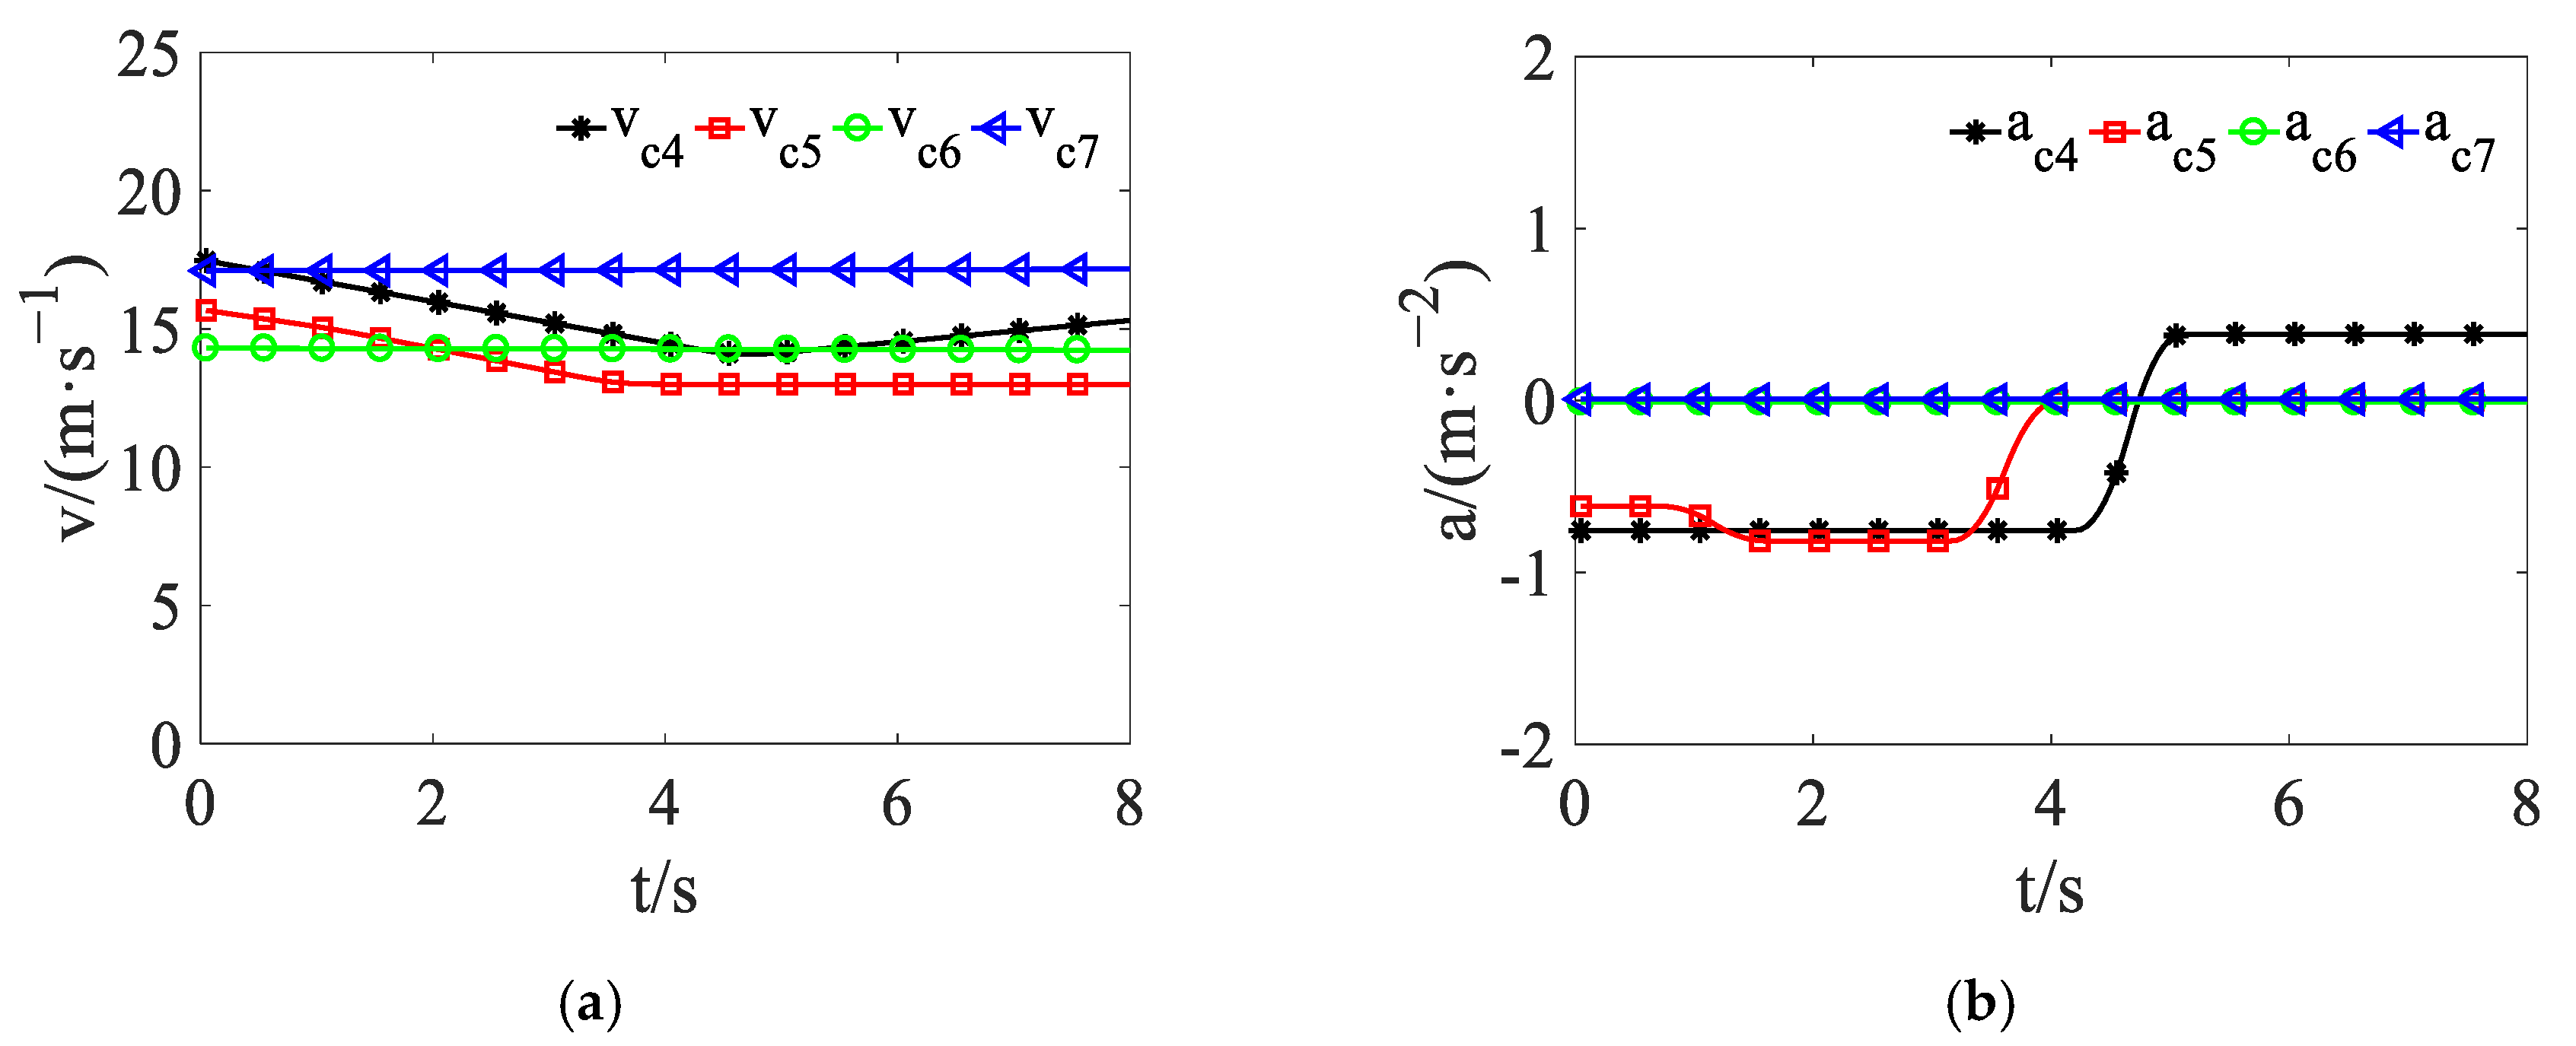
After the input features of the prediction of lane change intention of other vehicles were confirmed, the data was collected by the virtual driving experimental platform. Because only the prediction of the intention of going straight or change lanes to the left of vehicles was studied, the vehicle was driven straight and to the left in scenes of virtual driving. There are results showing that the lane change time is when the lateral speed of the vehicle was greater than 0.2 m/s [
11]. According to this, two kinds of trajectories were randomly selected from the data, including 159 trajectories of going straight and 144 trajectories of lane changes to the left. The moving average filtering method [
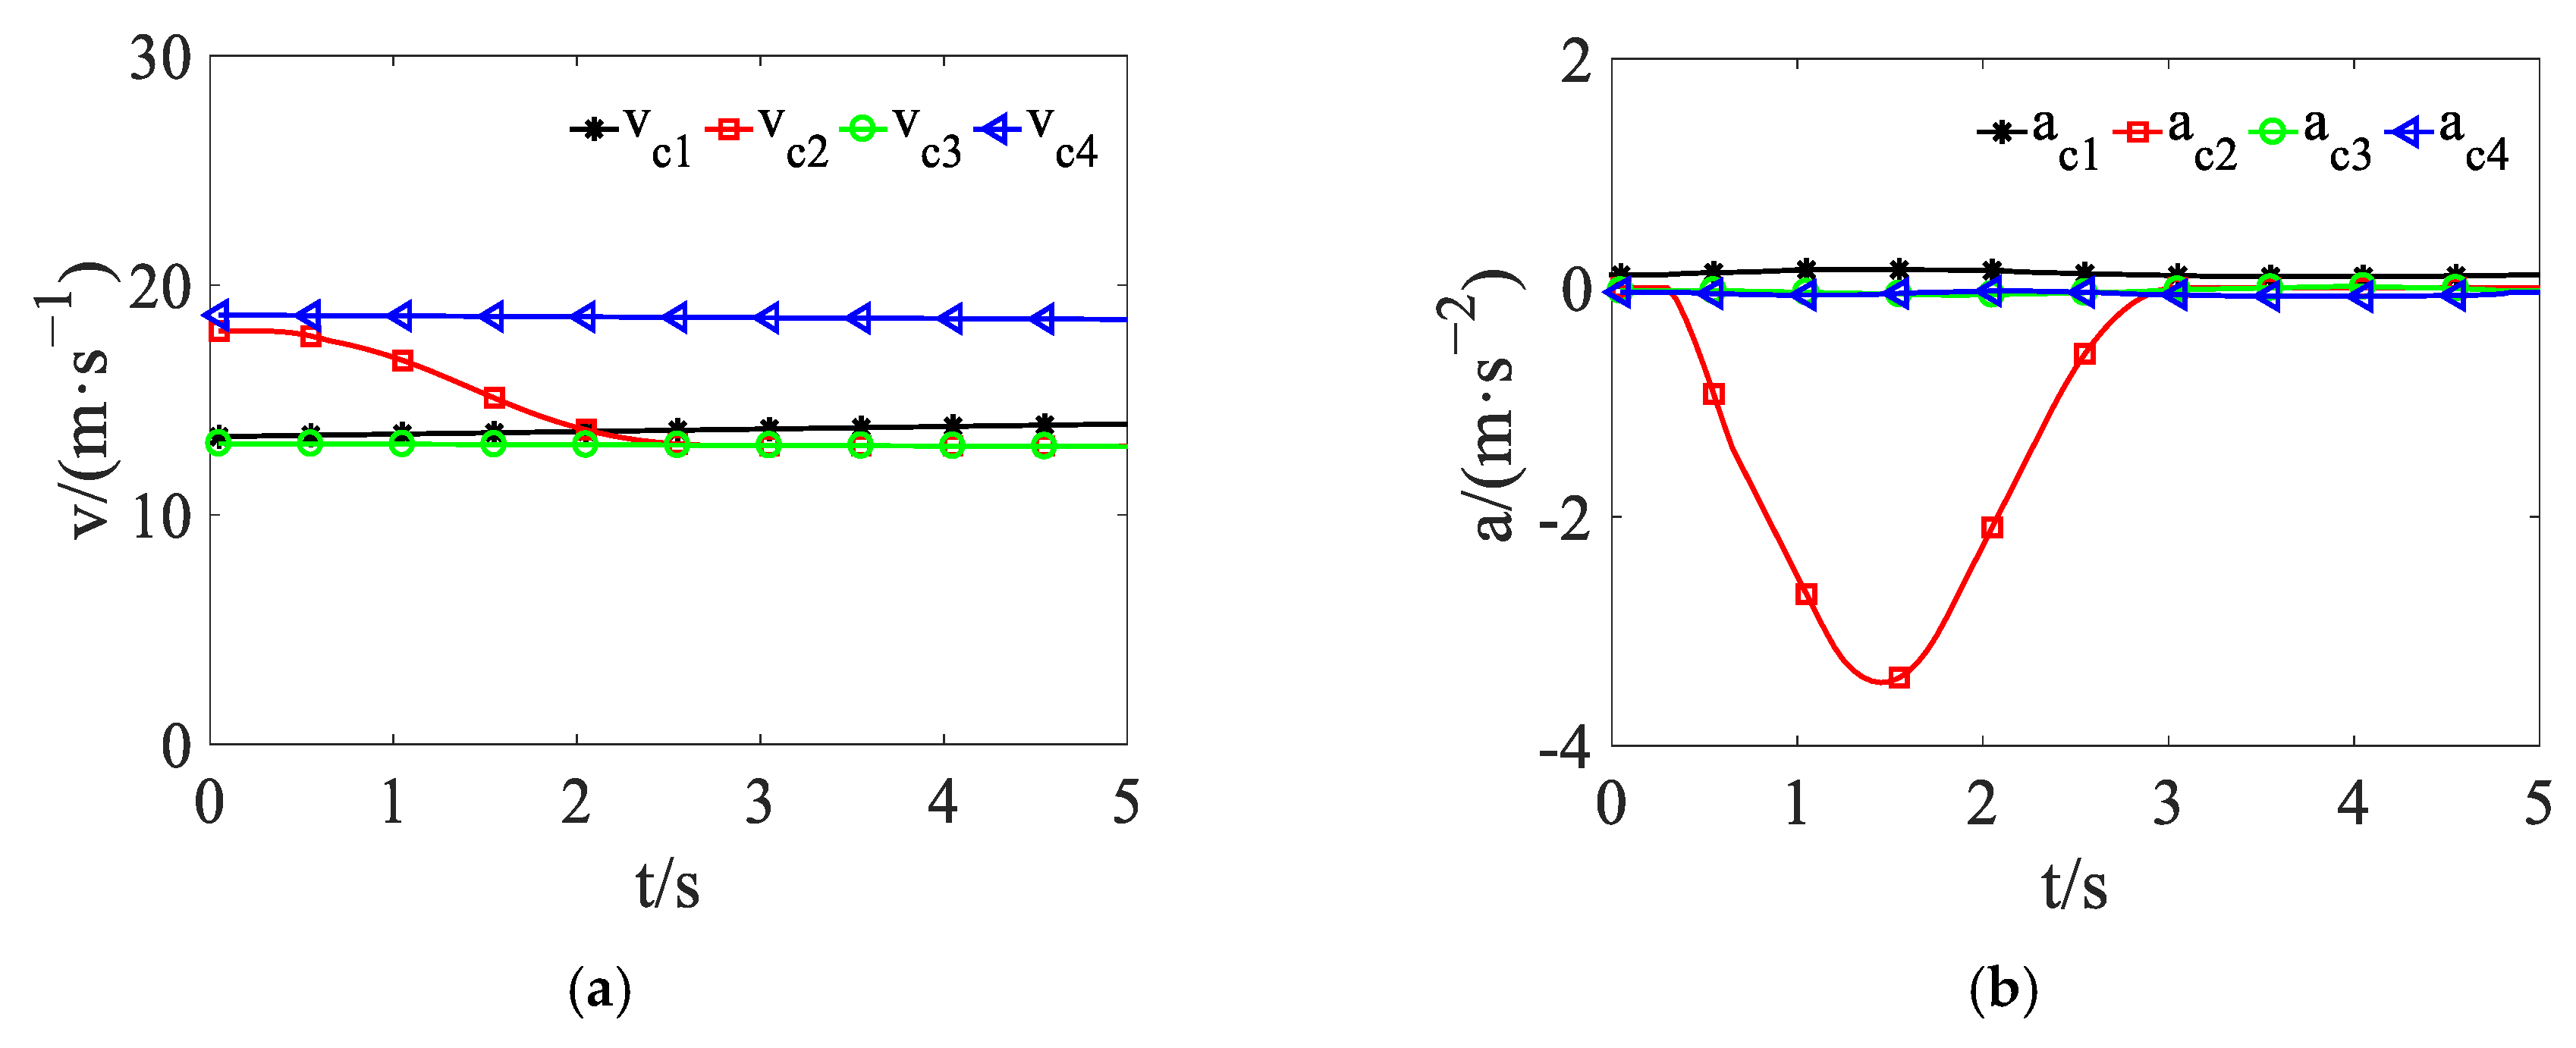
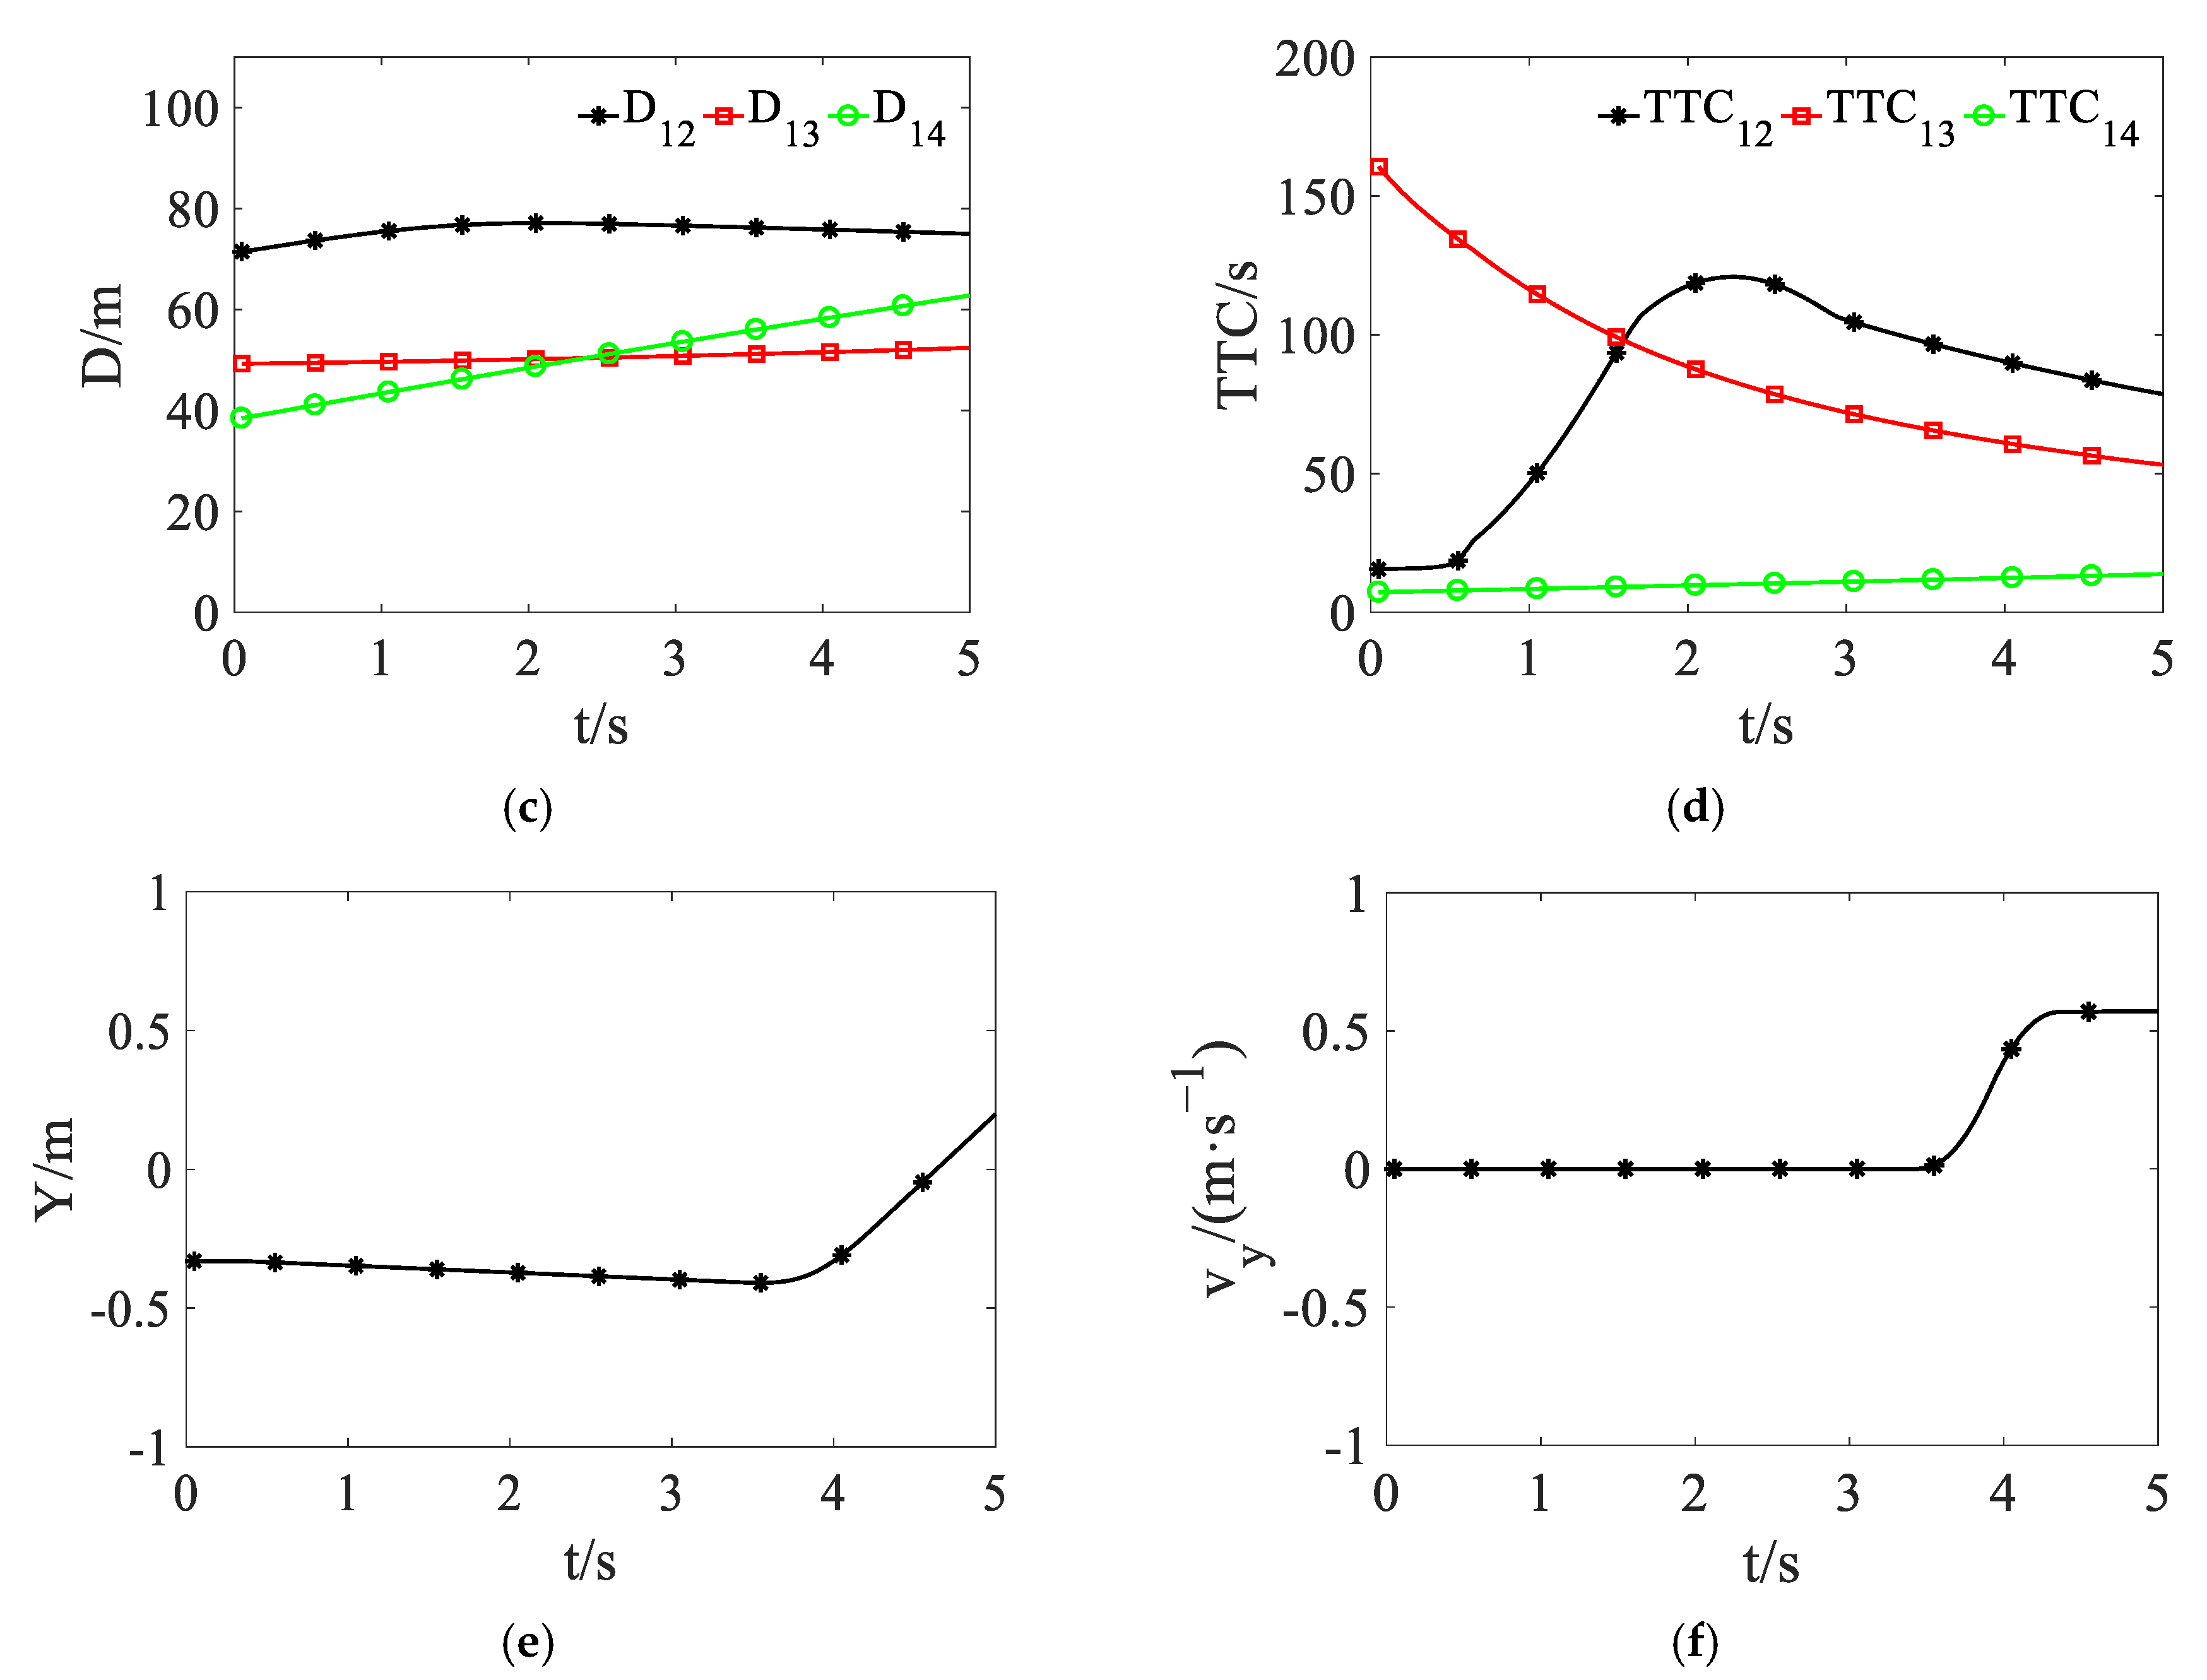
19] was used to filter and smooth the data. The processing of vehicle-related data is shown in
Figure 3. In order to prevent the error of model training, the data with a time to collision (TTC) greater than 500 were replaced with 500.
3.3. Establishment of the Prediction Model of Lane Change Intention
There were three layers in the feed-forward neural network for prediction, namely the input layer, the hidden layer, and the output layer. The sigmoid function was used as a transfer function of the hidden layer, and the sigmoid function equation is defined by the following equation:
The Softmax function was used as the transfer function of the output layer. The Softmax function, also known as the normalized exponential function, is widely used in multi-classification problems, which presents the results of multi-classification in the form of probability. The outputs of the Softmax function are correlated and the sum of their probabilities is always 1.
The neural network was trained by the Scaled Conjugate Gradient (SCG) method. This algorithm is an improved algorithm proposed by Moller, based on the Conjugate Gradient (CG), which mainly changes its linear search method when calculating the search step size. The step size was calculated accurately, and the positive definiteness of the Hessian matrix was considered [
20,
21,
22].
The step size of the CG was calculated as follows:
where
is the search step size,
is the search direction of the
k + 1-th iteration,
is the gradient direction of
,
, and
is the total error performance function of the network output of the
k-th iteration.
, , , so .
In the SCG algorithm, the following equation was used:
where
λk is the introduced scale factor, which was adjusted to ensure the positive definiteness of the Hessian matrix.
is the second derivative of the total error performance function of the network output when the linear search of the optimal distance of the
k-th iteration is
.
is the first derivative of the total error performance function of the network output when the linear search of the optimal distance of the
k-th iteration is
.
We recorded the adjusted
as
,
as
, and
as
. If
in an iteration, the Hessian matrix is not a positive definite. In this case,
can be increased to make
, and the specific increase was determined by the following calculation:
Equation (6) implies that if is raised with more than , then . The question is “how much should be raised to get an optimal solution?”
The following was a reasonable choice:
This led to the following:
The step size was given by
The search step size can be adjusted by adjusting the scale factor λk and the positive definiteness of the Hessian matrix can be ensured.
3.4. Training of Prediction Model of Lane Change Intention
A total of 720 sets of data were selected from the trajectories of lane changes to the left, including at 0 s, 0.5 s, 1 s, 1.5 s, and 2 s before the lane change. There were 795 sets of data selected from the trajectories of going straight, and altogether, there were 1515 sets of data. The data were divided into a training set, a verification set, and a test set, and the three data sets accounted for 70%, 15%, and 15% of the total data set, respectively. The training set was used to train the model. The function of the verification set was to test the generalization ability of the neural network. When the generalization ability stopped improving, the training of the neural network stopped. Finally, the test set was used to test the performance of the neural network. The number of neurons was determined by empirical Equation (10) [
23].
where
n is the number of neurons in the hidden layer and
n1 is the number of nodes in the input layer. In this paper,
n1 is 17, so
n is 35.
All the data at 0 s, 0.5 s, 1 s, 1.5 s, and 2 s before the lane change were used as inputs to train the model. In order to ensure the reliability of the training results, the model was trained ten times, and then the average accuracy was taken. The accuracy of the model is shown in
Table 2.
It can be seen from
Table 2 that the highest accuracy of the prediction model was 97.4%, the lowest accuracy rate was 96.2%, and the average accuracy was 97%, indicating that the effect of the prediction model is good.
In order to verify the accuracy of the model at different times before the lane change, the intentions of other vehicles at 0 s, 0.5 s, 1 s, 1.5 s, and 2 s before the lane change were predicted based on the trained neural network model. The inputs of the model were the sample data of five moments and the accuracies of the corresponding results of the prediction model are shown in
Table 3.
It can be seen from
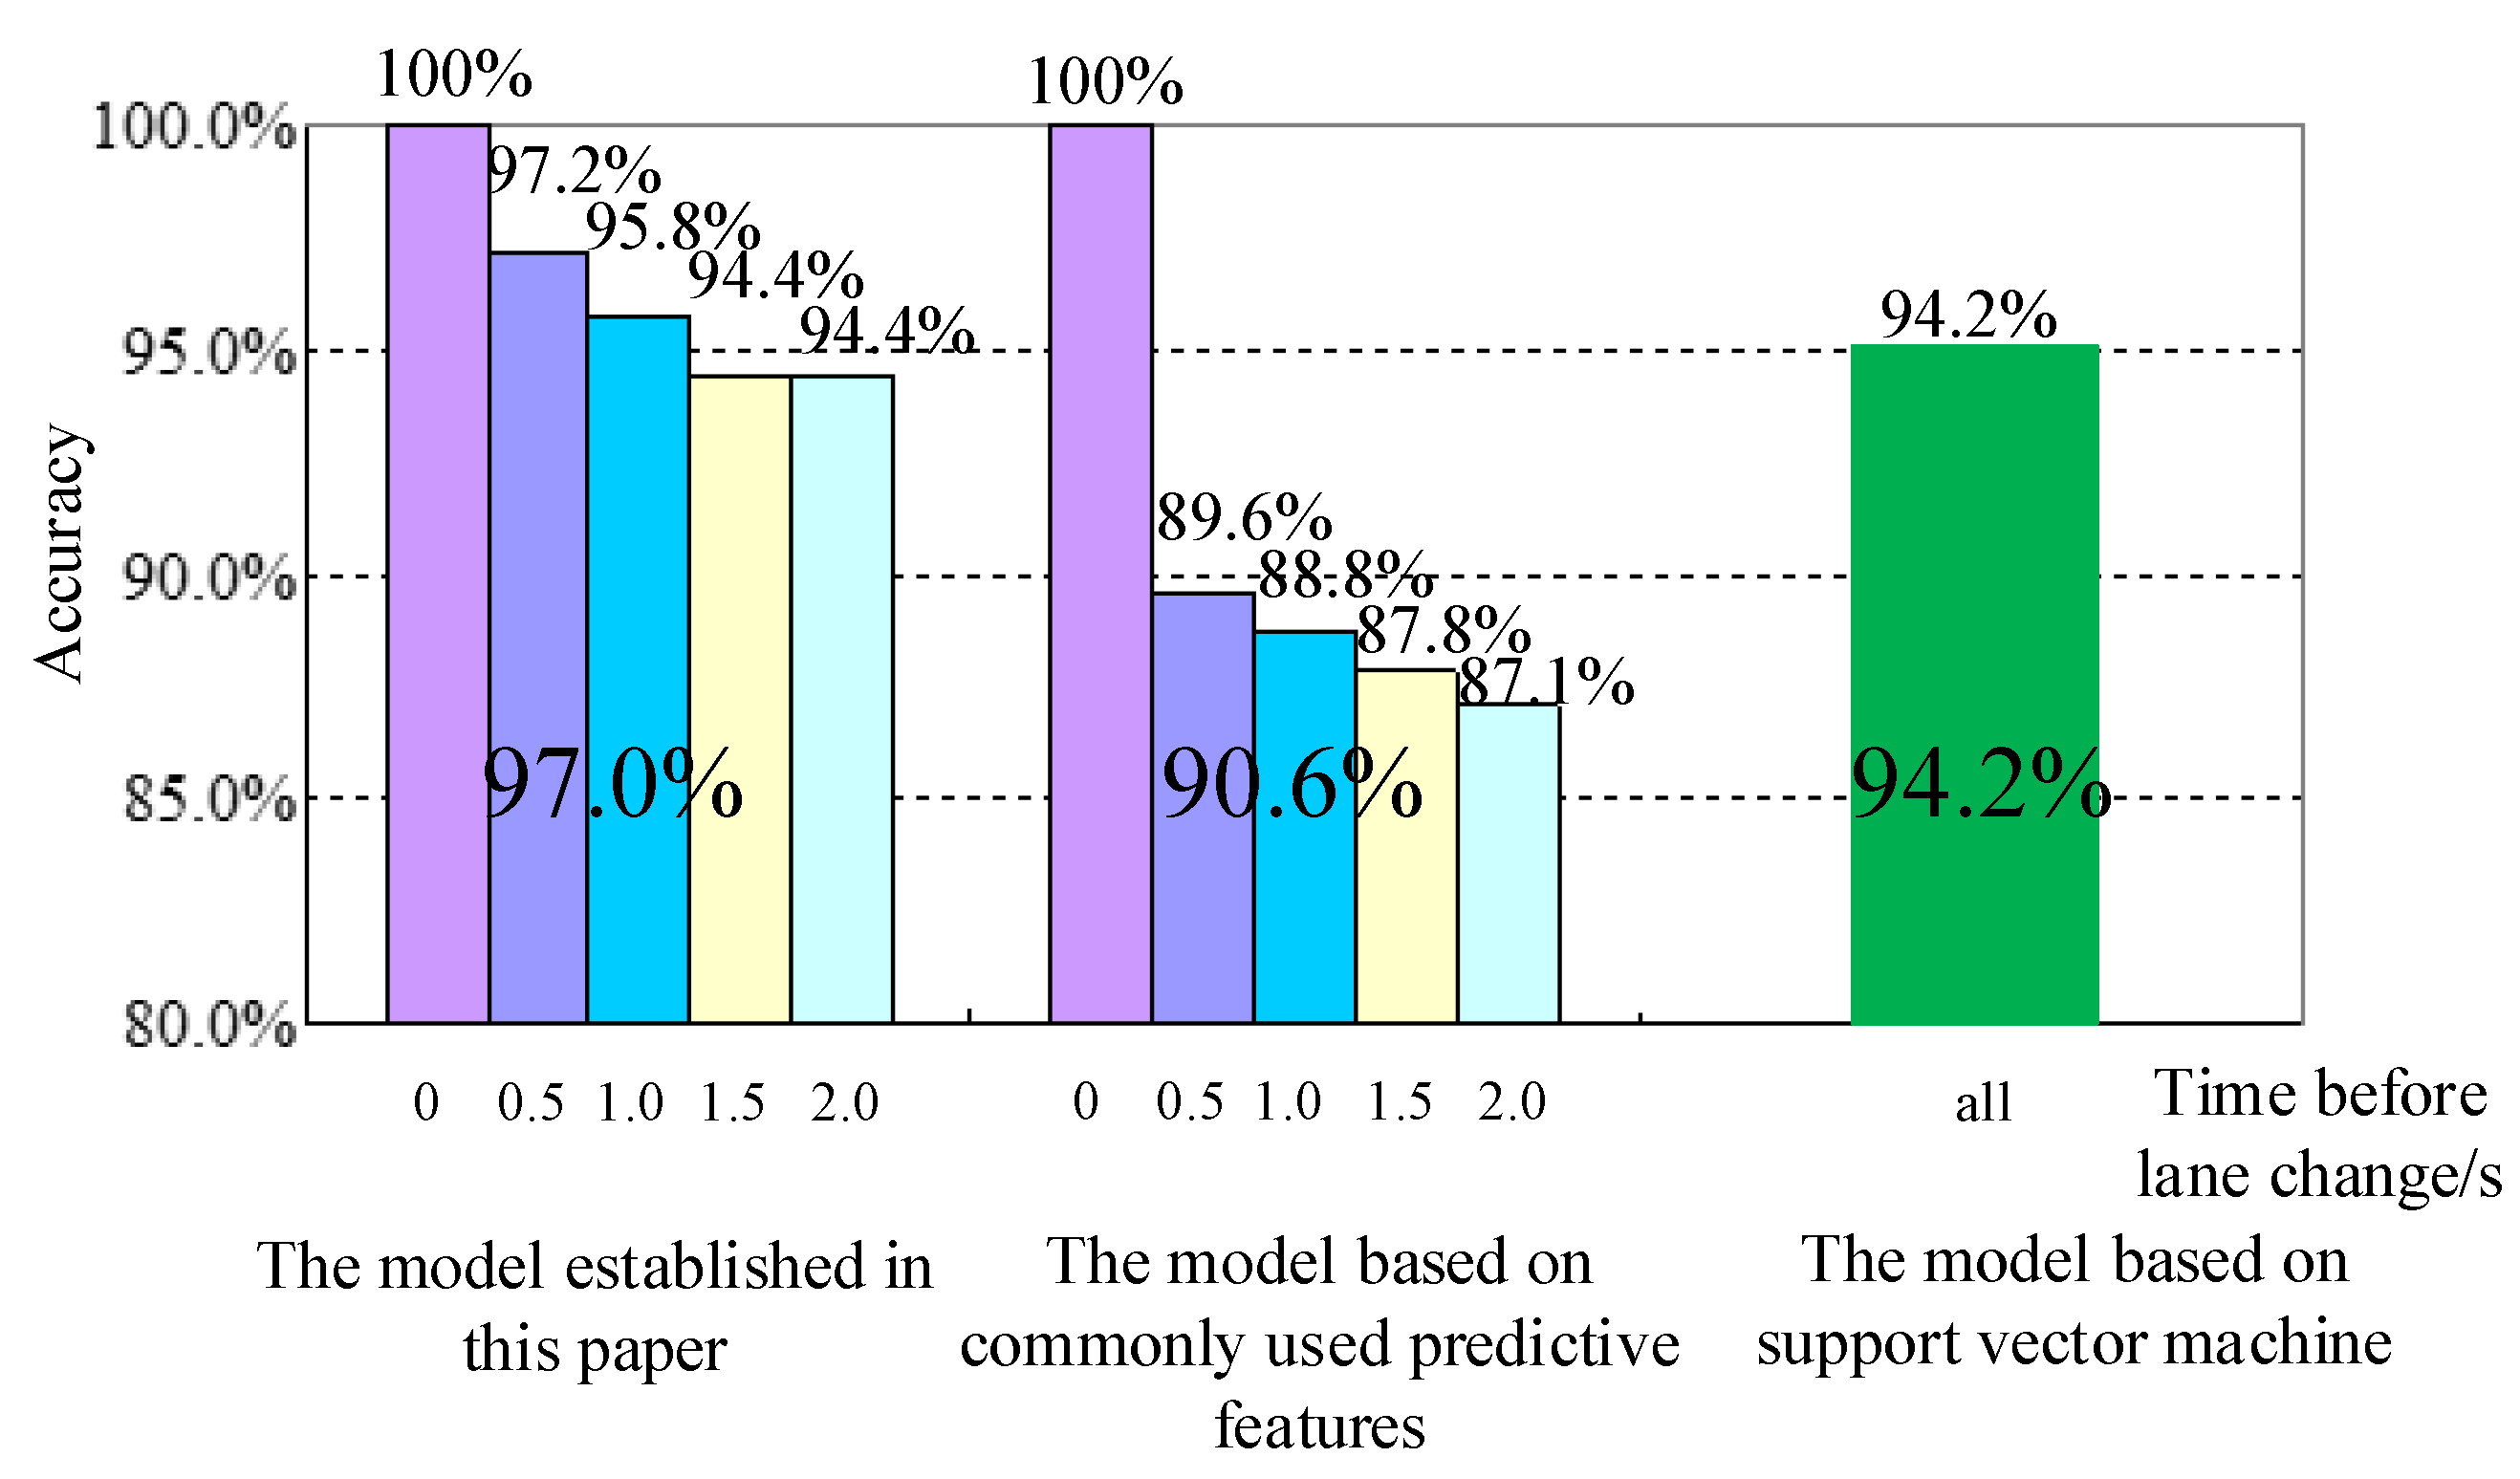
Table 3 that the accuracies of the prediction model at 0 s, 0.5 s, 1 s, 1.5 s, and 2 s before a lane change of other vehicles were 100%, 97.2%, 95.8%, 94.4%, and 94.4%, respectively, which indicates that the accuracy of the prediction model decreased with the increase of time before a lane change. Even if the accuracy of prediction was the lowest at 2 s before the lane change, the accuracy could still reach 94.4%, and the lane change intentions of other vehicles could be accurately predicted.
When some vehicles are missing, the missing vehicles have no influence on the lane change intention of the predicted vehicle. Therefore, the missing vehicle was set as a virtual vehicle that did not affect the lane change intention of the predicted vehicle, and its input characteristics were set as follows: In order to ensure the absolute safety of the predicted vehicle and the virtual vehicle, the predicted collision time was set to 500 s. The speed and acceleration were set to be the same as the predicted vehicle, and the distance (
Dis) was calculated according to the maximum safe braking distance.
where
vmax is the maximum speed of the vehicle; 120 km/h was used in this paper.
a is the maximum deceleration of the vehicle; 5.9 m/s
−2 was used in this paper. Therefore, the distance was 188.3 m.
In this way, the lack of some vehicles was represented as a virtual vehicle that did not affect the intention of the predicted vehicle to change lanes, and will not affect the accuracy of the model built in this paper.
3.5. Comparison with the Model of Common Features at the Present Stage
At the present stage, the common features are as follows: D
13, D
14, v
c13, v
c14, Y, v
y, and v
c1. The above data were calculated and extracted from the collected data to train the model. According to Equation (6),
n1 is 7, so
n is 15. Similarly, the data was divided into a training set, a verification set, and a test set, and the three data sets accounted for 70%, 15%, and 15% of the total data set, respectively. All the data at 0 s, 0.5 s, 1 s, 1.5 s, and 2 s before a lane change were used as inputs to train the model. In order to ensure the reliability of the training results, the model was trained ten times, and then the average accuracy was taken. The accuracy of the model is shown in
Table 4.
It can be seen from
Table 4 that the highest accuracy of the prediction model was 92.5%, the lowest accuracy was 88.5%, and the average accuracy was 90.6%. The average accuracy of the model established in this paper was 97.0%, which is 6.4% higher than that of the model of common features at the present stage, indicating that the effect of the prediction model established in this paper is better.
In order to verify the accuracy of the model at different times before a lane change, the intentions of other vehicles at 0 s, 0.5 s, 1 s, 1.5 s, and 2 s before a lane change were predicted based on the trained neural network model. The inputs of the model were the sample data of five moments and the accuracies of the corresponding results of prediction are shown in
Table 5.
It can be seen from
Table 5 that the accuracy of the prediction model was 100% at 0 s before the lane change of other vehicles. The Y and v
y change obviously at 0 s before a lane change, so the starting time of a lane change can be accurately detected. The accuracies of prediction at 0.5 s, 1 s, 1.5 s, and 2 s before a lane change were 89.6%, 88.8%, 87.8%, and 87.1%, respectively, which were 7.6%, 7.0%, 6.6%, and 7.3% lower than the model established in this paper, fully proving that the effect of the prediction model established in this paper is better than that of this model.
The reason why the model established in this paper is better than the model of common features at the present stage is that the prediction models of lane change intention of vehicles at the present stage are mostly based on the motion state of the predicted vehicle and the location relationship between the predicted vehicle and the lane, and the influence of the motion state of vehicles around the predicted vehicle on the lane change intention of other vehicles is less considered. Based on this, the influence of the motion state of the predicted vehicle, the position relationship between the predicted vehicle and the lane, and the motion state of vehicles around the predicted vehicle on the prediction of lane change intention were considered systematically in this paper. The prediction features of lane change intention were screened and the prediction model of vehicles’ lane change intentions was established.
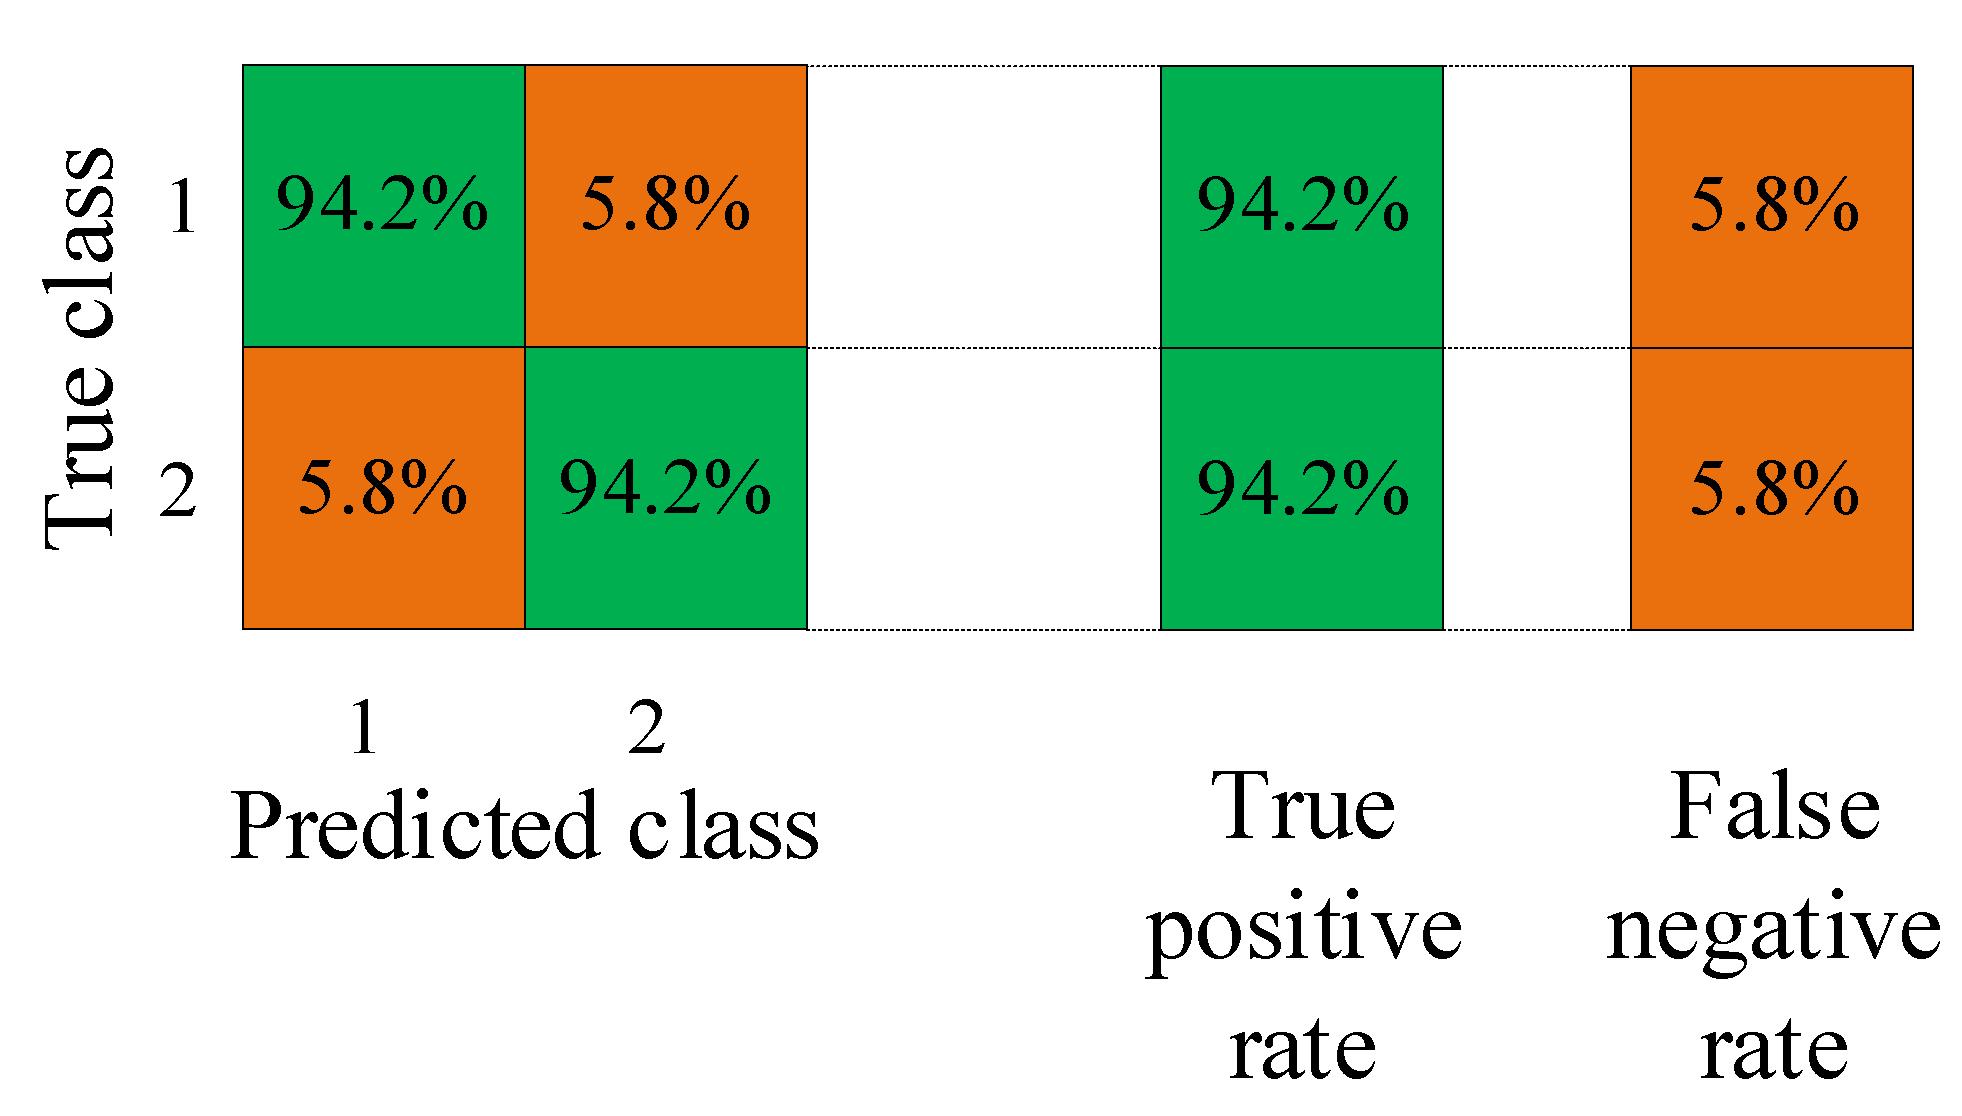
3.6. Comparison with the Model Based on SVM
The SVM was trained with the data containing information of vehicle
2, vehicle
3, and vehicle
4. About 70% of the data of the lane changes to the left and going straight were respectively used as a training set, and 30% of the data of the lane changes to the left and going straight were respectively used as a test set. The training results of the model based on the SVM are shown in
Figure 4. As can be seen from
Figure 4, the true positive rate of going straight and lane changes to the left is 94.2%, so the correct rate is 94.2%. However, the accuracy of the prediction model established in this paper was 97.0%, which is 2.8% higher than that of the SVM, which shows that the model established in this paper is more advantageous than the model based on the SVM.
The reason why the model built in this paper is better than the support vector machine model is that the neural network model has strong learning ability, strong robustness to noise, and fault tolerance, so the prediction effect is more advantageous than the prediction effect of the SVM.
The difference of accuracy of prediction among the model established in this paper, the model of common features at the present stage, and the model based on the SVM can be observed more intuitively, so the histogram of the accuracy of the prediction of the three models was established and is shown in
Figure 5. The accuracies of the prediction model established in this paper were 100%, 97.2%, 95.8%, 94.4%, and 94.4%, respectively, at 0 s, 0.5 s, 1 s, 1.5 s, and 2 s before a lane change of other vehicles. The accuracies of prediction of the common feature models at 0 s, 0.5 s, 1 s, 1.5 s, and 2 s before a lane change of other vehicles were 100%, 89.6%, 88.8%, 87.8%, and 87.1%, respectively. The accuracies of the prediction model based on the SVM were 94.2% for all data at 0 s, 0.5 s, 1 s, 1.5 s, and 2 s before other vehicles changed lanes.


