


Correlation Analysis Model of Environment Parameters Using IoT Framework in a Biogas Energy Generation Context

 ,
, 
Abstract
1. Introduction
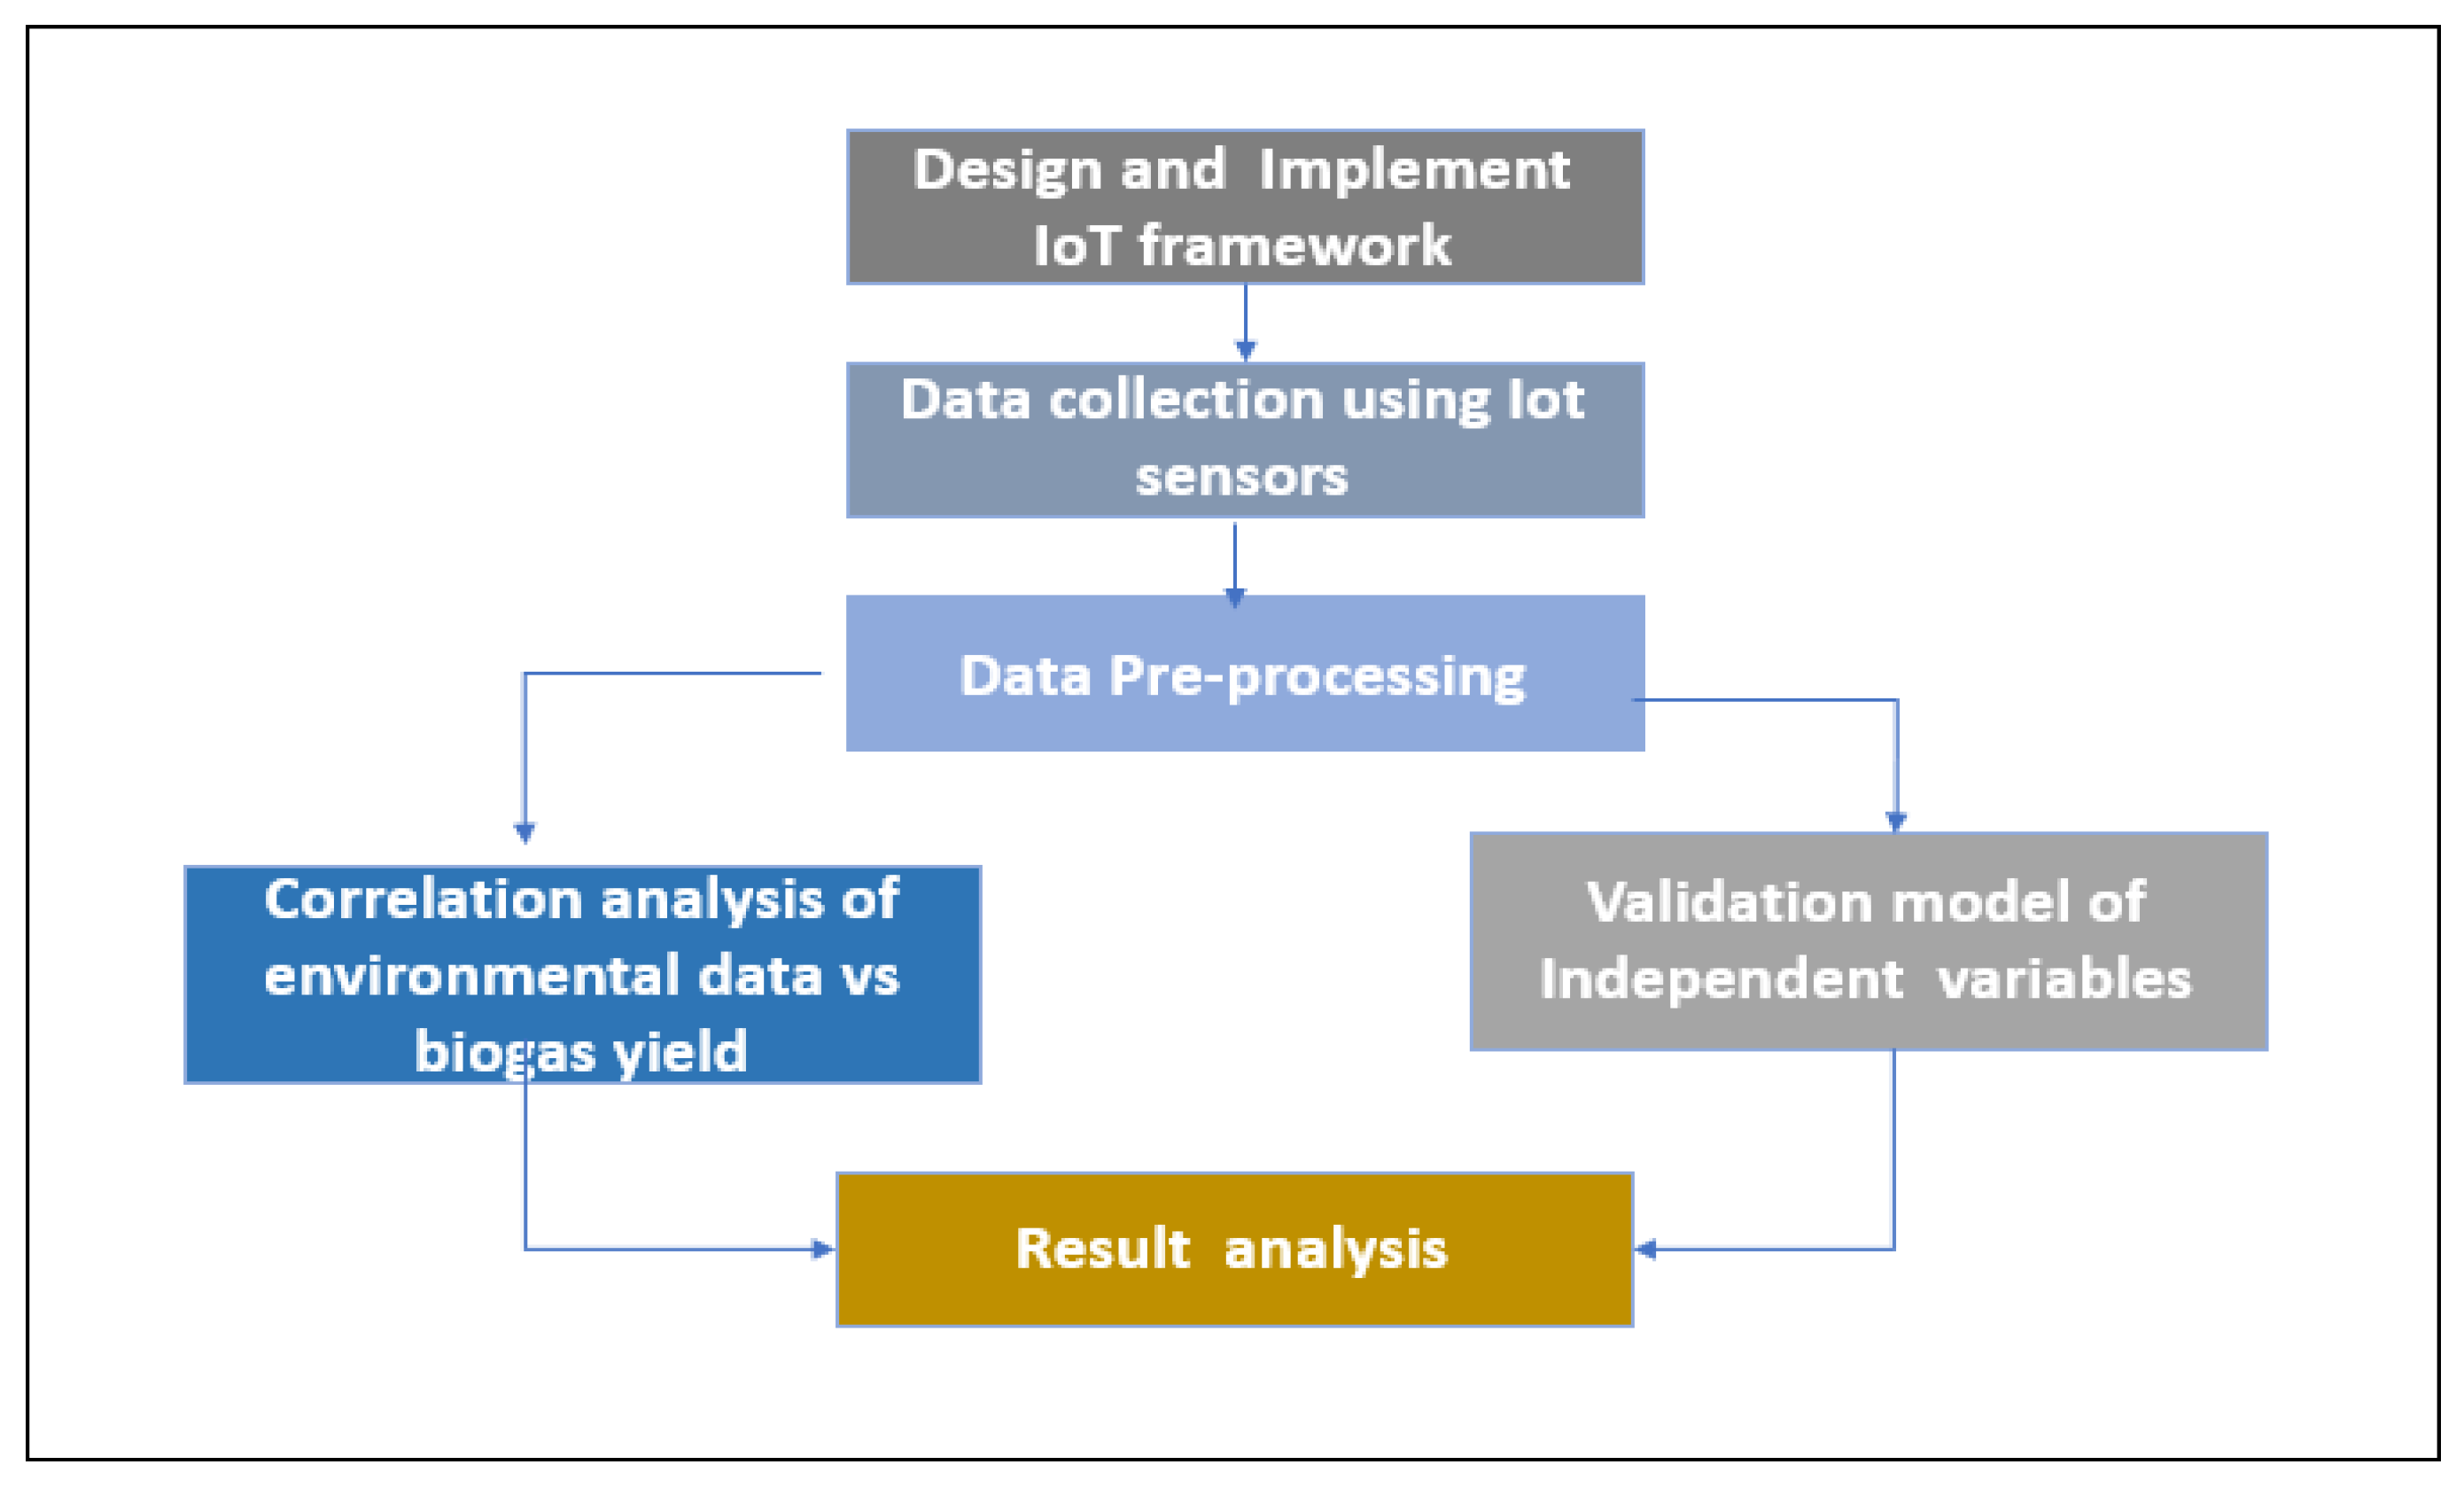
2. Materials and Methods
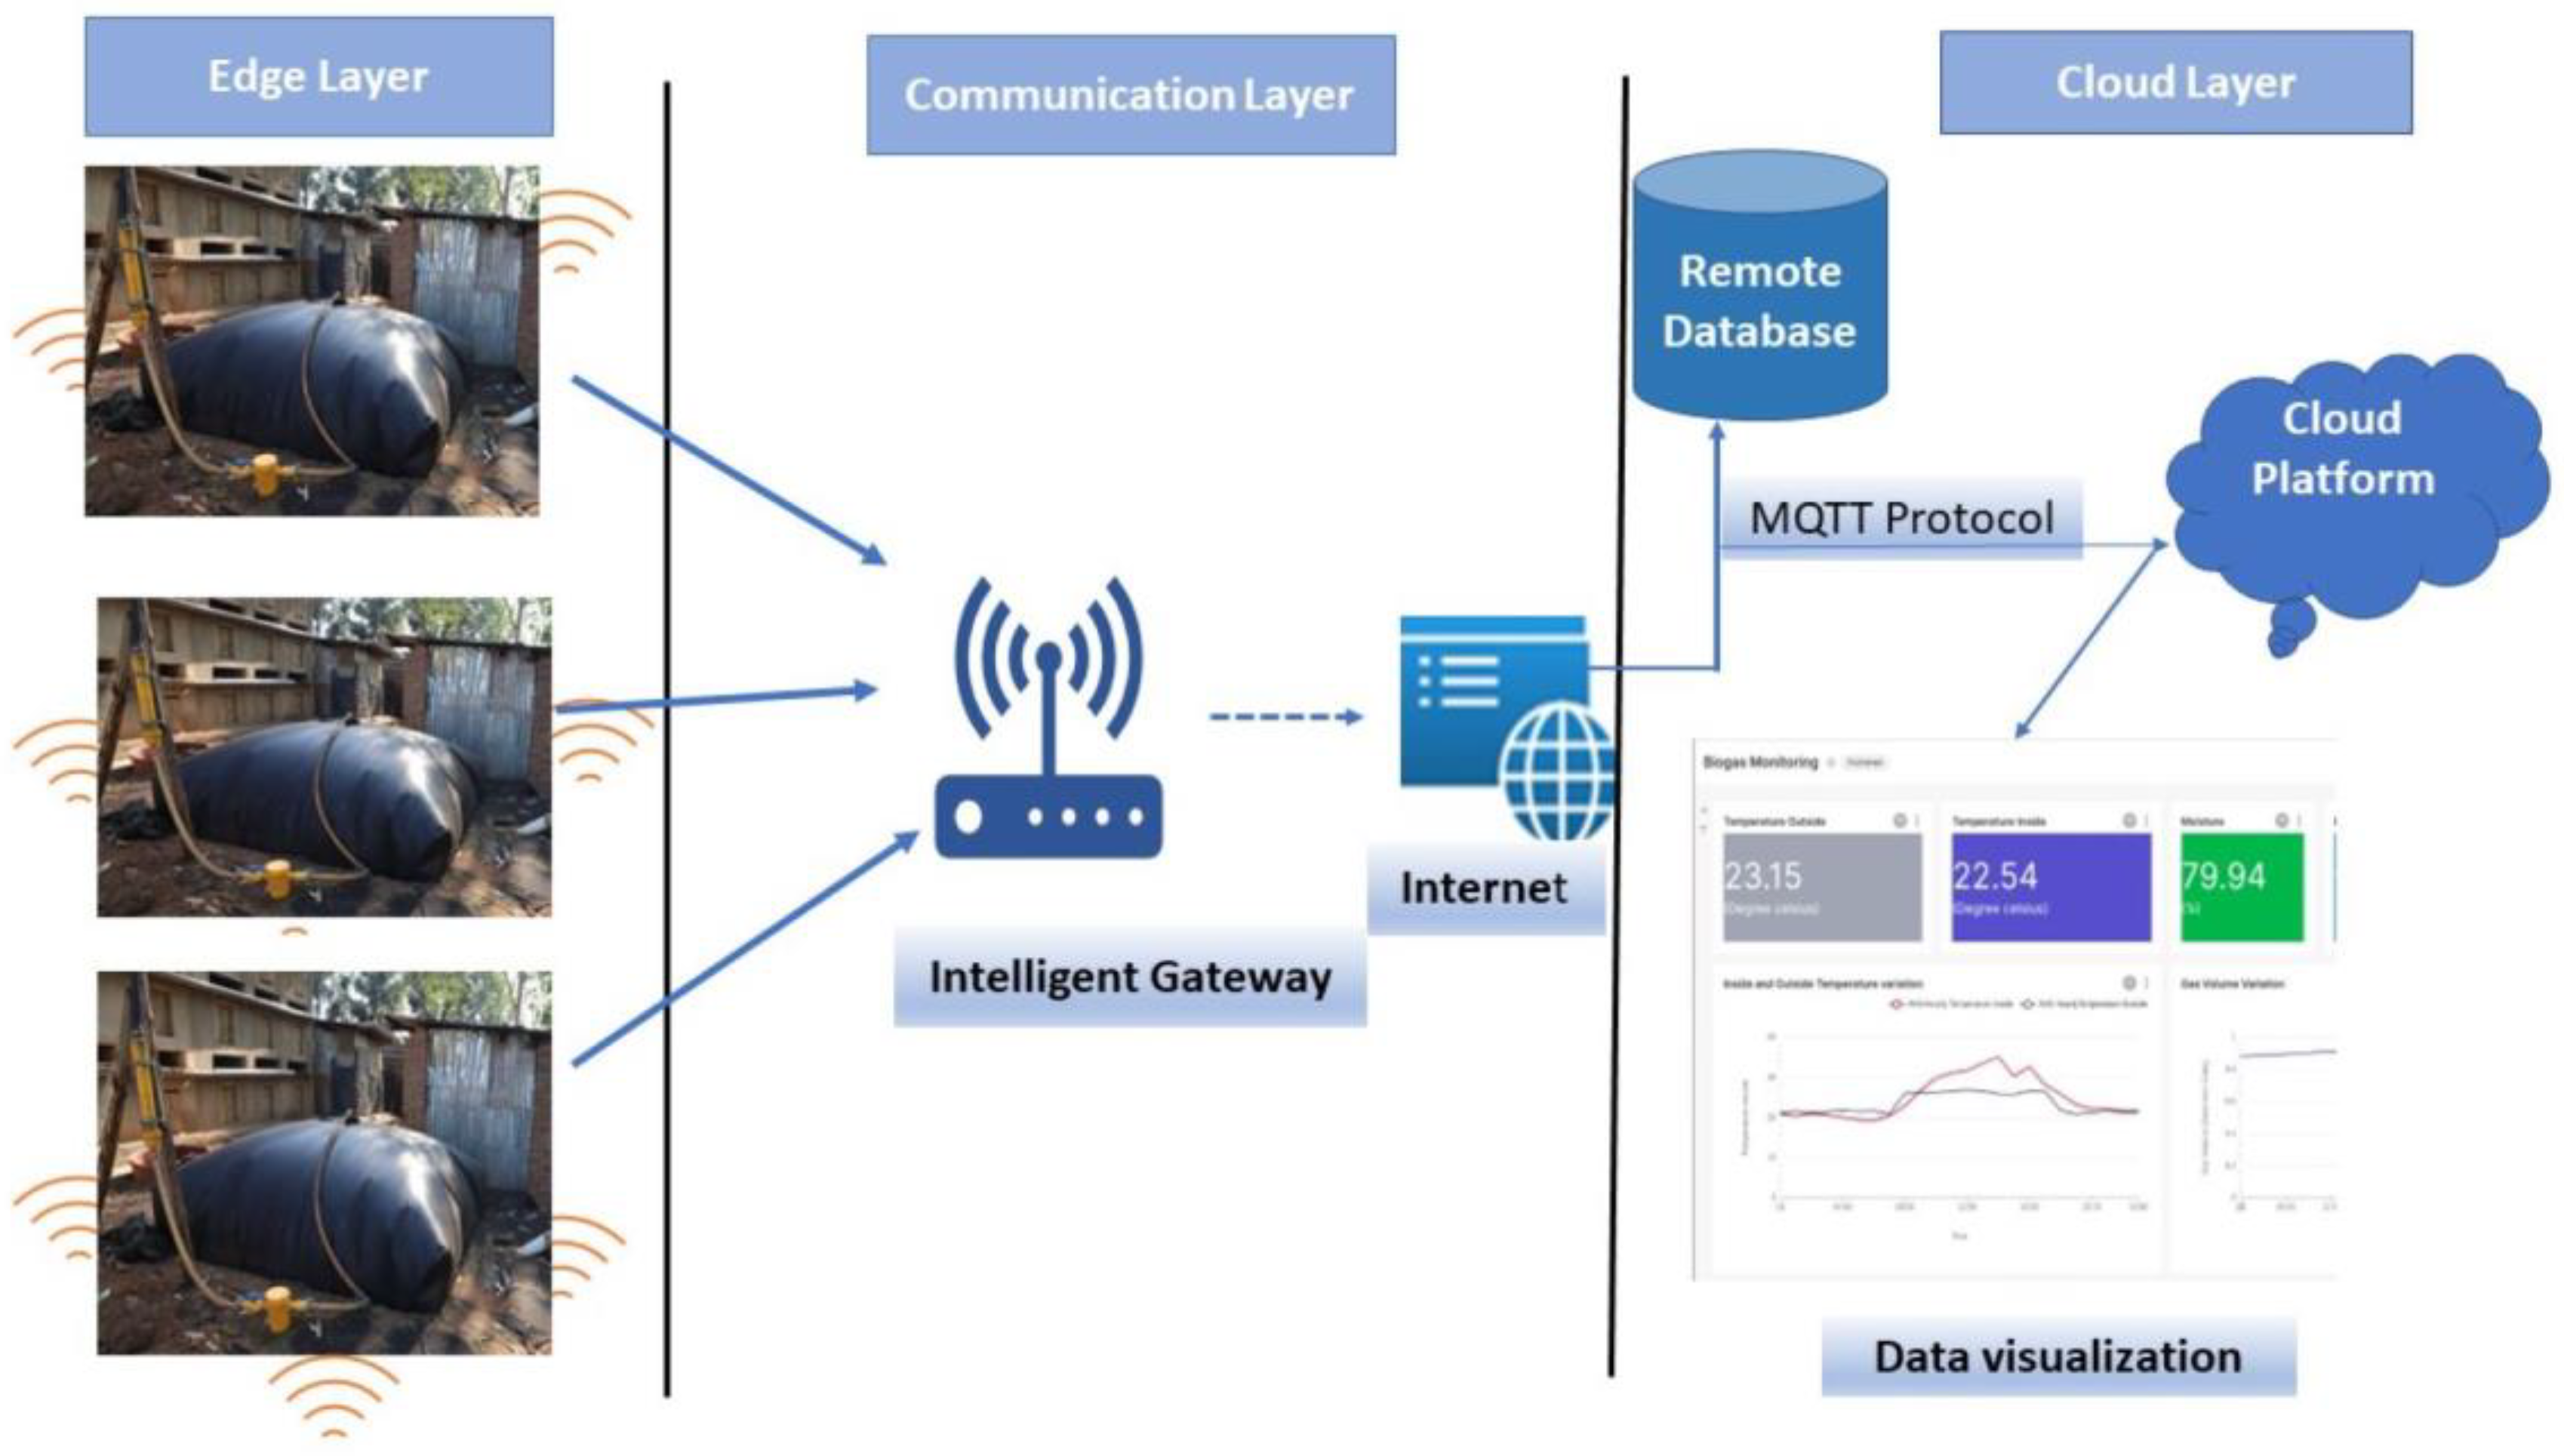
2.1. IoT Framework Design and System Setup
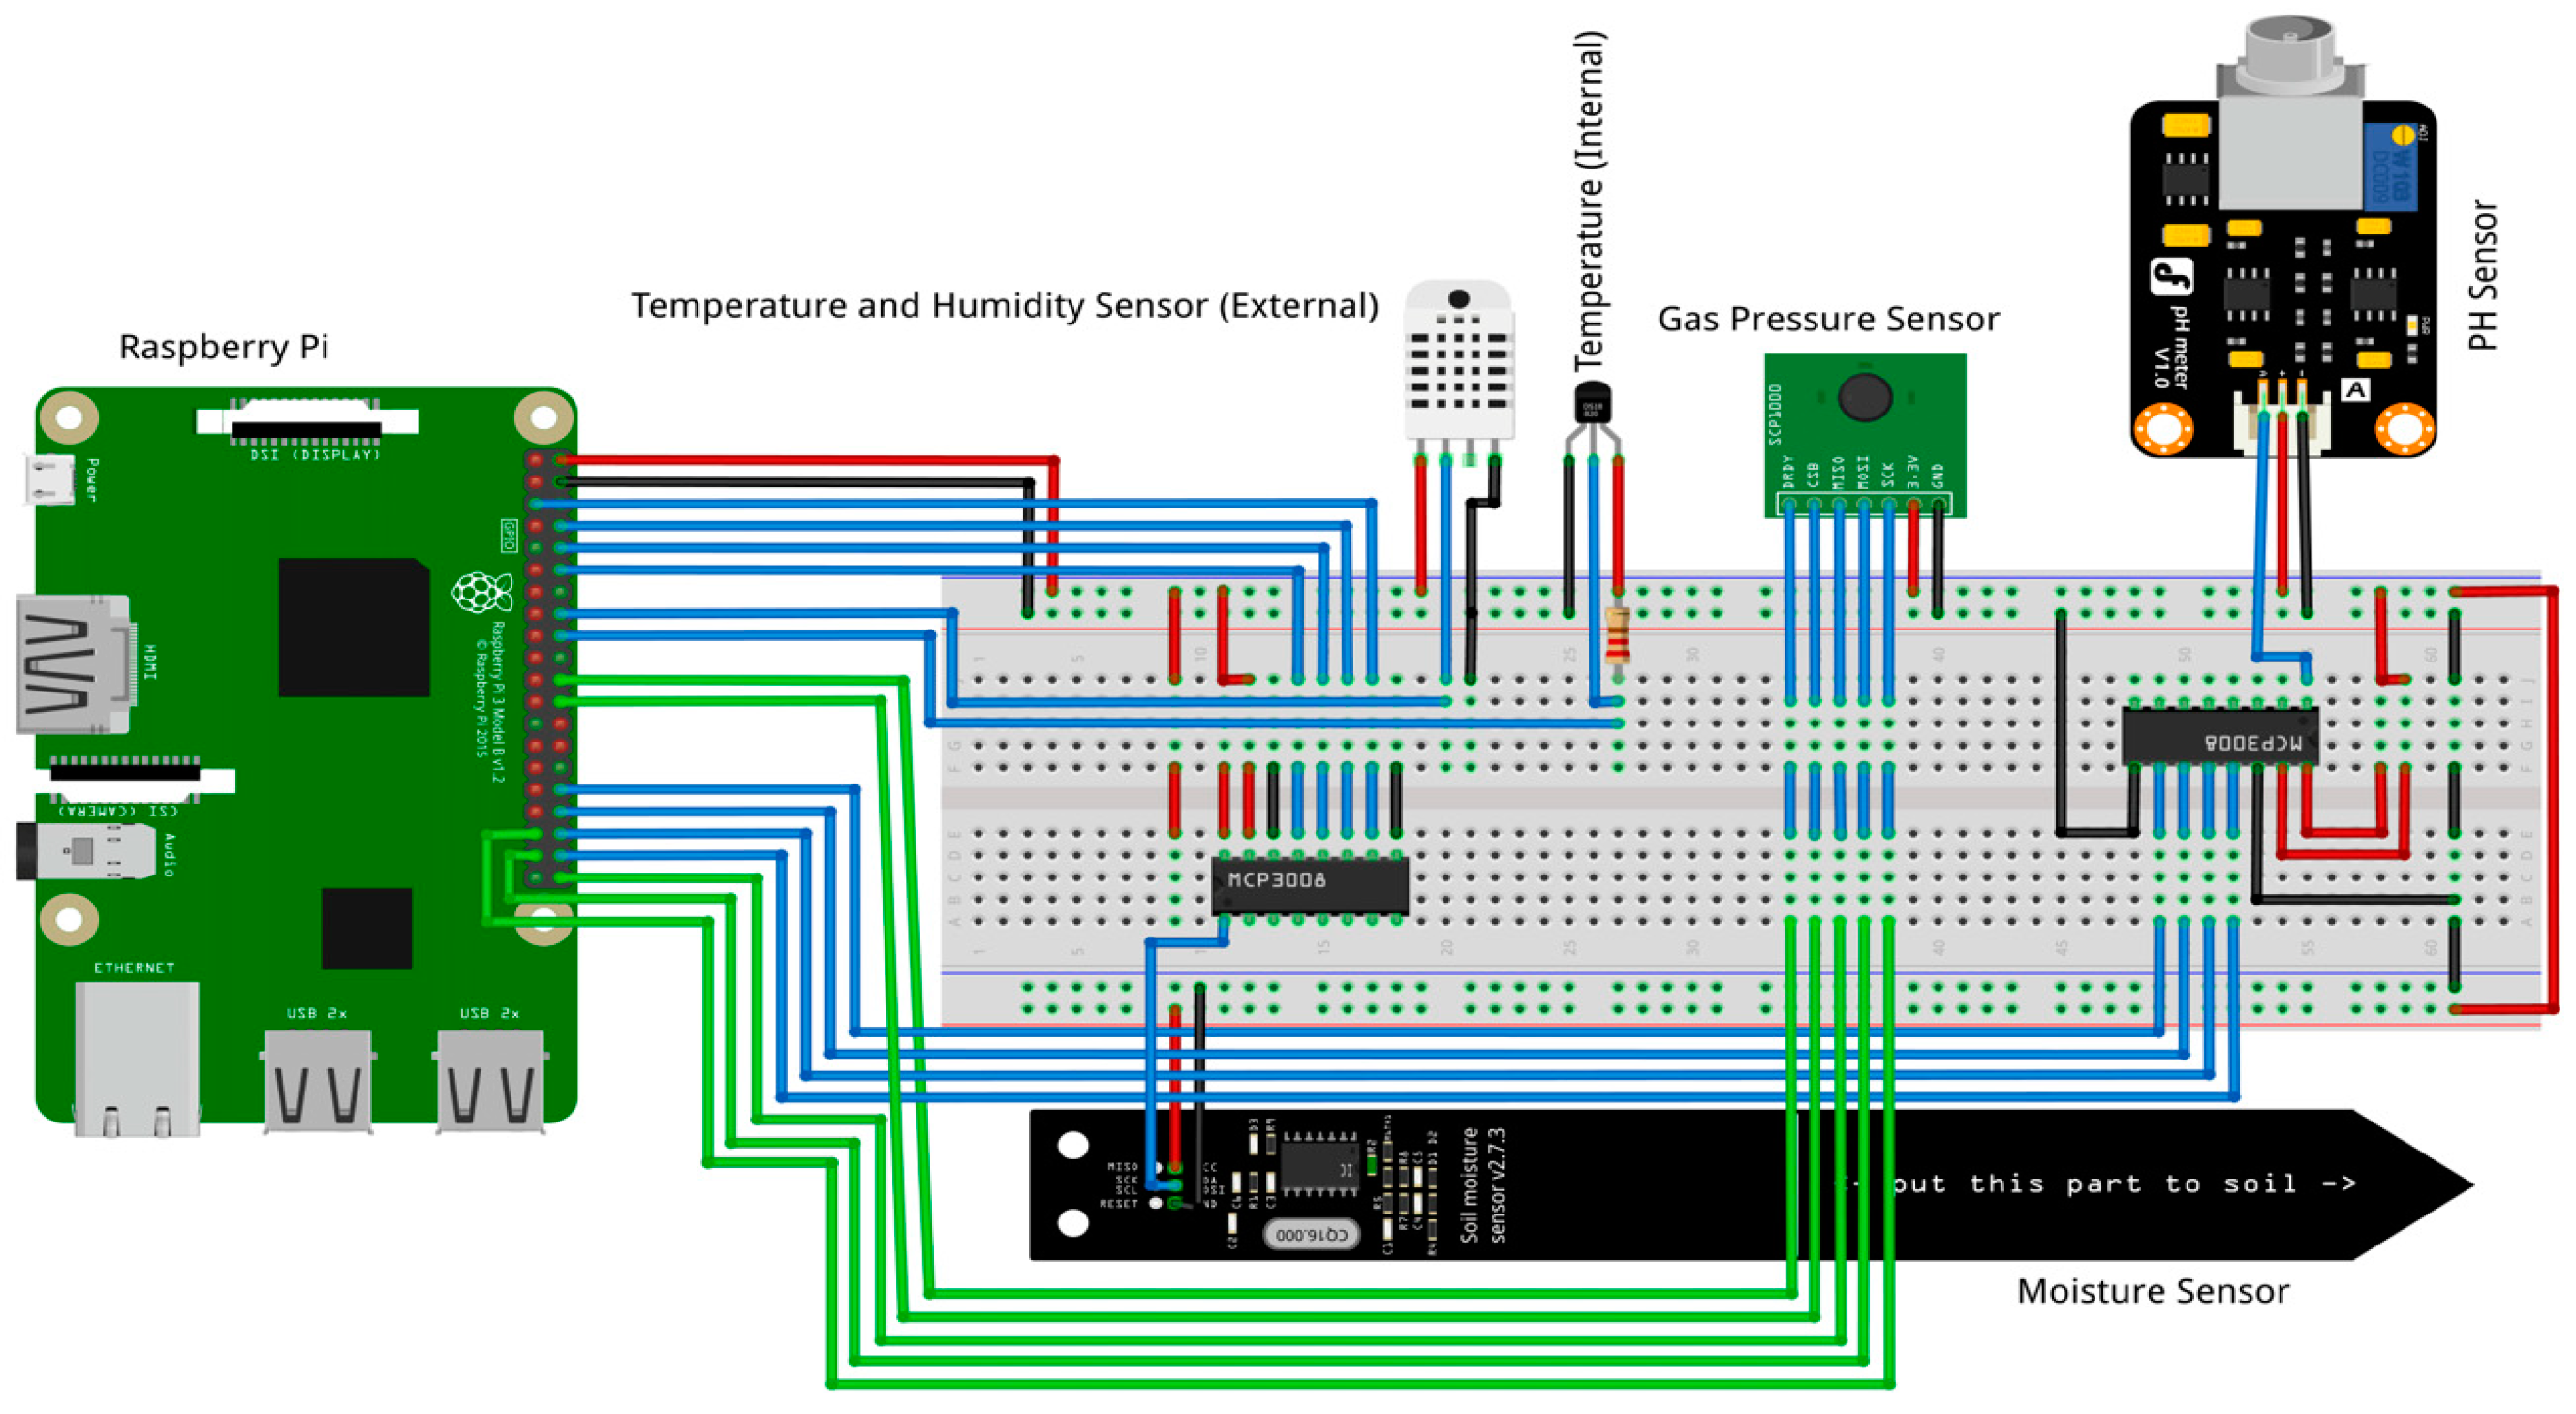
2.1.1. Edge Lyer
2.1.2. Cloud Layer
Data Storage
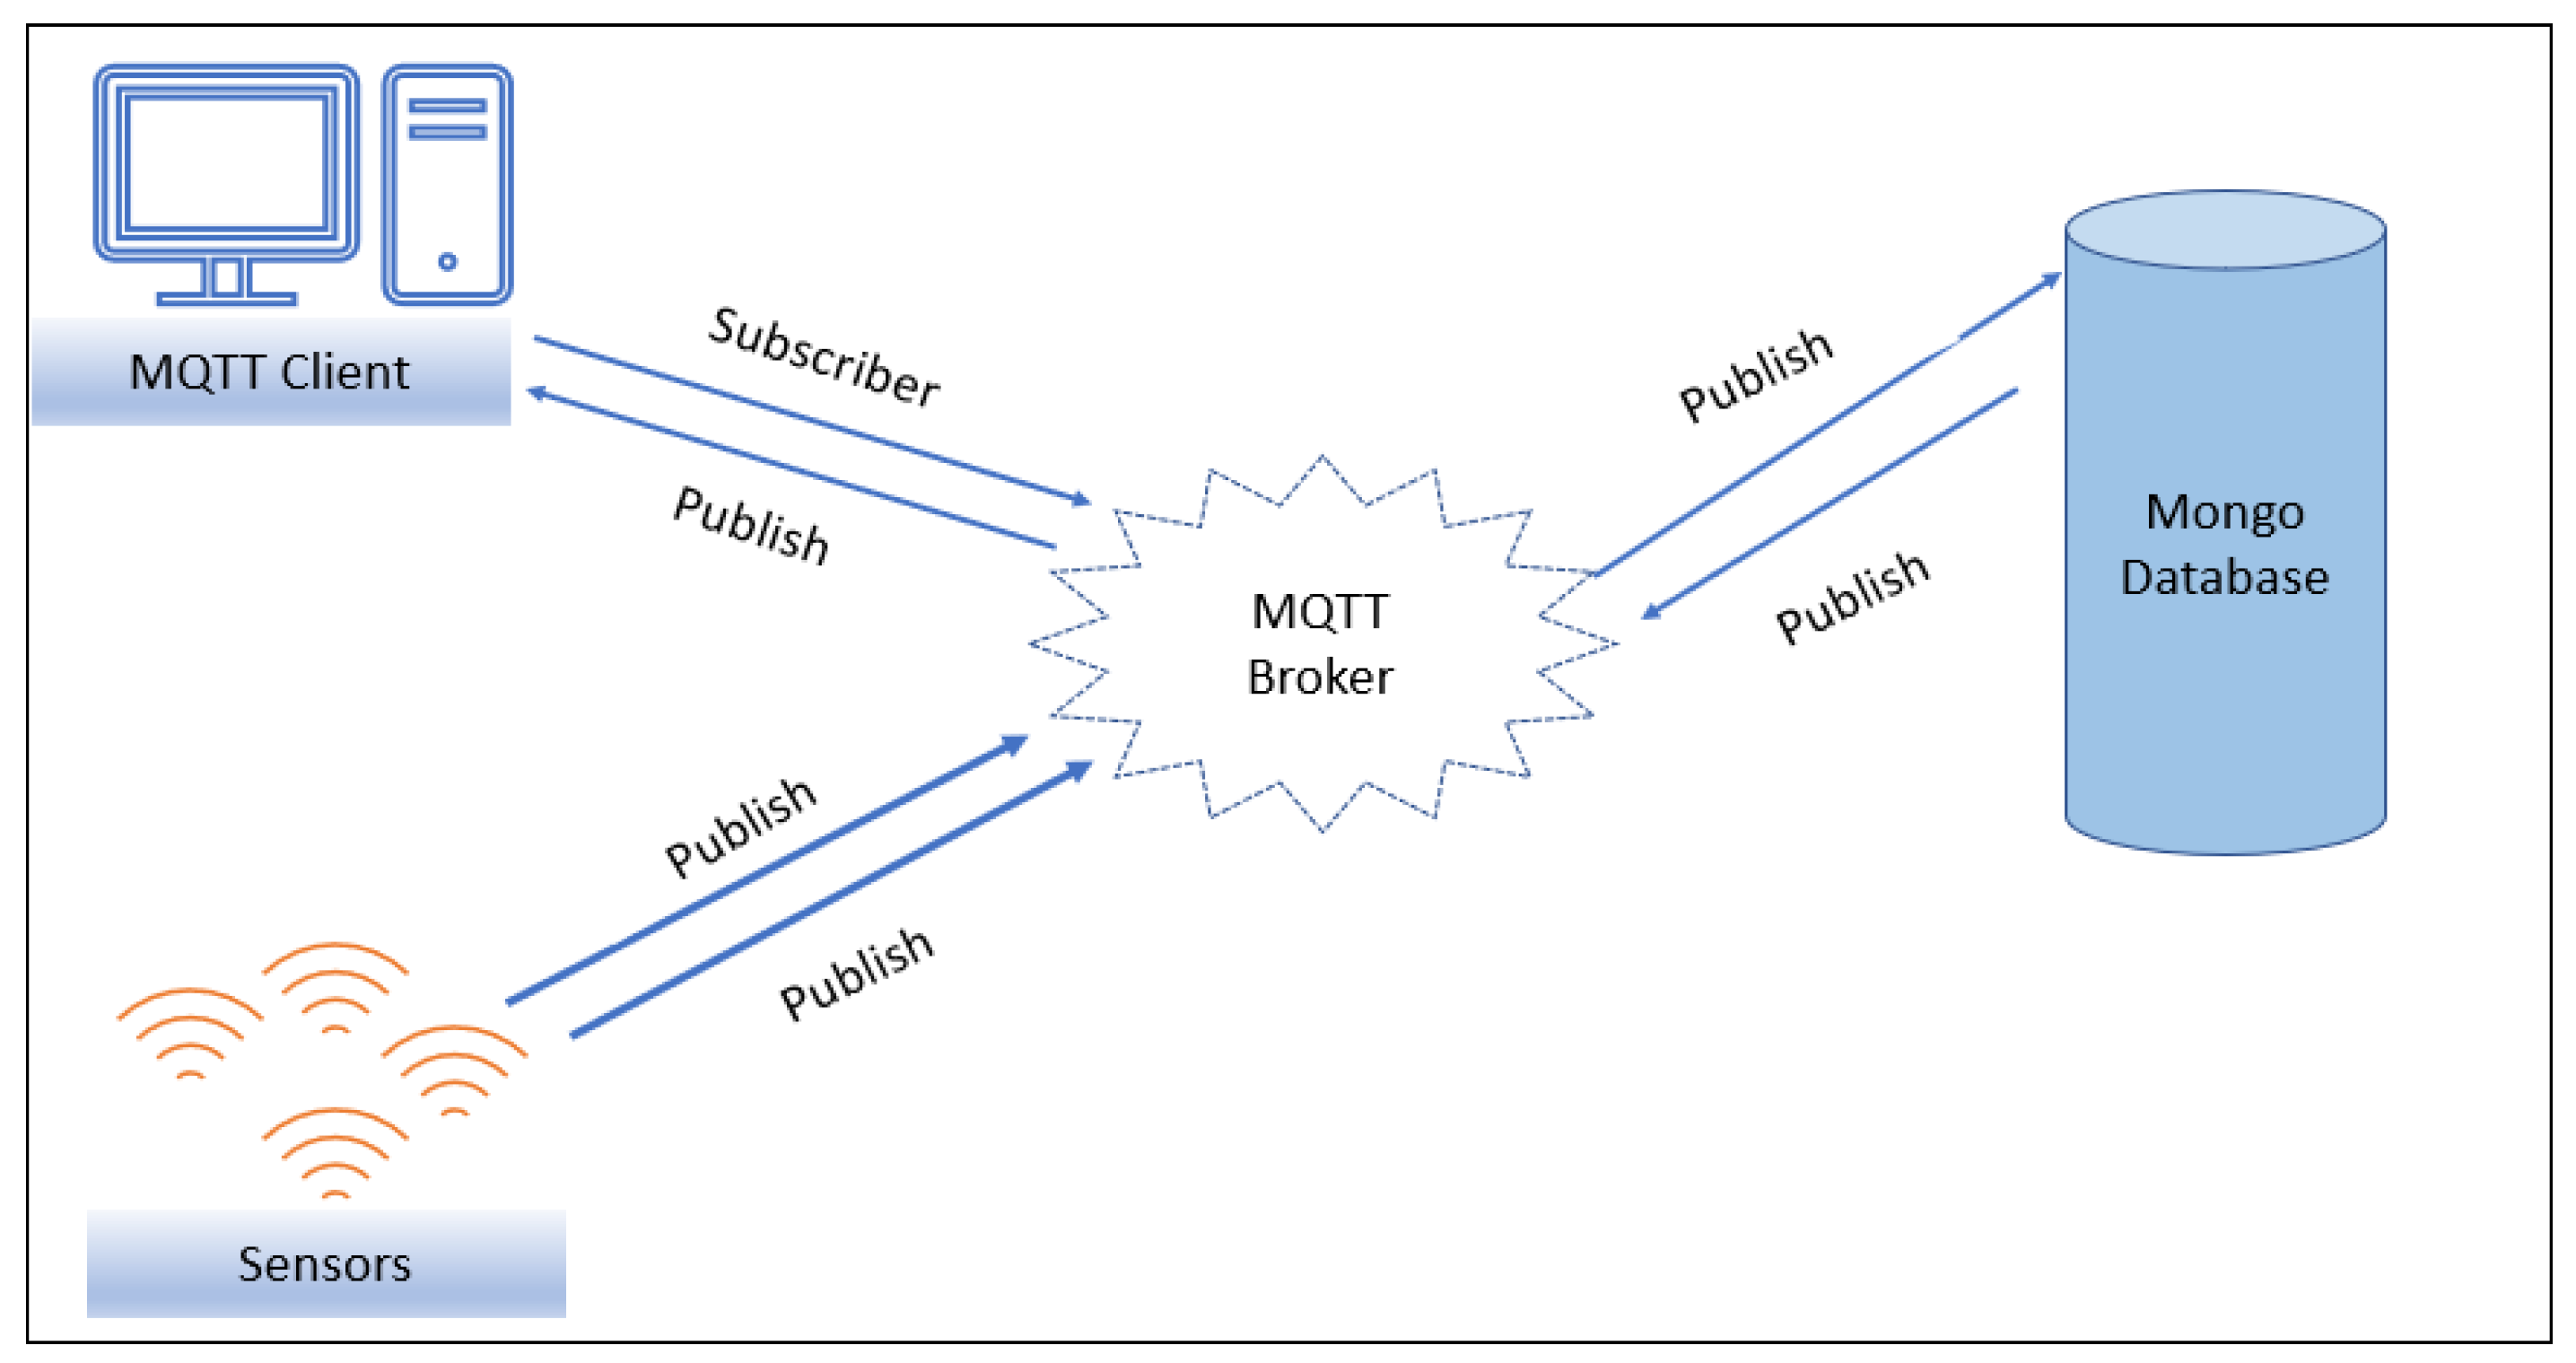
MQTT Protocol
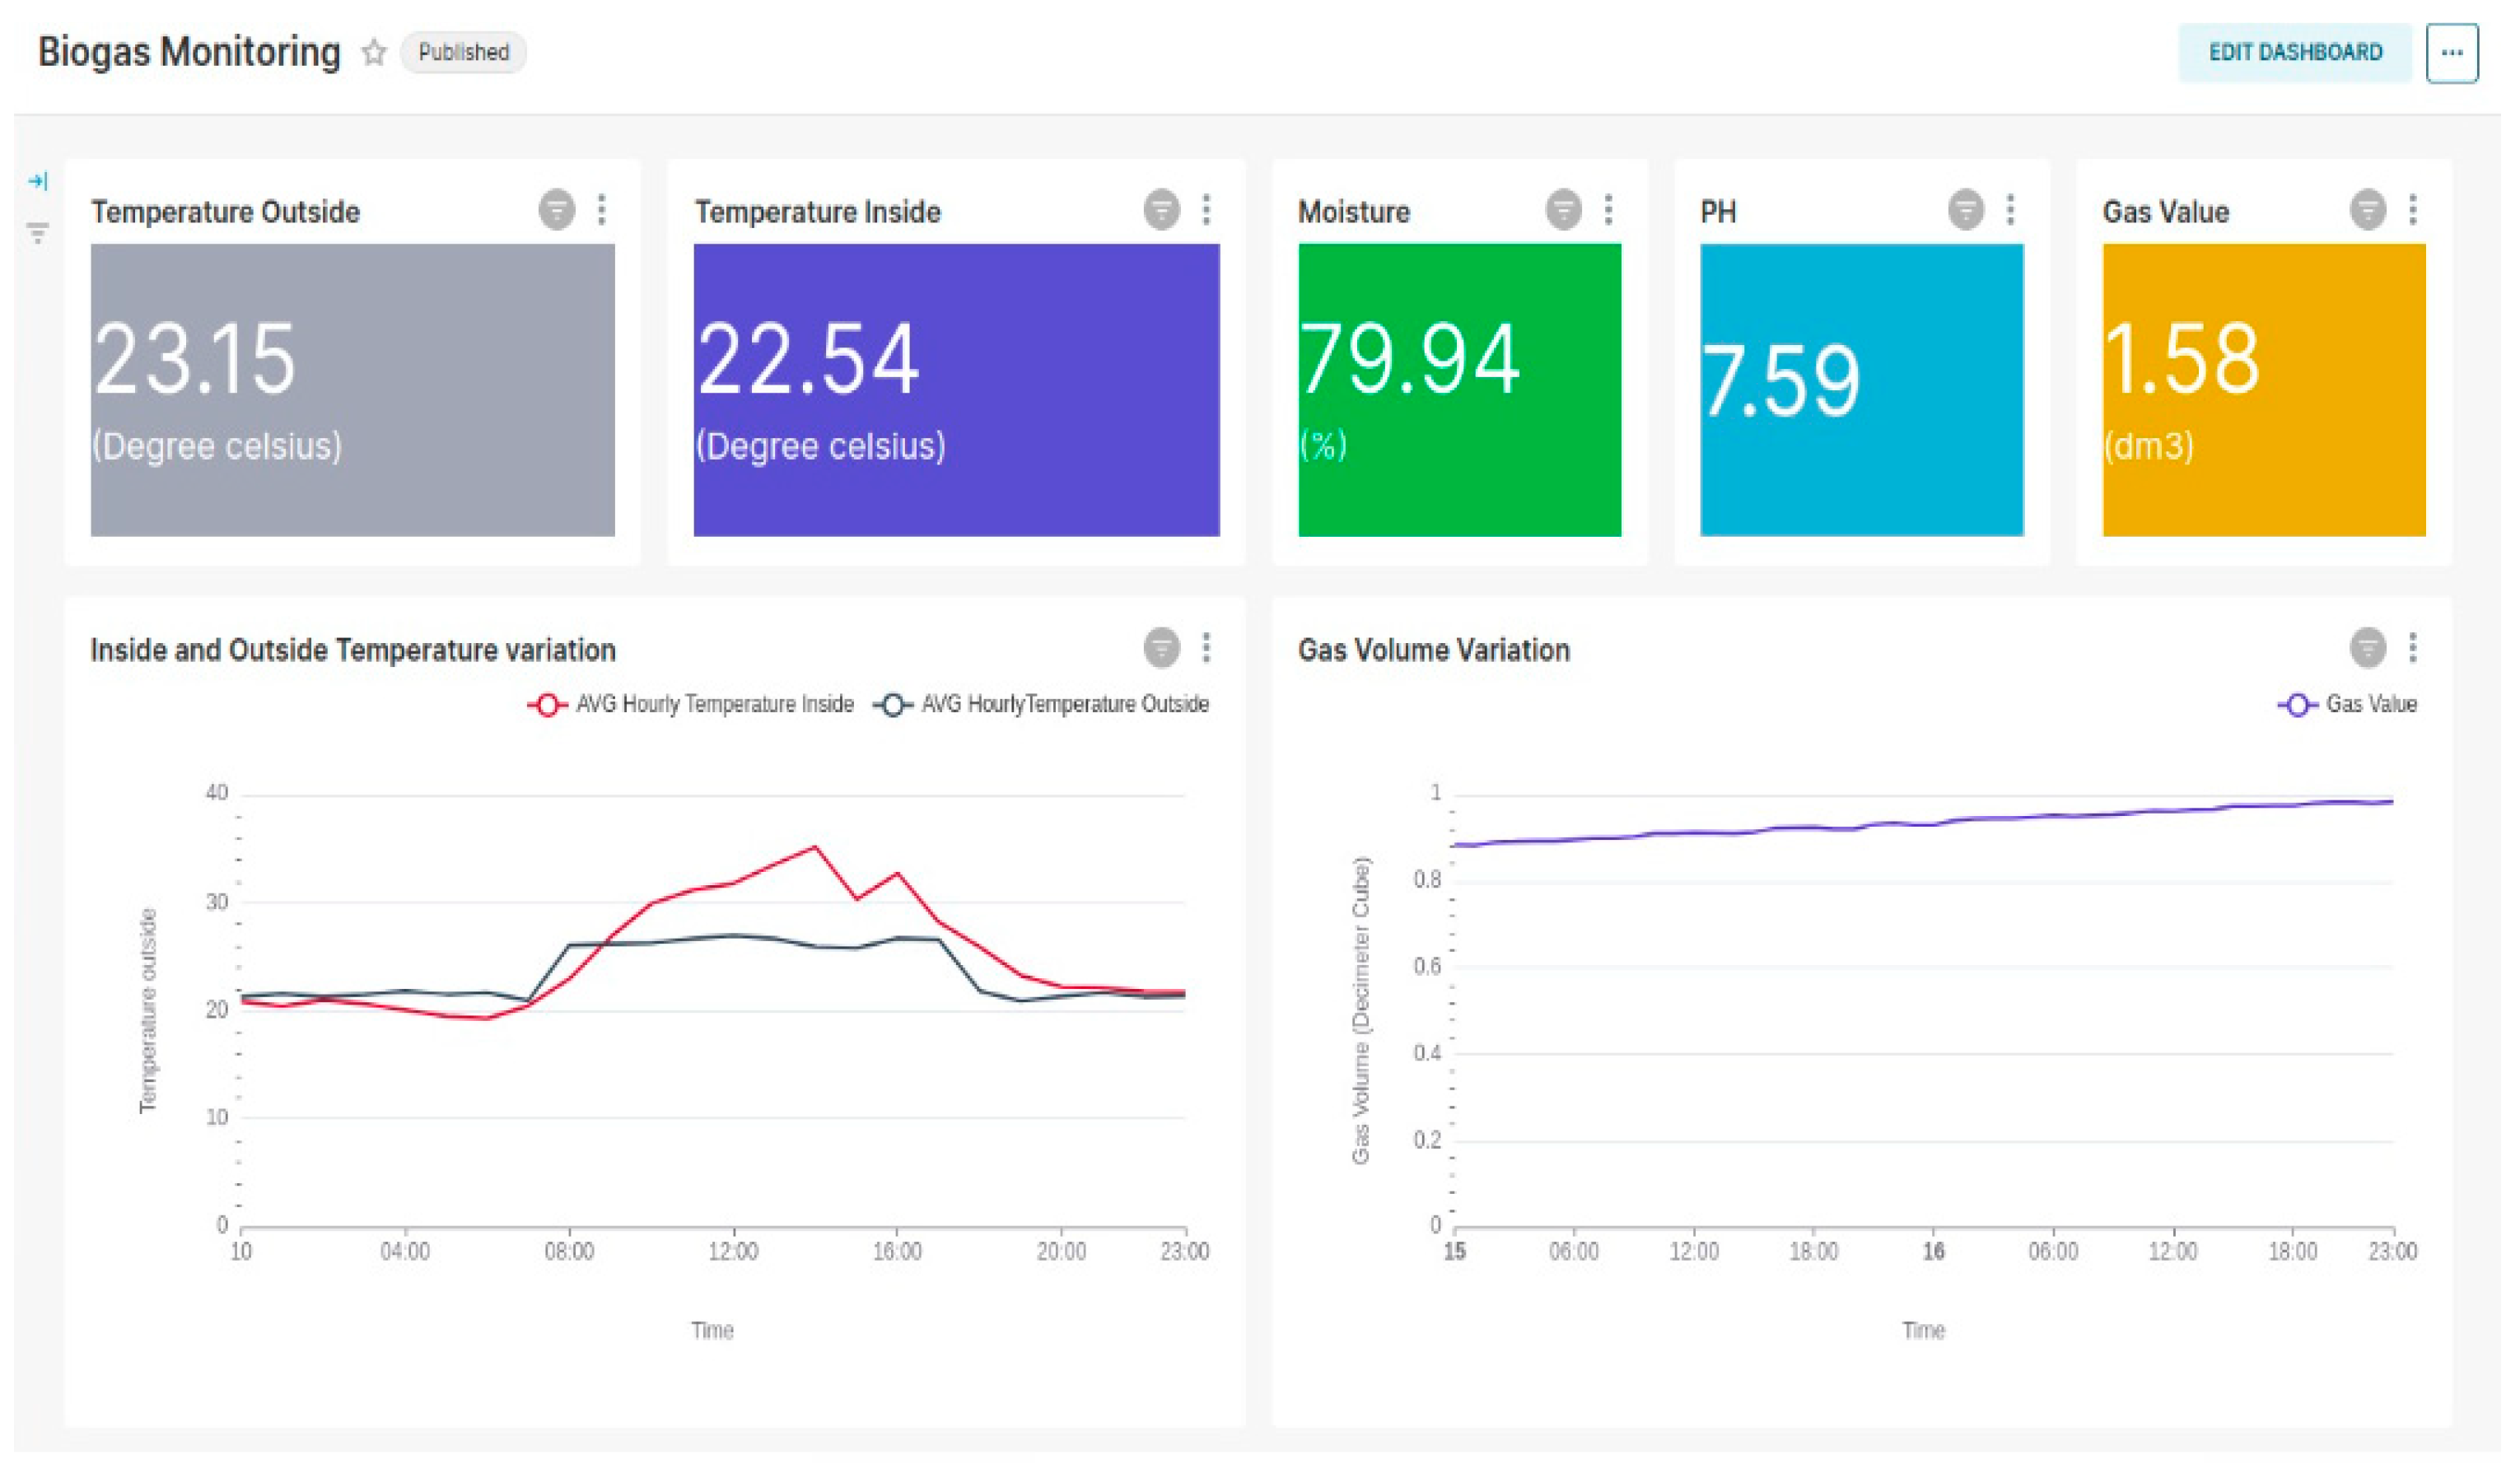
Cloud Web Platform
2.2. Data Acquisition
2.3. Data Pre-Processing
2.4. Data Analysis
2.4.1. Multiple Linear Regression Model
2.4.2. Pearson Correlation Coefficient
3. Result
3.1. Model Validation Results
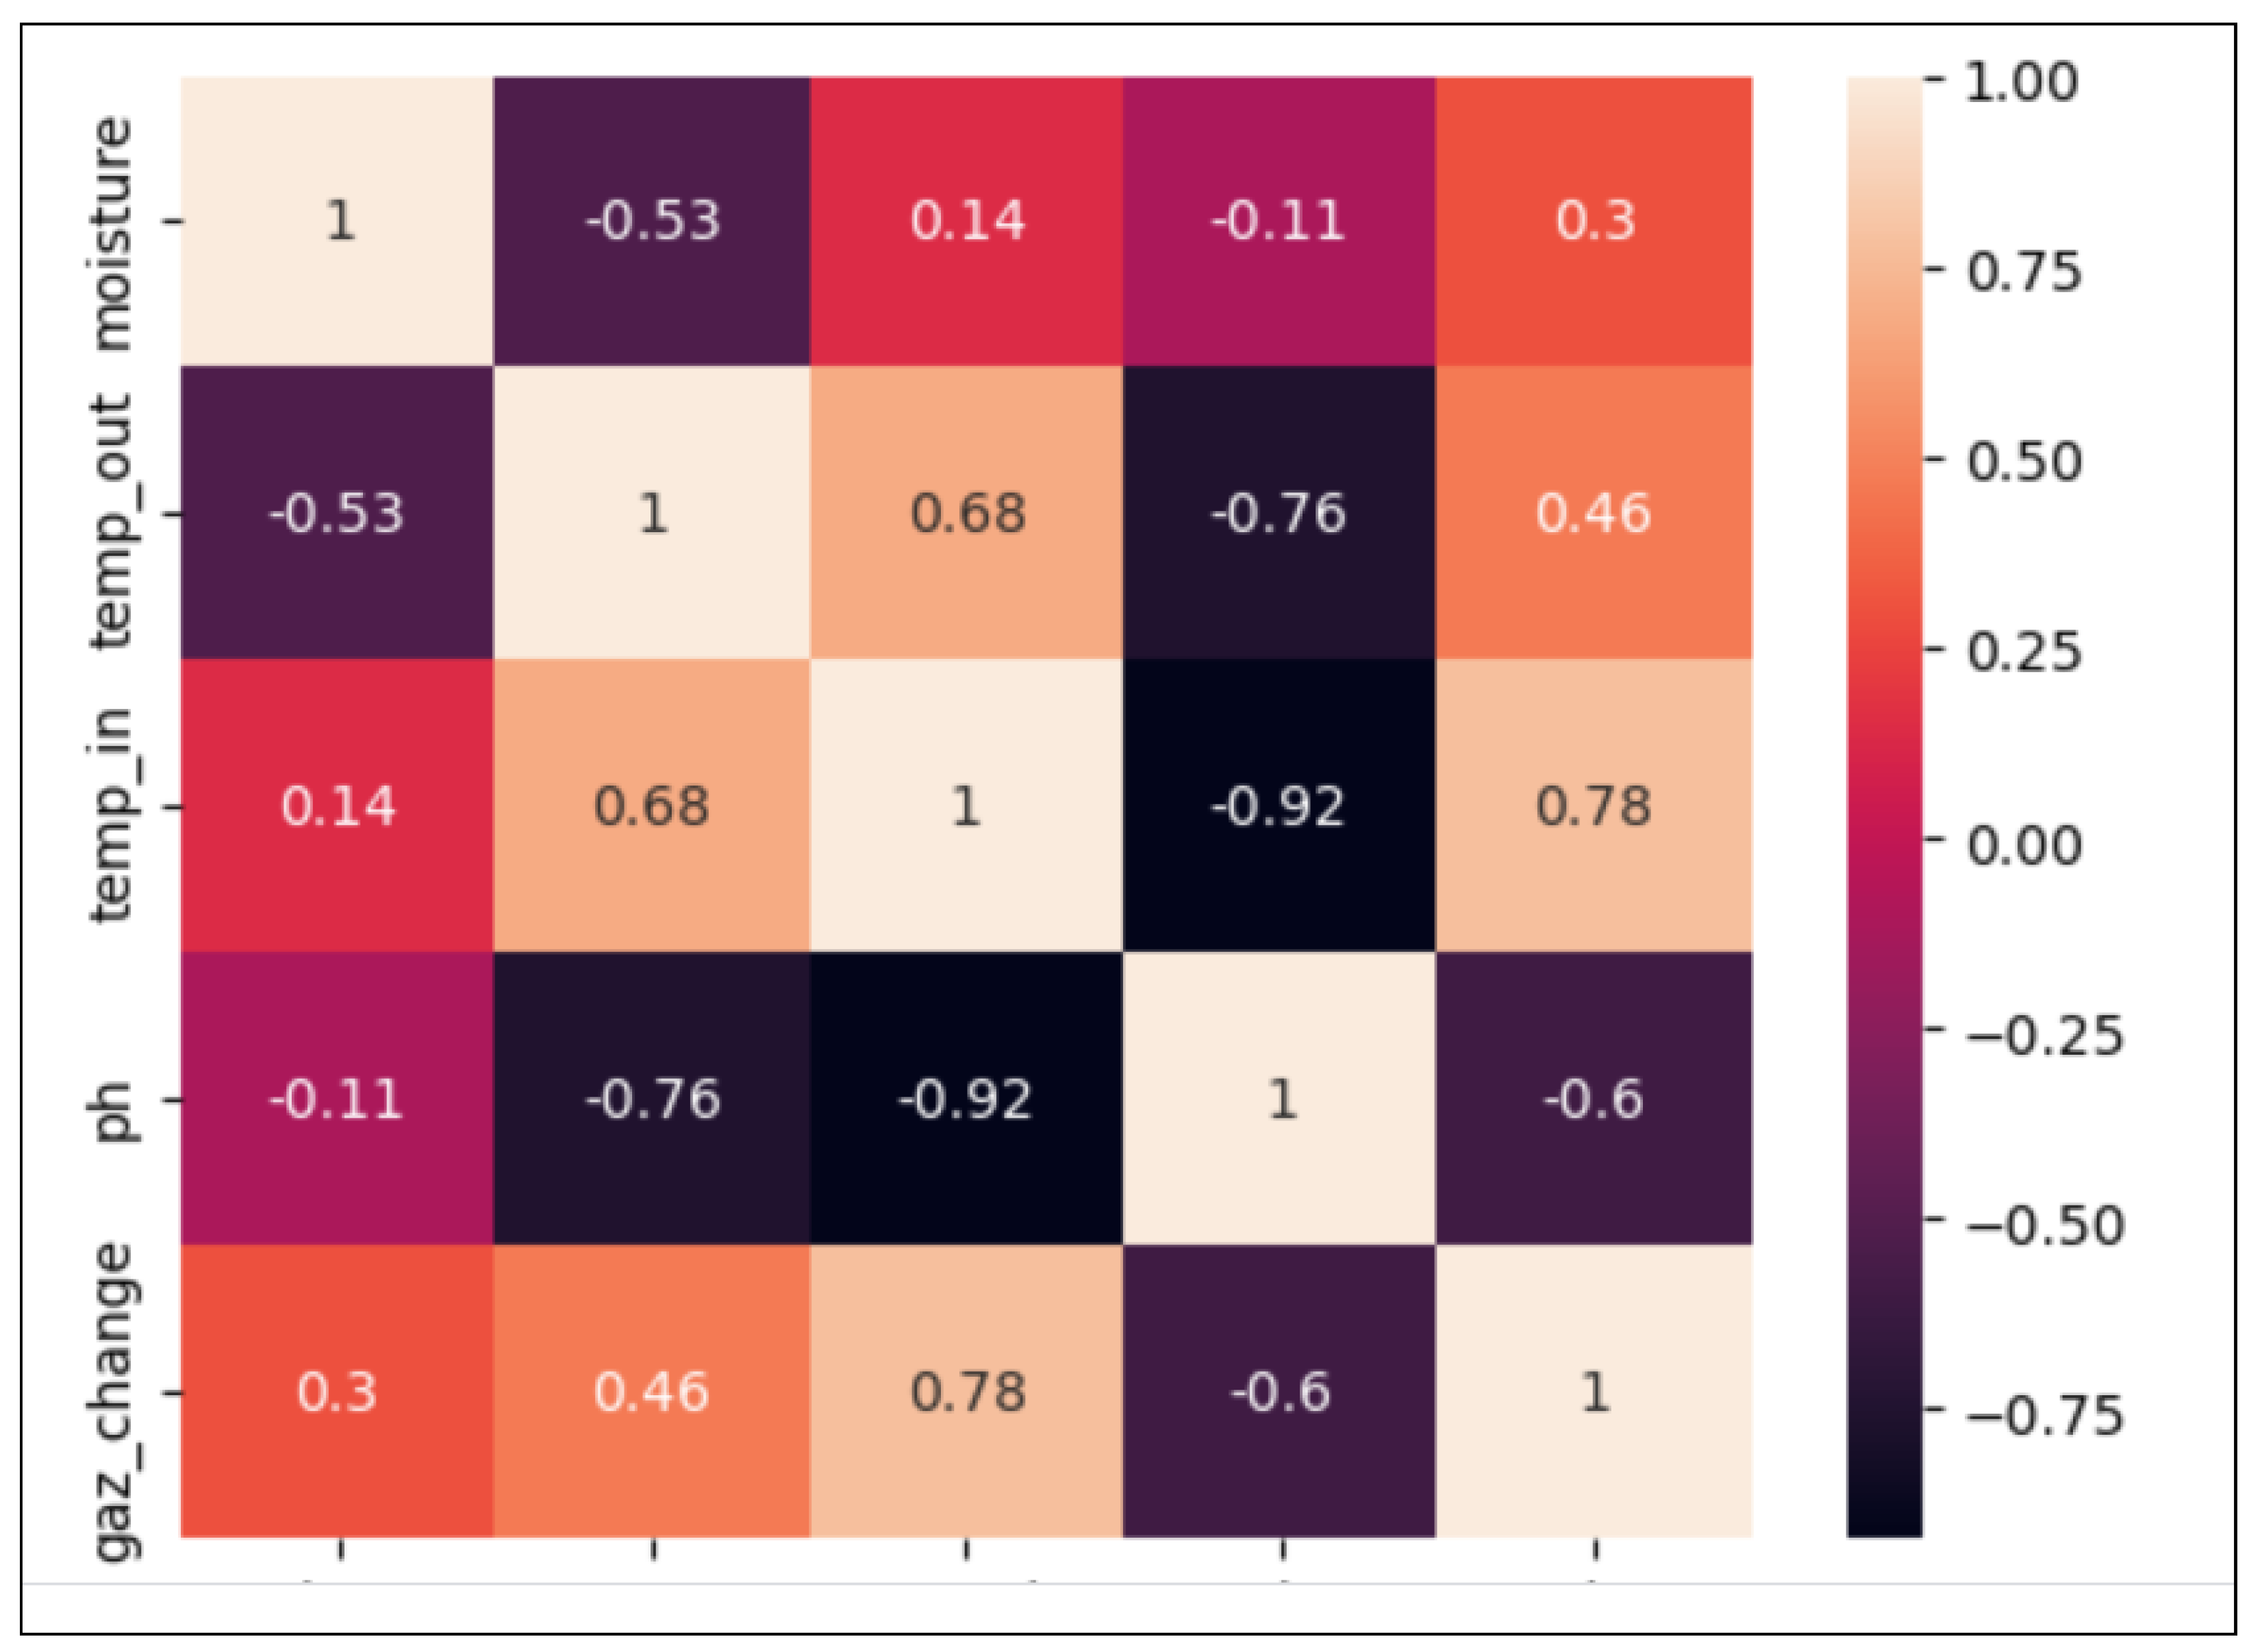
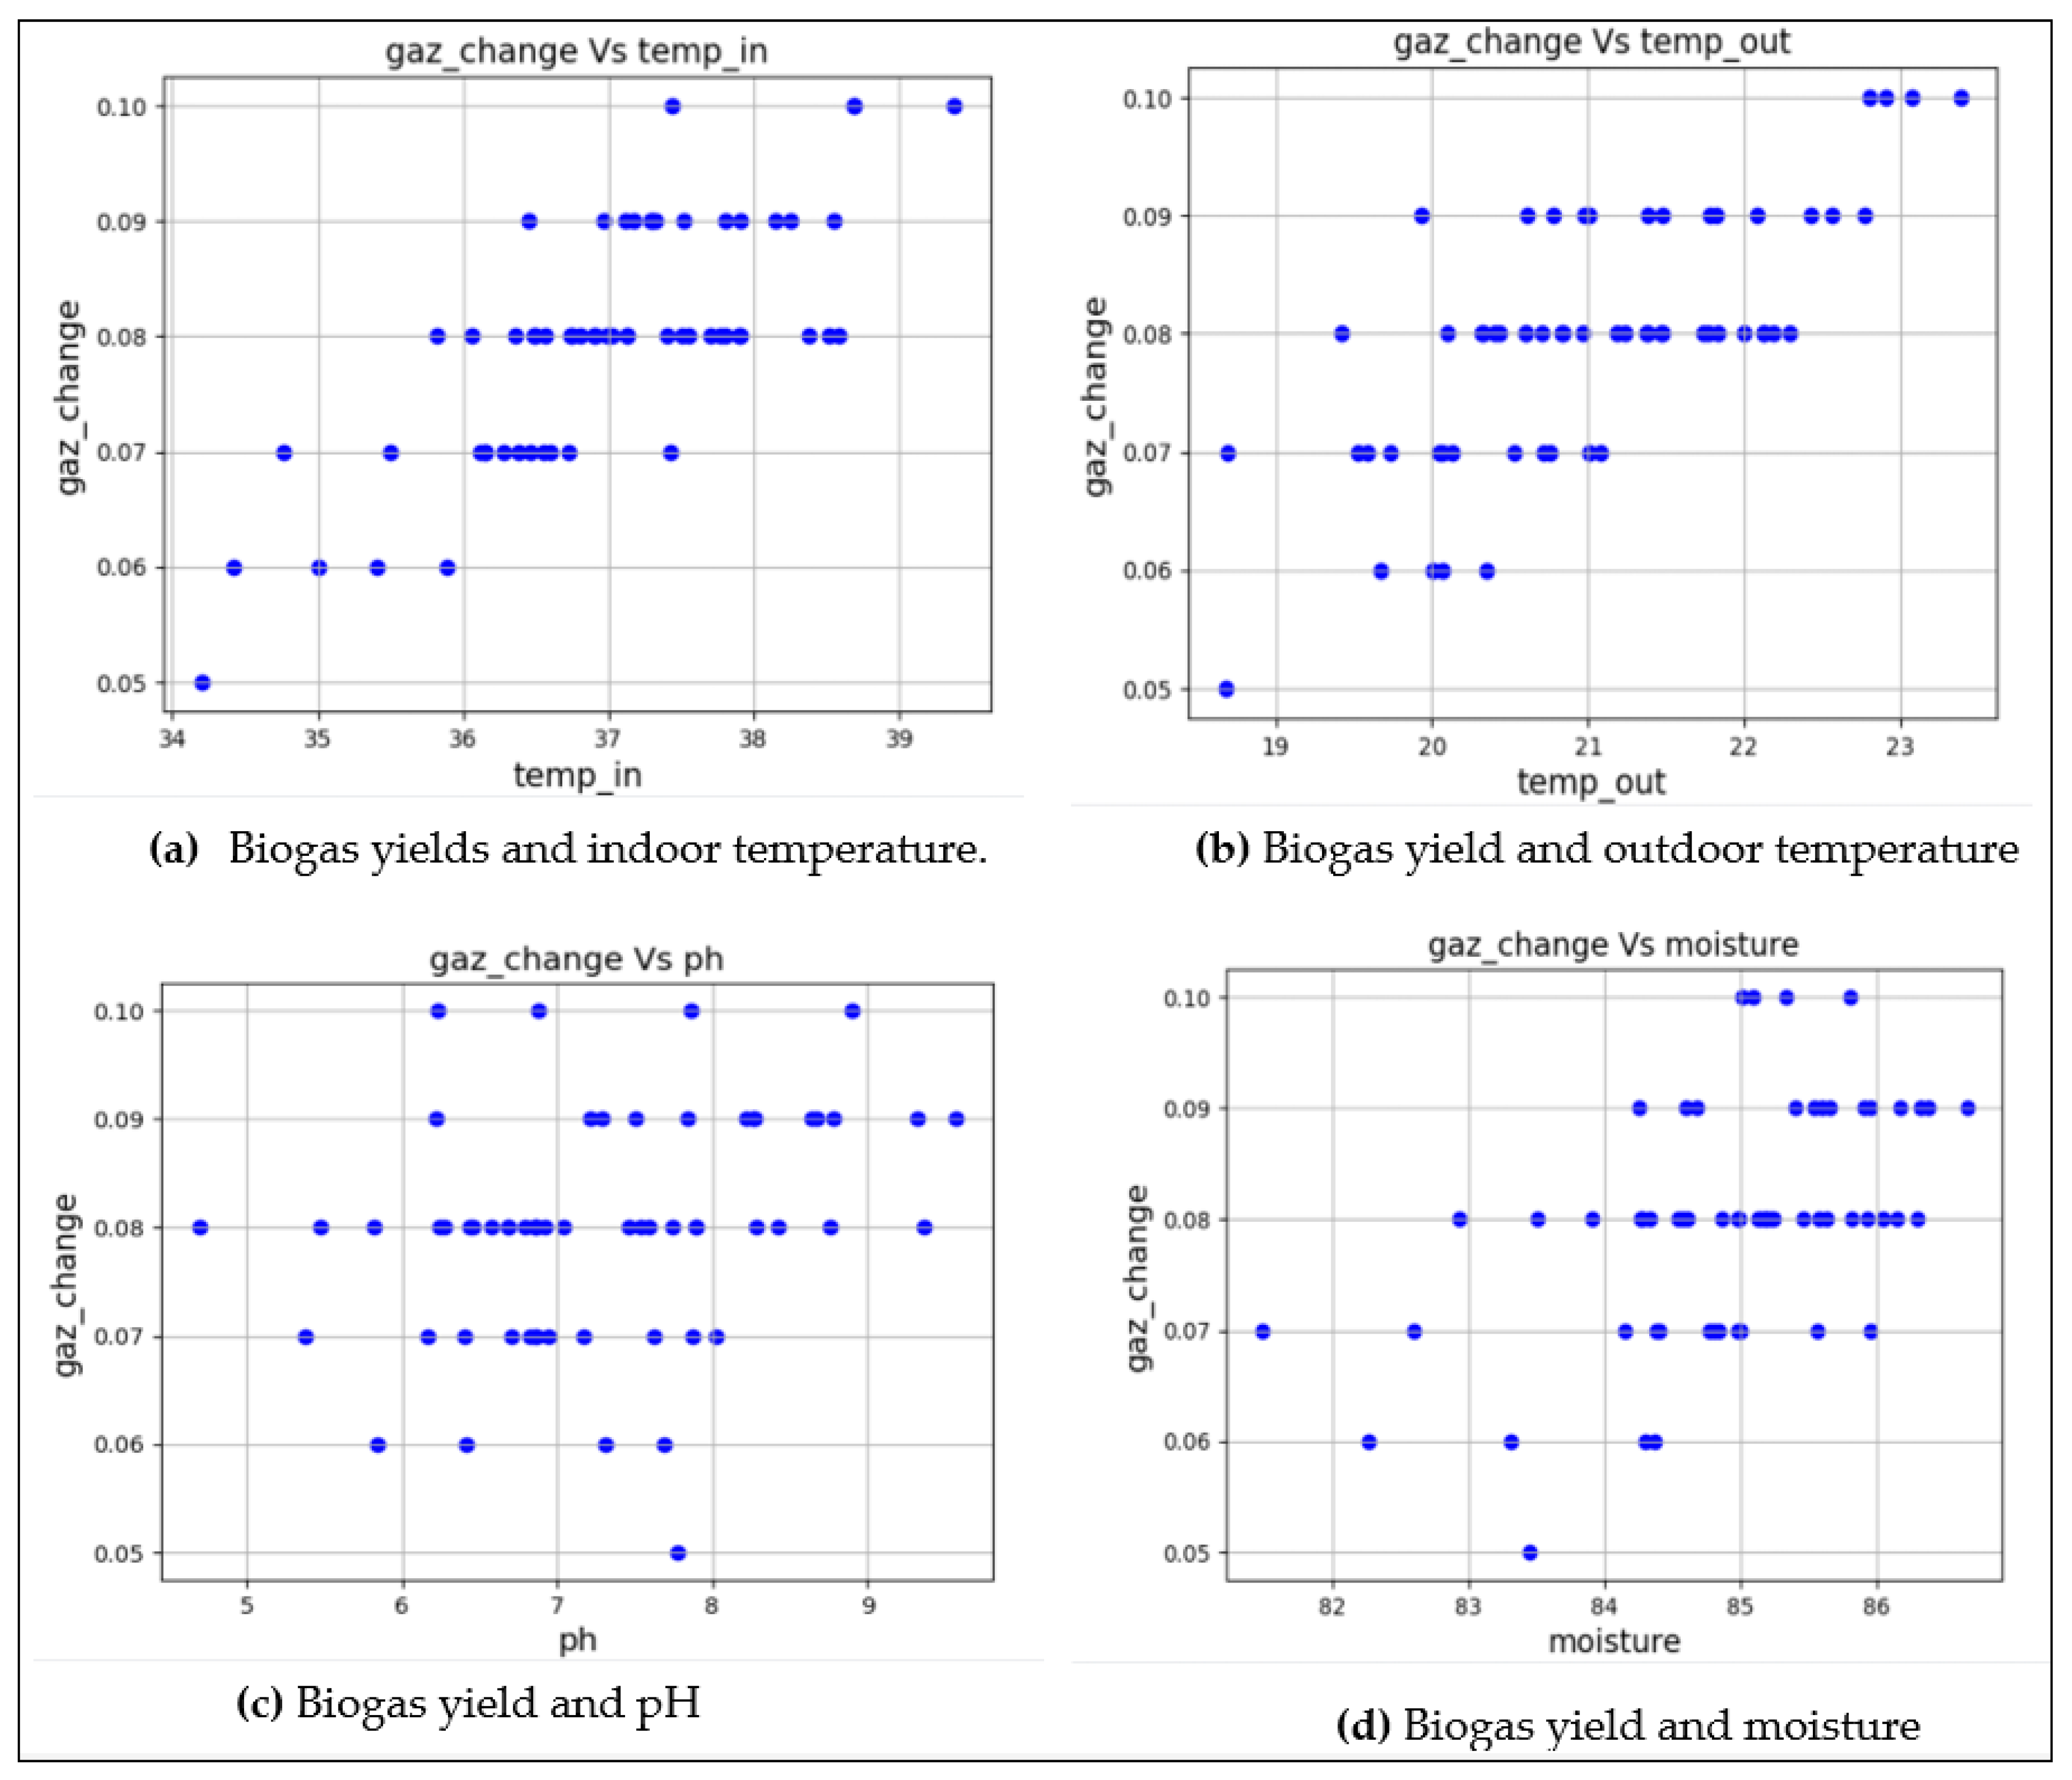
3.2. Correlation Analysis
4. Discussion
Author Contributions
Funding
Institutional Review Board Statement
Informed Consent Statement
Data Availability Statement
Conflicts of Interest
References
- Gielen, D.; Boshell, F.; Saygin, D.; Bazilian, M.D.; Wagner, N.; Gorini, R. The role of renewable energy in the global energy transformation. Energy Strategy Rev. 2019, 24, 38–50. [Google Scholar] [CrossRef]
- Sarker, S.A.; Wang, S.; Adnan, K.M.M.; Sattar, M.N. Economic feasibility and determinants of biogas technology adoption: Evidence from Bangladesh. Renew. Sustain. Energy Rev. 2020, 123, 109766. [Google Scholar] [CrossRef]
- Inglesi-Lotz, R.; Dogan, E. The role of renewable versus non-renewable energy to the level of CO2 emissions a panel analysis of sub-Saharan Africa’s Βig 10 electricity generators. Renew. Energy 2018, 123, 36–43. [Google Scholar] [CrossRef]
- Khoie, R.; Ugale, K.; Benefield, J. Renewable resources of the northern half of the United States: Potential for 100% renewable electricity. Clean Technol. Env. Policy 2019, 21, 1809–1827. [Google Scholar] [CrossRef]
- Africa Energy Outlook 2019—Analysis—IEA. Available online: https://www.iea.org/reports/africa-energy-outlook-2019 (accessed on 13 April 2023).
- Press, E. NDCs in 2020: Advancing Renewables in the Power Sector and Beyond. 2019. Available online: www.irena.org (accessed on 14 January 2023.).
- Bharathiraja, B.; Sudharsana, T.; Jayamuthunagai, J.; Praveenkumar, R.; Chozhavendhan, S.; Iyyappan, J. RETRACTED: Biogas production–A review on composition, fuel properties, feedstock and principles of anaerobic digestion. Renew. Sustain. Energy Rev. 2018, 90, 570–582. [Google Scholar] [CrossRef]
- Biogas Composition. Available online: http://www.biogas-renewable-energy.info/biogas_composition.html (accessed on 23 February 2019).
- Special Programs. Available online: https://rab.gov.rw/index.php?id=134 (accessed on 27 April 2023).
- Onwosi, C.O.; Ozoegwu, C.G.; Nwagu, T.N.; Nwobodo, T.N.; Eke, I.E.; Igbokwe, V.C.; Ugwuoji, E.T.; Ugwuodo, C.J. Cattle manure as a sustainable bioenergy source: Prospects and environmental impacts of its utilization as a major feedstock in Nigeria. Bioresour. Technol. Rep. 2022, 19, 101151. [Google Scholar] [CrossRef]
- Namahoro, J.P.; Wu, Q.; Xiao, H.; Zhou, N. The asymmetric nexus of renewable energy consumption and economic growth: New evidence from Rwanda. Renew. Energy 2021, 174, 336–346. [Google Scholar] [CrossRef]
- Hamid, R.G.; Blanchard, R.E. An assessment of biogas as a domestic energy source in rural Kenya: Developing a sustainable business model. Renew. Energy 2018, 121, 368–376. [Google Scholar] [CrossRef]
- Silaen, M.; Taylor, R.; Bößner, S.; Anger-Kraavi, A.; Chewpreecha, U.; Badinotti, A.; Takama, T. Lessons from Bali for small-scale biogas development in Indonesia. Environ. Innov. Soc. Transit. 2020, 35, 445–459. [Google Scholar] [CrossRef]
- Cai, Y.; Janke, L.; Meng, X.; Zheng, Z.; Zhao, X.; Pröter, J.; Schäfer, F. The absolute concentration and bioavailability of trace elements: Two vital parameters affecting anaerobic digestion performance of chicken manure leachate. Bioresour. Technol. 2022, 350, 126909. [Google Scholar] [CrossRef]
- Rocamora, I.; Wagland, S.T.; Villa, R.; Simpson, E.W.; Fernández, O.; Bajón-Fernández, Y. Dry anaerobic digestion of organic waste: A review of operational parameters and their impact on process performance. Bioresour. Technol. 2020, 299, 122681. [Google Scholar] [CrossRef]
- Panigrahi, S.; Dubey, B.K. A critical review on operating parameters and strategies to improve the biogas yield from anaerobic digestion of organic fraction of municipal solid waste. Renew. Energy 2019, 143, 779–797. [Google Scholar] [CrossRef]
- Toutian, V.; Barjenbruch, M.; Unger, T.; Loderer, C.; Remy, C. Effect of temperature on biogas yield increase and formation of refractory COD during thermal hydrolysis of waste activated sludge. Water Res. 2020, 171, 115383. [Google Scholar] [CrossRef] [PubMed]
- Lin, Q.; De Vrieze, J.; Li, C.; Li, J.; Li, J.; Yao, M.; Hedenec, P.; Li, H.; Li, T.; Rui, J.; et al. Temperature regulates deterministic processes and the succession of microbial interactions in anaerobic digestion process. Water Res. 2017, 123, 134–143. [Google Scholar] [CrossRef]
- Abudi, Z.N.; Hu, Z.; Abood, A.R.; Liu, D.; Gao, A. Effects of Alkali Pre-treatment, Total Solid Content, Substrate to Inoculum Ratio, and pH on Biogas Production from Anaerobic Digestion of Mango Leaves. Waste Biomass Valoriz. 2020, 11, 887–897. [Google Scholar] [CrossRef]
- Mao, C.; Feng, Y.; Wang, X.; Ren, G. Review on research achievements of biogas from anaerobic digestion. Renew. Sustain. Energy Rev. 2015, 45, 540–555. [Google Scholar] [CrossRef]
- Zhang, W.; Xu, Y.; Dong, B.; Dai, X. Characterizing the sludge moisture distribution during anaerobic digestion process through various approaches. Sci. Total Environ. 2019, 675, 184–191. [Google Scholar] [CrossRef] [PubMed]
- Artificial Intelligence (AI) in Renewable Energy Market Report 2022–2030. Available online: https://www.precedenceresearch.com/artificial-intelligence-in-renewable-energy-market (accessed on 13 April 2023).
- Barhamgi, M.; Meedeniya, D.A.; Mainetti, L.; Aprile, M.; Mele, E.; Vergallo, R. A Sustainable Approach to Delivering Programmable Peer-to-Peer Offline Payments. Sensors 2023, 23, 1336. [Google Scholar] [CrossRef]
- Hitimana, E.; Bajpai, G.; Musabe, R.; Sibomana, L.; Kayalvizhi, J. Implementation of iot framework with data analysis using deep learning methods for occupancy prediction in a building. Future Internet 2021, 13, 67. [Google Scholar] [CrossRef]
- Valenzuela, F.; García, A.; Ruiz, E.; Vázquez, M.; Cortez, J.; Espinoza, A. An IoT-based glucose monitoring algorithm to prevent diabetes complications. Appl. Sci. 2020, 10, 921. [Google Scholar] [CrossRef]
- Chaganti, R.; Varadarajan, V.; Gorantla, V.S.; Gadekallu, T.R.; Ravi, V. Blockchain-Based Cloud-Enabled Security Monitoring Using Internet of Things in Smart Agriculture. Future Internet 2022, 14, 250. [Google Scholar] [CrossRef]
- Lyu, W.; Liu, J. Artificial Intelligence and emerging digital technologies in the energy sector. Appl. Energy 2021, 303, 117615. [Google Scholar] [CrossRef]
- Mishra, R.; Naik, B.K.R.; Raut, R.D.; Kumar, M. Internet of Things (IoT) adoption challenges in renewable energy: A case study from a developing economy. J. Clean. Prod. 2022, 371, 133595. [Google Scholar] [CrossRef]
- Logan, M.; Safi, M.; Lens, P.; Visvanathan, C. Investigating the performance of internet of things based anaerobic digestion of food waste. Process Saf. Environ. Prot. 2019, 127, 277–287. [Google Scholar] [CrossRef]
- Cinar, S.; Cinar, S.O.; Wieczorek, N.; Sohoo, I.; Kuchta, K. Integration of artificial intelligence into biogas plant operation. Processes 2021, 9, 85. [Google Scholar] [CrossRef]
- Abdurrahman, A.H.; Kirom, M.R.; Suhendi, A. Biogas Production Volume Measurement and Internet of Things based Monitoring System. In Proceedings of the 2020 IEEE International Conference on Communication, Networks and Satellite, Comnetsat 2020, Batam, Indonesia, 17–18 December 2020; pp. 213–217. [Google Scholar] [CrossRef]
- Aguida, M.A.; Ouchani, S.; Benmalek, M. An IoT-based Framework for an Optimal Monitoring and Control of Cyber-Physical Systems: Application on Biogas Production System. In Proceedings of the 11th International Conference on the Internet of Things, ACM International Conference Proceeding Series, St. Gallen, Switzerland, 8–12 November 2021; pp. 143–149. [Google Scholar] [CrossRef]
- Ilangovan, P.; Begum, M.S.; Srividhya, P.K. Development of online monitoring device and performance evaluation of biogas plants using enhanced methane prediction algorithm (EMPA). Sustain. Energy Technol. Assess. 2023, 56, 103041. [Google Scholar] [CrossRef]
- Pandian, I.; Begum, S.; Kumaravel, S.P. An integrated IoT and fuzzy logic controller system for biogas digester to predict methane generation. Environ. Dev. Sustain. 2021, 1–13. [Google Scholar] [CrossRef]
- Sha, K.; Yang, T.A.; Wei, W.; Davari, S. A survey of edge computing-based designs for IoT security. Digit. Commun. Netw. 2020, 6, 195–202. [Google Scholar] [CrossRef]
- The Republic of Rwanda Agricultural Household Survey 2020 Report. 2021. Available online: https://www.statistics.gov.rw/publication/agricultural-household-survey-2020 (accessed on 13 March 2023).
- Rwamagana, Rwanda—Climate & Monthly Weather Forecast. Available online: https://www.weather-atlas.com/en/rwanda/rwamagana-climate#temperature (accessed on 29 March 2023).
- Győrödi, C.A.; Dumşe-Burescu, D.V.; Zmaranda, D.R.; Győrödi, R. A Comparative Study of MongoDB and Document-Based MySQL for Big Data Application Data Management. Big Data Cogn. Comput. 2022, 6, 49. [Google Scholar] [CrossRef]
- MongoDB Documentation. Available online: https://www.mongodb.com/docs/ (accessed on 30 March 2023).
- The Easy-to-Understand Guide to MQTT Protocol|EMQ. Available online: https://www.emqx.com/en/mqtt (accessed on 30 March 2023).
- Dammak, B.; Turki, M.; Cheikhrouhou, S.; Baklouti, M.; Mars, R.; Dhahbi, A. LoRaChainCare: An IoT Architecture Integrating Blockchain and LoRa Network for Personal Health Care Data Monitoring. Sensors 2022, 22, 1497. [Google Scholar] [CrossRef]
- Alexopoulos, K.; Nikolakis, N.; Xanthakis, E. Digital Transformation of Production Planning and Control in Manufacturing SMEs-The Mold Shop Case. Appl. Sci. 2022, 12, 10788. [Google Scholar] [CrossRef]
- Manowska, A.; Wycisk, A.; Nowrot, A.; Pielot, J. The Use of the MQTT Protocol in Measurement, Monitoring and Control Systems as Part of the Implementation of Energy Management Systems. Electronics 2022, 12, 17. [Google Scholar] [CrossRef]
- Hue, A.; Sharma, G.; Dricot, J.M. Privacy-Enhanced MQTT Protocol for Massive IoT. Electronics 2021, 11, 70. [Google Scholar] [CrossRef]
- Kaushal, A.; Shankar, A. House Price Prediction Using Multiple Linear Regression. SSRN Electron. J. 2021. [Google Scholar] [CrossRef]
- Ordinary Least Squares Method: Concepts & Examples—Data Analytics. Available online: https://vitalflux.com/ordinary-least-squares-method-concepts-examples/ (accessed on 9 June 2023).
- Chicco, D.; Warrens, M.J.; Jurman, G. The coefficient of determination R-squared is more informative than SMAPE, MAE, MAPE, MSE and RMSE in regression analysis evaluation. PeerJ Comput. Sci. 2021, 7, e623. [Google Scholar] [CrossRef]
- Atmanspacher, H.; Martin, M. Correlations and How to Interpret Them. Information 2019, 10, 272. [Google Scholar] [CrossRef]


| Component | Description |
|---|---|
| Edger layer | Comprises sensors, the actuator and microcontroller Perform local data analysis for controlling actuators Ensure data security through authentication Perform local data analysis |
| Network layer | Comprises the Wi-Fi module Perform data routing and transmission |
| Cloud layer | Allow permanent data storage Allow public data access High data performance analysis |
| Device | Description |
|---|---|
| DS18b20 OAT-M-24 | Indoor Temperature, Humidity Ambient Temperature |
| 700KPGPN | Gas pressure |
| DIY Ph | pH |
| Capacitive Moisture | Moisture |
| Solderless breadboard | Breadboard |
| Raspberry Pi.3 | Microcontroller |
| Components | Description |
|---|---|
| Sprinkler | Discharge water when the effect of low moisture is detected |
| A thermostatic | Provide heating in the environment when the system notifies |
| Thermal electric | Provide cooling in the environment when the system notifies |
| Non-Function | Functional |
|---|---|
| Scalable design enables fast response | Dashboard for data visualization |
| Security via user authentication | Instant Notification |
| Responsiveness across multiple devices | Data Export capabilities |
| Moisture | Temp_out | Temp_in | pH | Gaz Value | Time-Occur |
|---|---|---|---|---|---|
| 85.24 | 20.32 | 36.90 | 6.86 | 0.08 | 3 January 2023 0:01 |
| 85.95 | 19.59 | 36.60 | 7.62 | 0.07 | 3 January 2023 0:16 |
| 86.04 | 20.96 | 37.77 | 6.27 | 0.08 | 3 January 2023 0:31 |
| 83.31 | 19.67 | 35.00 | 7.31 | 0.06 | 3 January 2023 0:46 |
| 85.18 | 20.33 | 36.50 | 6.24 | 0.08 | 3 January 2023 1:01 |
| Moisture | Temp_out | Temp_in | pH | Gaz Value | Date | Time (12 h) | Time (24 h) | Day_Hour |
|---|---|---|---|---|---|---|---|---|
| 85.24 | 20.32 | 36.90 | 6.86 | 0.08 | 3 January 2023 | 12:01 a.m. | 0:01 | 12.0 |
| 85.95 | 19.59 | 36.60 | 7.62 | 0.07 | 3 January 2023 | 12:16 a.m. | 0:16 | 12.2 |
| 86.04 | 20.96 | 37.77 | 6.27 | 0.08 | 3 January 2023 | 12:31 a.m. | 0:31 | 12.3 |
| 83.31 | 19.67 | 35.00 | 7.31 | 0.06 | 3 January 2023 | 12:46 a.m. | 0:46 | 12.5 |
| 85.18 | 20.33 | 36.50 | 6.24 | 0.08 | 3 January 2023 | 1:01 a.m. | 1:01 | 1.0 |
| Dep. Variable | Gaz-value | R-squared | 0.734 | ||
| Model | OLS | Adj. R-squared: | 0.734 | ||
| Method | Least Squares | F-statistic: | 2066 | ||
| Coef | std err | T | P > |t| | [0.025, 0.975] | |
| Const | −0.3942 | 0.000 | 42.463 | 0.040 | −0.376 |
| Ph | 0.6021 | 0.000 | 19.186 | 0.021 | 0.002 |
| Temp_in | 0.843 | 0.000 | 25.460 | 0.012 | 0.005 |
| Temp_out | 0.526 | 0.000 | 17.903 | 0.032 | 0.003 |
| Moisture | 0.0129 | 0.000 | 20.974 | 0.040 | 0.003 |
Disclaimer/Publisher’s Note: The statements, opinions and data contained in all publications are solely those of the individual author(s) and contributor(s) and not of MDPI and/or the editor(s). MDPI and/or the editor(s) disclaim responsibility for any injury to people or property resulting from any ideas, methods, instructions or products referred to in the content. |
© 2023 by the authors. Licensee MDPI, Basel, Switzerland. This article is an open access article distributed under the terms and conditions of the Creative Commons Attribution (CC BY) license (https://creativecommons.org/licenses/by/4.0/).
Share and Cite
Mukasine, A.; Sibomana, L.; Jayavel, K.; Nkurikiyeyezu, K.; Hitimana, E. Correlation Analysis Model of Environment Parameters Using IoT Framework in a Biogas Energy Generation Context. Future Internet 2023, 15, 265. https://doi.org/10.3390/fi15080265
Mukasine A, Sibomana L, Jayavel K, Nkurikiyeyezu K, Hitimana E. Correlation Analysis Model of Environment Parameters Using IoT Framework in a Biogas Energy Generation Context. Future Internet. 2023; 15(8):265. https://doi.org/10.3390/fi15080265
Chicago/Turabian StyleMukasine, Angelique, Louis Sibomana, Kayalvizhi Jayavel, Kizito Nkurikiyeyezu, and Eric Hitimana. 2023. "Correlation Analysis Model of Environment Parameters Using IoT Framework in a Biogas Energy Generation Context" Future Internet 15, no. 8: 265. https://doi.org/10.3390/fi15080265
APA StyleMukasine, A., Sibomana, L., Jayavel, K., Nkurikiyeyezu, K., & Hitimana, E. (2023). Correlation Analysis Model of Environment Parameters Using IoT Framework in a Biogas Energy Generation Context. Future Internet, 15(8), 265. https://doi.org/10.3390/fi15080265