


A Comprehensive Analysis and Investigation of the Public Discourse on Twitter about Exoskeletons from 2017 to 2023

 ,
,
Abstract
:1. Introduction
1.1. An Overview of Twitter: A Globally Popular Social Media Platform
1.2. Exoskeleton Technology and Its Emergence: A Brief Overview
2. Literature Review
2.1. Review of Analysis of Tweets Focusing on Different Industries and Interdisciplinary Research
2.2. Review of Analysis of Tweets Focusing on Robotics and Wearable Robotics-Based Technologies
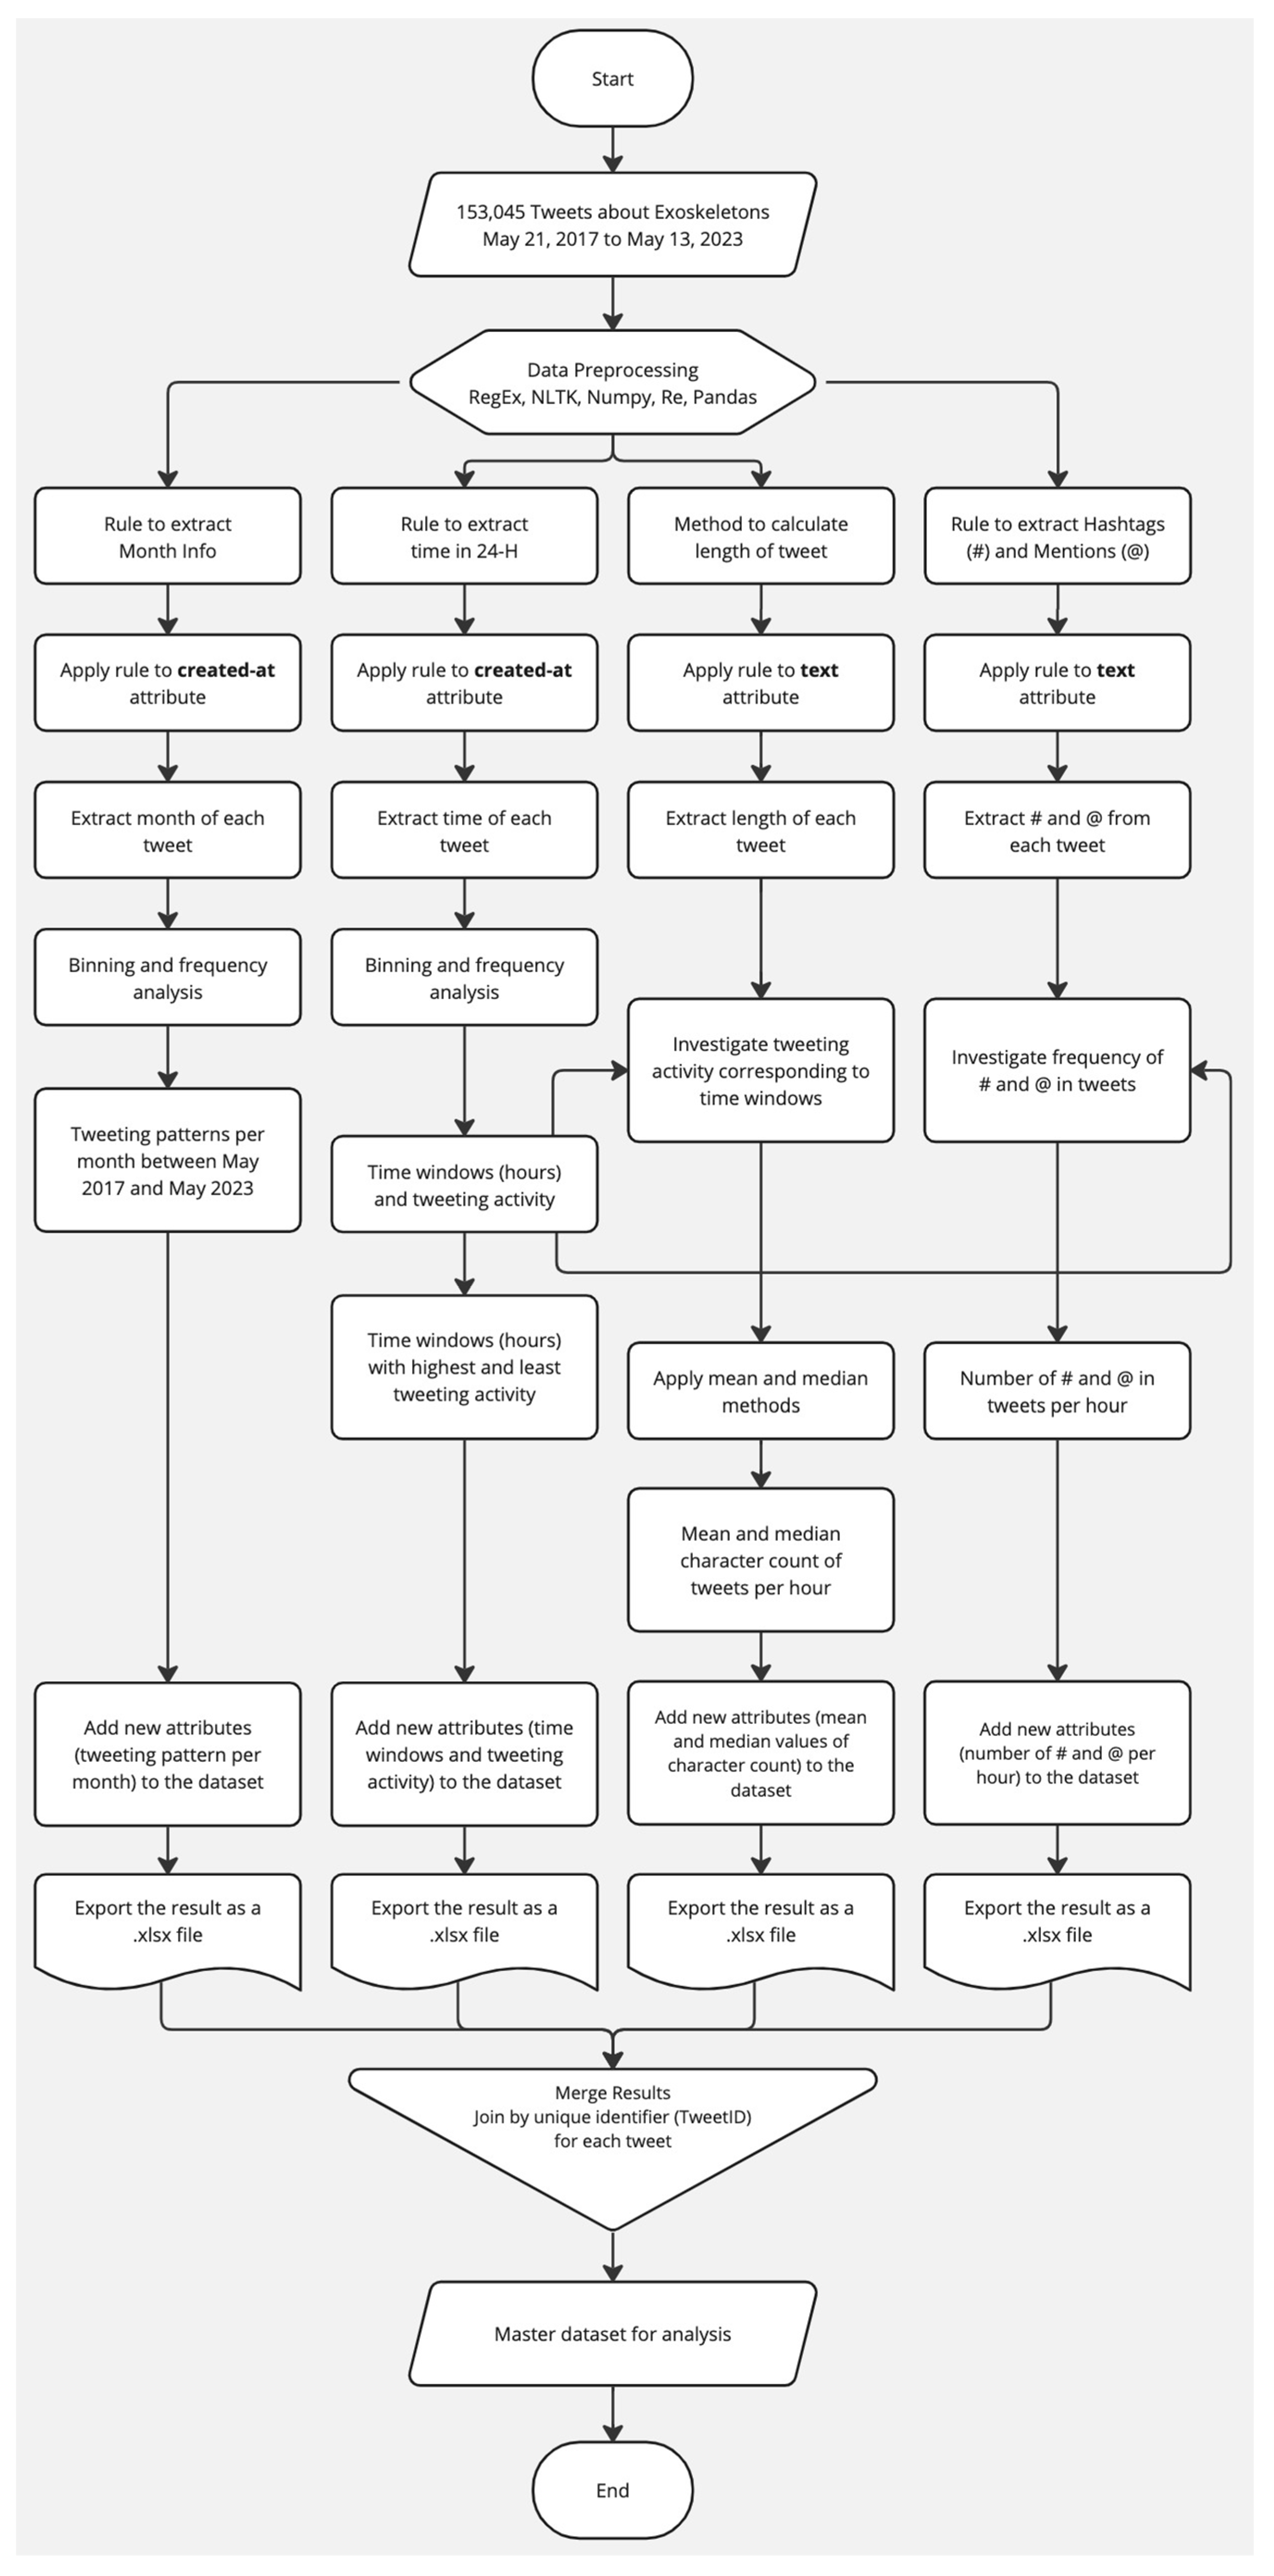
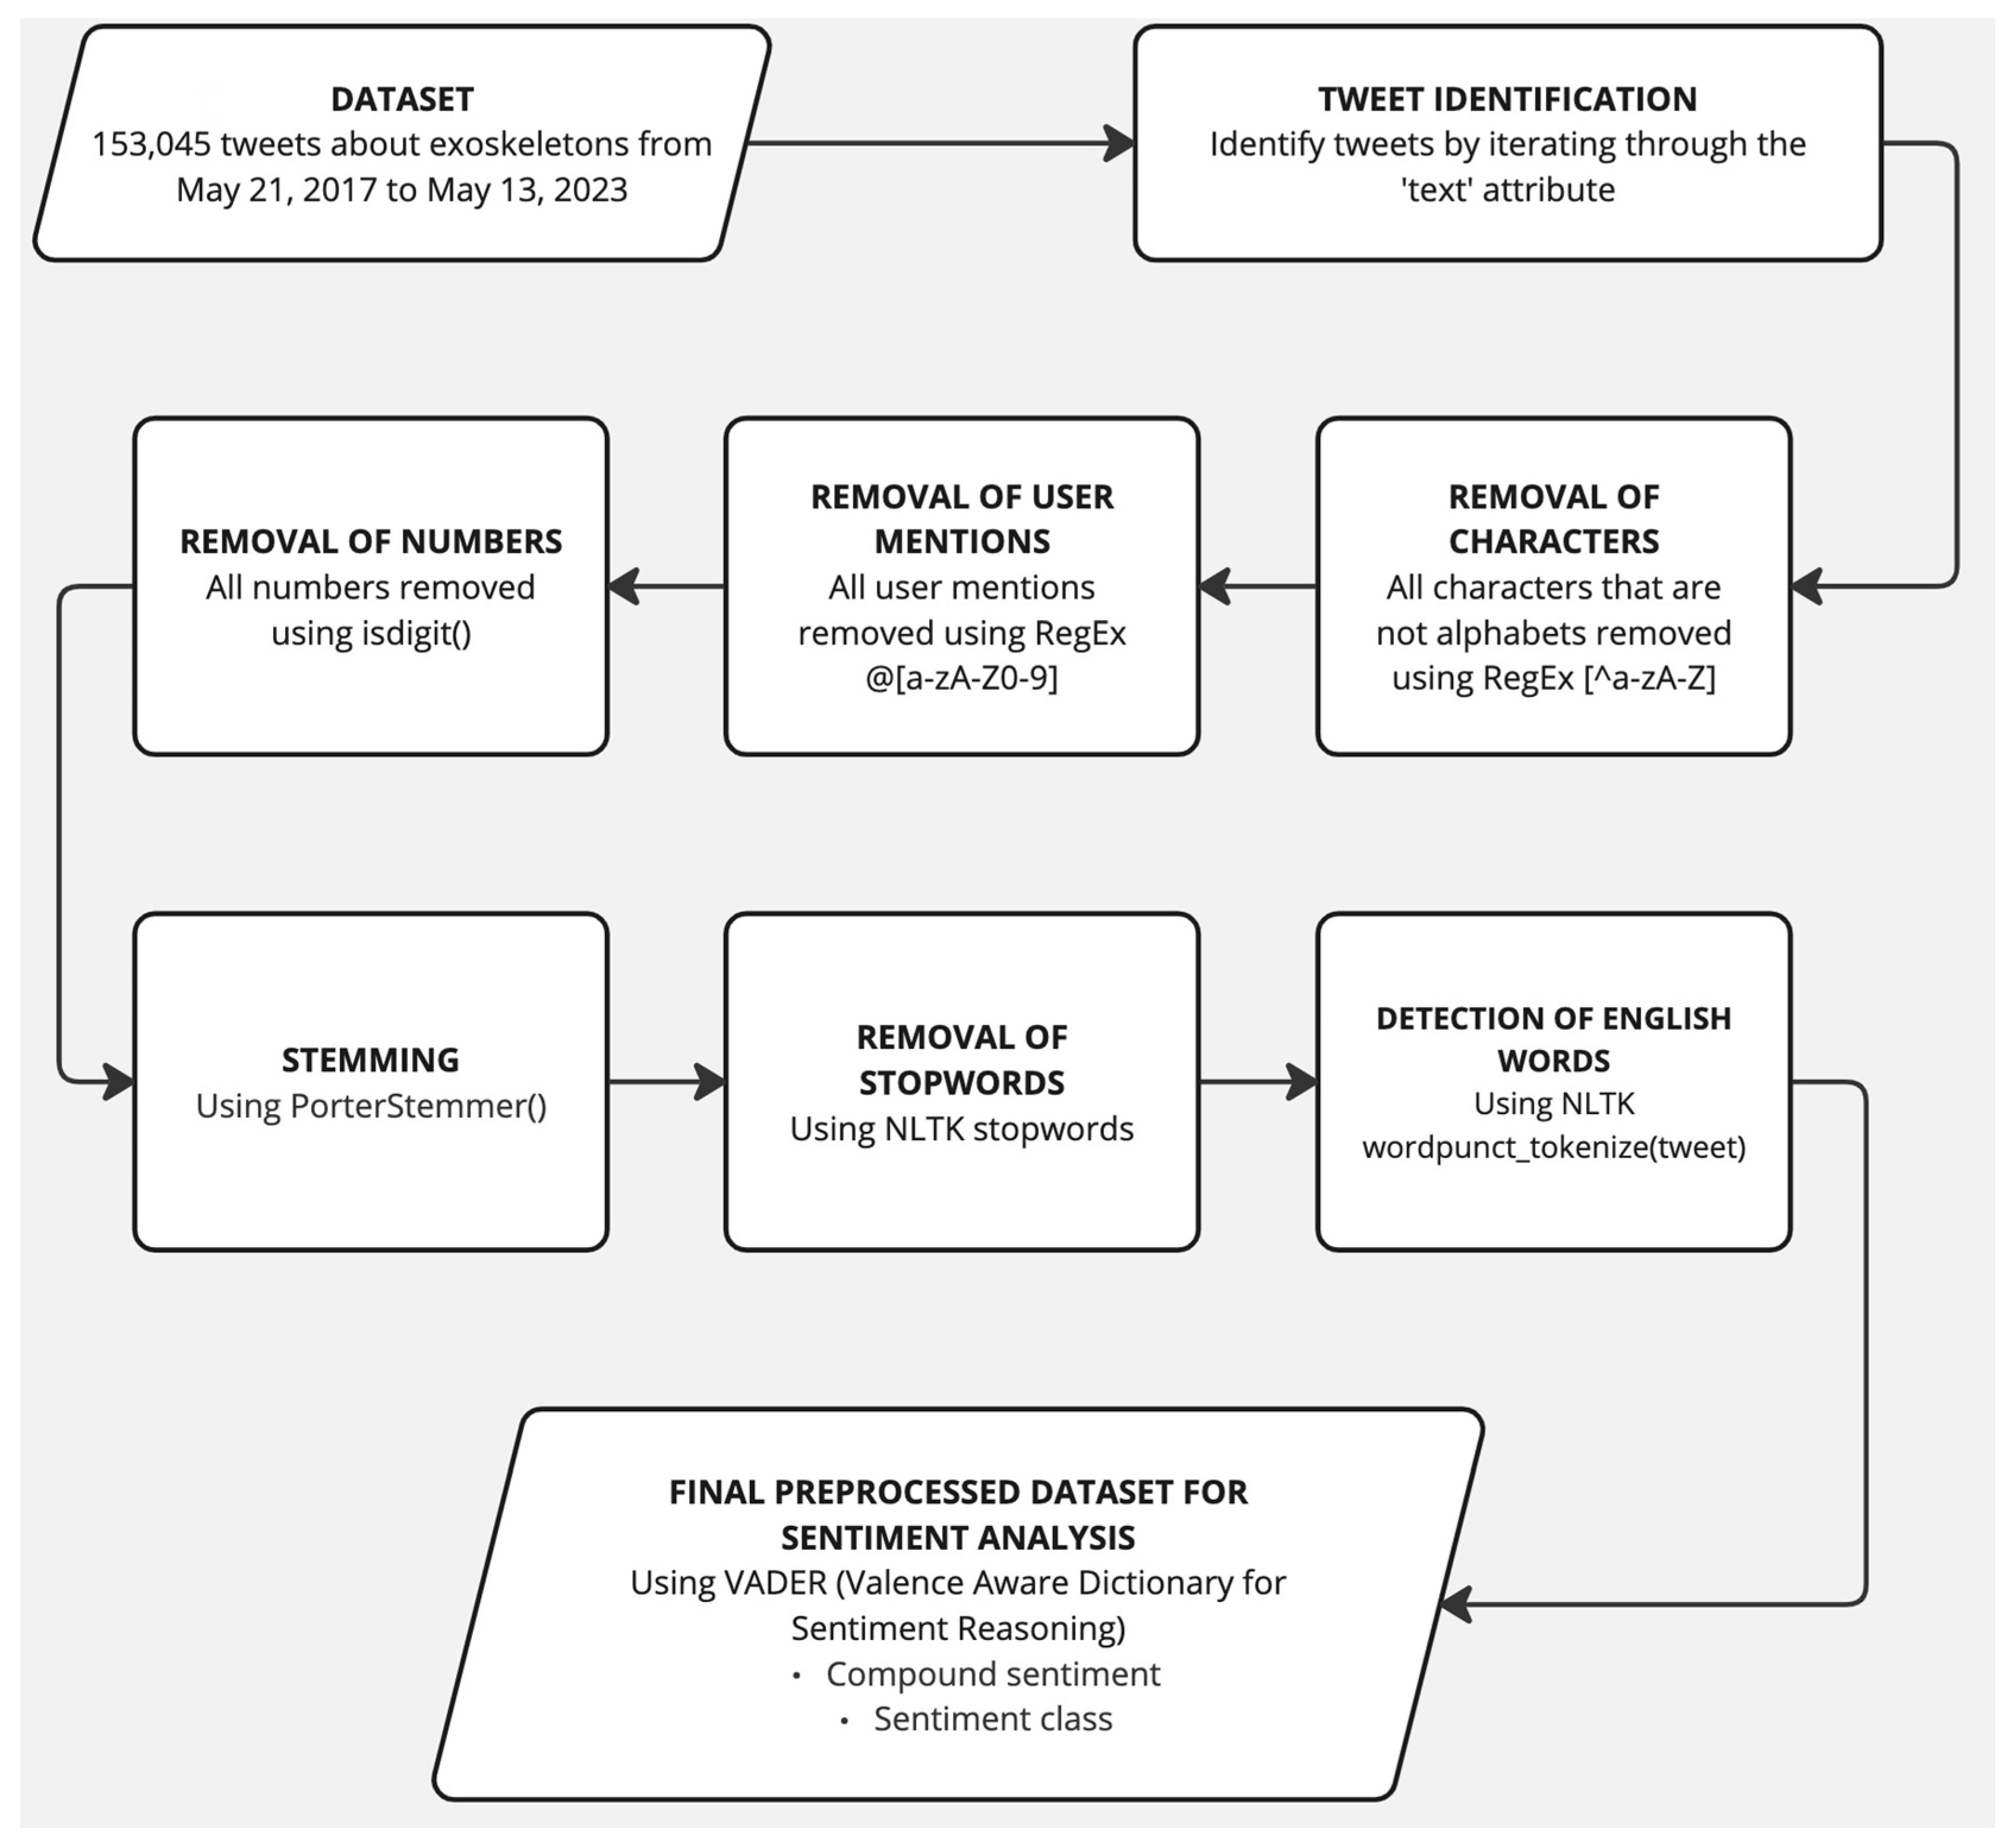
3. Methodology
- (a)
- VADER sets itself apart from LIWC by displaying heightened sensitivity to sentiment expressions that commonly appear in the analysis of social media posts.
- (b)
- The General Inquirer lacks the inclusion of sentiment-relevant lexical elements frequently encountered in social communication. However, VADER effectively addresses this issue.
- (c)
- The ANEW lexicon exhibits reduced responsiveness to lexical elements typically associated with sentiment in social media content. This is not a limitation of VADER.
- (d)
- The SentiWordNet lexicon contains a significant amount of noise since a notable proportion of its synsets lack either positive or negative polarity. However, this does not represent a constraint or drawback of VADER.
- (e)
- The Naïve Bayes classifier relies on the assumption of feature independence, which is a simplistic assumption. Nonetheless, VADER’s more nuanced approach overcomes this weakness.
- (f)
- The Maximum Entropy technique incorporates information entropy by assigning feature weightings without assuming conditional independence between features.
- (g)
- Both machine learning classifiers and verified sentiment lexicons face the challenge of requiring a substantial amount of training data.
4. Results
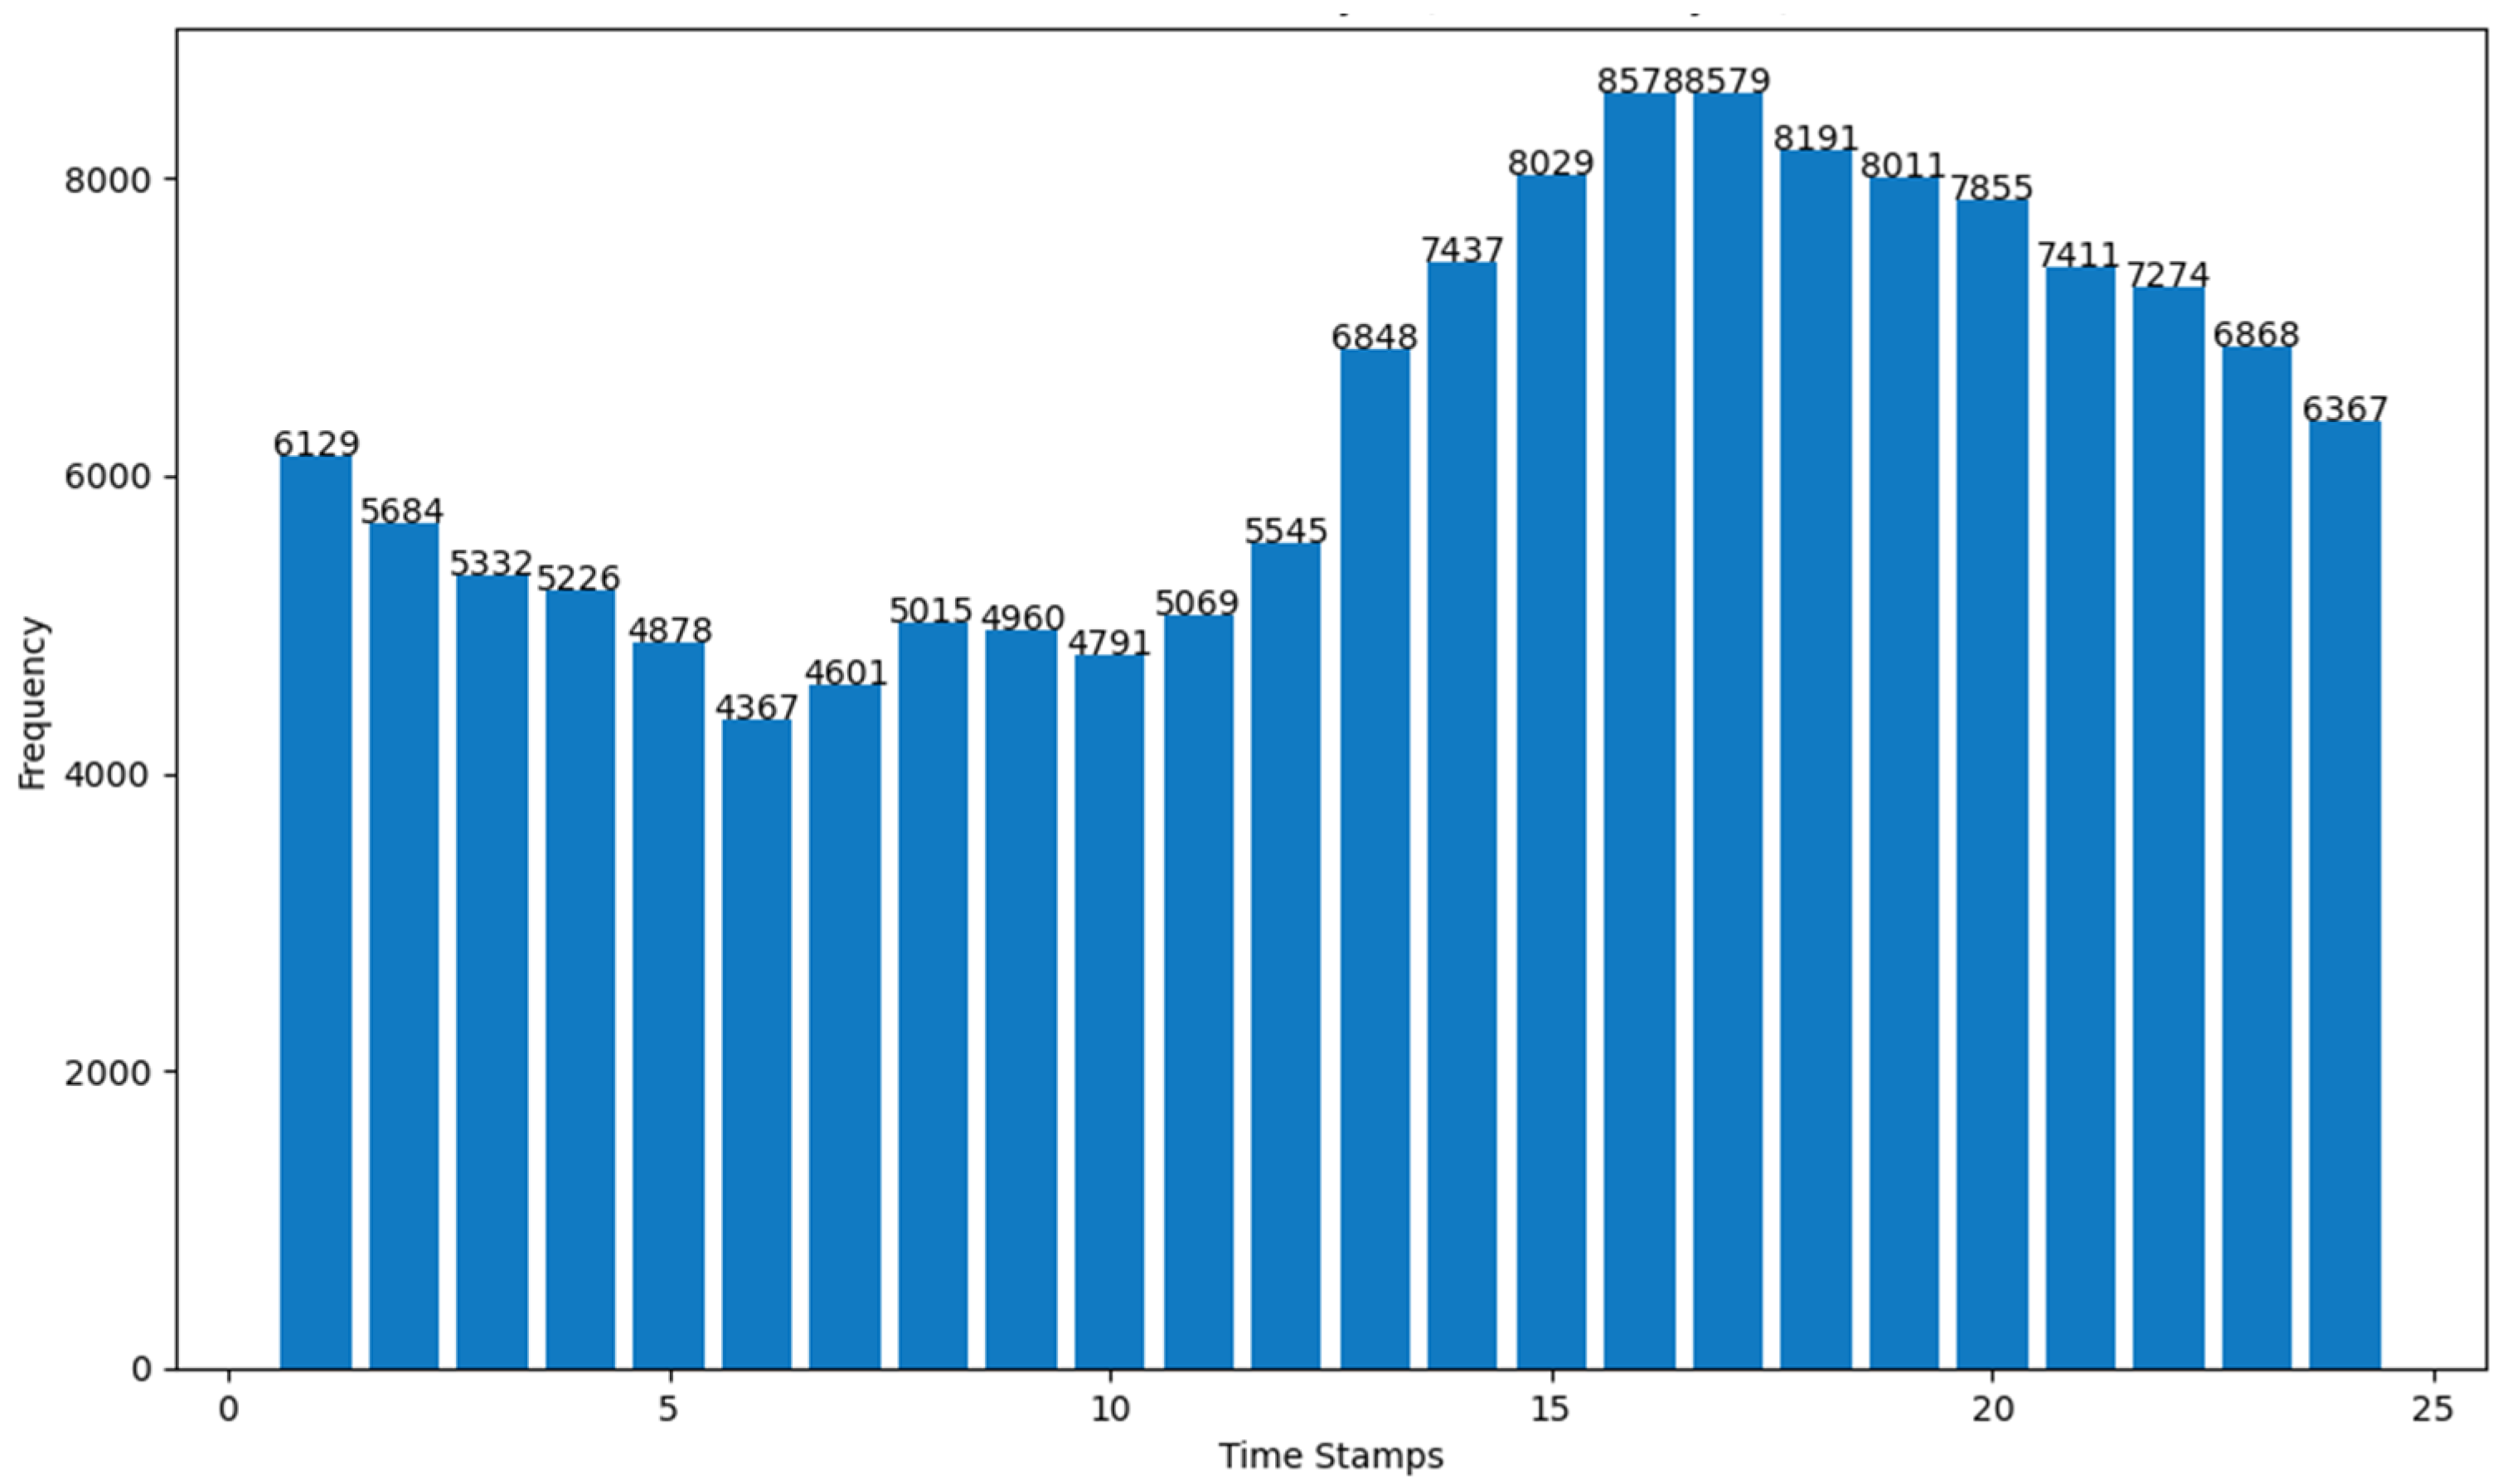
- (a)
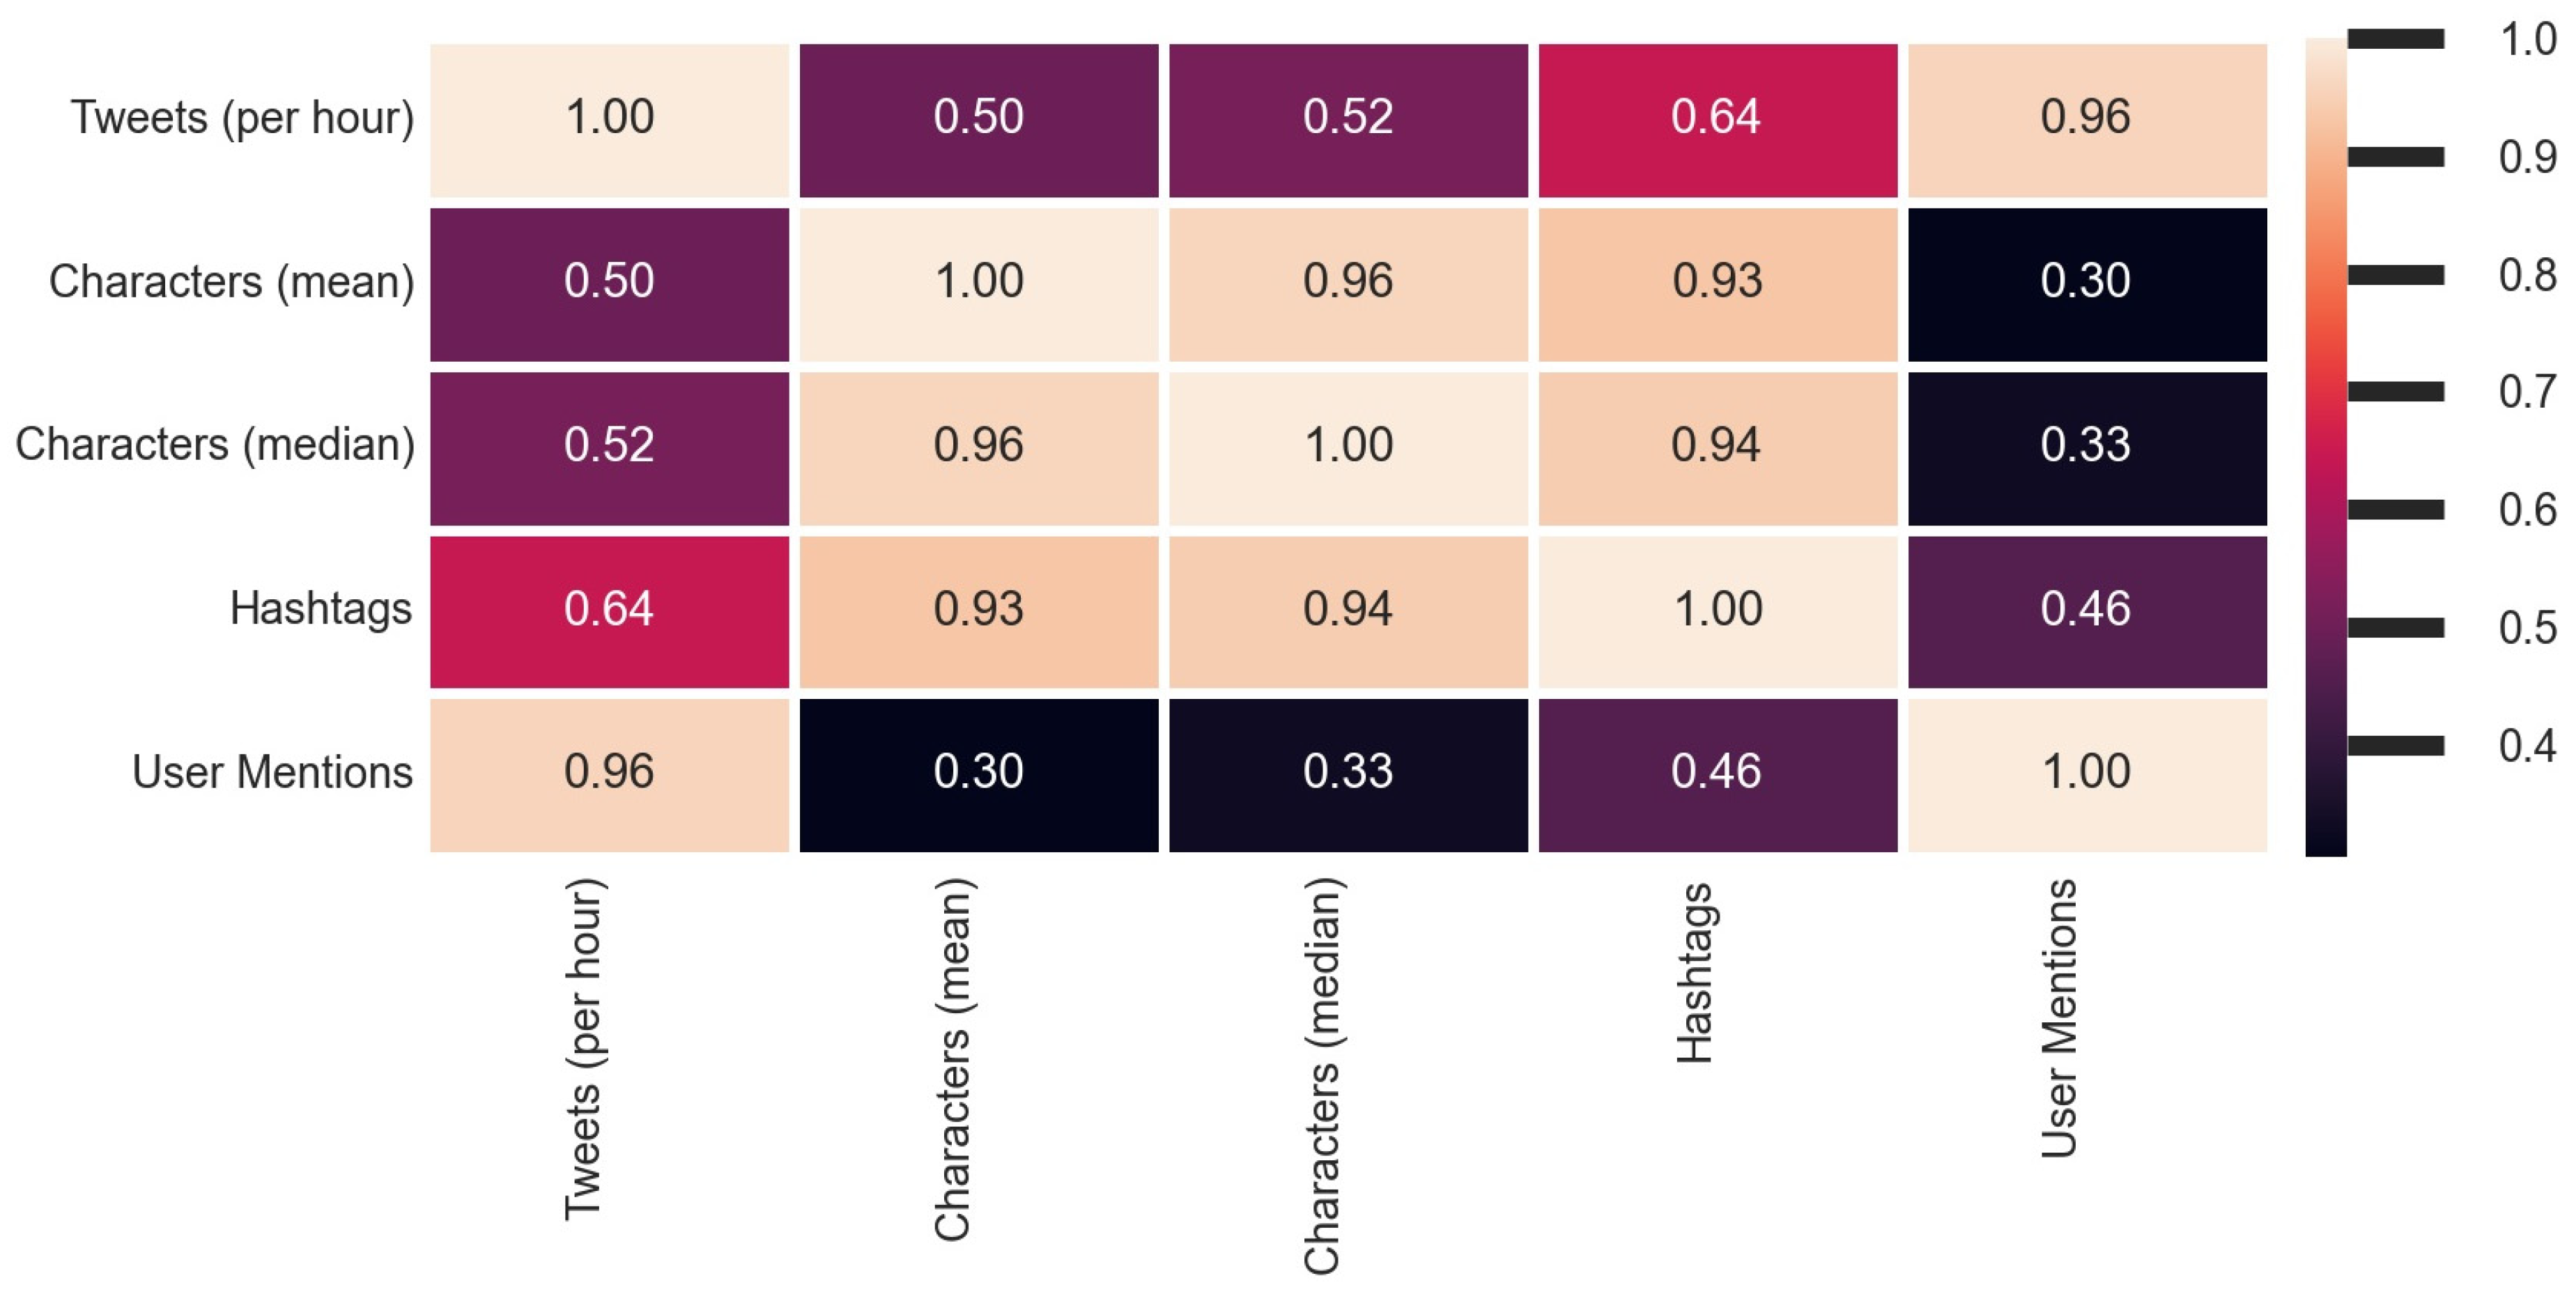
- number of Tweets per hour and number of characters (mean value) in the Tweets per hour
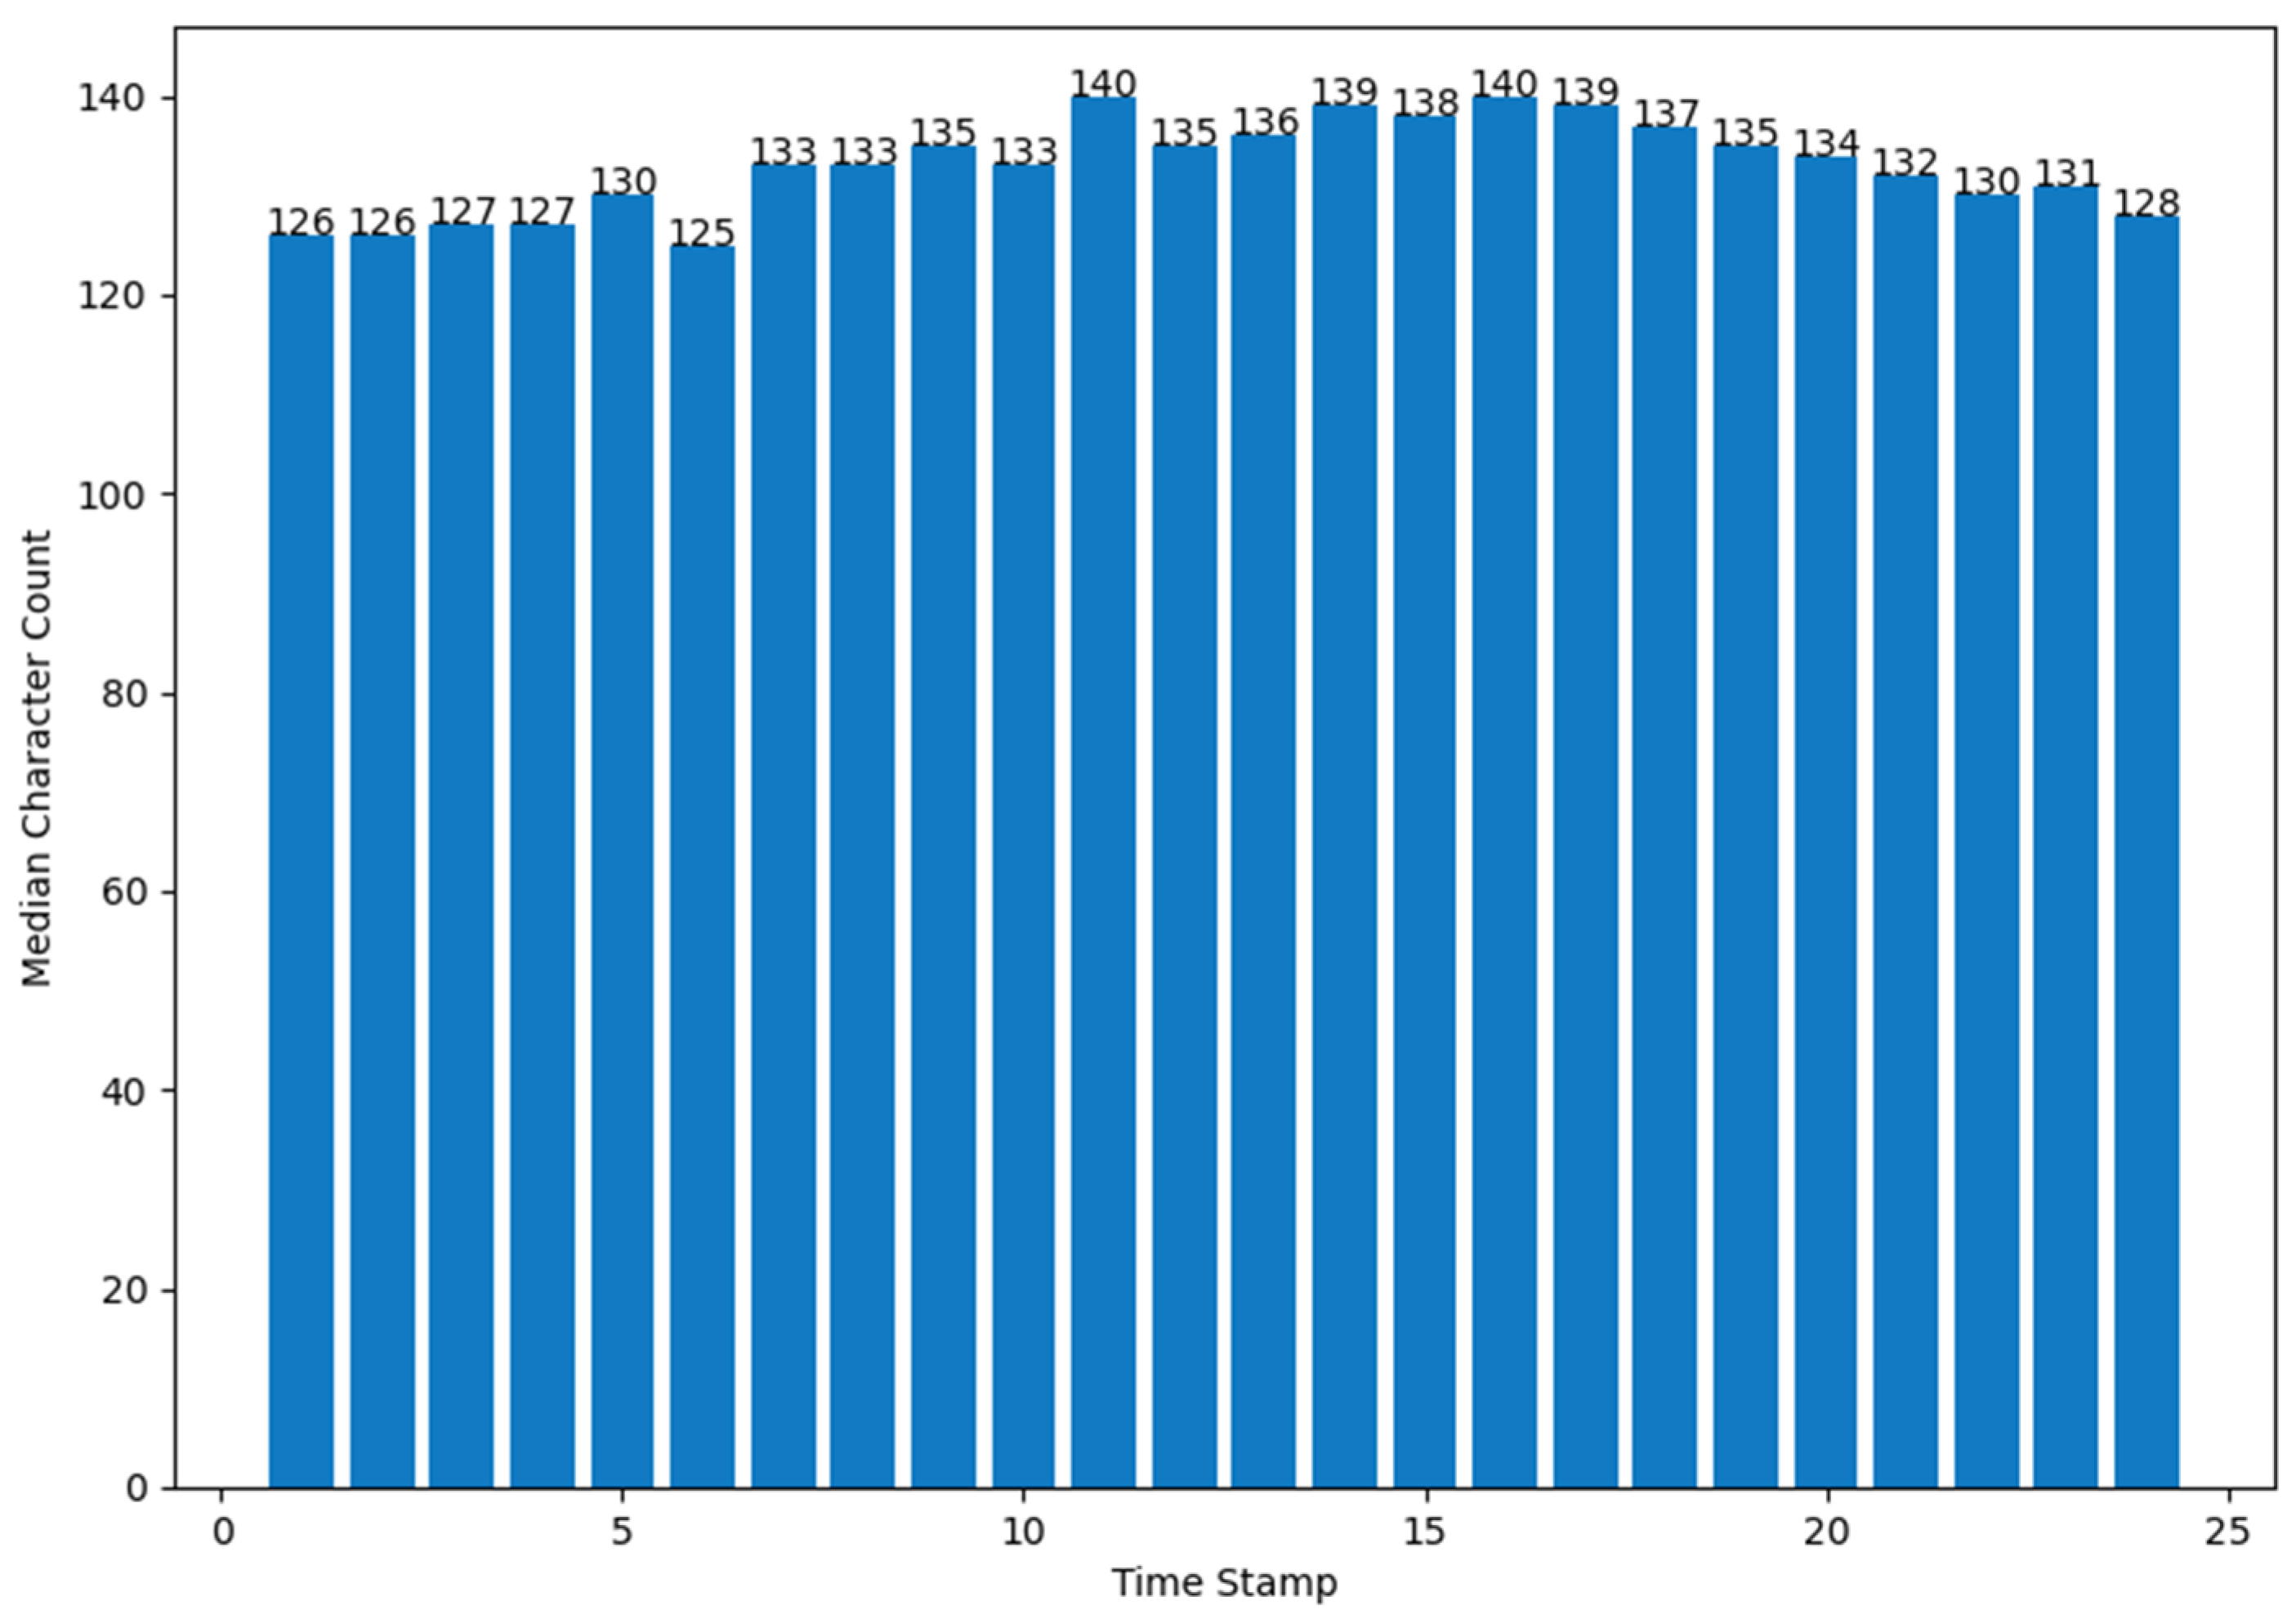
- (b)
- number of Tweets per hour and number of characters (median value) in the Tweets per hour
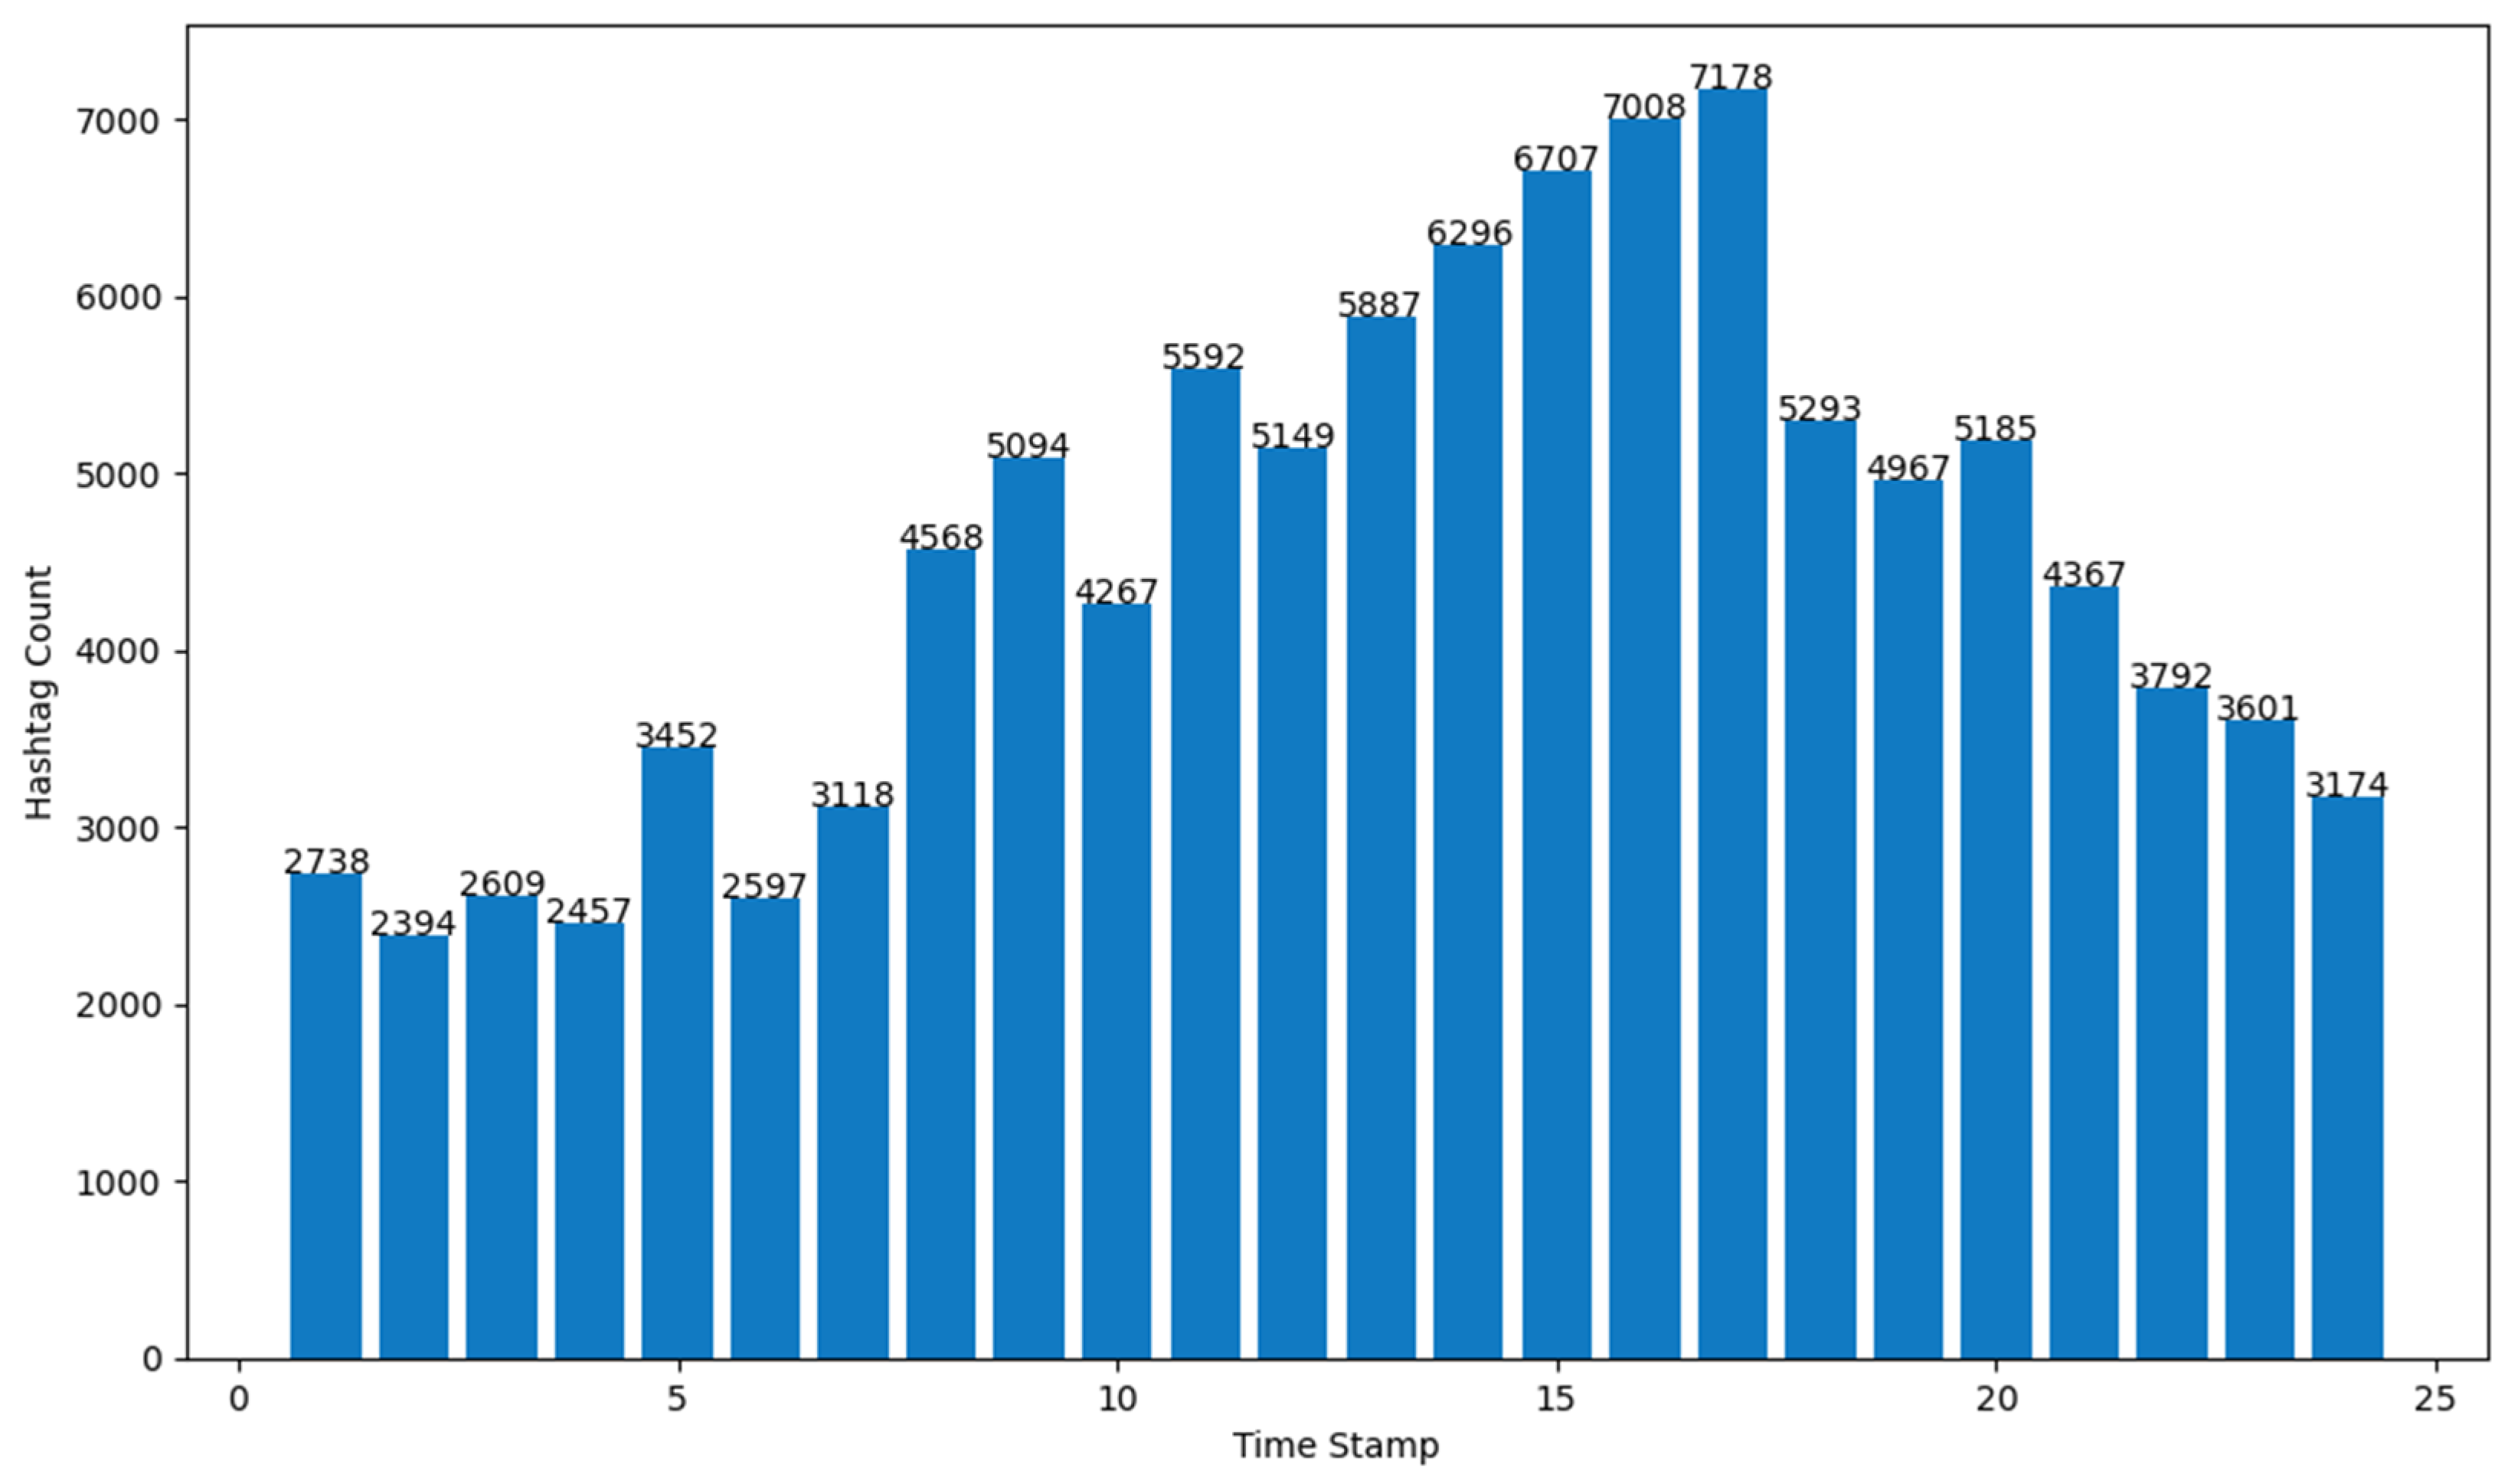
- (c)
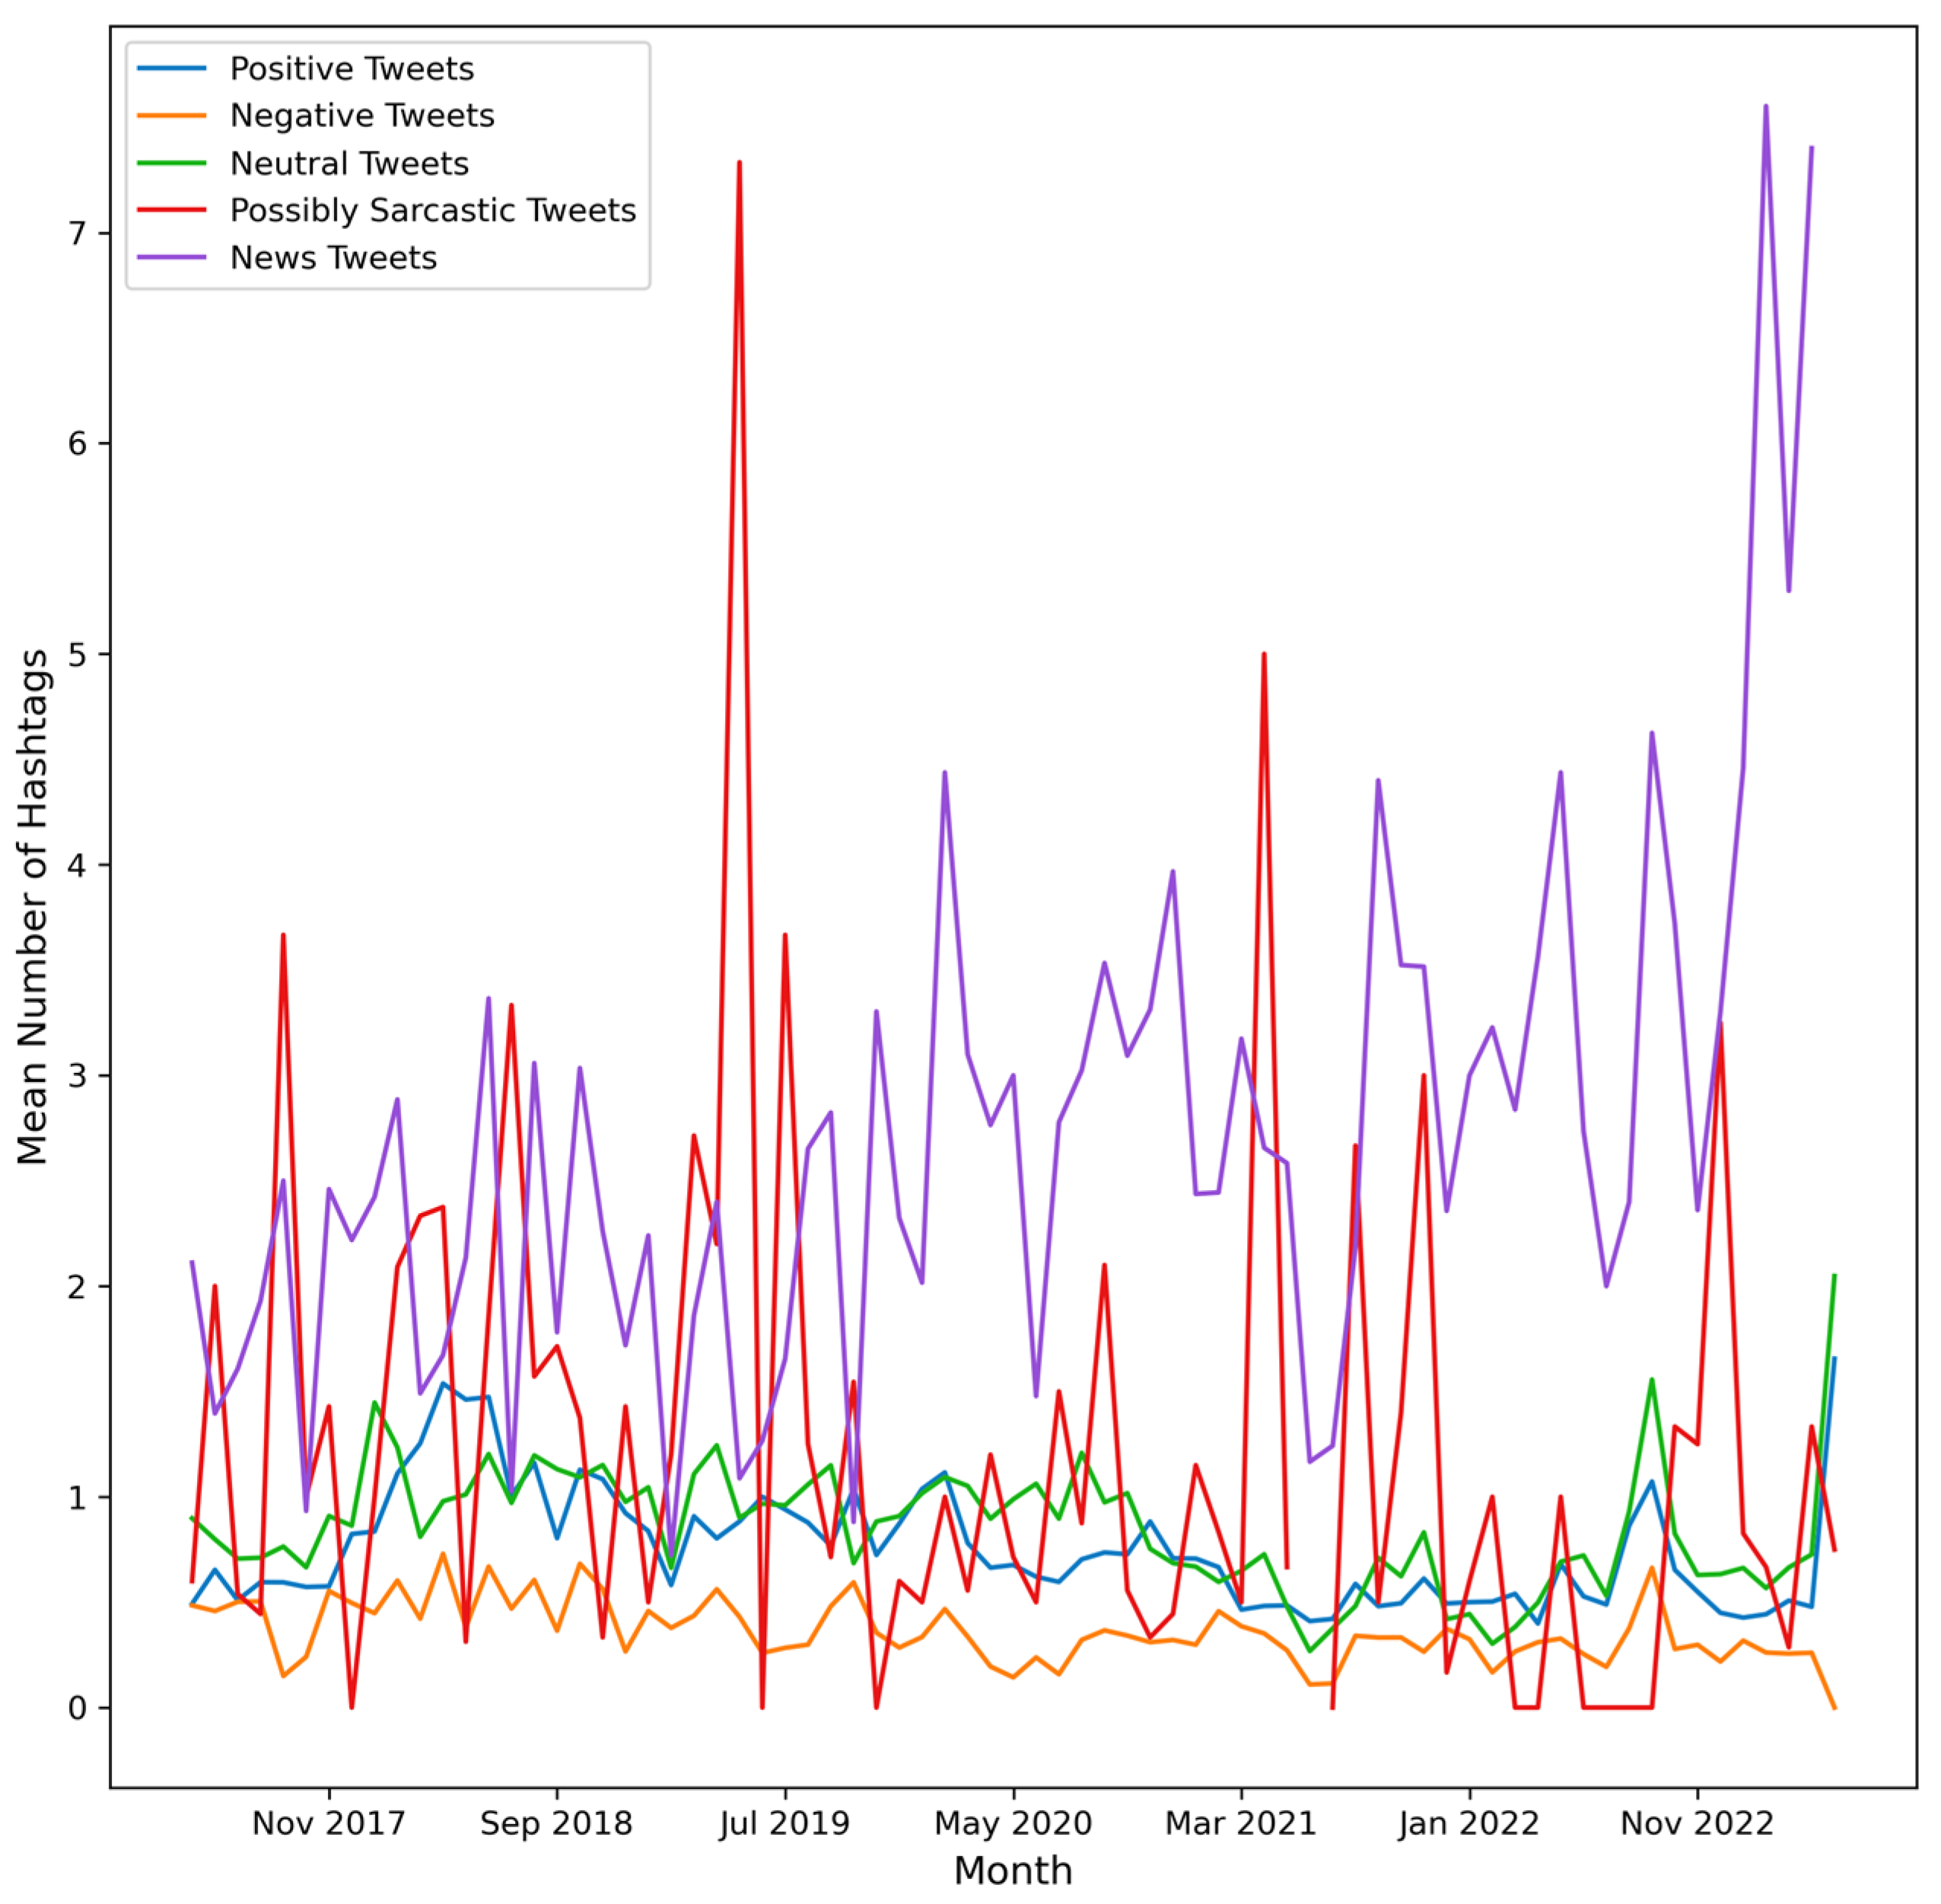
- number of Tweets per hour and number of hashtags in the Tweets per hour
- (d)
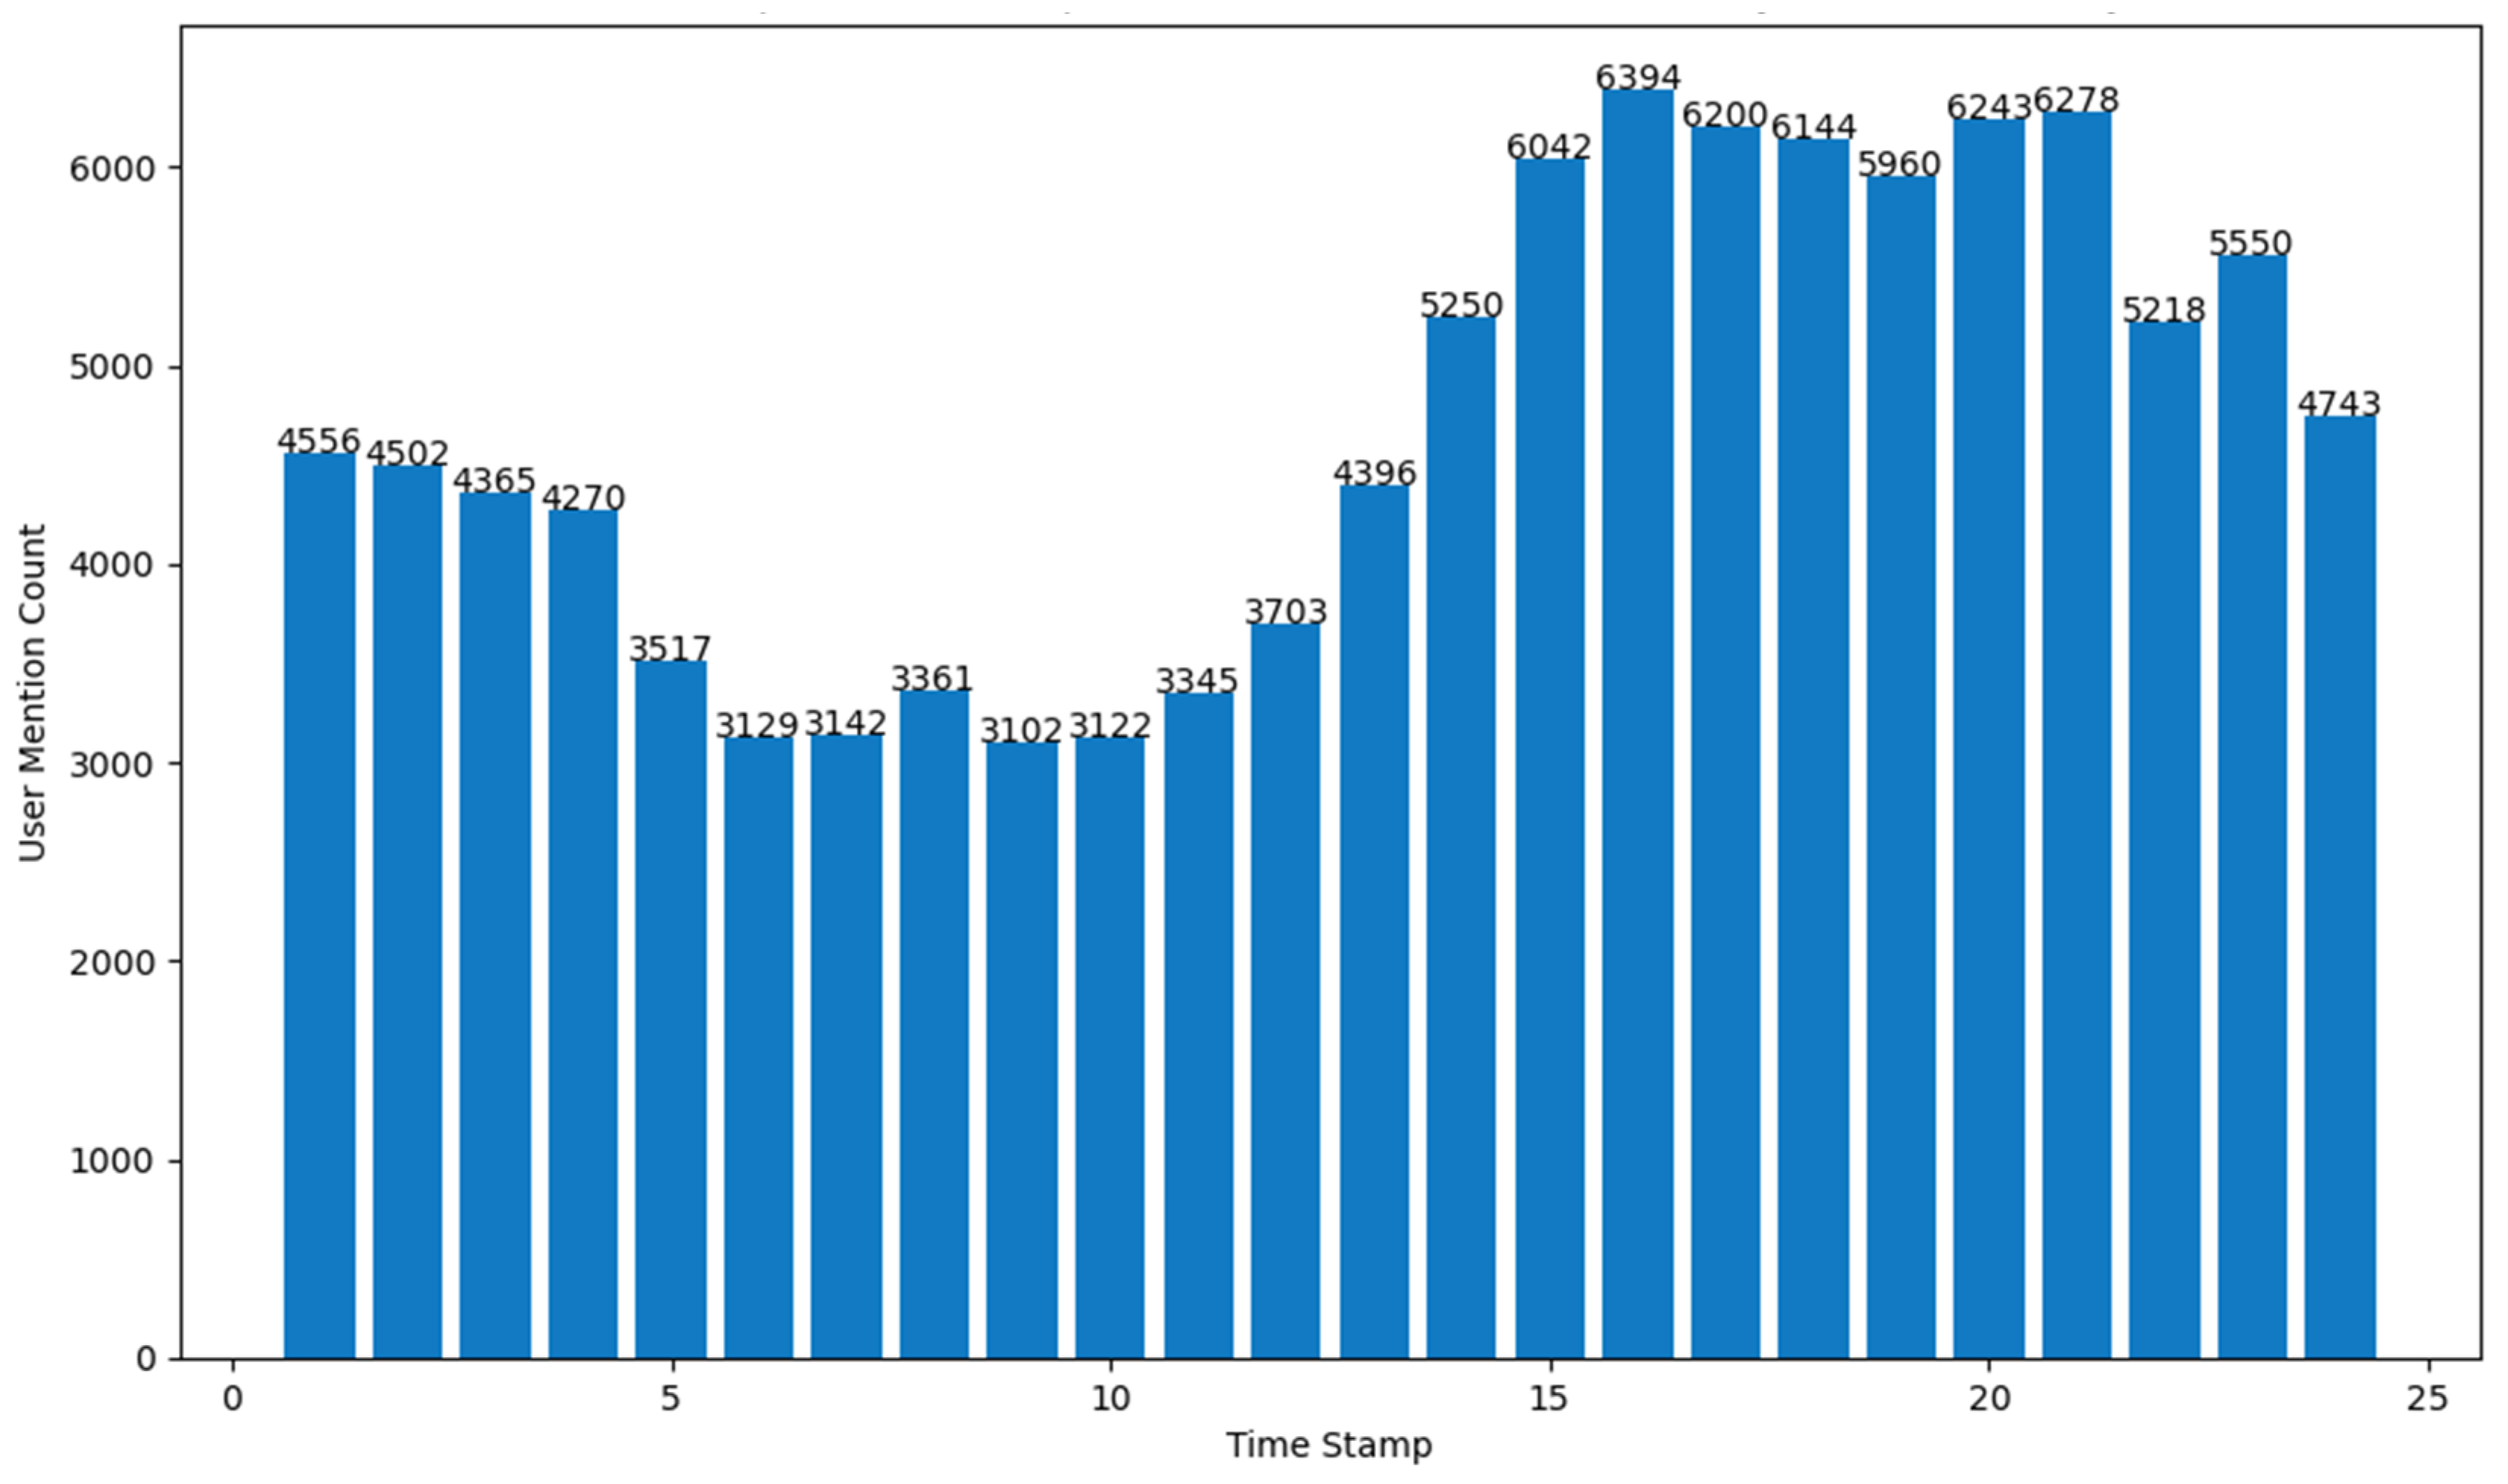
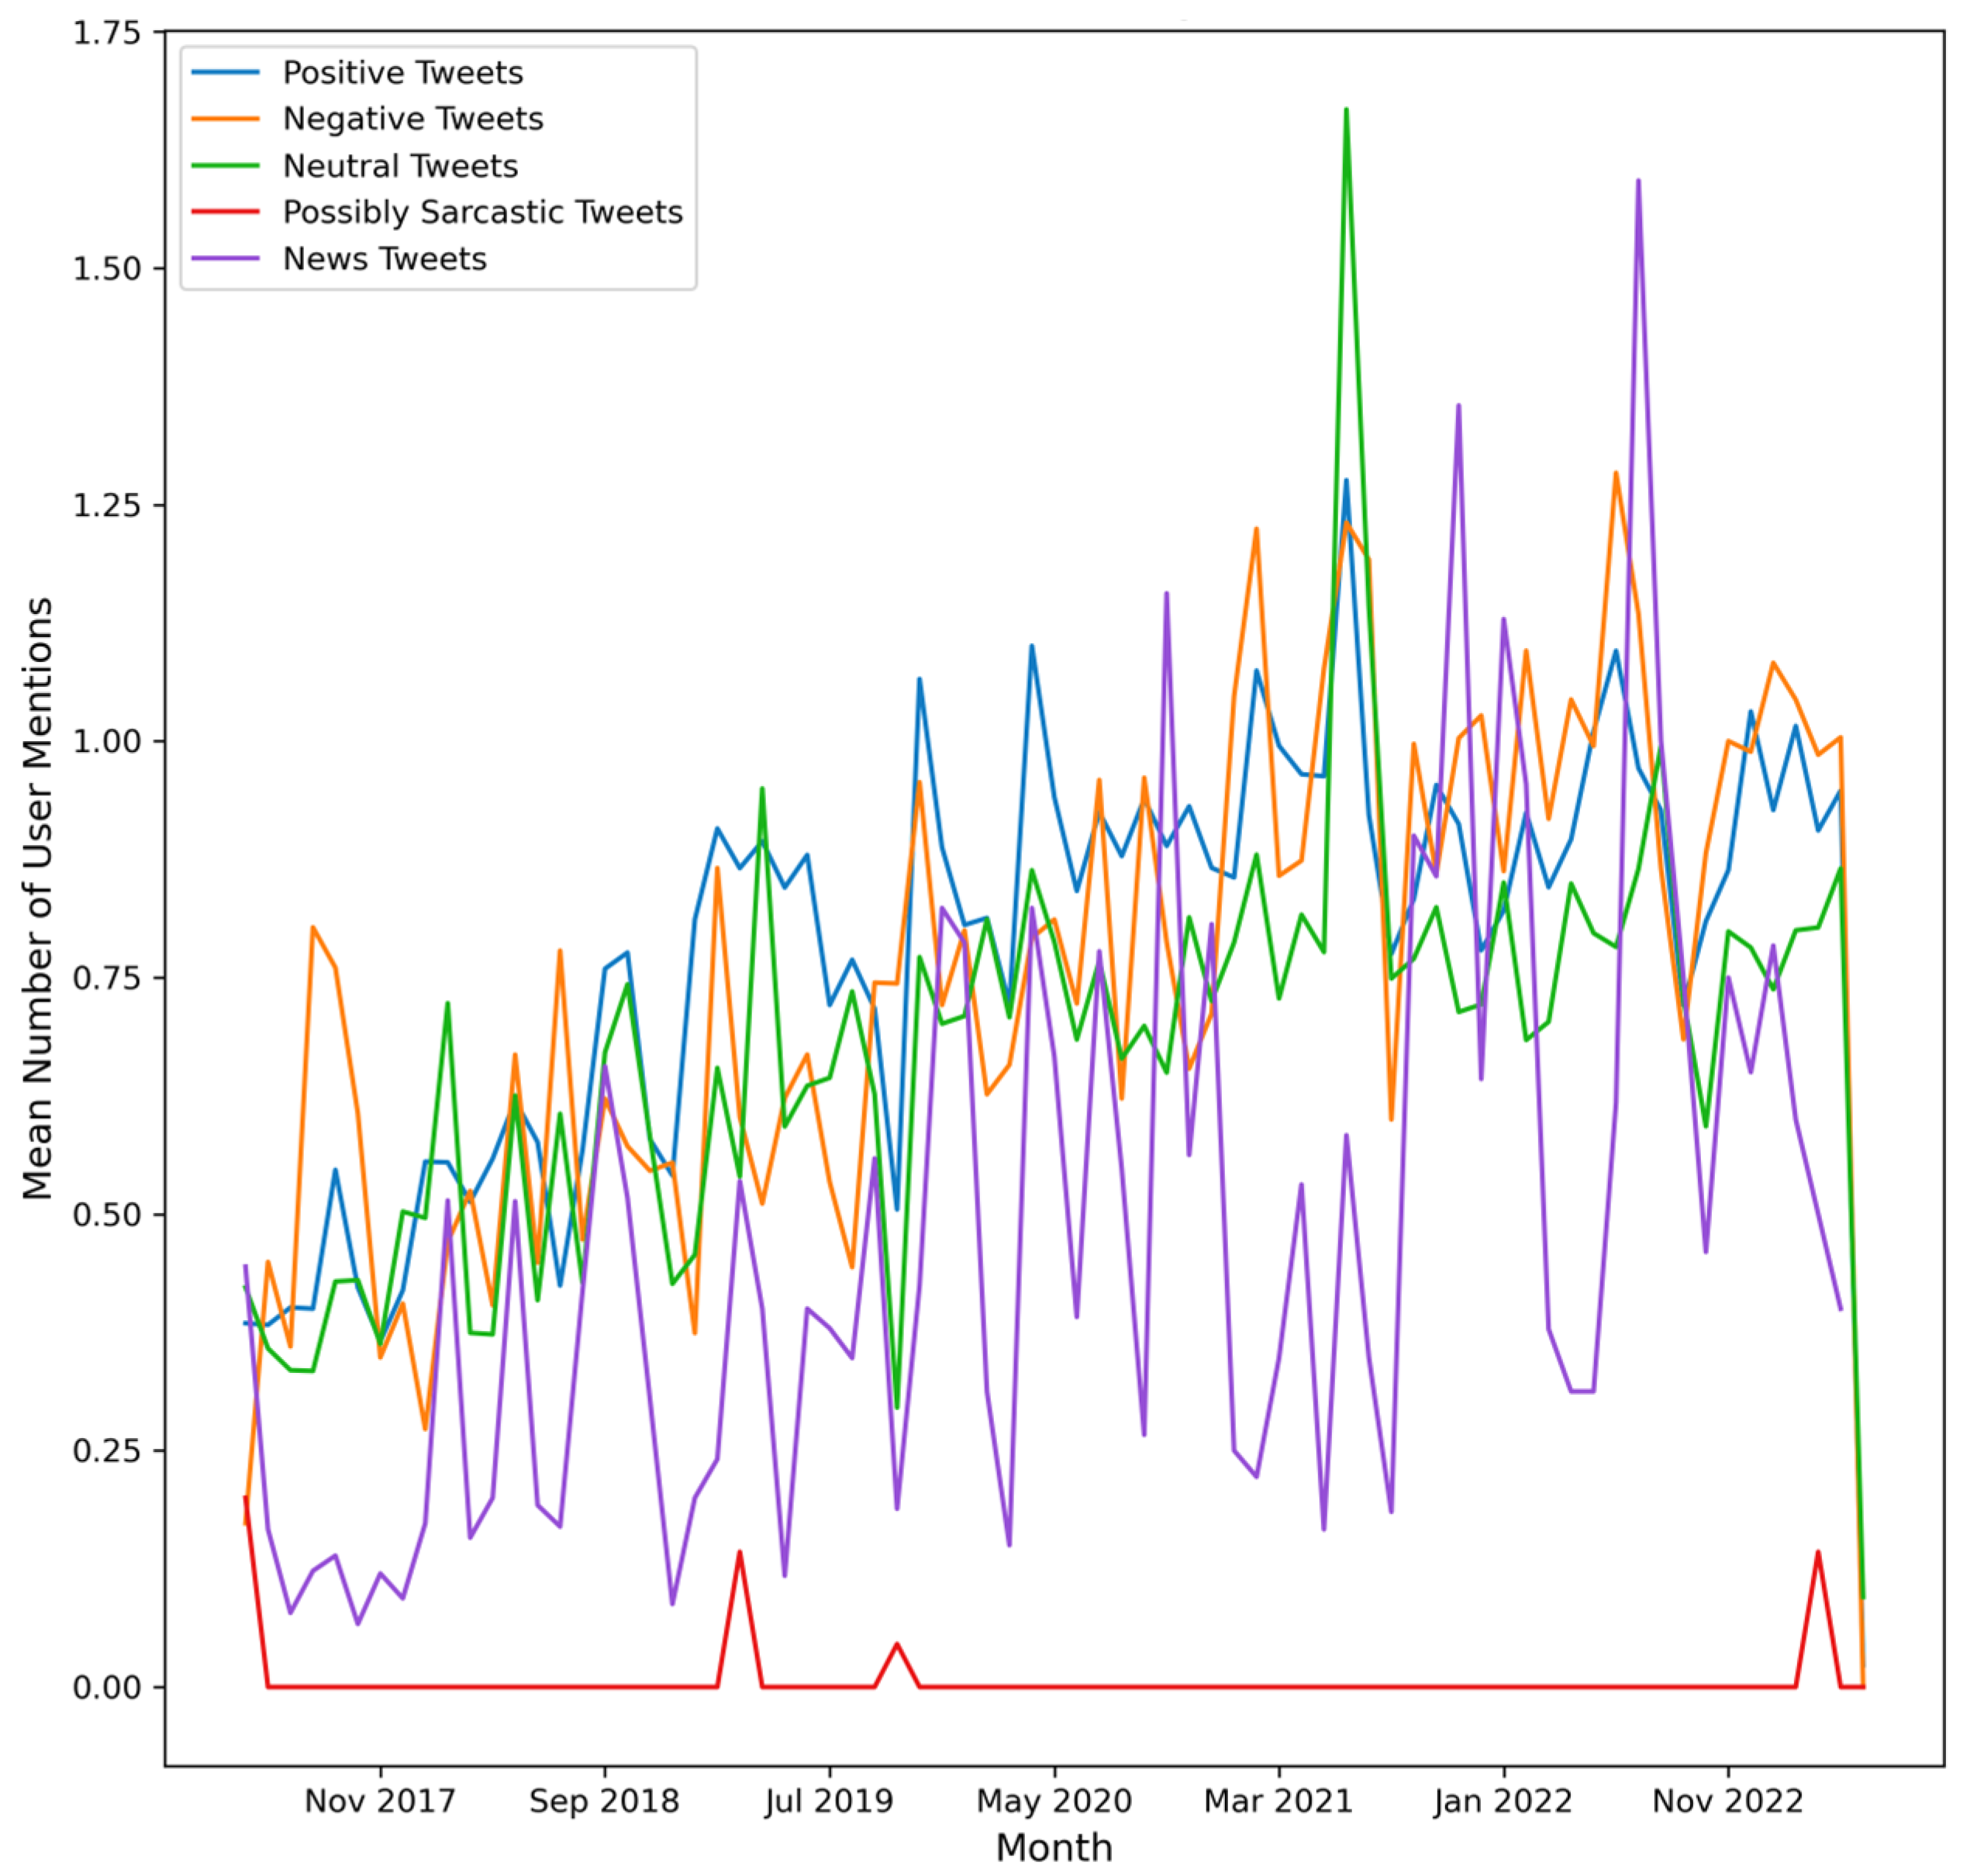
- number of Tweets per hour and number of user mentions in the Tweets per hour.

| Description | Value |
|---|---|
| Multiple Linear Regression Intercept | 2784.170988721279 |
| Multiple Linear Regression Coefficients | [11.78367763 −31.13336391 0.30537686 0.96967955] |
| R2 score | 0.9540953548345376 |
| Mean Squared Error (before cross-validation) | 54,577.94142377716 |
| Root Mean Squared Error (before cross-validation) | 233.61922314693447 |
| Value of k for k-folds cross-validation | 10 |
| Mean Squared Error (after cross-validation) | 65,260.27219328486 |
| Root Mean Squared Error (after cross-validation) | 255.46090149626588 |
5. Discussion
6. Conclusions
Author Contributions
Funding
Data Availability Statement
Acknowledgments
Conflicts of Interest
Appendix A
| Algorithm A1: Extraction of the Time of Each Tweet |
| Input: Dataset Output: New attribute for the time of each tweet (24-h format) Temp = [] File path Read data as dataframe For from 0 to n do obtain timestamp of the Tweet (‘created_at’ column) local variable x = 0 hr, min, sec (use RegEx) Function myBins: parameter hr and min convert hour to int construct using x (bin 1-24) x = myBins(hr, min) End of Function End of for loop temp ← append(x) Add new attribute to the dataset Save the data |
| Algorithm A2: Median and Mean Character Count of Tweets per Hour |
| Input: Dataset Output: Mean and Median Character Count of Tweets per hour (24-h format) Bin 1-24 = [], med = [], mean = [] File path Read data as dataframe function to find the mean(arr): if length(arr) is 0 then return 0 Else calculate mean of array return mean End of Function Function median(arr): if length of arr is 0 then return 0 Else calculate median of array return median End of Function for i from 0 to n do ith element character_count (Tweet) mean(arr) median(arr) End of for loop list ← append (mean, median) Set the field in the dataset to a new series from the list Add new attributes to the dataset Save the data |
| Algorithm A3: Number of Hashtags and User Mentions per Hour (24-h Format) |
| Input: Dataset Output: Count of Hashtags and User Mentions used per hour (24-h format) File Path Read data as dataframe hashtagCount = 0, UserMentionCount = 0 for i from 0 to n do string ← convert to string(dataset[‘text’][i]) find length of the string for j from 0 to x − 1 do if string[j] equals to ‘#’ then increment hashtagCount hashtagCount ← append count if string[j] equals to ‘@’ then increment UserMentionCount UserMentionCount ← append count End of for loop hashtagCount ← set hashtag_count column in dataset UserMentionCount ← set usermention_count column in dataset timeOfHashtags[] timeofUserMentions[] for i from 0 to n do set count to zero for k from 0 to n do if dataset[‘bin’][j] equals i then increment count by dataset[‘hashtag_count’][k] count ← set timeOfHashtags[i − 1] End of for loop for i from 0 to n do set count to zero for k from 0 to n do if dataset[‘bin’][j] equals i then increment count by dataset[‘usermention_count’][k] count ← set timeofUserMentions [i − 1] End of for loop Add new attributes to the dataset Save the data |
| Algorithm A4: Detecting Correlations and Setting Up a Multiple Linear Regression Model |
| Input: Dataset Output: Correlations (using Pearson’s correlation coefficient) between the investigated characteristics, Multiple Linear Regression Equation, and Performance Characteristics File Path Read data as dataframe Create a heatmap Xtick_loc = retrieve the x-axis tick location Xtick_labels = retrieve the x-axis tick labels Stat_1 ← Pearsons Correlation (Tweets per hour, characters (mean) used in the Tweets per hour) Stat_2 ← Pearsons Correlation (Tweets per hour, characters (median) used in the Tweets per hour) Stat_3 ← Pearsons Correlation (Tweets per hour, number of hashtags used per hour) Stat_4 ← Pearsons Correlation (number of Tweets per hour, number of user mentions used per hour) X[] = Tweets per hour, characters (median) used in the Tweets per hour, number of hashtags used per hour, number of user mentions used per hour Y[] = number of Tweets per hour Initialize and fit the linear regression model (using sklearn.linear_model) Print Intercept and Coefficient using model.intercept_ and model.coef_ Generate X_train, X_test, y_train, y_test using split ratio 80:20 Y_pred ← output of applying the model to X_test Print Mean Squared Error, Root Mean Squared Error, R2 score before Cross Validation Perform Cross Validation (cv = 10, scoring = neg_mean_squared_error) Print Mean Squared Error, Root Mean Squared Error, R2 score after Cross Validation |
| Algorithm A5: Determine the Top 10 Hashtags, Determine the Number of Tweets per Month per Hashtag (Top 10 Hashtags) |
| Input: Dataset Output: top 10 hashtags, number of Tweets per month per hashtag for top 10 hashtags File Path Read data as dataframe total_hashtage_list = [] for i from 0 to n do current_hashtag ← set empty string j = 0 string ← convert the text column of row i to string while j is less than length of the string do letter ← get the character at index j if letter is “#” then current_hashtag ← reset to empty string increment j while j is less than length of string and string[j] is not a space, “#” or “,” or “.” do current_hashtag ← append string[j] increment j Else increment j if length of current_hashtag is not 0 then convert current_hashtag to lowercase append current_hashtag to total_hashtag_list End of for loop create a frequency distribution of hashtag from the total list display the top 10 top_ten_hashtags = get the top 10 hashtags months = month years = year define function(lst1, lst2): lst 3 ← empty list for each value in lst1 do if value is in lst2 then append value to lst3 return lst3 End of for loop tweet_counts = {} for each hashtag h in top_hashtags then set tweet_counts[h] to 0 End of for loop for key x in tweet_counts do print the value x End of for loop month_years = [] for each year in years do for each month in months do concatenate month and year append to the list End of for loop set the index of the dataframe to the value in month_years for each year in years do for each month in months do print month and year tweet_counts = {} for each hashtag h in top_hashtags do set tweet_counts[h] to 0 for i from 0 to n do convert the month and year to string if month and year match then convert the text column to string i = 0 hashtags = [] while i is less than the length of tweet do get the character at index I of tweet if letter is “#” then reset current_hashtag = ‘ ’ increment i while i < length of tweet and tweet[i] is not a space, “#” or “.” do current_hashtag ← tweet[i] increment i hashtag ← current_hashtag else: increment i for each hashtag h in hashtags do if h is in tweet_counts then increment tweet_counts display tweet_countss for each key in tweet_counts do set value in datatframe t at row month year and column key ← tweet_counts End of for loop Plot the hashtag distribution graph (using matplotlib) |
| Algorithm A6: Number of Tweets per Sentiment per Hashtag (top 10) per Month |
| Input: Dataset Output: .CSV with sentiment labels for each Tweet, Number of Tweets per sentiment per hashtag (top 10) per month, and their visual representations File Path Read data as dataframe Import VADER Algorithm A7 for Data Preprocessing() Function sentiment_sccores(sentence): Side_obj = Make sentimentIntensityAnalyzer object Sentiment_dict = calculate polarity score using side_obj If sentiment_dict[‘compound’] is greater than or equal to 0.05 then x ← positive Else If sentiment_dict[‘compound’] is less than or equal to −0.05 then x ← negative Else: x ← neutral Return x End of Function Arr = [] For i from 0 to n do score ← call function sentiment_scores(data) append score to arr End of for loop Arr = Add a new column(sentiment label) to the dataset Export result_sentiment_label_Tweets.csv Set top_hashtags, months, years Set a cols list with specific column names relate to hashtag’s sentiment Month_years = [] For each year in years do For month in months do my ← combine month and year Append my to month_years list End of for loop set the index of the dataframe to the value in month_years for each year in years do: for month in months do: print combined month and year tweet_counts ← {} for each h in cols do: tweet_counts[h] ← 0 for each row in dataset do: if month and year of current row matches then: tweet ← get the tweet content i ← 0 hashtags ← [] while i is less than the length of tweet do: letter ← store current letter of tweet at position i if letter is equal to # then current_hashtag ← empty string increment i while i is less than length of tweet and tweet[i] is not a space, # or . do: current_hashtag ← append the character at position i of tweet increment i append current_hashtag to hashtags list else: increment i for each h in hastags do: if h is in top_hashtags then: if the sentiment of current row is positive then: increment the tweet_counts by combining key h with pos else if the sentiment of current row is negative then: increment the tweet_counts by combining key h with neg else: increment the tweet_counts by combining key h with neut for each key in tweet_counts do: update the t value at key and combine month and year with value tweet_counts End of for loop Plot the sentiment distribution graph per hashtag (using matplotlib) Export .CSV with sentiment labels for each Tweet |
| Algorithm A7: Data Preprocessing |
| Input: Dataset Output: Preprocessed Dataset File Path Read data as dataframe English words: nltk.download(‘words’) Stopwords: nltk.download(‘stopwords’) Initialize an empty list to store preprocessed text corpus[] for i from 0 to n do Obtain Text of the Tweet (‘text’ column) text ← re.sub(‘[^a-zA-Z]’, ‘ ‘, string)//RegEx to remove characters that are not alphabets text ← re.sub(r’http\S+’, ‘‘, string)//RegEx to remove URLs text ← text.lower() text ← review.split() ps ← PorterStemmer()//stemming all_stopwords ← stopwords.words(‘english’) text ← [ps.stem(word) for word in text if not word in set(all_stopwords)] text ← ‘ ‘.join(review) //Regex to remove user mentions and special characters text ← ‘ ‘.join(re.sub(“(#[A-Za-z0-9]+)|(@[A-Za-z0-9]+)|([^0-9A-Za-z \t])|(\w+:\/\/\S+)”, “ “, string).split()) text ← ‘‘.join(““ if c.isdigit() else c for c in text) text ← ‘ ‘.join(w for w in nltk.wordpunct_tokenize(review) if w.lower() in words) corpus ← append(text) End of for loop New Attribute ← Preprocessed Text (from corpus) |
| Algorithm A8: Detect Potentially Sarcastic Tweets |
| Input: Dataset Output: CSV file for potentially sarcastic Tweets File Path Read data as dataframe Obtain Text of the Tweet (‘text’ column) text = text.lower() define sarcastic_keywords define interjections define lexical_expression define formulaic_expressions define foreign_terms define rhetorical_statements define specific_keywords potentially_sarcastic_Tweets = [] for i from 0 to n do Obtain Text of the Tweet (‘text’ column) retrieve element from text_column at position index if text is a string and ( text contains sarcastic_keywords Or text contains interjections Or text contains lexical_expression Or text contains formulaic_expression Or text contains foreign_terms Or text contains rhetorical_statements Or text contains specific_keywords) then if user mention resulted in match then continue else add tweet to result.csv Function SubstringAnalysis(text, keywords): text ← lowercase(text) for each keyword in keywords: if keyword is found in text: return True return False End of for loop End of Function remove_duplicates()//function to remove any duplicates based on Tweet ID Export result_potentially_sarcastic_Tweets.csv |
| Algorithm A9: Detect Tweets That Contain News |
| Input: Dataset Output: CSV file with Tweets that contained News File Path Read data as dataframe count = 0 for i from 0 to n do Obtain Text of the Tweet (‘text’ column) retrieve element from text_column at position index RegEx to remove characters that are not alphabets RegEx to remove URLs if “news” in text: count ← count + 1 End of for loop Function SubstringAnalysis(text, keywords): text ← lowercase(text) for each keyword in keywords: if keyword is found in text: return True return False End of for loop End of Function remove_duplicates()//function to remove any duplicates based on Tweet ID Export result_news_Tweets.csv |
| Algorithm A10: Fine Grain Sentiment Analysis |
| Input: Dataset Output: CSV file with a fine grain sentiment label for each tweet File Path Read data as dataframe English words: nltk.download(‘words’) Stopwords: nltk.download(‘stopwords’) Algorithm A7 for Data Preprocessing() Initialize an empty list to store preprocessed text corpus[] for each i from 0 to n do Obtain Text of the Tweet (‘text’ column) Initialize classifier (return_all_scores = True) apply classifier on the text score [] ← scores for Anger, Disgust, Fear, Joy, Neutral, Sadness, & Surprise max_value ← maximum value in Score[] label ← class for max_value append values to corpus End of for loop data = [] for each i from 1 to n do: create an empty list tmp append tweet id, text,score[],max_value, and label to tmp append tmp to data End of for loop Write fields to a .CSV file Export .CSV with tweet id, text,score[],max_value, and label for each Tweet |
References
- Gundecha, P.; Liu, H. Mining Social Media: A Brief Introduction. In 2012 TutORials in Operations Research; INFORMS: Catonsville, MD, USA, 2012; pp. 1–17. [Google Scholar]
- Messaoudi, C.; Guessoum, Z.; Ben Romdhane, L. Opinion Mining in Online Social Media: A Survey. Soc. Netw. Anal. Min. 2022, 12, 25. [Google Scholar] [CrossRef]
- Van Looy, A. Definitions, Social Media Types, and Tools. In Social Media Management; Springer International Publishing: Cham, Switzerland, 2022; pp. 21–50. ISBN 9783030990930. [Google Scholar]
- Karami, A.; Lundy, M.; Webb, F.; Dwivedi, Y.K. Twitter and Research: A Systematic Literature Review through Text Mining. IEEE Access 2020, 8, 67698–67717. [Google Scholar] [CrossRef]
- Belle Wong, J.D. Top Social Media Statistics and Trends of 2023. Available online: https://www.forbes.com/advisor/business/social-media-statistics/ (accessed on 23 September 2023).
- Morgan-Lopez, A.A.; Kim, A.E.; Chew, R.F.; Ruddle, P. Predicting Age Groups of Twitter Users Based on Language and Metadata Features. PLoS ONE 2017, 12, e0183537. [Google Scholar] [CrossRef]
- Martin, M. 29 Twitter Stats that Matter to Marketers in 2023. Available online: https://blog.hootsuite.com/twitter-statistics/ (accessed on 24 September 2023).
- Singh, C. 60+ Twitter Statistics to Skyrocket Your Branding in 2023. Available online: https://www.socialpilot.co/blog/twitter-statistics (accessed on 24 September 2023).
- Taylor, T. 30+ Remarkable Twitter Statistics to Be Aware of in 2023. Available online: https://blog.hubspot.com/marketing/twitter-stats-tips (accessed on 24 September 2023).
- Kemp, S. Twitter Users, Stats, Data, Trends, and More—DataReportal—Global Digital Insights. Available online: https://datareportal.com/essential-twitter-stats (accessed on 24 September 2023).
- Dinesh, S. 8 Facts about Americans and Twitter as It Rebrands to X. Available online: https://www.pewresearch.org/short-reads/2023/07/26/8-facts-about-americans-and-twitter-as-it-rebrands-to-x/ (accessed on 24 September 2023).
- Lin, Y. 10 Twitter Statistics Every Marketer Should Know in 2023. [Infographic]. Available online: https://www.oberlo.com/blog/twitter-statistics (accessed on 24 September 2023).
- Taecharungroj, V. “What Can ChatGPT Do?” Analyzing Early Reactions to the Innovative AI Chatbot on Twitter. Big Data Cogn. Comput. 2023, 7, 35. [Google Scholar] [CrossRef]
- Mujahid, M.; Kanwal, K.; Rustam, F.; Aljadani, W.; Ashraf, I. Arabic ChatGPT Tweets Classification Using RoBERTa and BERT Ensemble Model. ACM Trans. Asian Low-Resour. Lang. Inf. Process. 2023, 22, 1–23. [Google Scholar] [CrossRef]
- Tao, W.; Peng, Y. Differentiation and Unity: A Cross-Platform Comparison Analysis of Online Posts’ Semantics of the Russian–Ukrainian War Based on Weibo and Twitter. Commun. Public 2023, 8, 105–124. [Google Scholar] [CrossRef]
- Chen, E.; Ferrara, E. Tweets in Time of Conflict: A Public Dataset Tracking the Twitter Discourse on the War between Ukraine and Russia. Proc. Int. AAAI Conf. Web Soc. Media 2023, 17, 1006–1013. [Google Scholar] [CrossRef]
- Ante, L. How Elon Musk’s Twitter Activity Moves Cryptocurrency Markets. Technol. Forecast. Soc. Chang. 2023, 186, 122112. [Google Scholar] [CrossRef]
- Kraaijeveld, O.; De Smedt, J. The Predictive Power of Public Twitter Sentiment for Forecasting Cryptocurrency Prices. J. Int. Financ. Mark. Inst. Money 2020, 65, 101188. [Google Scholar] [CrossRef]
- Burbach, L.; Halbach, P.; Plettenberg, N.; Nakayama, J.; Ziefle, M.; Calero Valdez, A. “hey, Siri”, “Ok, Google”, “Alexa”. Acceptance-Relevant Factors of Virtual Voice-Assistants. In Proceedings of the 2019 IEEE International Professional Communication Conference (ProComm), Aachen, Germany, 23–26 July 2019; IEEE: Piscateville, NJ, USA, 2019. [Google Scholar]
- Cesare, N.; Oladeji, O.; Ferryman, K.; Wijaya, D.; Hendricks-Muñoz, K.D.; Ward, A.; Nsoesie, E.O. Discussions of Miscarriage and Preterm Births on Twitter. Paediatr. Perinat. Epidemiol. 2020, 34, 544–552. [Google Scholar] [CrossRef]
- Kosenko, K.; Winderman, E.; Pugh, A. The Hijacked Hashtag: The Constitutive Features of Abortion Stigma in the #ShoutYourAbortion Twitter Campaign. Int. J. Commun. 2019, 13, 21. [Google Scholar]
- Mahoney, J.; Le Moignan, E.; Long, K.; Wilson, M.; Barnett, J.; Vines, J.; Lawson, S. Feeling Alone among 317 Million Others: Disclosures of Loneliness on Twitter. Comput. Human Behav. 2019, 98, 20–30. [Google Scholar] [CrossRef]
- Guntuku, S.C.; Schneider, R.; Pelullo, A.; Young, J.; Wong, V.; Ungar, L.; Polsky, D.; Volpp, K.G.; Merchant, R. Studying Expressions of Loneliness in Individuals Using Twitter: An Observational Study. BMJ Open 2019, 9, e030355. [Google Scholar] [CrossRef] [PubMed]
- Naaman, M.; Becker, H.; Gravano, L. Hip and Trendy: Characterizing Emerging Trends on Twitter. J. Am. Soc. Inf. Sci. Technol. 2011, 62, 902–918. [Google Scholar] [CrossRef]
- Tan, M.J.; Guan, C. Are People Happier in Locations of High Property Value? Spatial Temporal Analytics of Activity Frequency, Public Sentiment and Housing Price Using Twitter Data. Appl. Geogr. 2021, 132, 102474. [Google Scholar] [CrossRef]
- Bovet, A.; Makse, H.A. Influence of Fake News in Twitter during the 2016 US Presidential Election. Nat. Commun. 2019, 10, 7. [Google Scholar] [CrossRef]
- Ajao, O.; Bhowmik, D.; Zargari, S. Fake News Identification on Twitter with Hybrid CNN and RNN Models. In Proceedings of the 9th International Conference on Social Media and Society, Copenhagen, Denmark, 18–20 July 2018; ACM: New York, NY, USA, 2018. [Google Scholar]
- Chandra, M.; Reddy, M.; Sehgal, S.; Gupta, S.; Buduru, A.B.; Kumaraguru, P. “A Virus Has No Religion”: Analyzing Islamophobia on Twitter during the COVID-19 Outbreak. In Proceedings of the 32st ACM Conference on Hypertext and Social Media, Dublin, Ireland, 30 August–2 September 2021; ACM: New York, NY, USA, 2021. [Google Scholar]
- Bokányi, E.; Kondor, D.; Dobos, L.; Sebők, T.; Stéger, J.; Csabai, I.; Vattay, G. Race, Religion and the City: Twitter Word Frequency Patterns Reveal Dominant Demographic Dimensions in the United States. Palgrave Commun. 2016, 2, 16010. [Google Scholar] [CrossRef]
- Kostkova, P.; Szomszor, M.; St. Louis, C. #swineflu: The Use of Twitter as an Early Warning and Risk Communication Tool in the 2009 Swine Flu Pandemic. ACM Trans. Manag. Inf. Syst. 2014, 5, 1–25. [Google Scholar] [CrossRef]
- Prieto, V.M.; Matos, S.; Álvarez, M.; Cacheda, F.; Oliveira, J.L. Twitter: A Good Place to Detect Health Conditions. PLoS ONE 2014, 9, e86191. [Google Scholar] [CrossRef]
- Buccoliero, L.; Bellio, E.; Crestini, G.; Arkoudas, A. Twitter and Politics: Evidence from the US Presidential Elections 2016. J. Mark. Commun. 2020, 26, 88–114. [Google Scholar] [CrossRef]
- Ali, H.; Farman, H.; Yar, H.; Khan, Z.; Habib, S.; Ammar, A. Deep Learning-Based Election Results Prediction Using Twitter Activity. Soft Comput. 2022, 26, 7535–7543. [Google Scholar] [CrossRef]
- Tang, Y.; Hew, K.F. Using Twitter for Education: Beneficial or Simply a Waste of Time? Comput. Educ. 2017, 106, 97–118. [Google Scholar] [CrossRef]
- Carpenter, J.; Tani, T.; Morrison, S.; Keane, J. Exploring the Landscape of Educator Professional Activity on Twitter: An Analysis of 16 Education-Related Twitter Hashtags. Prof. Dev. Educ. 2022, 48, 784–805. [Google Scholar] [CrossRef]
- Rajabi, S. Grieving the Ambiguous Online: Pregnancy Loss, Meaning Making & Celebrity on Twitter. Fem. Media Stud. 2023, 1–17. [Google Scholar] [CrossRef]
- Moyer, C.A.; Compton, S.D.; Kaselitz, E.; Muzik, M. Pregnancy-Related Anxiety during COVID-19: A Nationwide Survey of 2740 Pregnant Women. Arch. Womens. Ment. Health 2020, 23, 757–765. [Google Scholar] [CrossRef]
- Goetz, S.J.; Heaton, C.; Imran, M.; Pan, Y.; Tian, Z.; Schmidt, C.; Qazi, U.; Ofli, F.; Mitra, P. Food Insufficiency and Twitter Emotions during a Pandemic. Appl. Econ. Perspect. Policy 2023, 45, 1189–1210. [Google Scholar] [CrossRef]
- Ahmad Kontar, N.A.; Mutalib, S.; Muhamed Hanum, H.F.; Abdul-Rahman, S. Exploratory Data Analysis: Food Security Risk among Twitter Users. J. Comput. Sci. Comput. Math. 2023, 13, 15–19. [Google Scholar] [CrossRef]
- Edinger, A.; Valdez, D.; Walsh-Buhi, E.; Trueblood, J.S.; Lorenzo-Luaces, L.; Rutter, L.A.; Bollen, J. Misinformation and Public Health Messaging in the Early Stages of the Mpox Outbreak: Mapping the Twitter Narrative with Deep Learning. J. Med. Internet Res. 2023, 25, e43841. [Google Scholar] [CrossRef]
- Movahedi Nia, Z.; Bragazzi, N.; Asgary, A.; Orbinski, J.; Wu, J.; Kong, J. Mpox Panic, Infodemic, and Stigmatization of the Two-Spirit, Lesbian, Gay, Bisexual, Transgender, Queer or Questioning, Intersex, Asexual Community: Geospatial Analysis, Topic Modeling, and Sentiment Analysis of a Large, Multilingual Social Media Database. J. Med. Internet Res. 2023, 25, e45108. [Google Scholar] [CrossRef]
- Wakamiya, S.; Kawai, Y.; Aramaki, E. Twitter-Based Influenza Detection after Flu Peak via Tweets with Indirect Information: Text Mining Study. JMIR Public Health Surveill. 2018, 4, e65. [Google Scholar] [CrossRef]
- Lee, K.; Agrawal, A.; Choudhary, A. Real-Time Disease Surveillance Using Twitter Data: Demonstration on Flu and Cancer. In Proceedings of the 19th ACM SIGKDD International Conference on Knowledge Discovery and Data Mining, Chicago, IL, USA, 11–14 August 2013; ACM: New York, NY, USA, 2013. [Google Scholar]
- Jain, V.K.; Kumar, S. An Effective Approach to Track Levels of Influenza-A (H1N1) Pandemic in India Using Twitter. Procedia Comput. Sci. 2015, 70, 801–807. [Google Scholar] [CrossRef]
- Ahmed, W.; Bath, P.A.; Sbaffi, L.; Demartini, G. Novel Insights into Views towards H1N1 during the 2009 Pandemic: A Thematic Analysis of Twitter Data. Health Info. Libr. J. 2019, 36, 60–72. [Google Scholar] [CrossRef] [PubMed]
- Müller, M.; Salathé, M.; Kummervold, P.E. COVID-Twitter-BERT: A Natural Language Processing Model to Analyse COVID-19 Content on Twitter. Front. Artif. Intell. 2023, 6, 1023281. [Google Scholar] [CrossRef] [PubMed]
- Zhang, Y.; Lyu, H.; Liu, Y.; Zhang, X.; Wang, Y.; Luo, J. Monitoring Depression Trends on Twitter during the COVID-19 Pandemic: Observational Study. JMIR Infodemiology 2021, 1, e26769. [Google Scholar] [CrossRef]
- Olar, M.-L.; Leba, M.; Risteiu, M. Exoskeleton—Wearable Devices. Literature Review. MATEC Web Conf. 2021, 342, 05005. [Google Scholar] [CrossRef]
- Yang, C.-J.; Zhang, J.-F.; Chen, Y.; Dong, Y.-M.; Zhang, Y. A Review of Exoskeleton-Type Systems and Their Key Technologies. Proc. Inst. Mech. Eng. Part C 2008, 222, 1599–1612. [Google Scholar] [CrossRef]
- Palazzi, E.; Luzi, L.; Dimo, E.; Meneghetti, M.; Vicario, R.; Luzia, R.F.; Vertechy, R.; Calanca, A. An Affordable Upper-Limb Exoskeleton Concept for Rehabilitation Applications. Technologies 2022, 10, 22. [Google Scholar] [CrossRef]
- Laubscher, C.A.; Goo, A.; Farris, R.J.; Sawicki, J.T. Hybrid Impedance-Sliding Mode Switching Control of the Indego Explorer Lower-Limb Exoskeleton in Able-Bodied Walking. J. Intell. Robot. Syst. 2022, 104, 76. [Google Scholar] [CrossRef]
- Zoss, A.B.; Kazerooni, H.; Chu, A. Biomechanical Design of the Berkeley Lower Extremity Exoskeleton (BLEEX). IEEE ASME Trans. Mechatron. 2006, 11, 128–138. [Google Scholar] [CrossRef]
- Høyer, E.; Opheim, A.; Jørgensen, V. Implementing the Exoskeleton Ekso GTTM for Gait Rehabilitation in a Stroke Unit—Feasibility, Functional Benefits and Patient Experiences. Disabil. Rehabil. Assist. Technol. 2022, 17, 473–479. [Google Scholar] [CrossRef]
- van Kammen, K.; Boonstra, A.M.; van der Woude, L.H.V.; Reinders-Messelink, H.A.; den Otter, R. The Combined Effects of Guidance Force, Bodyweight Support and Gait Speed on Muscle Activity during Able-Bodied Walking in the Lokomat. Clin. Biomech. 2016, 36, 65–73. [Google Scholar] [CrossRef] [PubMed]
- Gull, M.A.; Bai, S.; Bak, T. A Review on Design of Upper Limb Exoskeletons. Robotics 2020, 9, 16. [Google Scholar] [CrossRef]
- Comani, S.; Velluto, L.; Schinaia, L.; Cerroni, G.; Serio, A.; Buzzelli, S.; Sorbi, S.; Guarnieri, B. Monitoring Neuro-Motor Recovery from Stroke with High-Resolution EEG, Robotics and Virtual Reality: A Proof of Concept. IEEE Trans. Neural Syst. Rehabil. Eng. 2015, 23, 1106–1116. [Google Scholar] [CrossRef] [PubMed]
- Grimm, F.; Walter, A.; Spüler, M.; Naros, G.; Rosenstiel, W.; Gharabaghi, A. Hybrid Neuroprosthesis for the Upper Limb: Combining Brain-Controlled Neuromuscular Stimulation with a Multi-Joint Arm Exoskeleton. Front. Neurosci. 2016, 10, 367. [Google Scholar] [CrossRef]
- Sarkisian, S.V.; Ishmael, M.K.; Lenzi, T. Self-Aligning Mechanism Improves Comfort and Performance with a Powered Knee Exoskeleton. IEEE Trans. Neural Syst. Rehabil. Eng. 2021, 29, 629–640. [Google Scholar] [CrossRef]
- van der Have, A.; Rossini, M.; Rodriguez-Guerrero, C.; Van Rossom, S.; Jonkers, I. The Exo4Work Shoulder Exoskeleton Effectively Reduces Muscle and Joint Loading during Simulated Occupational Tasks above Shoulder Height. Appl. Ergon. 2022, 103, 103800. [Google Scholar] [CrossRef]
- Zahedi, A.; Wang, Y.; Martinez-Hernandez, U.; Zhang, D. A Wearable Elbow Exoskeleton for Tremor Suppression Equipped with Rotational Semi-Active Actuator. Mech. Syst. Signal Process. 2021, 157, 107674. [Google Scholar] [CrossRef]
- Peng, X.; Acosta-Sojo, Y.; Wu, M.I.; Stirling, L. Actuation Timing Perception of a Powered Ankle Exoskeleton and Its Associated Ankle Angle Changes during Walking. IEEE Trans. Neural Syst. Rehabil. Eng. 2022, 30, 869–877. [Google Scholar] [CrossRef]
- Liu, H.; Zeng, B.; Liu, X.; Zhu, X.; Song, H. Detection of Human Lifting State Based on Long Short-Term Memory for Wearable Waist Exoskeleton. In Lecture Notes in Electrical Engineering; Springer: Singapore, 2022; pp. 301–310. ISBN 9789811663277. [Google Scholar]
- Ishmael, M.K.; Archangeli, D.; Lenzi, T. A Powered Hip Exoskeleton with High Torque Density for Walking, Running, and Stair Ascent. IEEE ASME Trans. Mechatron. 2022, 27, 4561–4572. [Google Scholar] [CrossRef]
- Garosi, E.; Mazloumi, A.; Jafari, A.H.; Keihani, A.; Shamsipour, M.; Kordi, R.; Kazemi, Z. Design and Ergonomic Assessment of a Passive Head/Neck Supporting Exoskeleton for Overhead Work Use. Appl. Ergon. 2022, 101, 103699. [Google Scholar] [CrossRef]
- Song, J.; Zhu, A.; Tu, Y.; Zou, J. Multijoint Passive Elastic Spine Exoskeleton for Stoop Lifting Assistance. Int. J. Adv. Robot. Syst. 2021, 18, 172988142110620. [Google Scholar] [CrossRef]
- Dragusanu, M.; Iqbal, M.Z.; Baldi, T.L.; Prattichizzo, D.; Malvezzi, M. Design, Development, and Control of a Hand/Wrist Exoskeleton for Rehabilitation and Training. IEEE Trans. Robot. 2022, 38, 1472–1488. [Google Scholar] [CrossRef]
- Li, G.; Cheng, L.; Sun, N. Design, Manipulability Analysis and Optimization of an Index Finger Exoskeleton for Stroke Rehabilitation. Mech. Mach. Theory 2022, 167, 104526. [Google Scholar] [CrossRef]
- Bär, M.; Steinhilber, B.; Rieger, M.A.; Luger, T. The Influence of Using Exoskeletons during Occupational Tasks on Acute Physical Stress and Strain Compared to No Exoskeleton—A Systematic Review and Meta-Analysis. Appl. Ergon. 2021, 94, 103385. [Google Scholar] [CrossRef] [PubMed]
- Sawicki, G.S.; Beck, O.N.; Kang, I.; Young, A.J. The Exoskeleton Expansion: Improving Walking and Running Economy. J. Neuroeng. Rehabil. 2020, 17, 25. [Google Scholar] [CrossRef]
- Massardi, S.; Rodriguez-Cianca, D.; Pinto-Fernandez, D.; Moreno, J.C.; Lancini, M.; Torricelli, D. Characterization and Evaluation of Human–Exoskeleton Interaction Dynamics: A Review. Sensors 2022, 22, 3993. [Google Scholar] [CrossRef]
- Exoskeleton Market Size, Share & Trends Analysis Report, by Mobility, by Technology, by Extremity, by End-Use, by Region, and Segment Forecasts, 2023–2030. Available online: https://www.grandviewresearch.com/industry-analysis/exoskeleton-market (accessed on 24 September 2023).
- Bogue, R. Exoskeletons: A Review of Recent Progress. Ind. Rob. 2022, 49, 813–818. [Google Scholar] [CrossRef]
- Puyuelo-Quintana, G.; Cano-de-la-Cuerda, R.; Plaza-Flores, A.; Garces-Castellote, E.; Sanz-Merodio, D.; Goñi-Arana, A.; Marín-Ojea, J.; García-Armada, E. A New Lower Limb Portable Exoskeleton for Gait Assistance in Neurological Patients: A Proof of Concept Study. J. Neuroeng. Rehabil. 2020, 17, 60. [Google Scholar] [CrossRef]
- Sado, F.; Yap, H.J.; Ghazilla, R.A.R.; Ahmad, N. Design and Control of a Wearable Lower-Body Exoskeleton for Squatting and Walking Assistance in Manual Handling Works. Mechatronics 2019, 63, 102272. [Google Scholar] [CrossRef]
- Gandolla, M.; Dalla Gasperina, S.; Longatelli, V.; Manti, A.; Aquilante, L.; D’Angelo, M.G.; Biffi, E.; Diella, E.; Molteni, F.; Rossini, M.; et al. An Assistive Upper-Limb Exoskeleton Controlled by Multi-Modal Interfaces for Severely Impaired Patients: Development and Experimental Assessment. Rob. Auton. Syst. 2021, 143, 103822. [Google Scholar] [CrossRef]
- Breen, J.S. The Exoskeleton Generation—Disability Redux. Disabil. Soc. 2015, 30, 1568–1572. [Google Scholar] [CrossRef]
- McFarland, T.; Fischer, S. Considerations for Industrial Use: A Systematic Review of the Impact of Active and Passive Upper Limb Exoskeletons on Physical Exposures. IISE Trans. Occup. Ergon. Hum. Factors 2019, 7, 322–347. [Google Scholar] [CrossRef]
- Kim, S.; Moore, A.; Srinivasan, D.; Akanmu, A.; Barr, A.; Harris-Adamson, C.; Rempel, D.M.; Nussbaum, M.A. Potential of Exoskeleton Technologies to Enhance Safety, Health, and Performance in Construction: Industry Perspectives and Future Research Directions. IISE Trans. Occup. Ergon. Hum. Factors 2019, 7, 185–191. [Google Scholar] [CrossRef]
- Bunge, L.R.; Davidson, A.J.; Helmore, B.R.; Mavrandonis, A.D.; Page, T.D.; Schuster-Bayly, T.R.; Kumar, S. Effectiveness of Powered Exoskeleton Use on Gait in Individuals with Cerebral Palsy: A Systematic Review. PLoS ONE 2021, 16, e0252193. [Google Scholar] [CrossRef]
- Proud, J.K.; Lai, D.T.H.; Mudie, K.L.; Carstairs, G.L.; Billing, D.C.; Garofolini, A.; Begg, R.K. Exoskeleton Application to Military Manual Handling Tasks. Hum. Factors 2022, 64, 527–554. [Google Scholar] [CrossRef] [PubMed]
- Kamiński, M.; Muth, A.; Bogdański, P. Smoking, Vaping, and Tobacco Industry during COVID-19 Pandemic: Twitter Data Analysis. Cyberpsychol. Behav. Soc. Netw. 2020, 23, 811–817. [Google Scholar] [CrossRef] [PubMed]
- Souza, T.T.P.; Kolchyna, O.; Treleaven, P.C.; Aste, T. Twitter Sentiment Analysis Applied to Finance: A Case Study in the Retail Industry. arXiv 2015, arXiv:1507.00784. [Google Scholar]
- Pons, A.; Rius, J.; Vintró, C.; Gallart, A. Analysis of Twitter Posts for Evaluation of Corporate Social Responsibility in the Leather Industry. J. Eng. Fiber. Fabr. 2022, 17, 155892502211318. [Google Scholar] [CrossRef]
- Leung, X.Y.; Bai, B.; Stahura, K.A. The Marketing Effectiveness of Social Media in the Hotel Industry: A Comparison of Facebook and Twitter. J. Hosp. Tour. Res. 2015, 39, 147–169. [Google Scholar] [CrossRef]
- Misopoulos, F.; Mitic, M.; Kapoulas, A.; Karapiperis, C. Uncovering Customer Service Experiences with Twitter: The Case of Airline Industry. Manag. Decis. 2014, 52, 705–723. [Google Scholar] [CrossRef]
- Shukri, S.E.; Yaghi, R.I.; Aljarah, I.; Alsawalqah, H. Twitter Sentiment Analysis: A Case Study in the Automotive Industry. In Proceedings of the 2015 IEEE Jordan Conference on Applied Electrical Engineering and Computing Technologies (AEECT), Amman, Jordan, 3–5 November 2015. [Google Scholar]
- Criswell, J.; Canty, N. Deconstructing Social Media: An Analysis of Twitter and Facebook Use in the Publishing Industry. Publ. Res. Q. 2014, 30, 352–376. [Google Scholar] [CrossRef]
- Parganas, P.; Anagnostopoulos, C.; Chadwick, S. ‘You’Ll Never Tweet Alone’: Managing Sports Brands through Social Media. J. Brand Manag. 2015, 22, 551–568. [Google Scholar] [CrossRef]
- Paredes-Corvalan, D.; Pezoa-Fuentes, C.; Silva-Rojas, G.; Valenzuela Rojas, I.; Castillo-Vergara, M. Engagement of the E-Commerce Industry in the US, According to Twitter in the Period of the COVID-19 Pandemic. Heliyon 2023, 9, e16881. [Google Scholar] [CrossRef] [PubMed]
- Garcia-Rivera, D.; Matamoros-Rojas, S.; Pezoa-Fuentes, C.; Veas-González, I.; Vidal-Silva, C. Engagement on Twitter, a Closer Look from the Consumer Electronics Industry. J. Theor. Appl. Electron. Commer. Res. 2022, 17, 558–570. [Google Scholar] [CrossRef]
- Wonneberger, A.; Hellsten, I.R.; Jacobs, S.H.J. Hashtag Activism and the Configuration of Counterpublics: Dutch Animal Welfare Debates on Twitter. Inf. Commun. Soc. 2021, 24, 1694–1711. [Google Scholar] [CrossRef]
- Aleti, T.; Harrigan, P.; Cheong, M.; Turner, W. An Investigation of How the Australian Brewing Industry Influence Consumers on Twitter. Aust. J. Inf. Syst. 2016, 20, 1–20. [Google Scholar] [CrossRef]
- Komorowski, M.; Huu, T.D.; Deligiannis, N. Twitter Data Analysis for Studying Communities of Practice in the Media Industry. Telemat. Inform. 2018, 35, 195–212. [Google Scholar] [CrossRef]
- Ghanadpour, S.H.; Shokouhyar, S.; Pourabbasi, M. Effective End of life (EOL) Products Management in Mobile Phone Industry with Using Twitter Data Analysis Perspective. Environ. Dev. Sustain. 2023, 25, 11337–11366. [Google Scholar] [CrossRef]
- Durand-Moreau, Q.; Mackenzie, G.; Adisesh, A.; Straube, S.; Chan, X.H.S.; Zelyas, N.; Greenhalgh, T. Twitter Analytics to Inform Provisional Guidance for COVID-19 Challenges in the Meatpacking Industry. Ann. Work Expo. Health 2021, 65, 373–376. [Google Scholar] [CrossRef]
- Casadei, P.; Lee, N. Global Cities, Creative Industries and Their Representation on Social Media: A Micro-Data Analysis of Twitter Data on the Fashion Industry. Environ. Plan. A 2020, 52, 1195–1220. [Google Scholar] [CrossRef]
- Sama, T.B.; Konttinen, I.; Hiilamo, H. Alcohol Industry Arguments for Liberalizing Alcohol Policy in Finland: Analysis of Twitter Data. J. Stud. Alcohol Drugs 2021, 82, 279–287. [Google Scholar] [CrossRef] [PubMed]
- Cramer, H.; Büttner, S. Things That Tweet, Check-in and Are Befriended: Two Explorations on Robotics & Social Media. In Proceedings of the 6th International Conference on Human-Robot Interaction, Lausanne, Switzerland, 6–9 March 2011; ACM: New York, NY, USA, 2011. [Google Scholar]
- Salzmann-Erikson, M.; Eriksson, H. Absorbability, Applicability and Availability in Nursing and Care Robots: A Thematic Analysis of Twitter Postings. Telemat. Inform. 2018, 35, 1553–1560. [Google Scholar] [CrossRef]
- Fraser, K.C.; Zeller, F.; Smith, D.H.; Mohammad, S.; Rudzicz, F. How Do We Feel When a Robot Dies? Emotions Expressed on Twitter before and after Hitch. In Proceedings of the Tenth Workshop on Computational Approaches to Subjectivity, Sentiment and Social Media Analysis, Minneapolis, MN, USA, 6 June 2019; Association for Computational Linguistics: Stroudsburg, PA, USA, 2019; pp. 62–71. [Google Scholar]
- Mubin, O.; Khan, A.; Obaid, M. #naorobot: Exploring Nao Discourse on Twitter. In Proceedings of the 28th Australian Conference on Computer-Human Interaction—OzCHI ′16, Tasmania, Australia, 29 November–2 December 2016; ACM Press: New York, NY, USA, 2016. [Google Scholar]
- Barakeh, Z.A.; Alkork, S.; Karar, A.S.; Said, S.; Beyrouthy, T. Pepper Humanoid Robot as a Service Robot: A Customer Approach. In Proceedings of the 2019 3rd International Conference on Bio-Engineering for Smart Technologies (BioSMART), Paris, France, 24–26 April 2019. [Google Scholar]
- Mahmud, J.; Fei, G.; Xu, A.; Pal, A.; Zhou, M. Predicting Attitude and Actions of Twitter Users. In Proceedings of the 21st International Conference on Intelligent User Interfaces, Sonoma, CA, USA, 7–10 March 2016; ACM: New York, NY, USA, 2016. [Google Scholar]
- Yamanoue, T.; Yoshimura, K.; Oda, K.; Shimozono, K. A Wearable LED Matrix Sign System Which Shows a Tweet of Twitter and Its Application to Campus Guiding and Emergency Evacuation. In Proceedings of the 2015 ACM SIGUCCS Annual Conference, St. Petersburg, FL, USA, 9–13 November 2015; ACM: New York, NY, USA, 2015. [Google Scholar]
- Tussyadiah, I. Expectation of Travel Experiences with Wearable Computing Devices. In Information and Communication Technologies in Tourism 2014; Springer International Publishing: Cham, Switzerland, 2013; pp. 539–552. ISBN 9783319039725. [Google Scholar]
- Saxena, R.C.; Lehmann, A.E.; Hight, A.E.; Darrow, K.; Remenschneider, A.; Kozin, E.D.; Lee, D.J. Social Media Utilization in the Cochlear Implant Community. J. Am. Acad. Audiol. 2015, 26, 197–204. [Google Scholar] [CrossRef]
- Adidharma, W.; Latack, K.R.; Colohan, S.M.; Morrison, S.D.; Cederna, P.S. Breast Implant Illness: Are Social Media and the Internet Worrying Patients Sick? Plast. Reconstr. Surg. 2020, 145, 225e–227e. [Google Scholar] [CrossRef] [PubMed]
- Pillarisetti, L.; Kerr, B.R.; Moreno, M. Exploring the Discussion of Nexplanon (Etonogestrel Birth Control Implant) on Twitter. Available online: https://digitalhealth.med.brown.edu/sites/default/files/Lekha%20P.pdf (accessed on 24 September 2023).
- Keane, G.; Chi, D.; Ha, A.Y.; Myckatyn, T.M. En Bloc Capsulectomy for Breast Implant Illness: A Social Media Phenomenon? Aesthet. Surg. J. 2021, 41, 448–459. [Google Scholar] [CrossRef] [PubMed]
- Sinha, N.; Singh, P.; Gupta, M.; Singh, P. Robotics at Workplace: An Integrated Twitter Analytics—SEM Based Approach for Behavioral Intention to Accept. Int. J. Inf. Manage. 2020, 55, 102210. [Google Scholar] [CrossRef]
- El-Gayar, O.; Nasralah, T.; Elnoshokaty, A. Wearable Devices for Health and Wellbeing: Design Insights from Twitter. In Proceedings of the Hawaii International Conference on System Sciences 2019 (HICSS-52), Grand Wailea, HI, USA, 8–11 January 2019. [Google Scholar]
- Jeong, W.-K.; Shin, D.-H. Analyzing Smart Watch Recognition and Response in Korea Using Text Mining Analysis Focusing on Twitter. J. Digit. Contents Soc. 2023, 24, 195–204. [Google Scholar] [CrossRef]
- Niininen, O.; Singaraju, S.; Arango, L. The Human RFID Implants Introduce a New Level of Human-Computer Interaction: Twitter Topic Detection Gauges Consumer Opinions. Available online: https://easychair.org/publications/preprint/5rMB (accessed on 24 September 2023).
- Thakur, N. Twitter Big Data as a Resource for Exoskeleton Research: A Large-Scale Dataset of about 140,000 Tweets from 2017–2022 and 100 Research Questions. Analytics 2022, 1, 72–97. [Google Scholar] [CrossRef]
- Mierswa, I.; Wurst, M.; Klinkenberg, R.; Scholz, M.; Euler, T. YALE: Rapid Prototyping for Complex Data Mining Tasks. In Proceedings of the 12th ACM SIGKDD International Conference on Knowledge Discovery and Data Mining, Philadelphia, PA, USA, 20–23 August 2006; ACM: New York, NY, USA, 2006. [Google Scholar]
- Twitter Advanced Search. Available online: https://twitter.com/search-advanced?lang=en (accessed on 24 September 2023).
- Wilkinson, M.D.; Dumontier, M.; Aalbersberg, I.J.; Appleton, G.; Axton, M.; Baak, A.; Blomberg, N.; Boiten, J.-W.; da Silva Santos, L.B.; Bourne, P.E.; et al. The FAIR Guiding Principles for Scientific Data Management and Stewardship. Sci. Data 2016, 3, 160018. [Google Scholar] [CrossRef]
- Xue, J.; Chen, J.; Chen, C.; Zheng, C.; Li, S.; Zhu, T. Public Discourse and Sentiment during the COVID 19 Pandemic: Using Latent Dirichlet Allocation for Topic Modeling on Twitter. PLoS ONE 2020, 15, e0239441. [Google Scholar] [CrossRef]
- Rezapour, R.; Wang, L.; Abdar, O.; Diesner, J. Identifying the Overlap between Election Result and Candidates’ Ranking Based on Hashtag-Enhanced, Lexicon-Based Sentiment Analysis. In Proceedings of the 2017 IEEE 11th International Conference on Semantic Computing (ICSC), San Diego, CA, USA, 30 January–1 February 2017. [Google Scholar]
- Qaseem, D.M.; Ali, N.; Akram, W.; Ullah, A.; Polat, K. Movie Success-Rate Prediction System through Optimal Sentiment Analysis. Available online: https://iecscience.org/public/uploads/jpapers/202210/63jv6Sz1Y6sdsUtnflF9dmTy3XyB2JHLZ2IGClPo.pdf (accessed on 24 September 2023).
- Bokaee Nezhad, Z.; Deihimi, M.A. Twitter Sentiment Analysis from Iran about COVID 19 Vaccine. Diabetes Metab. Syndr. 2022, 16, 102367. [Google Scholar] [CrossRef]
- Swathi, T.; Kasiviswanath, N.; Rao, A.A. An Optimal Deep Learning-Based LSTM for Stock Price Prediction Using Twitter Sentiment Analysis. Appl. Intell. 2022, 52, 13675–13688. [Google Scholar] [CrossRef]
- Manias, G.; Mavrogiorgou, A.; Kiourtis, A.; Symvoulidis, C.; Kyriazis, D. Multilingual Text Categorization and Sentiment Analysis: A Comparative Analysis of the Utilization of Multilingual Approaches for Classifying Twitter Data. Neural Comput. Appl. 2023, 35, 21415–21431. [Google Scholar] [CrossRef] [PubMed]
- Sunitha, D.; Patra, R.K.; Babu, N.V.; Suresh, A.; Gupta, S.C. Twitter Sentiment Analysis Using Ensemble Based Deep Learning Model towards COVID-19 in India and European Countries. Pattern Recognit. Lett. 2022, 158, 164–170. [Google Scholar] [CrossRef] [PubMed]
- Giachanou, A.; Crestani, F. Like It or Not: A Survey of Twitter Sentiment Analysis Methods. ACM Comput. Surv. 2017, 49, 1–41. [Google Scholar] [CrossRef]
- Bhuta, S.; Doshi, U. A Review of Techniques for Sentiment Analysis of Twitter Data. In Proceedings of the 2014 International Conference on Issues and Challenges in Intelligent Computing Techniques (ICICT), Ghaziabad, India, 7–8 February 2014. [Google Scholar]
- Hutto, C.; Gilbert, E. VADER: A Parsimonious Rule-Based Model for Sentiment Analysis of Social Media Text. Proc. Int. AAAI Conf. Web Soc. Media 2014, 8, 216–225. [Google Scholar] [CrossRef]
- González-Ibáñez, R.; Muresan, S.; Wacholder, N. Identifying Sarcasm in Twitter: A Closer Look. Available online: https://aclanthology.org/P11-2102.pdf (accessed on 24 September 2023).
- Reyes, A.; Rosso, P.; Buscaldi, D. From Humor Recognition to Irony Detection: The Figurative Language of Social Media. Data Knowl. Eng. 2012, 74, 1–12. [Google Scholar] [CrossRef]
- Moores, B.; Mago, V. A Survey on Automated Sarcasm Detection on Twitter. arXiv 2022, arXiv:2202.02516. [Google Scholar]
- Kunneman, F.; Liebrecht, C.; van Mulken, M.; van den Bosch, A. Signaling Sarcasm: From Hyperbole to Hashtag. Inf. Process. Manag. 2015, 51, 500–509. [Google Scholar] [CrossRef]
- Kreuz, R.J.; Caucci, G.M. Lexical Influences on the Perception of Sarcasm. Available online: https://aclanthology.org/W07-0101.pdf (accessed on 24 September 2023).
- Phuvipadawat, S.; Murata, T. Breaking News Detection and Tracking in Twitter. In Proceedings of the 2010 IEEE/WIC/ACM International Conference on Web Intelligence and Intelligent Agent Technology, Toronto, ON, Canada, 31 August–3 September 2010. [Google Scholar]
- Bruns, A.; Burgess, J. Researching News Discussion on Twitter: New Methodologies. J. Stud. 2012, 13, 801–814. [Google Scholar] [CrossRef]
- J-Hartmann/Emotion-English-Distilroberta-Base · Hugging Face. Available online: https://huggingface.co/j-hartmann/emotion-english-distilroberta-base? (accessed on 25 September 2023).
- Roberge, J.-M. Using Data from Online Social Networks in Conservation Science: Which Species Engage People the Most on Twitter? Biodivers. Conserv. 2014, 23, 715–726. [Google Scholar] [CrossRef]
- Gallagher, J. Paralysed Man Moves in Mind-Reading Exoskeleton. Available online: https://www.bbc.co.uk/news/health-49907356 (accessed on 11 October 2023).
- Gallagher, J. Paralysed Man Moves in Mind-Reading Exoskeleton. Available online: https://www.bbc.com/news/health-49907356 (accessed on 11 October 2023).
- Twitter’s Inactive Account Policy. Available online: https://help.twitter.com/en/rules-and-policies/inactive-twitter-accounts (accessed on 13 September 2023).
- Heo, P.; Gu, G.M.; Lee, S.-J.; Rhee, K.; Kim, J. Current Hand Exoskeleton Technologies for Rehabilitation and Assistive Engineering. Int. J. Precis. Eng. Manuf. 2012, 13, 807–824. [Google Scholar] [CrossRef]
- Orellana-Rodriguez, C.; Keane, M.T. Attention to News and Its Dissemination on Twitter: A Survey. Comput. Sci. Rev. 2018, 29, 74–94. [Google Scholar] [CrossRef]
- Bass, K.; Haro, L.; Liu, X.; Liu, J. A Content Analysis: The Relationship between Sentiment, Gender and Time of Day in EWOM. Available online: https://digitalcommons.georgiasouthern.edu/amtp-proceedings_2016/6/ (accessed on 10 October 2023).
- Heggde, G.; Shainesh, G. (Eds.) Social Media Marketing; Springer: Singapore, 2018; ISBN 9789811053221. [Google Scholar]
- Atherton, J. Social Media Strategy: A Practical Guide to Social Media Marketing and Customer Engagement; Kogan Page: London, UK, 2023; ISBN 9781398610002. [Google Scholar]
- Hota, C.; Upadhyaya, S.; Al-Karaki, J.N. Advances in Secure Knowledge Management in the Big Data Era. Inf. Syst. Front. 2015, 17, 983–986. [Google Scholar] [CrossRef]
- Liu, Y.; Tarigan, B. Effects of Promotion Tweets on the Number of Followers in Micro-Blogging Site. In Proceedings of the 18th Annual International Conference on Electronic Commerce e-Commerce in Smart connected World—ICEC ′16, Suwon, Republic of Korea, 17–19 August 2016; ACM Press: New York, NY, USA, 2016. [Google Scholar]
- Bruns, A.; Burgess, J. This Is the Author’s Version of a Work That Was Submitted/Accepted for Pub-Lication in the Following Source. Available online: https://citeseerx.ist.psu.edu/document?repid=rep1&type=pdf&doi=21c79c33f41abb61bb2dbe6ac3b11603557194d7 (accessed on 10 October 2023).
- Wang, R.; Liu, W.; Gao, S. Hashtags and Information Virality in Networked Social Movement: Examining Hashtag Co-Occurrence Patterns. Online Inf. Rev. 2016, 40, 850–866. [Google Scholar] [CrossRef]
- Kwon, S.; Ha, S. Examining Identity- and Bond-Based Hashtag Community Identification: The Moderating Role of Self-Brand Connections. J. Res. Interact. Mark. 2023, 17, 78–93. [Google Scholar] [CrossRef]
- Nesi, P.; Pantaleo, G.; Paoli, I.; Zaza, I. Assessing the ReTweet Proneness of Tweets: Predictive Models for Retweeting. Multimed. Tools Appl. 2018, 77, 26371–26396. [Google Scholar] [CrossRef]
- Erz, A.; Marder, B.; Osadchaya, E. Hashtags: Motivational Drivers, Their Use, and Differences between Influencers and Followers. Comput. Human Behav. 2018, 89, 48–60. [Google Scholar] [CrossRef]
- Berger, J.; Milkman, K.L. What Makes Online Content Viral? J. Mark. Res. 2012, 49, 192–205. [Google Scholar] [CrossRef]
- Jenders, M.; Kasneci, G.; Naumann, F. Analyzing and Predicting Viral Tweets. In Proceedings of the 22nd International Conference on World Wide Web, Rio de Janeiro, Brazil, 13–17 May 2013; ACM: New York, NY, USA, 2013. [Google Scholar]
- Tao, K.; Abel, F.; Hauff, C.; Houben, G.-J. What Makes a Tweet Relevant for a Topic? Available online: https://citeseerx.ist.psu.edu/document?repid=rep1&type=pdf&doi=f7a68fa2ad7f9b191f52f17daf510b5d092e26ea (accessed on 10 October 2023).
- Neubig, G.; Duh, K. How Much Is Said in a Tweet? A Multilingual, Information-Theoretic Perspective. Available online: https://cdn.aaai.org/ocs/5698/5698-24475-1-PB.pdf (accessed on 10 October 2023).
- Nam, H.; Joshi, Y.V.; Kannan, P.K. Harvesting Brand Information from Social Tags. J. Mark. 2017, 81, 88–108. [Google Scholar] [CrossRef]
- Kähr, A.; Nyffenegger, B.; Krohmer, H.; Hoyer, W.D. When Hostile Consumers Wreak Havoc on Your Brand: The Phenomenon of Consumer Brand Sabotage. J. Mark. 2016, 80, 25–41. [Google Scholar] [CrossRef]
- Library. Archives Canada Item—Theses Canada. Available online: https://library-archives.canada.ca/eng/services/services-libraries/theses/Pages/item.aspx?idNumber=1032942605 (accessed on 10 October 2023).
- Bhargava, Y. Tanishq Withdraws Advertisement on Inter-Faith Marriage Following Social Media Criticism. Available online: https://www.thehindu.com/news/national/tanishq-withdraws-advertisement-on-inter-faith-marriage-following-social-media-criticism/article32841428.ece (accessed on 10 October 2023).
- Shetty, A.S.; Anand, K.; Shree, S.; Rachel Debby, F. Tanishq: Brand Activism Gone Wrong? Vis. J. Bus. Perspect. 2023. [Google Scholar] [CrossRef]


| Attribute Name | Description |
|---|---|
| Row no. | Row number of the data |
| Id | ID of the Tweet |
| Created-At | Date and time when the Tweet was posted |
| From-User | Twitter username of the user who posted the Tweet |
| From-User-Id | Twitter User ID of the user who posted the Tweet |
| To-User | Twitter username of the user whose Tweet was replied to (if the Tweet was a reply) in the current Tweet |
| To-User-Id | Twitter user ID of the user whose Tweet was replied to (if the Tweet was a reply) in the current Tweet |
| Language | Language of the Tweet |
| Source | Source of the Tweet to determine if the Tweet was posted from an Android source, Twitter website, etc. |
| Text | Complete text of the Tweet, including embedded URLs |
| Geo-Location-Latitude | Geo-location (latitude) of the user posting the Tweet |
| Geo-Location-Longitude | Geo-location (longitude) of the user posting the Tweet |
| Retweet Count | Retweet count of the Tweet |
| Description | p-Value |
|---|---|
| Number of Tweets per hour and the number of characters (mean) used in Tweets per hour | 0.0138 |
| Number of Tweets per hour and the number of characters (median) used in Tweets per hour | 0.0098 |
| Number of Tweets per hour and the number of hashtags used in Tweets per hour | 0.0006 |
| Number of Tweets per hour and the number of user mentions used in Tweets per hour | 2.44 × 10⁻¹³ |
| Work | CA of Tweets about Robots or Robotic Solutions | CA of Tweets about Wearables (including Wearable Robotics) | SA of Tweets about Robots or Robotic Solutions | SA of Tweets about Robots (Including Wearable Robotics) | Fine Grain SA of Tweets about Wearable Robotics | MLR Model to Predict Tweets about Wearable Robotics |
|---|---|---|---|---|---|---|
| Cramer et al. [98] | √ | |||||
| Salzmann-Erikson et al. [99] | √ | |||||
| Fraser et al. [100] | √ | |||||
| Mubin et al. [101] | √ | |||||
| Barakeh et al. [102] | √ | |||||
| Mahmud et al. [103] | √ | |||||
| Yamanoue et al. [104] | √ | |||||
| Tussyadiah et al. [105] | √ | |||||
| Saxena et al. [106] | √ | |||||
| Adidharma et al. [107] | √ | |||||
| Pillarisetti et al. [108] | √ | |||||
| Keane et al. [109] | √ | |||||
| Sinha et al. [110] | √ | |||||
| El-Gayar et al. [111] | √ | |||||
| Jeong et al. [112] | √ | |||||
| Niininen et al. [113] | √ | |||||
| Thakur et al. [this work] | √ | √ | √ | √ | √ | √ |
Disclaimer/Publisher’s Note: The statements, opinions and data contained in all publications are solely those of the individual author(s) and contributor(s) and not of MDPI and/or the editor(s). MDPI and/or the editor(s) disclaim responsibility for any injury to people or property resulting from any ideas, methods, instructions or products referred to in the content. |
© 2023 by the authors. Licensee MDPI, Basel, Switzerland. This article is an open access article distributed under the terms and conditions of the Creative Commons Attribution (CC BY) license (https://creativecommons.org/licenses/by/4.0/).
Share and Cite
Thakur, N.; Patel, K.A.; Poon, A.; Shah, R.; Azizi, N.; Han, C. A Comprehensive Analysis and Investigation of the Public Discourse on Twitter about Exoskeletons from 2017 to 2023. Future Internet 2023, 15, 346. https://doi.org/10.3390/fi15100346
Thakur N, Patel KA, Poon A, Shah R, Azizi N, Han C. A Comprehensive Analysis and Investigation of the Public Discourse on Twitter about Exoskeletons from 2017 to 2023. Future Internet. 2023; 15(10):346. https://doi.org/10.3390/fi15100346
Chicago/Turabian StyleThakur, Nirmalya, Kesha A. Patel, Audrey Poon, Rishika Shah, Nazif Azizi, and Changhee Han. 2023. "A Comprehensive Analysis and Investigation of the Public Discourse on Twitter about Exoskeletons from 2017 to 2023" Future Internet 15, no. 10: 346. https://doi.org/10.3390/fi15100346
APA StyleThakur, N., Patel, K. A., Poon, A., Shah, R., Azizi, N., & Han, C. (2023). A Comprehensive Analysis and Investigation of the Public Discourse on Twitter about Exoskeletons from 2017 to 2023. Future Internet, 15(10), 346. https://doi.org/10.3390/fi15100346