Landscape Topoedaphic Features Create Refugia from Drought and Insect Disturbance in a Lodgepole and Whitebark Pine Forest


Abstract
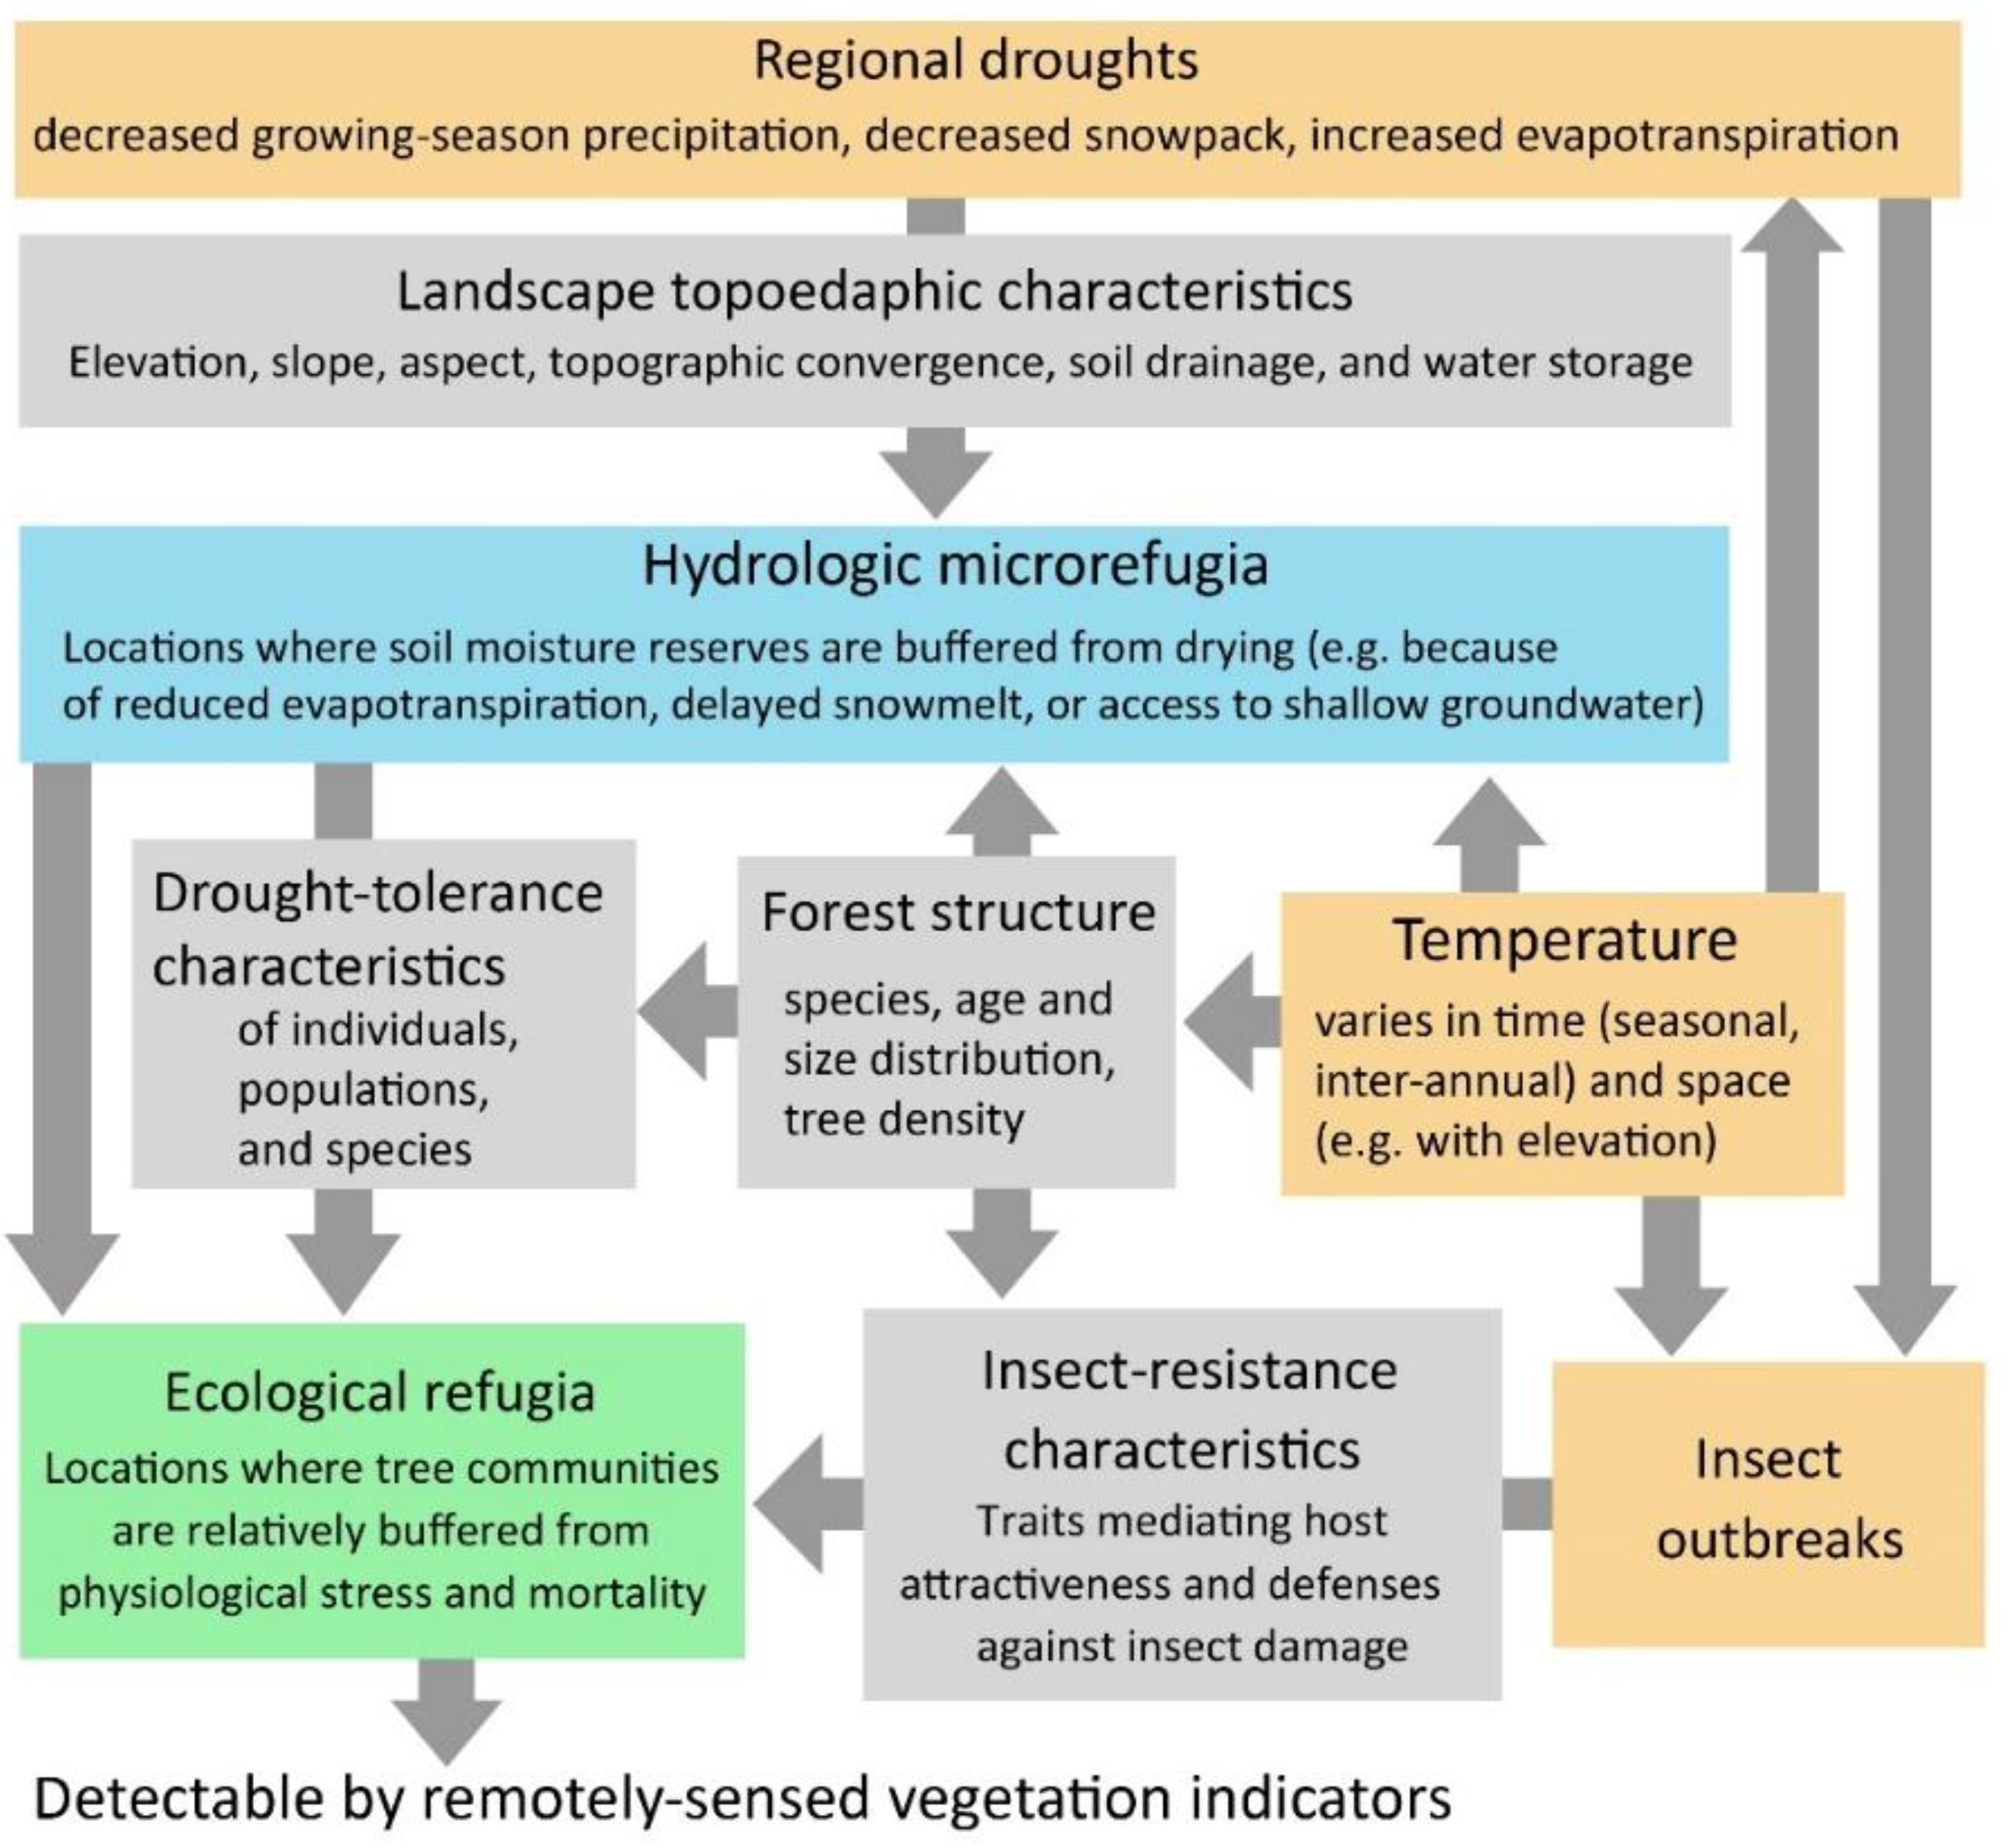
1. Introduction
2. Materials and Methods
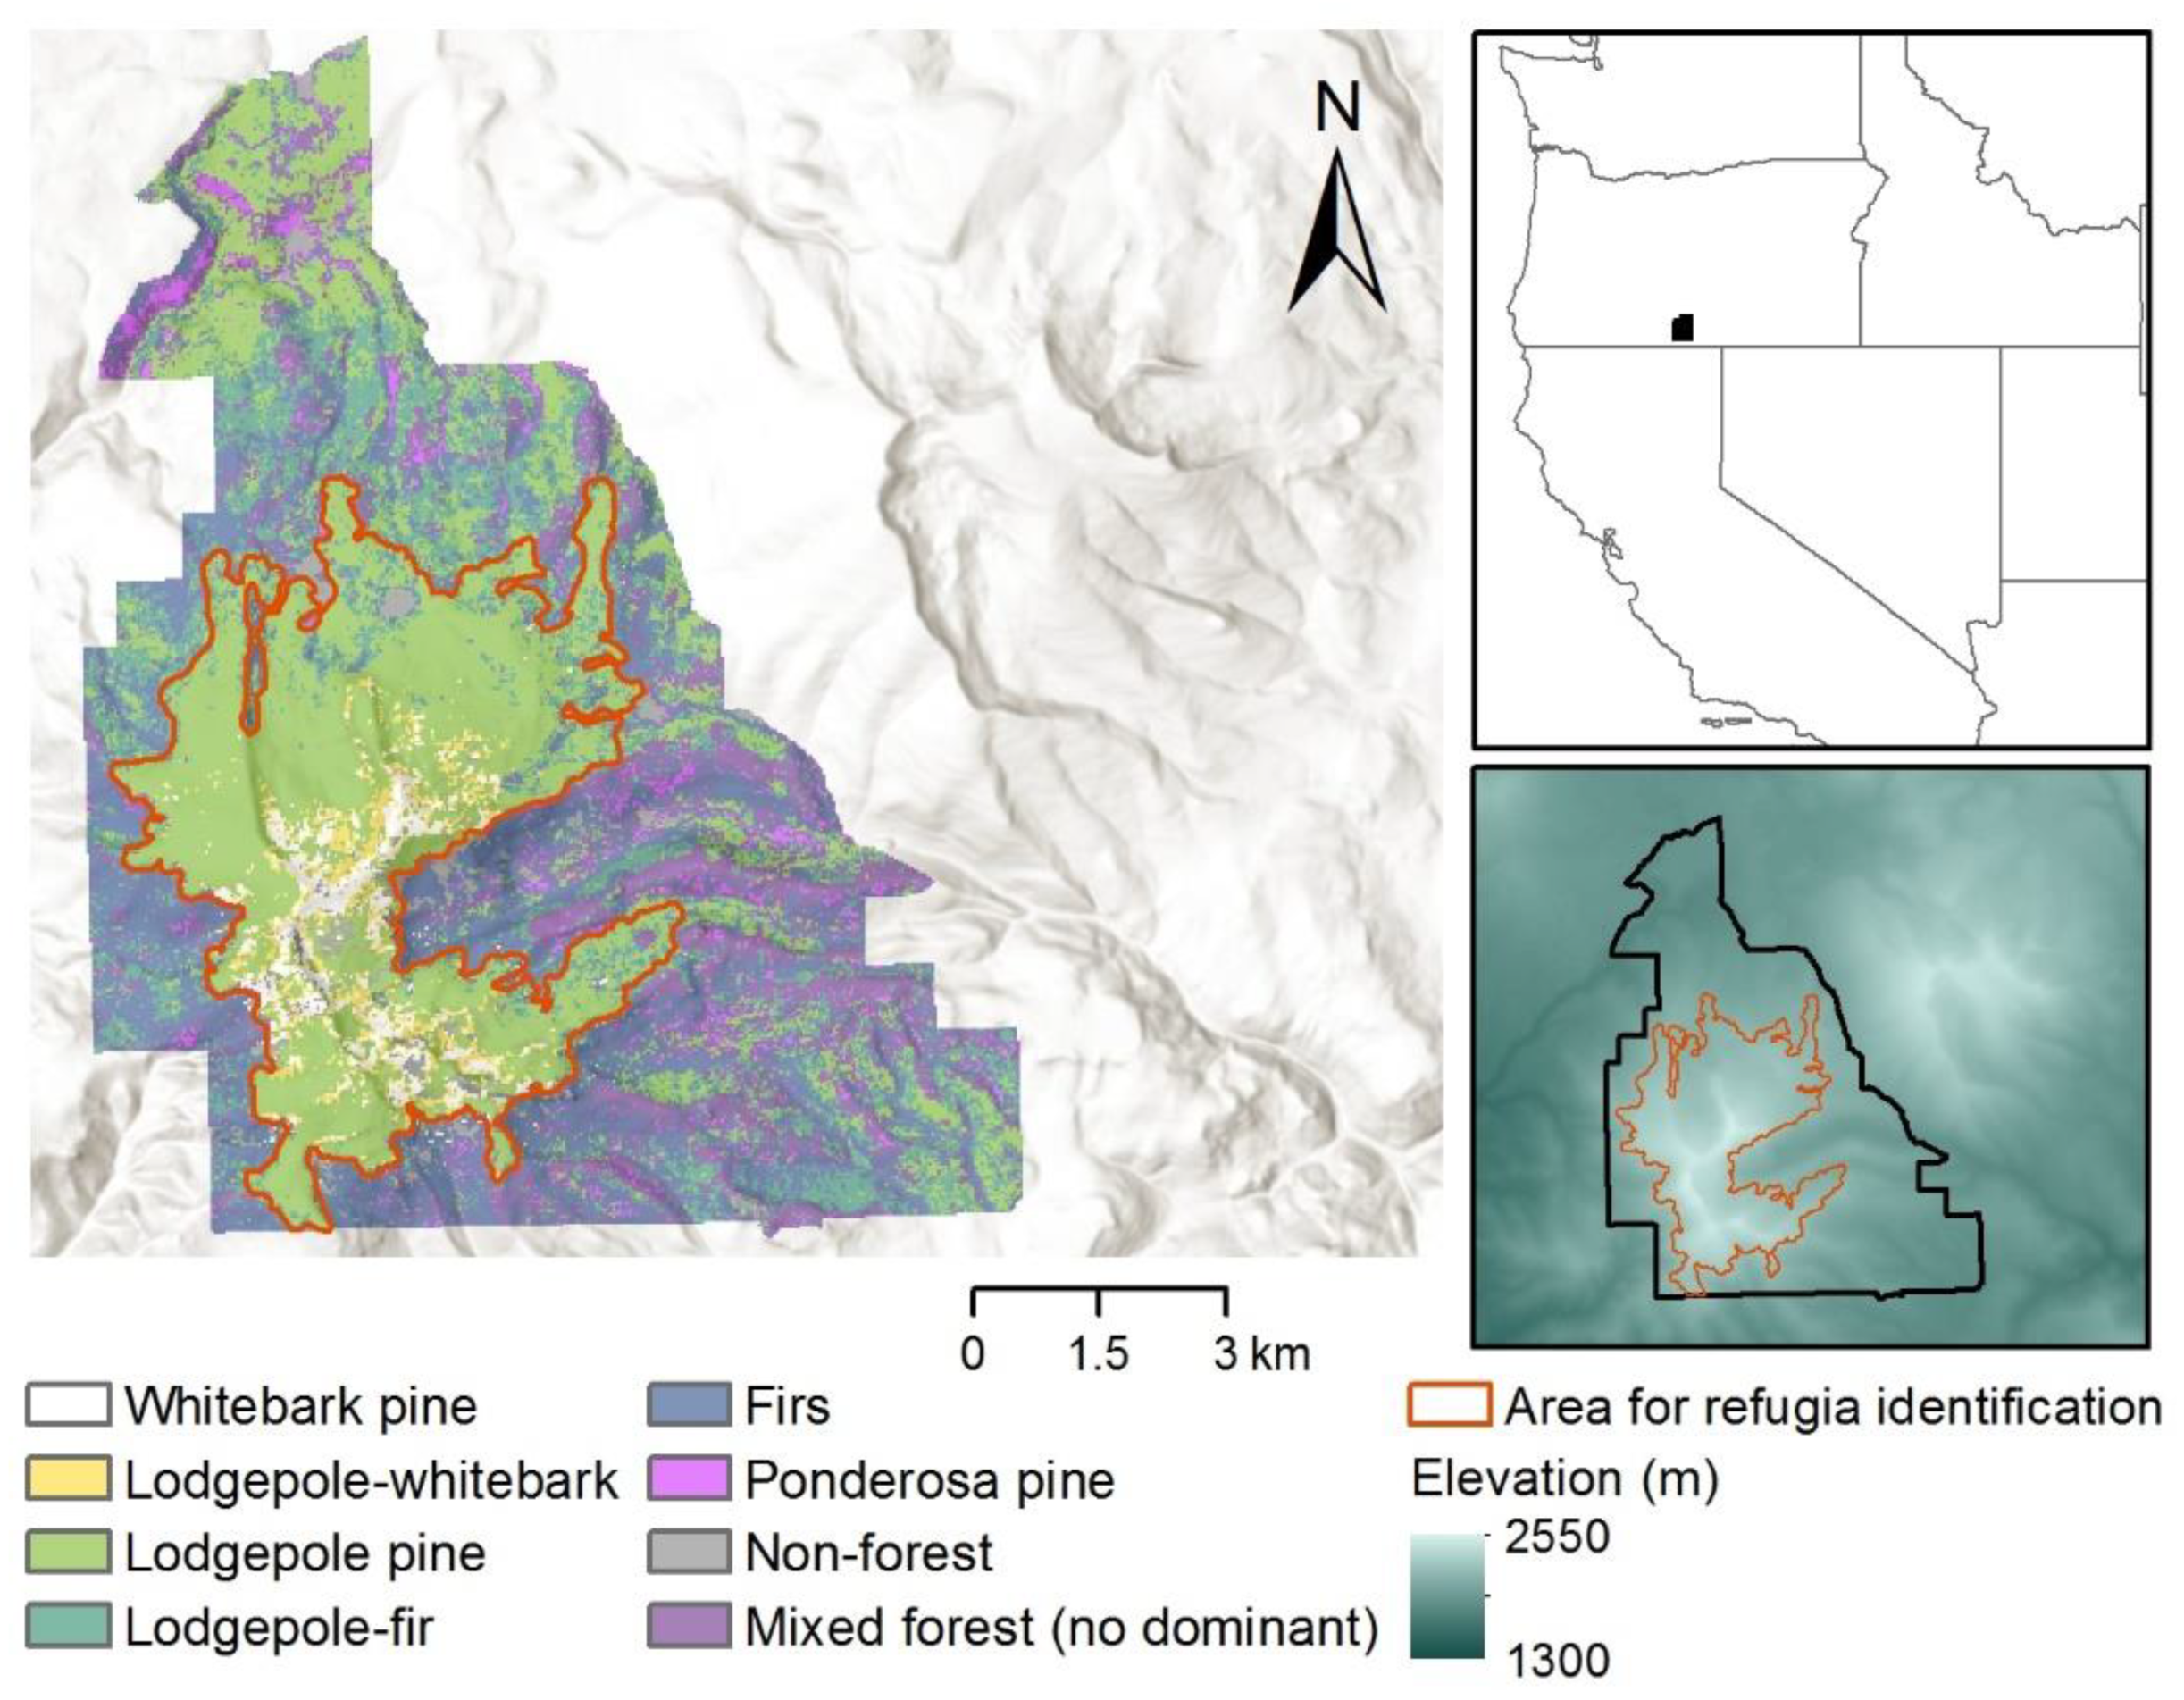
2.1. Study Area
2.2. Vegetation Classification
2.3. Disturbance Histories and Drought Identification
2.4. Landsat Images
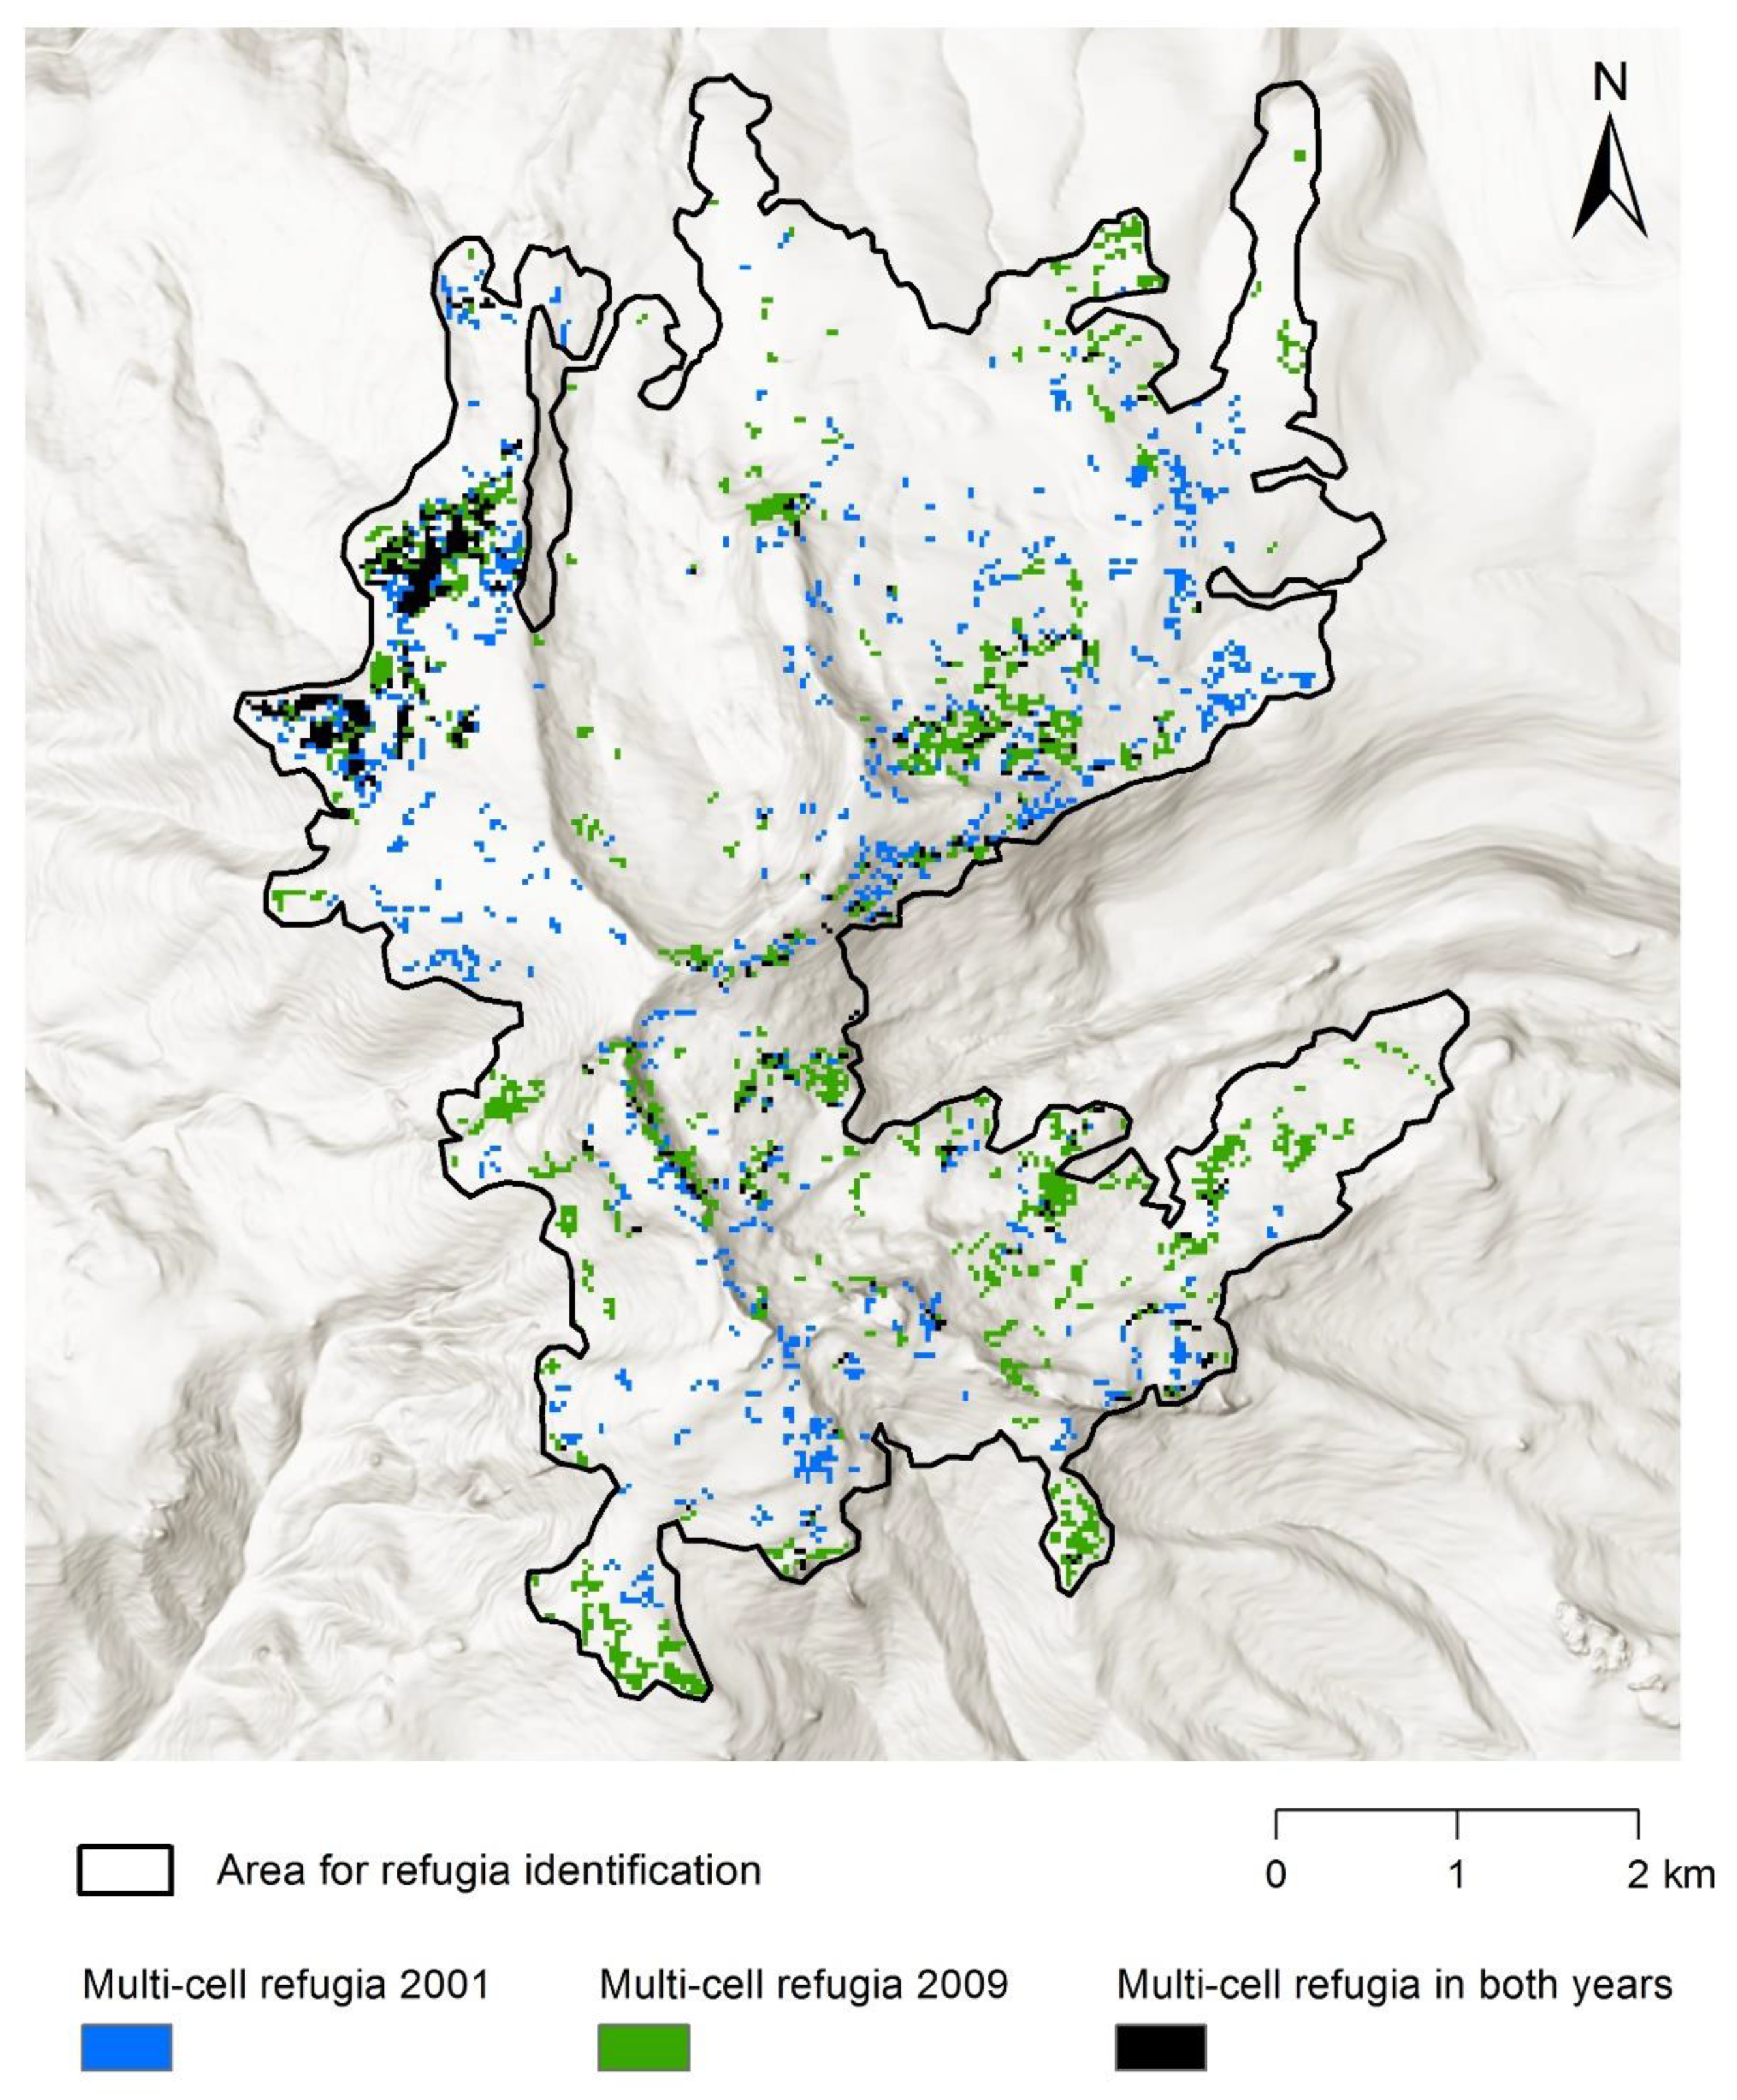
2.5. Identification of Refugia
2.6. Landscape Controls on Refugia
3. Results
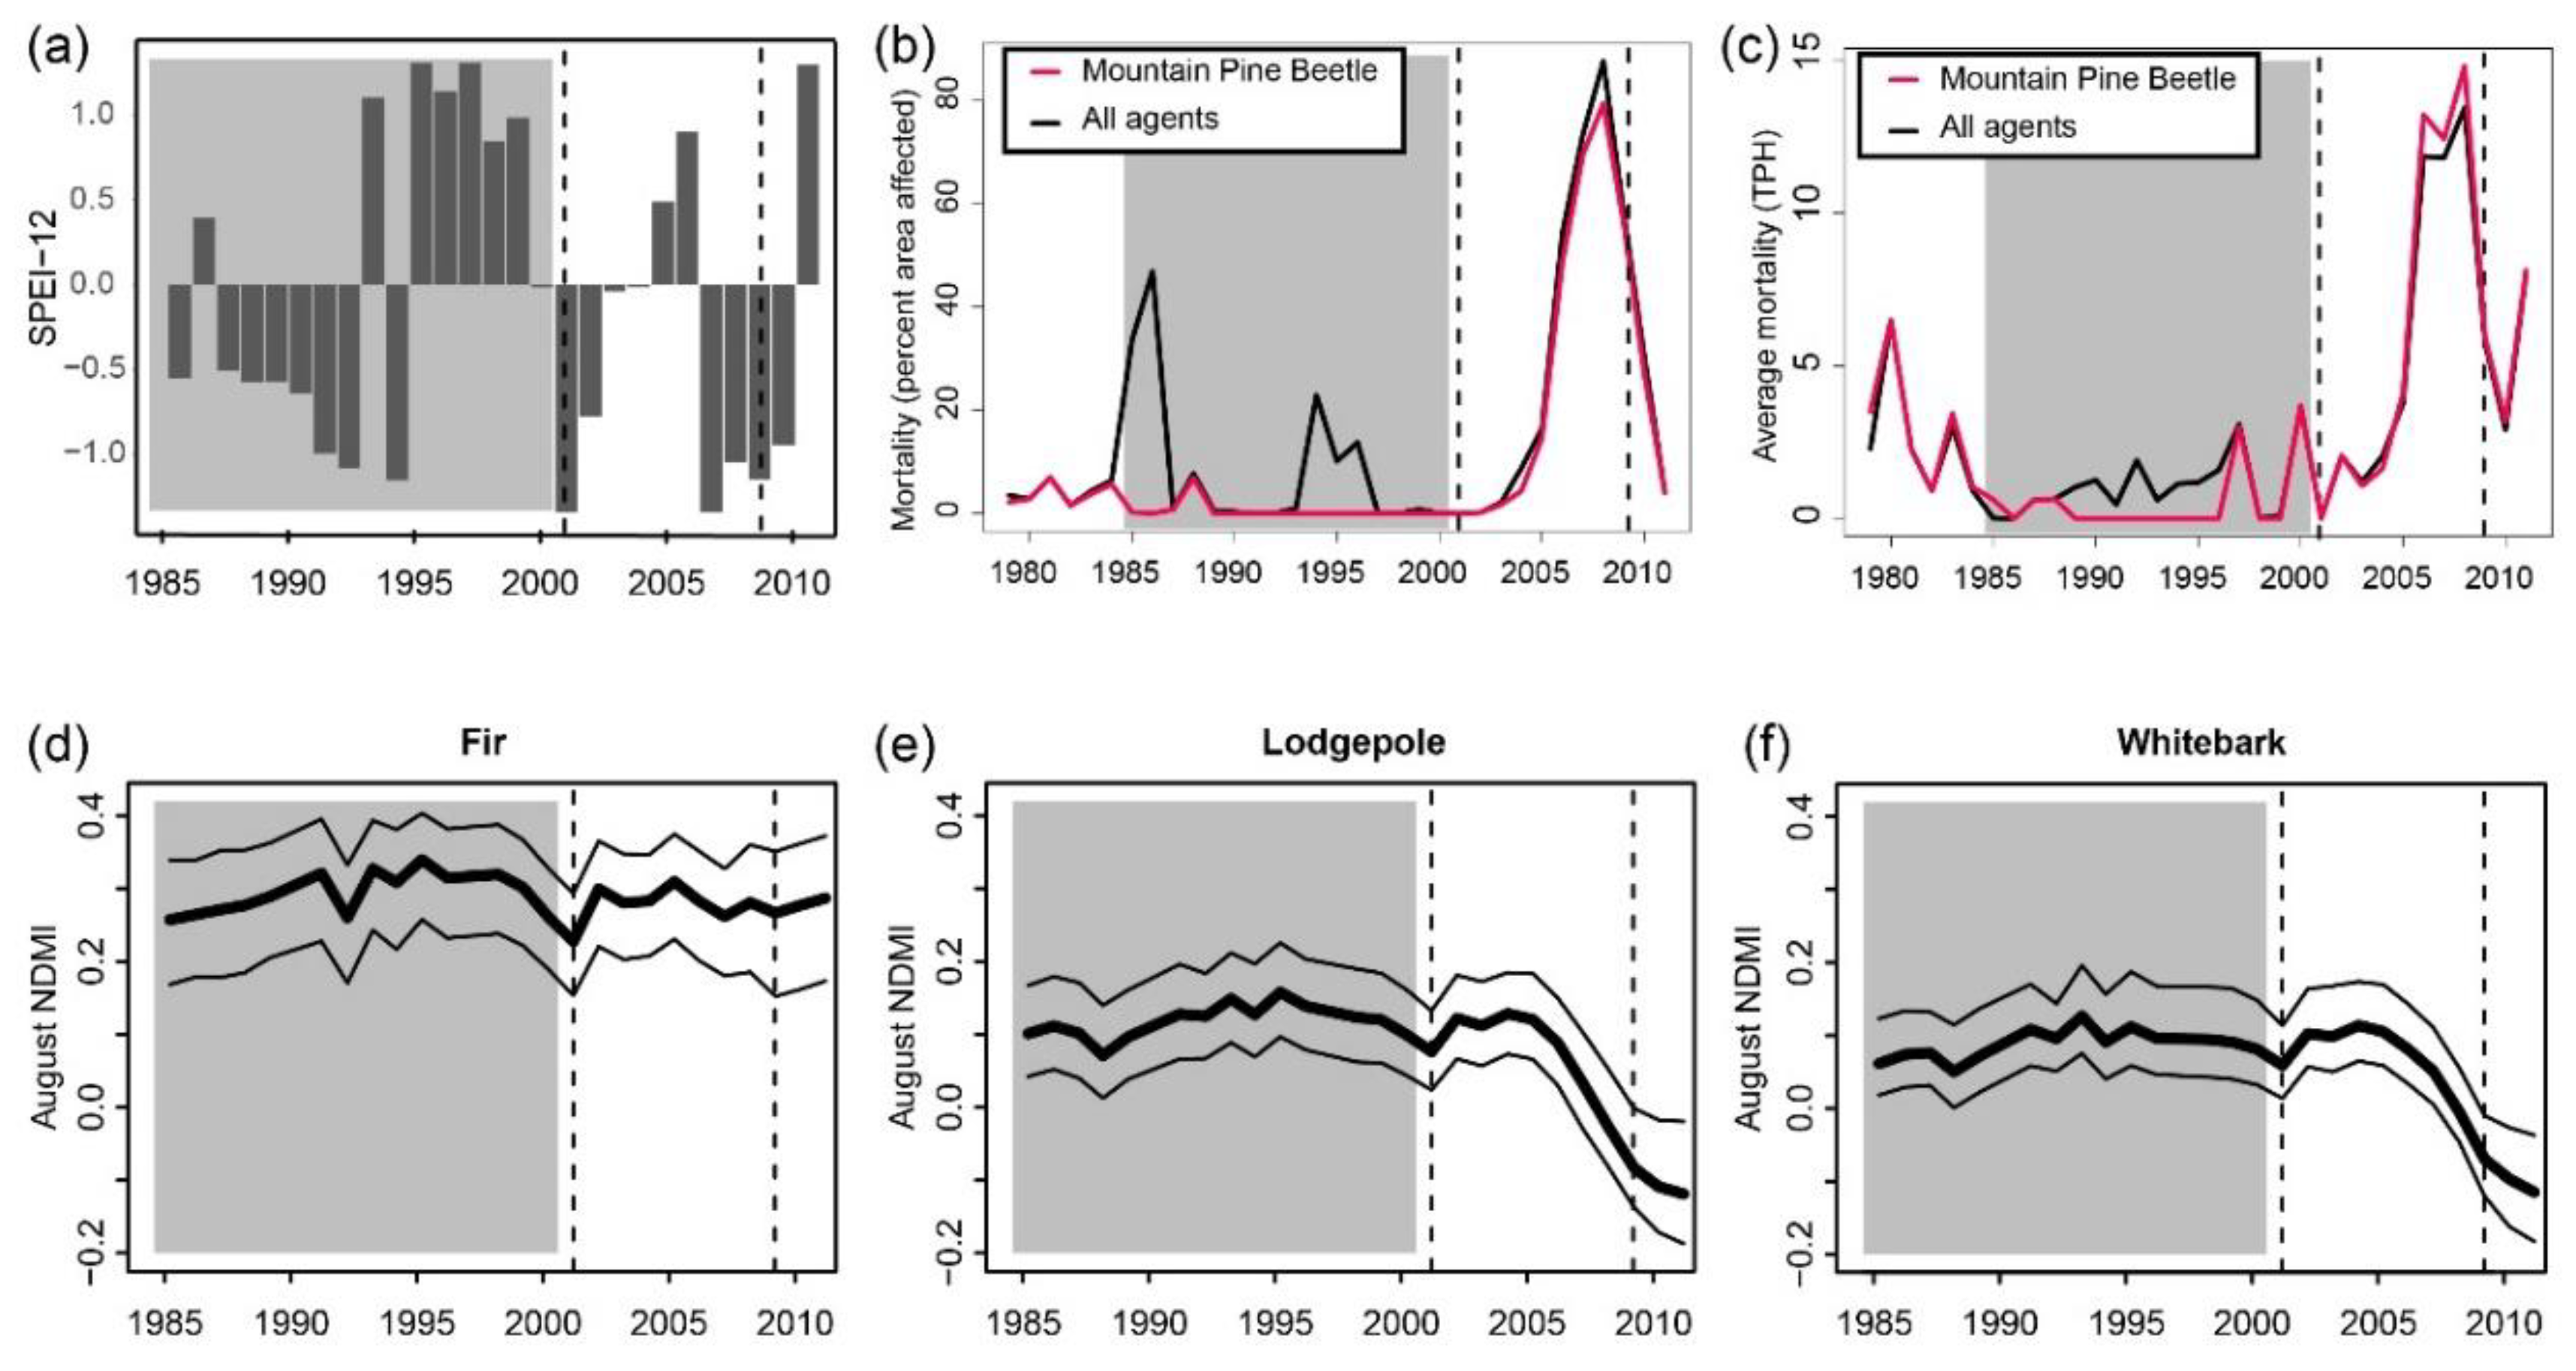
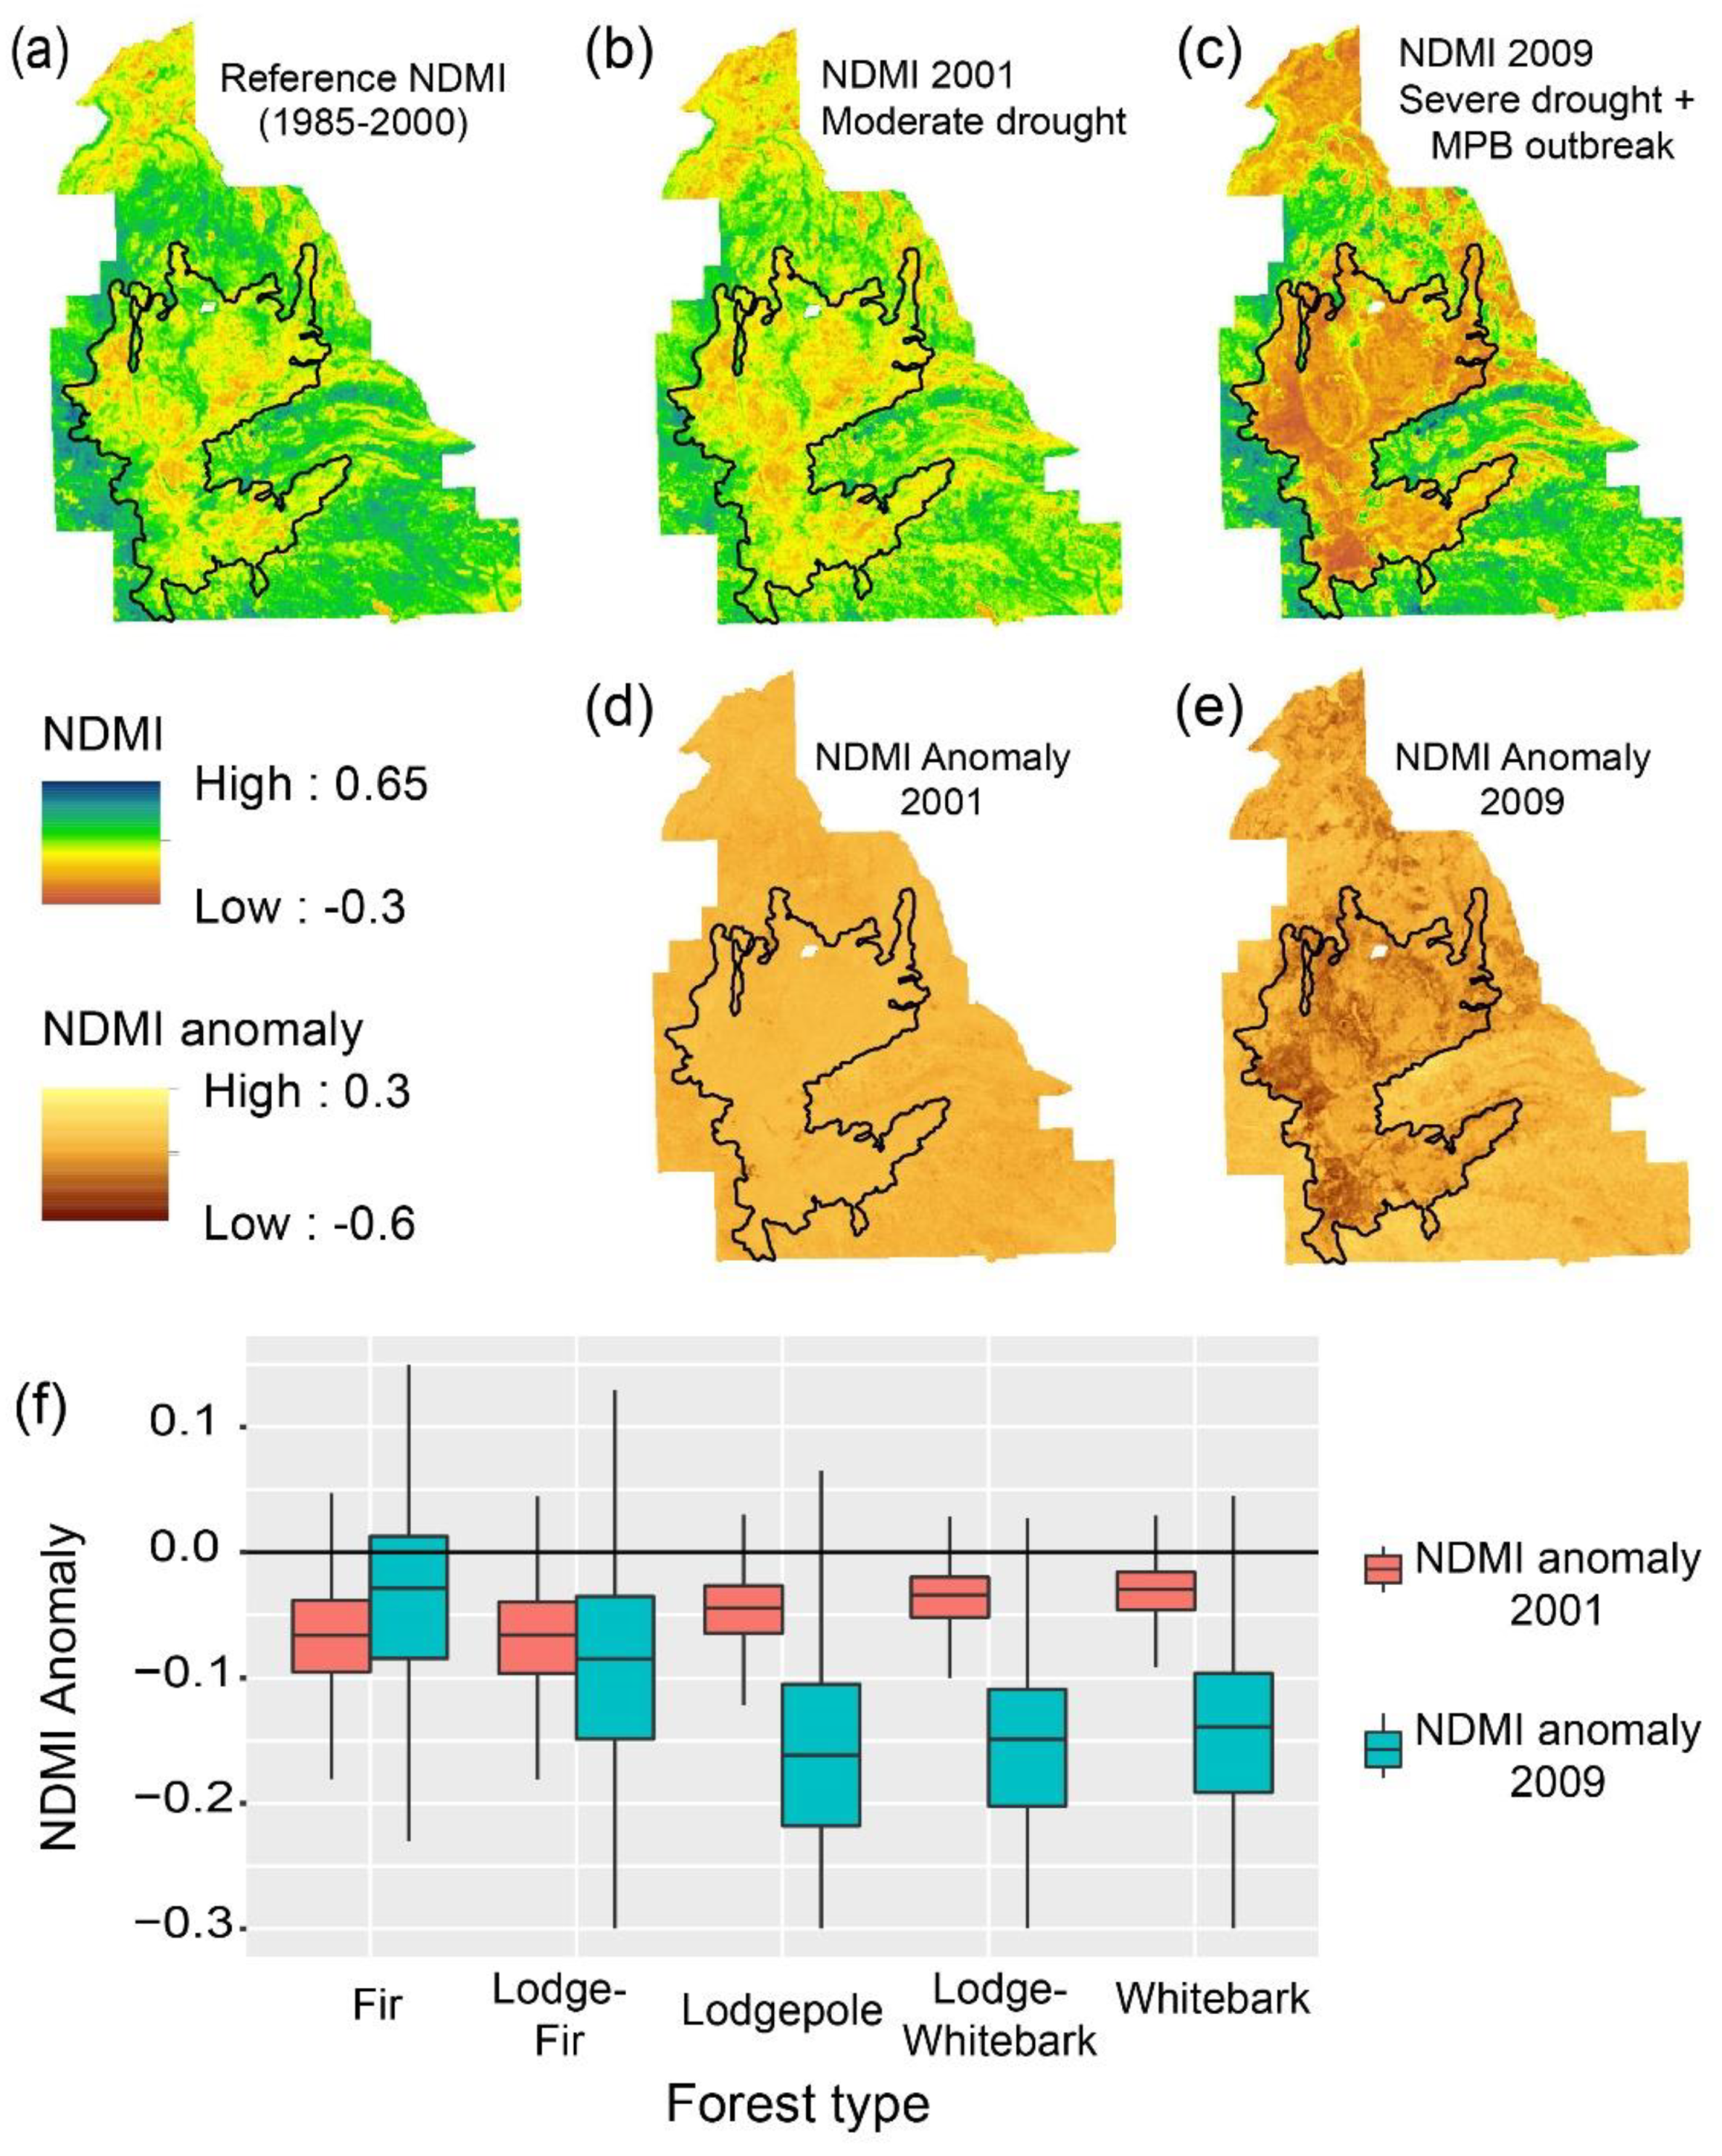
3.1. Temporal and Spatial Patterns of Drought and Insect Disturbance
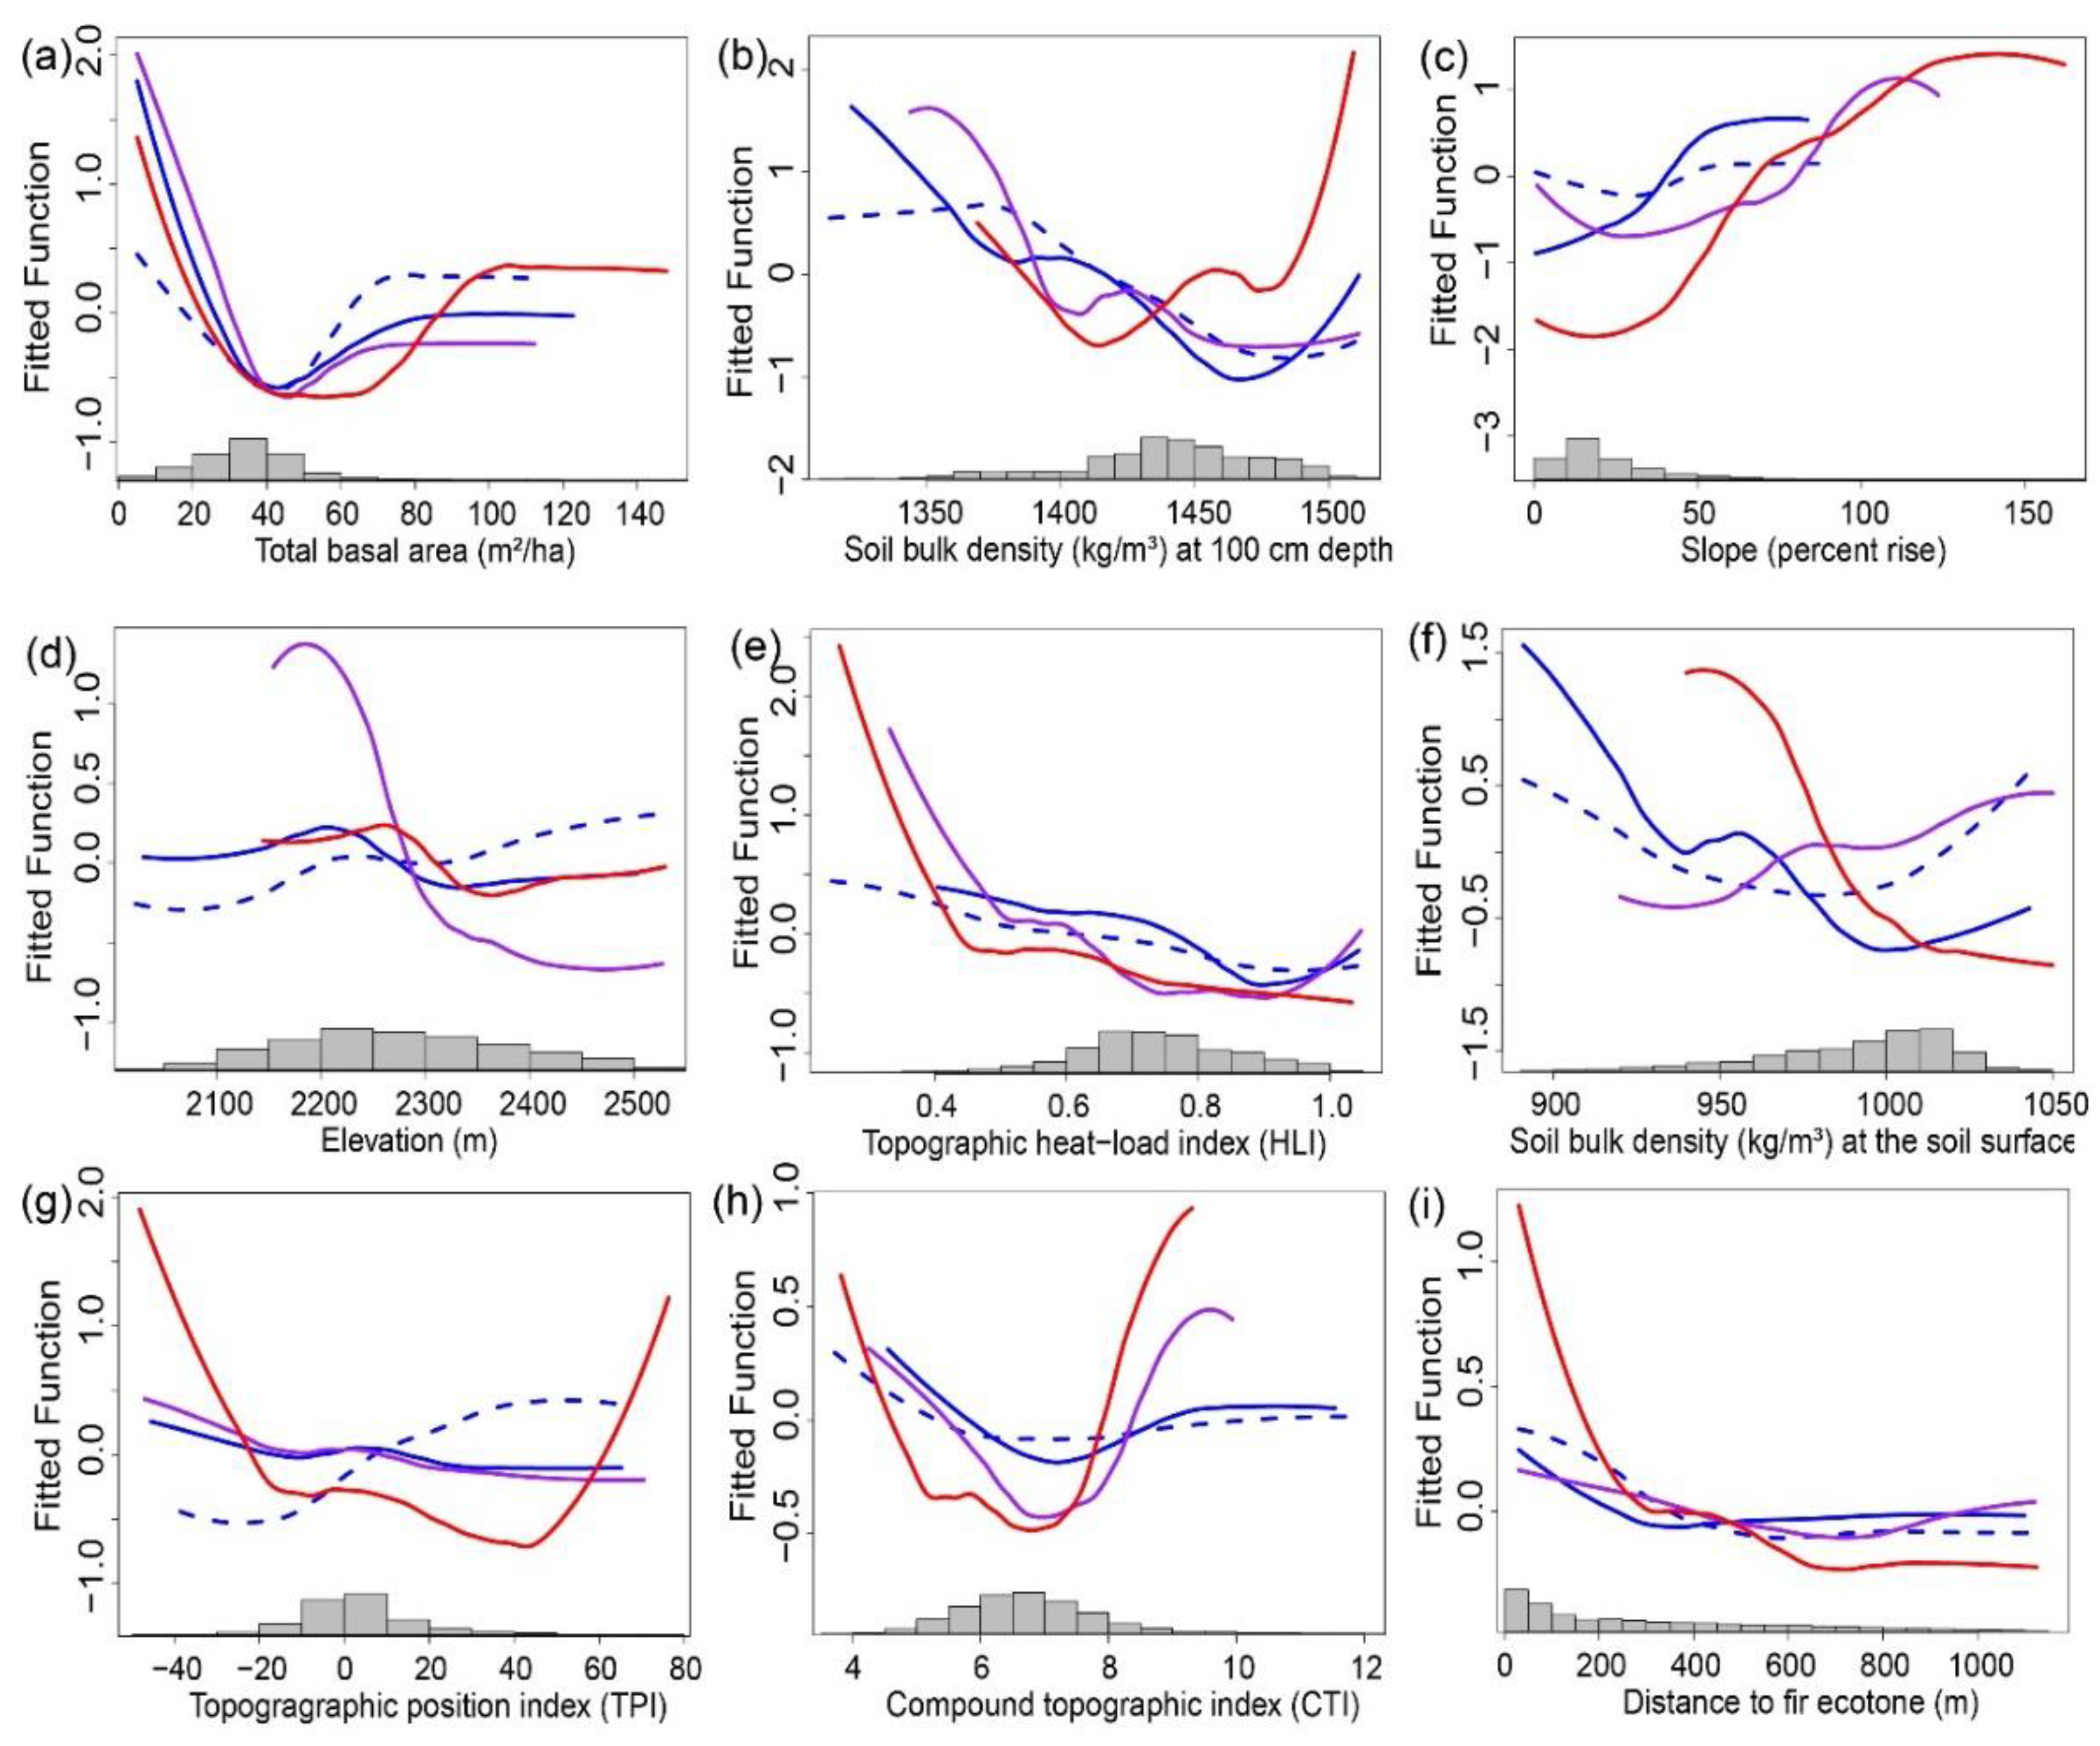
3.2. Landscape Controls on Refugia
3.2.1. Total Basal Area
3.2.2. Soil Bulk Density
3.2.3. Slope and Heat Load Index.
3.2.4. Elevation
3.2.5. Topographic Position Index
3.2.6. Compound Topographic Index
3.2.7. Distance to the Fir Ecotone
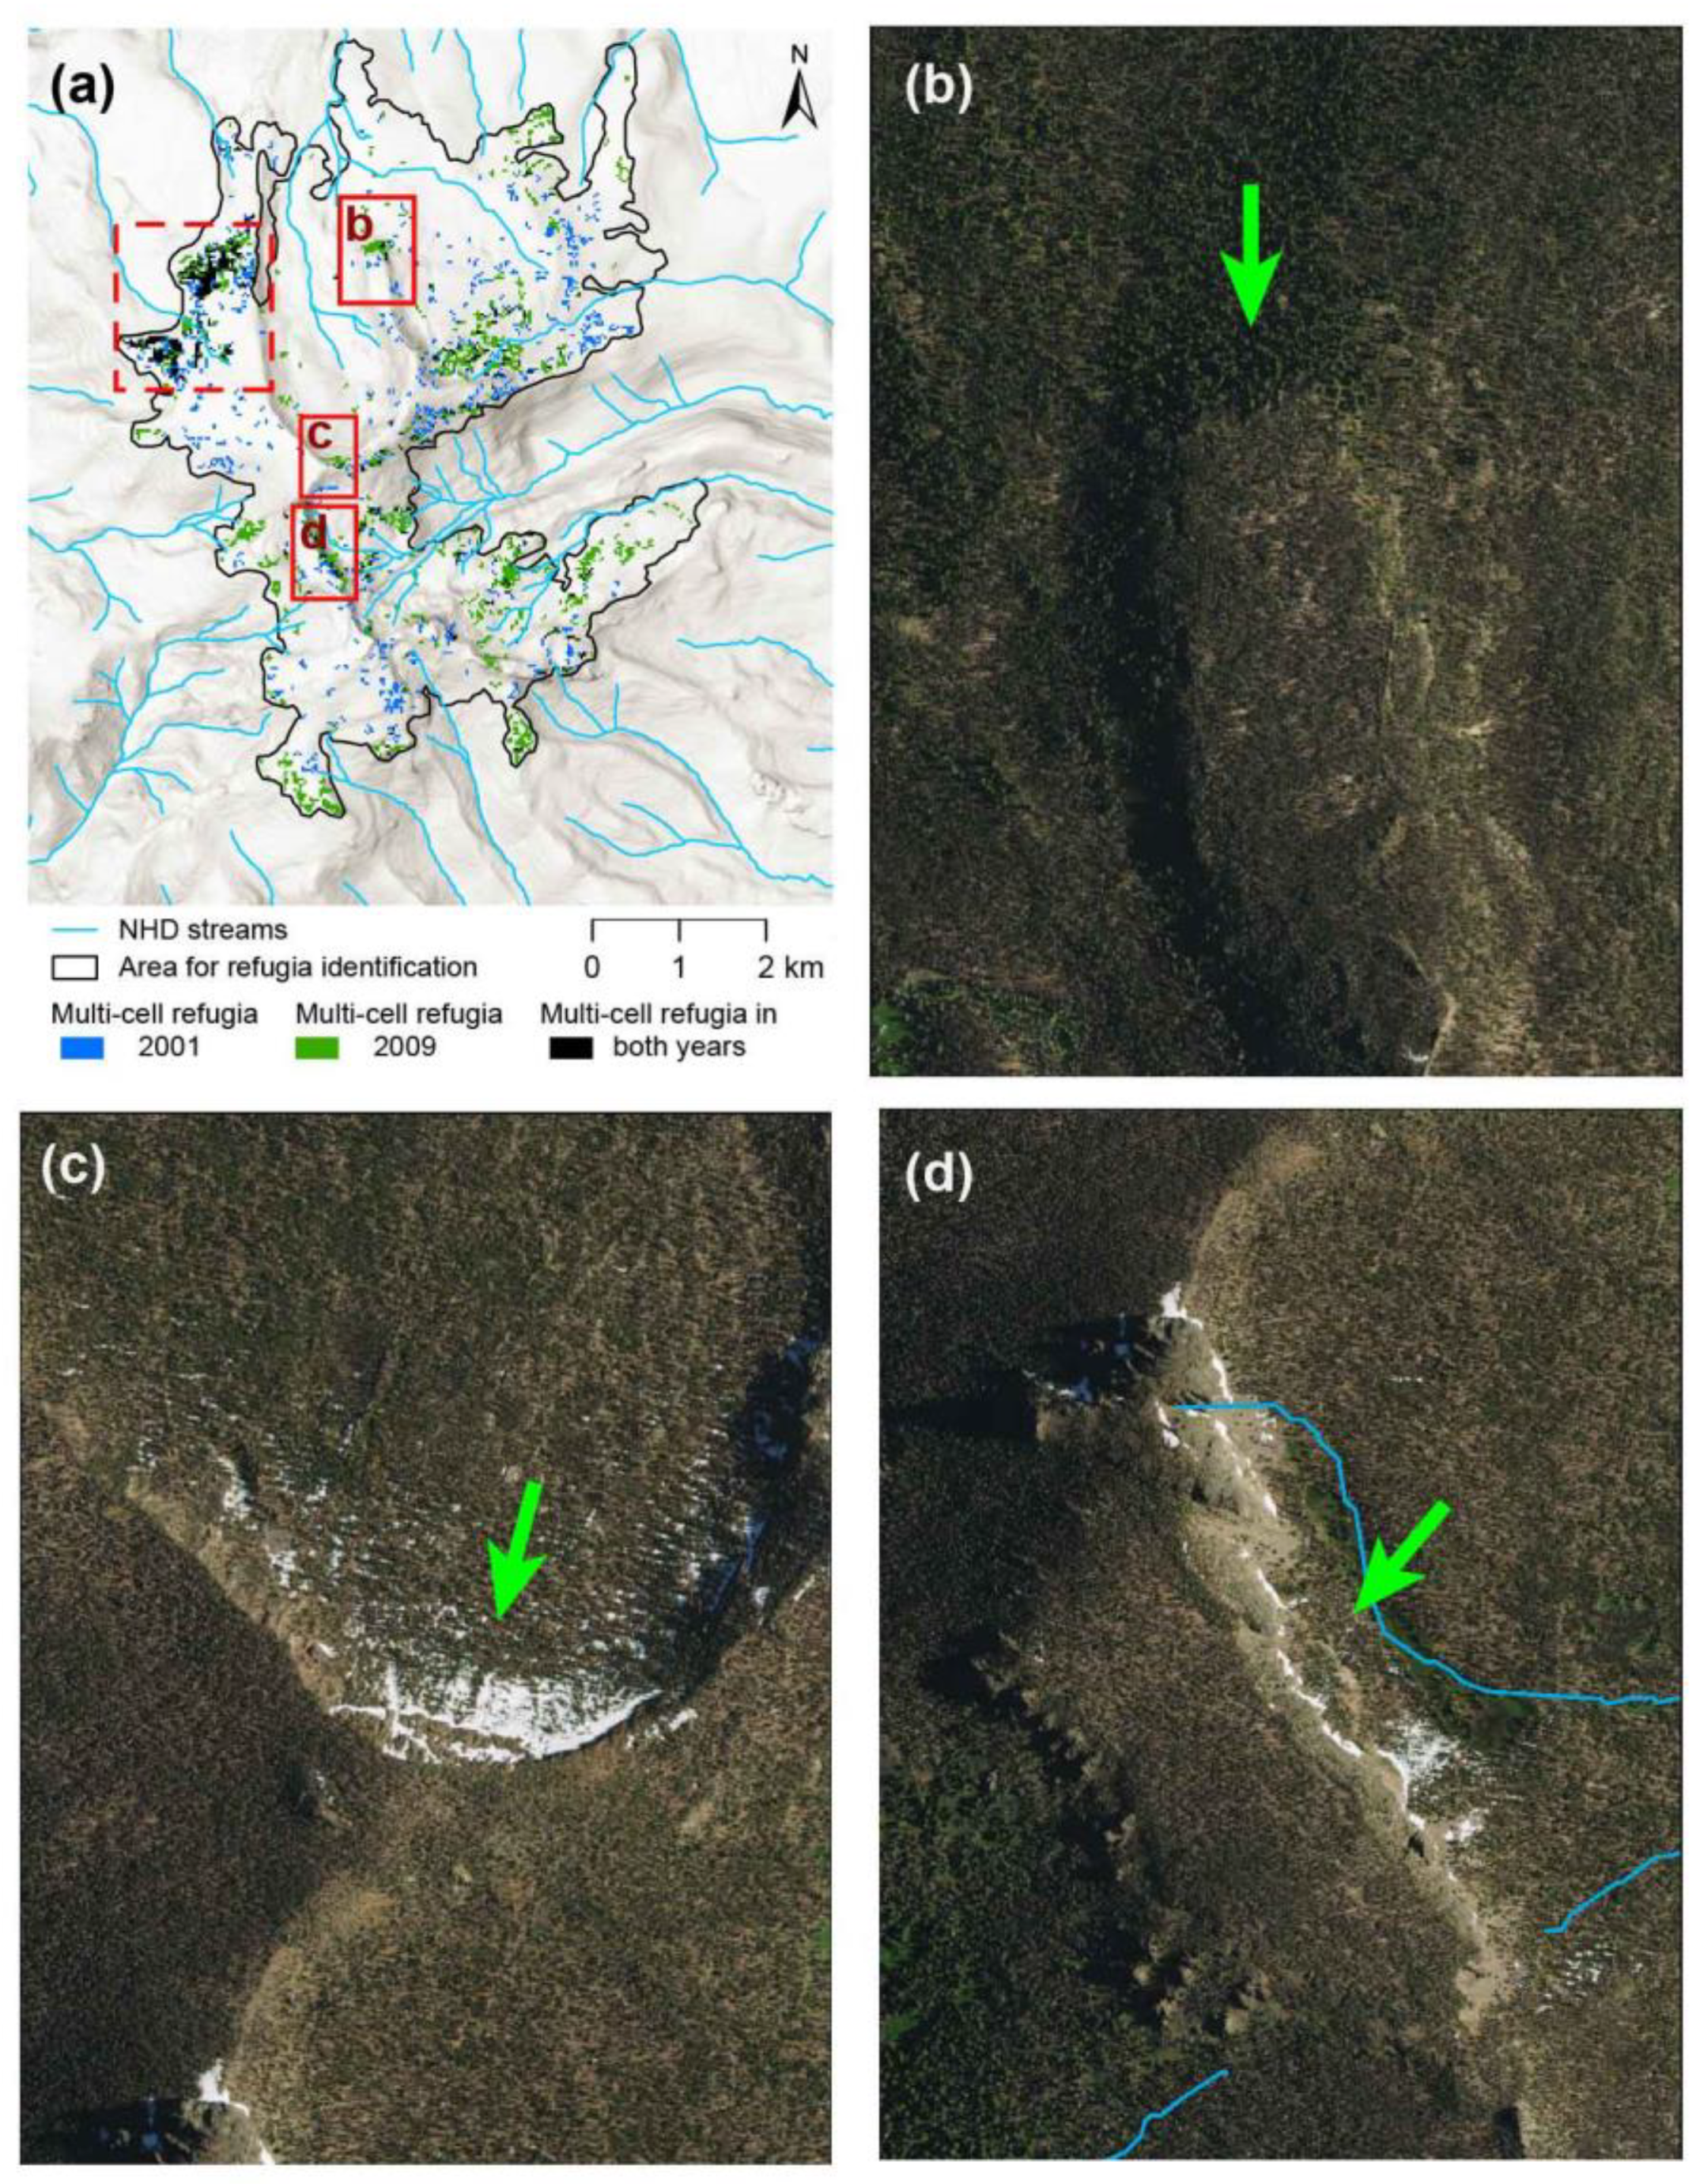
3.3. Landforms Associated with Refugia
4. Discussion
4.1. Landscape Controls on Refugia from Drought and Mountain Pine Beetle
4.2. Directions for Future Research
5. Conclusions
Funding
Acknowledgments
Conflicts of Interest
Appendix A. Forest-Type Classification

| Criterion 1 | Criterion 2 | Criterion 3 | Forest-type Classification |
|---|---|---|---|
| Total basal area ≤5 m2/ha | - | - | Non-forest |
| Total basal area >5 m2/ha | % Lodgepole >60% | - | Lodgepole-dominated |
| % Ponderosa >60% | - | Ponderosa-dominated | |
| % Whitebark >60% | - | Whitebark-dominated | |
| % Firs >60% | - | Fir-dominated | |
| No species with >60% | Lodgepole + Whitebark >60% | Lodgepole–Whitebark co-dominated | |
| Lodgepole + Firs >60% | Lodgepole-fir co-dominated | ||
| Does not meet any of above criteria | No dominant |
Appendix B. Disturbance Histories of the Study Area
Appendix B.1. Droughts
Appendix B.2. Insect and Disease Outbreaks
Appendix B.3. Fires
Appendix B.4. Integrated Assessment of Disturbance History
Appendix C. Landsat Data
| Landsat Product Identifier | Acquisition Date | Cloud Cover |
|---|---|---|
| LT05_L1TP_044030_19850809_20161004_01_T1 | 8/9/1985 | 0 |
| LT05_L1TP_044030_19850825_20161004_01_T1 | 8/25/1985 | 0 |
| LT05_L1TP_044030_19860812_20161004_01_T1 | 8/12/1986 | 0 |
| LT05_L1TP_044030_19860828_20161003_01_T1 | 8/28/1986 | 21 |
| LT05_L1TP_044030_19870815_20161003_01_T1 | 8/15/1987 | 23 |
| LT05_L1TP_044030_19870831_20161002_01_T1 | 8/31/1987 | 15 |
| LT05_L1TP_044030_19880801_20161002_01_T1 | 8/1/1988 | 0 |
| LT05_L1TP_044030_19890804_20161002_01_T1 | 8/4/1989 | 0 |
| LT05_L1TP_044030_19890820_20161002_01_T1 | 8/20/1989 | 4 |
| LT05_L1TP_044030_19900807_20161002_01_T1 | 8/7/1990 | 17 |
| LT05_L1TP_044030_19900823_20161002_01_T1 | 8/23/1990 | 11 |
| LT05_L1TP_044030_19910810_20161001_01_T1 | 8/10/1991 | 0 |
| LT05_L1TP_044030_19910826_20161001_01_T1 | 8/26/1991 | 1 |
| LT05_L1TP_044030_19920828_20160929_01_T1 | 8/28/1992 | 0 |
| LT05_L1TP_044030_19930831_20160927_01_T1 | 8/31/1993 | 0 |
| LT05_L1TP_044030_19940802_20160927_01_T1 | 8/2/1994 | 4 |
| LT05_L1TP_044030_19940818_20160926_01_T1 | 8/18/1994 | 0 |
| LT05_L1TP_044030_19950805_20160927_01_T1 | 8/5/1995 | 0 |
| LT05_L1TP_044030_19950821_20160926_01_T1 | 8/21/1995 | 2 |
| LT05_L1TP_044030_19960807_20160924_01_T1 | 8/7/1996 | 0 |
| LT05_L1TP_044030_19960823_20160925_01_T1 | 8/23/1996 | 0 |
| LT05_L1TP_044030_19970810_20160923_01_T1 | 8/10/1997 | 49 |
| LT05_L1TP_044030_19980813_20160923_01_T1 | 8/13/1998 | 0 |
| LT05_L1TP_044030_19980829_20160923_01_T1 | 8/29/1998 | 0 |
| LT05_L1TP_044030_19990816_20160919_01_T1 | 8/16/1999 | 0 |
| LT05_L1TP_044030_20000802_20160918_01_T1 | 8/2/2000 | 0 |
| LT05_L1TP_044030_20000818_20160918_01_T1 | 8/18/2000 | 0 |
| LT05_L1TP_044030_20010805_20160917_01_T1 | 8/5/2001 | 0 |
| LT05_L1TP_044030_20010821_20160917_01_T1 | 8/21/2001 | 7 |
| LT05_L1TP_044030_20020808_20160916_01_T1 | 8/8/2002 | 0 |
| LT05_L1TP_044030_20020824_20160916_01_T1 | 8/24/2002 | 5 |
| LT05_L1TP_044030_20030811_20160915_01_T1 | 8/11/2003 | 9 |
| LT05_L1TP_044030_20030827_20160915_01_T1 | 8/27/2003 | 6 |
| LT05_L1TP_044030_20040813_20160913_01_T1 | 8/13/2004 | 33 |
| LT05_L1TP_044030_20040829_20160913_01_T1 | 8/29/2004 | 0 |
| LT05_L1TP_044030_20050816_20160912_01_T1 | 8/16/2005 | 0 |
| LT05_L1TP_044030_20060803_20160911_01_T1 | 8/3/2006 | 0 |
| LT05_L1TP_044030_20060819_20160909_01_T1 | 8/19/2006 | 0 |
| LT05_L1TP_044030_20070806_20160907_01_T1 | 8/6/2007 | 8 |
| LT05_L1TP_044030_20070822_20160910_01_T1 | 8/22/2007 | 2 |
| LT05_L1TP_044030_20080808_20160905_01_T1 | 8/8/2008 | 3 |
| LT05_L1TP_044030_20080824_20160906_01_T1 | 8/24/2008 | 6 |
| LT05_L1TP_044030_20090811_20160903_01_T1 | 8/11/2009 | 0 |
| LT05_L1TP_044030_20090827_20160905_01_T1 | 8/27/2009 | 0 |
| LT05_L1TP_044030_20100814_20160901_01_T1 | 8/14/2010 | 0 |
| LT05_L1TP_044030_20110801_20160831_01_T1 | 8/1/2011 | 5 |
| LT05_L1TP_044030_20110817_20160831_01_T1 | 8/17/2011 | 2 |
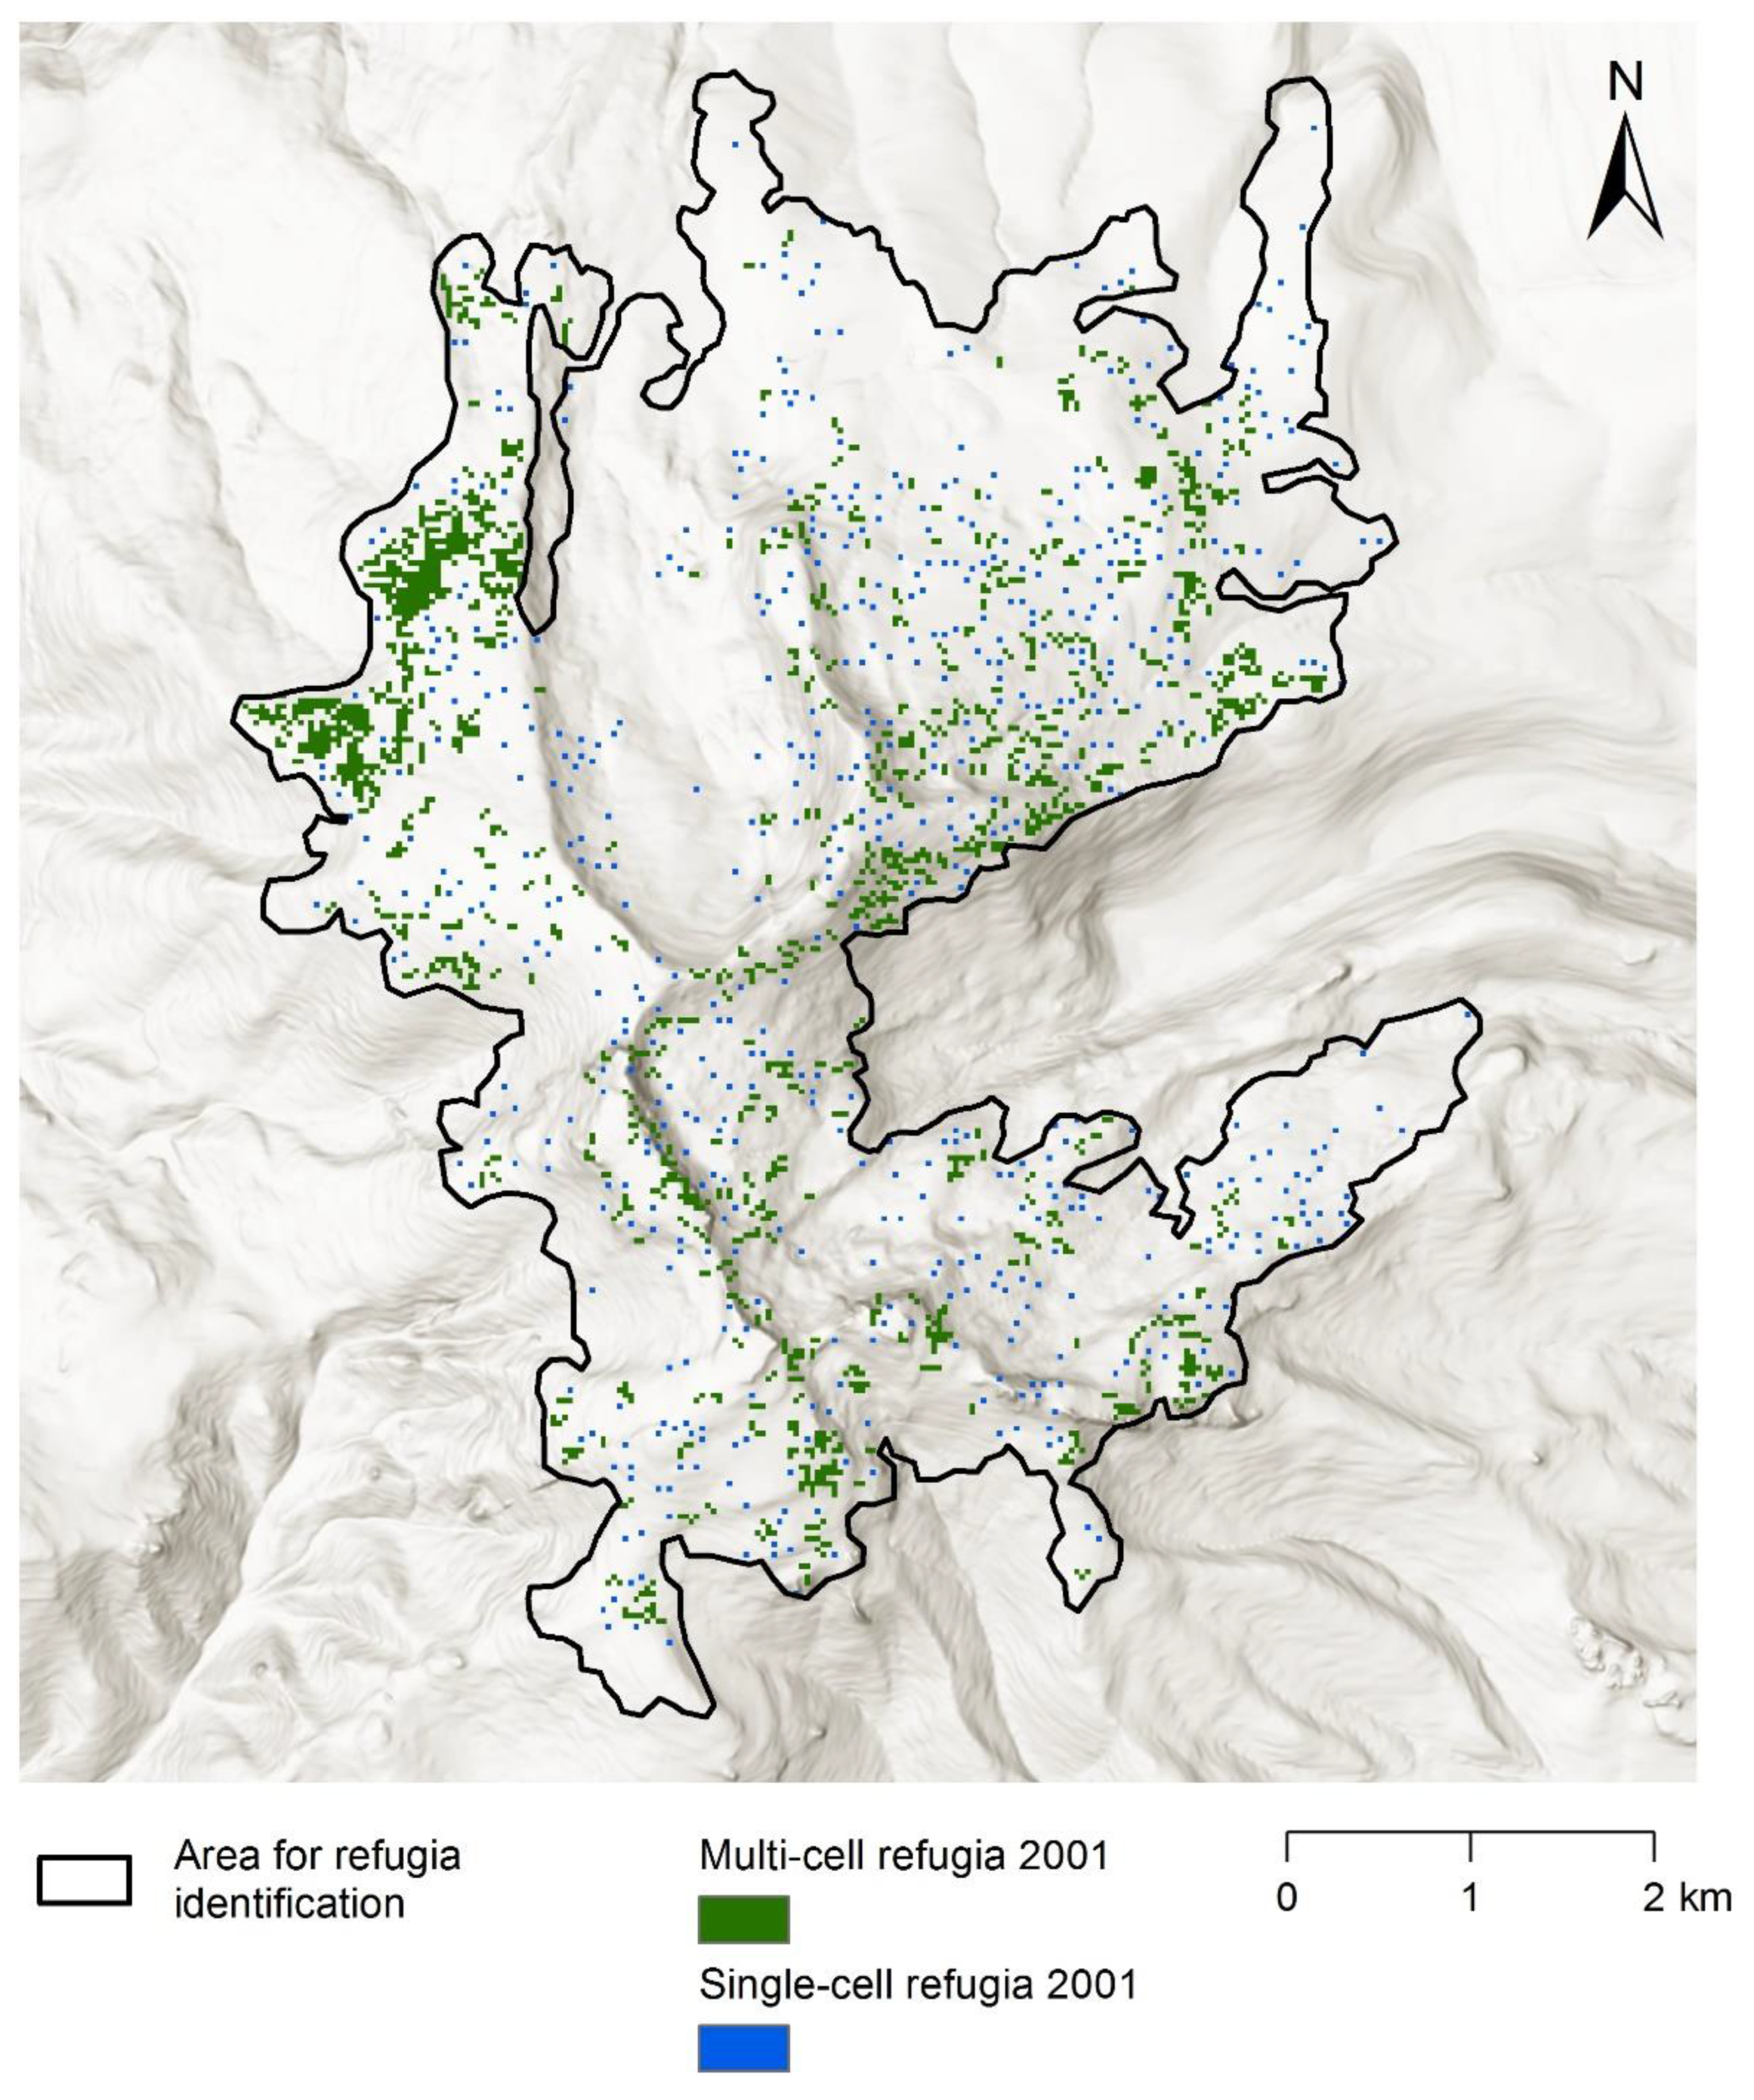
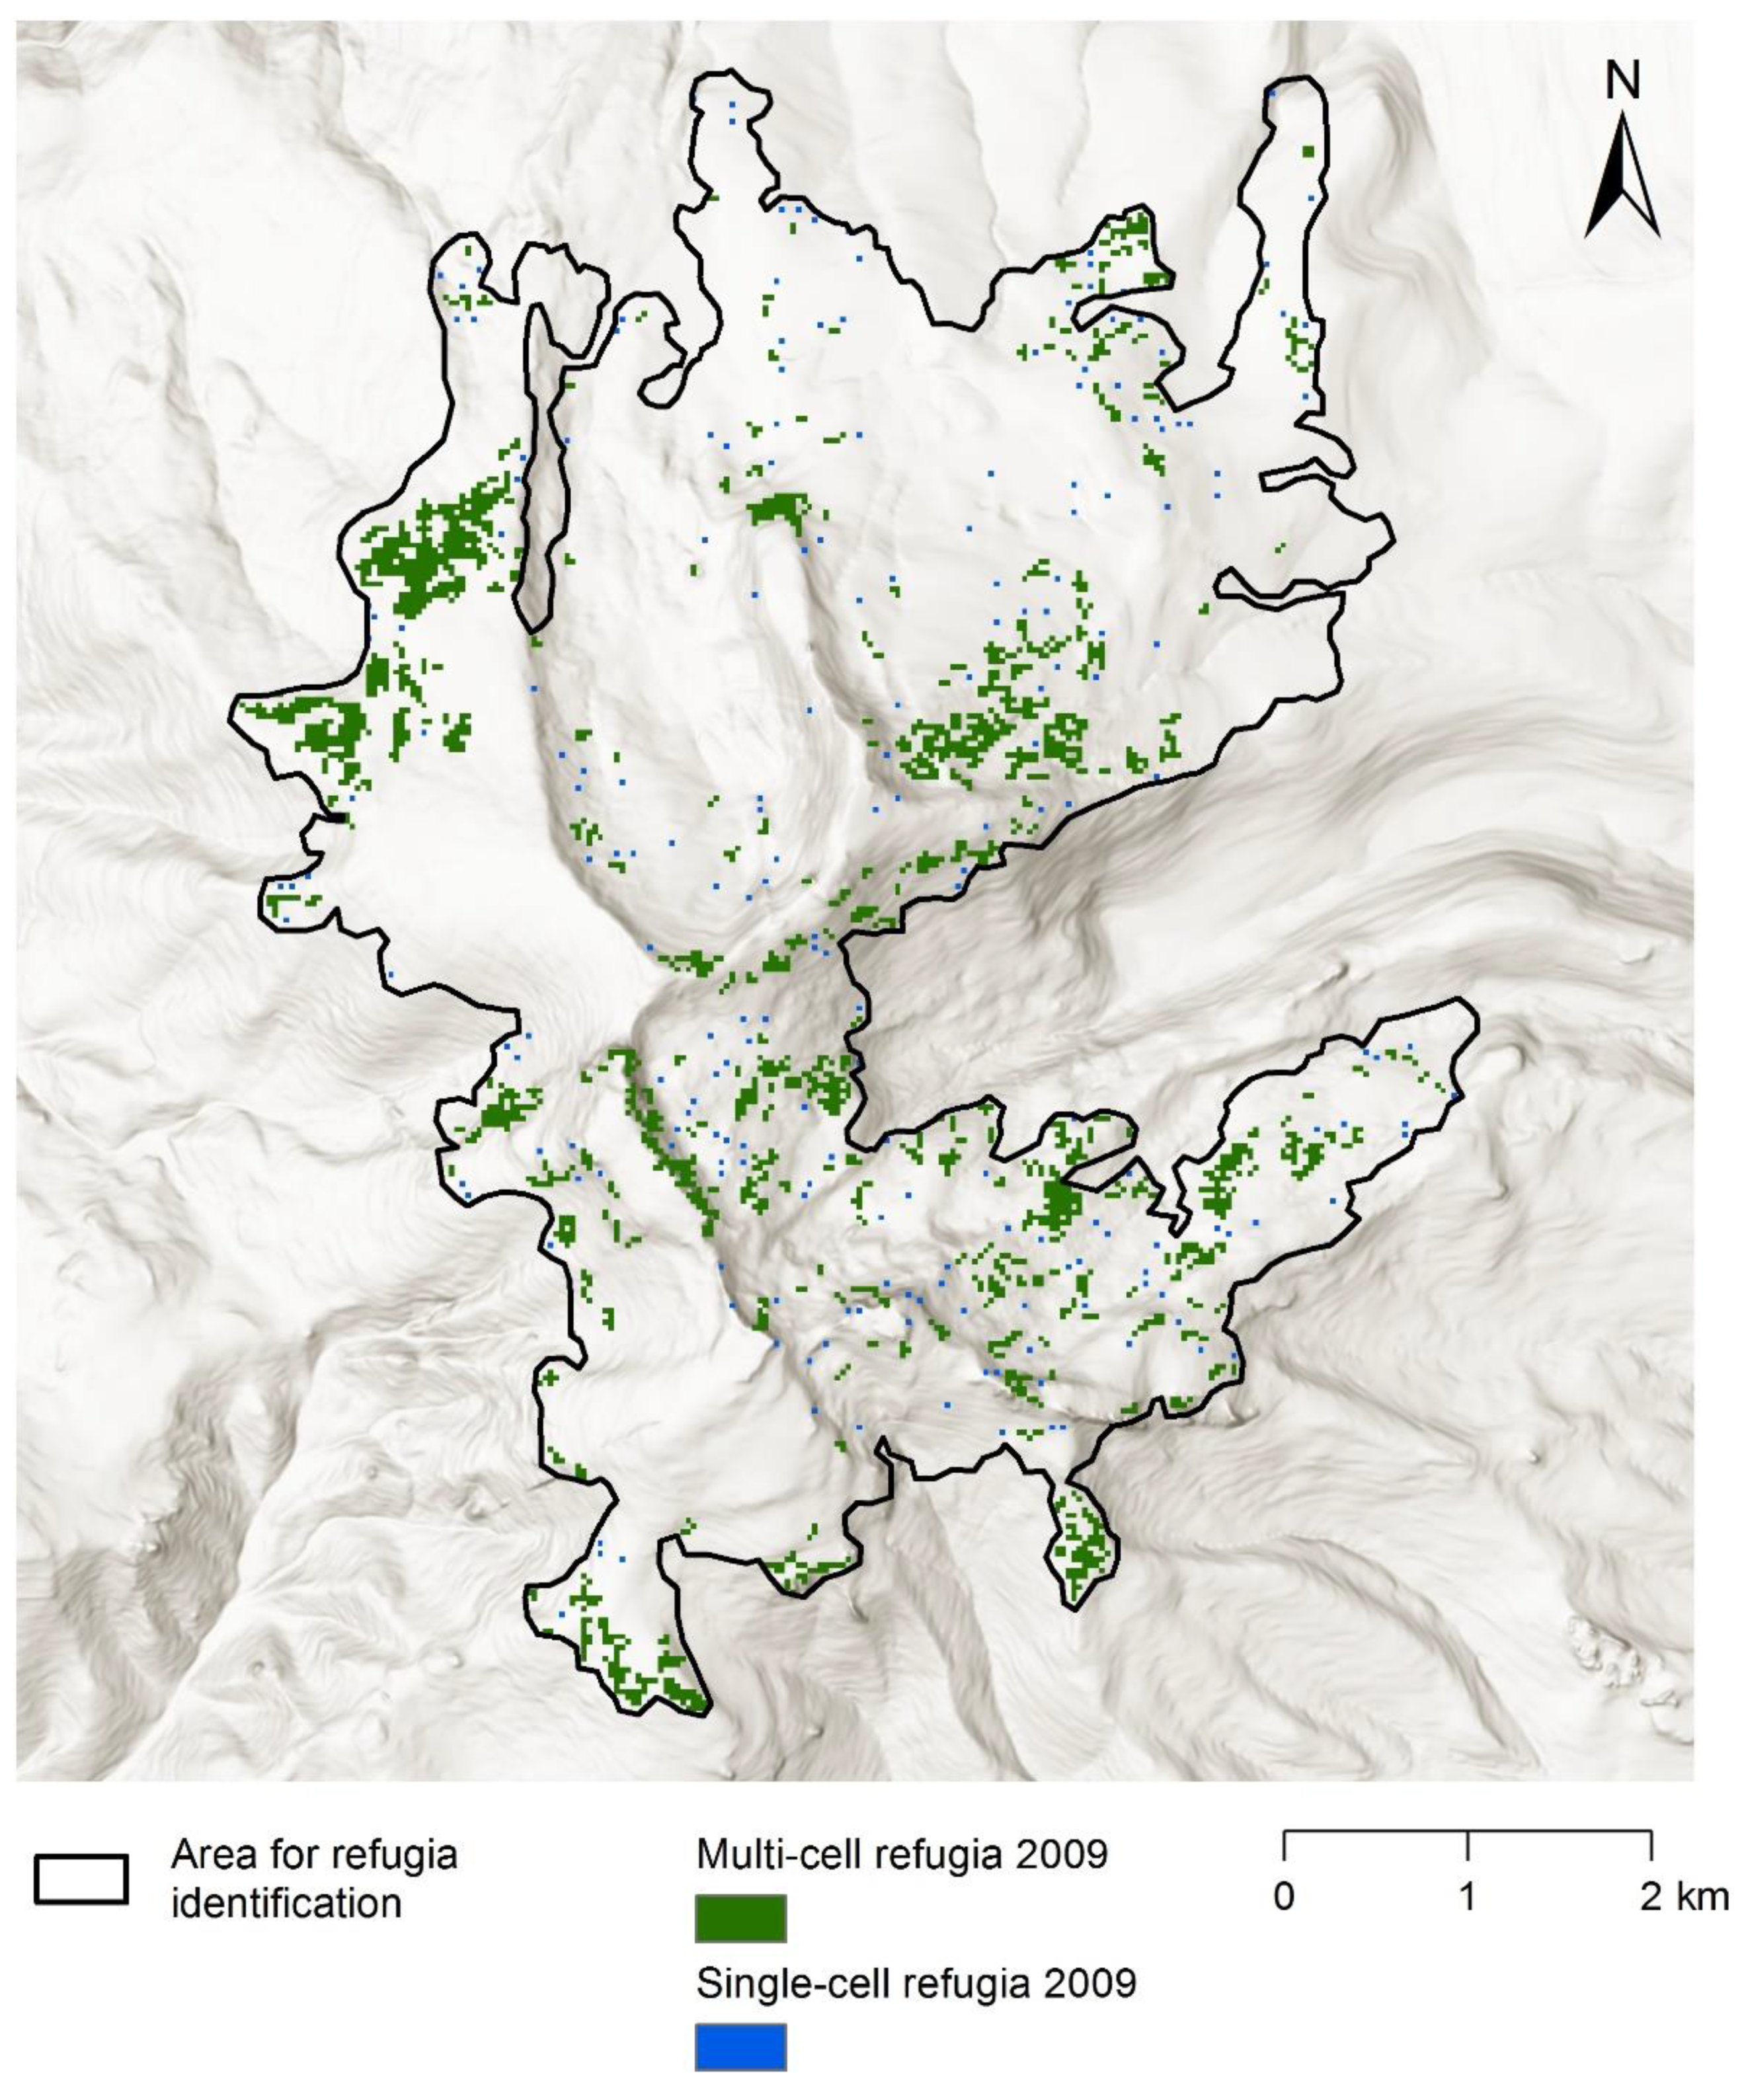
Appendix D. Refugia Identified in 2001 and 2009


Appendix E. Comparison of Boosted Regression Tree (BRT) Model Performance for Models of All Refugia (Single-cell and Multi-cell) Versus Models only for Multi-cell Refugia
| BRT Model Parameters | Forest Type | |||||||||||
|---|---|---|---|---|---|---|---|---|---|---|---|---|
| Lodgepole | Lodgepole–whitebark | Whitebark | ||||||||||
| Year | 2001 | 2009 | 2001 | 2009 | 2001 | 2009 | ||||||
| Type of refugia | All | Multi | All | Multi | All | Multi | All | Multi | All | Multi | All | Multi |
| Learning rate | 0.02 | 0.03 | 0.04 | 0.055 | 0.001 | 0.0025 | 0.003 | 0.004 | 0.0025 | 0.0035 | 0.006 | 0.007 |
| Number of trees | 2500 | 4000 | 3500 | 3000 | 3000 | 2500 | 3000 | 2500 | 2000 | 2500 | 2500 | 2500 |
| AUC-ROC | 0.77 | 0.85 | 0.91 | 0.92 | 0.67 | 0.72 | 0.84 | 0.85 | 0.69 | 0.76 | 0.86 | 0.87 |
| Percent deviance explained | 0.32 | 0.59 | 0.67 | 0.73 | 0.18 | 0.34 | 0.47 | 0.51 | 0.25 | 0.4 | 0.57 | 0.62 |
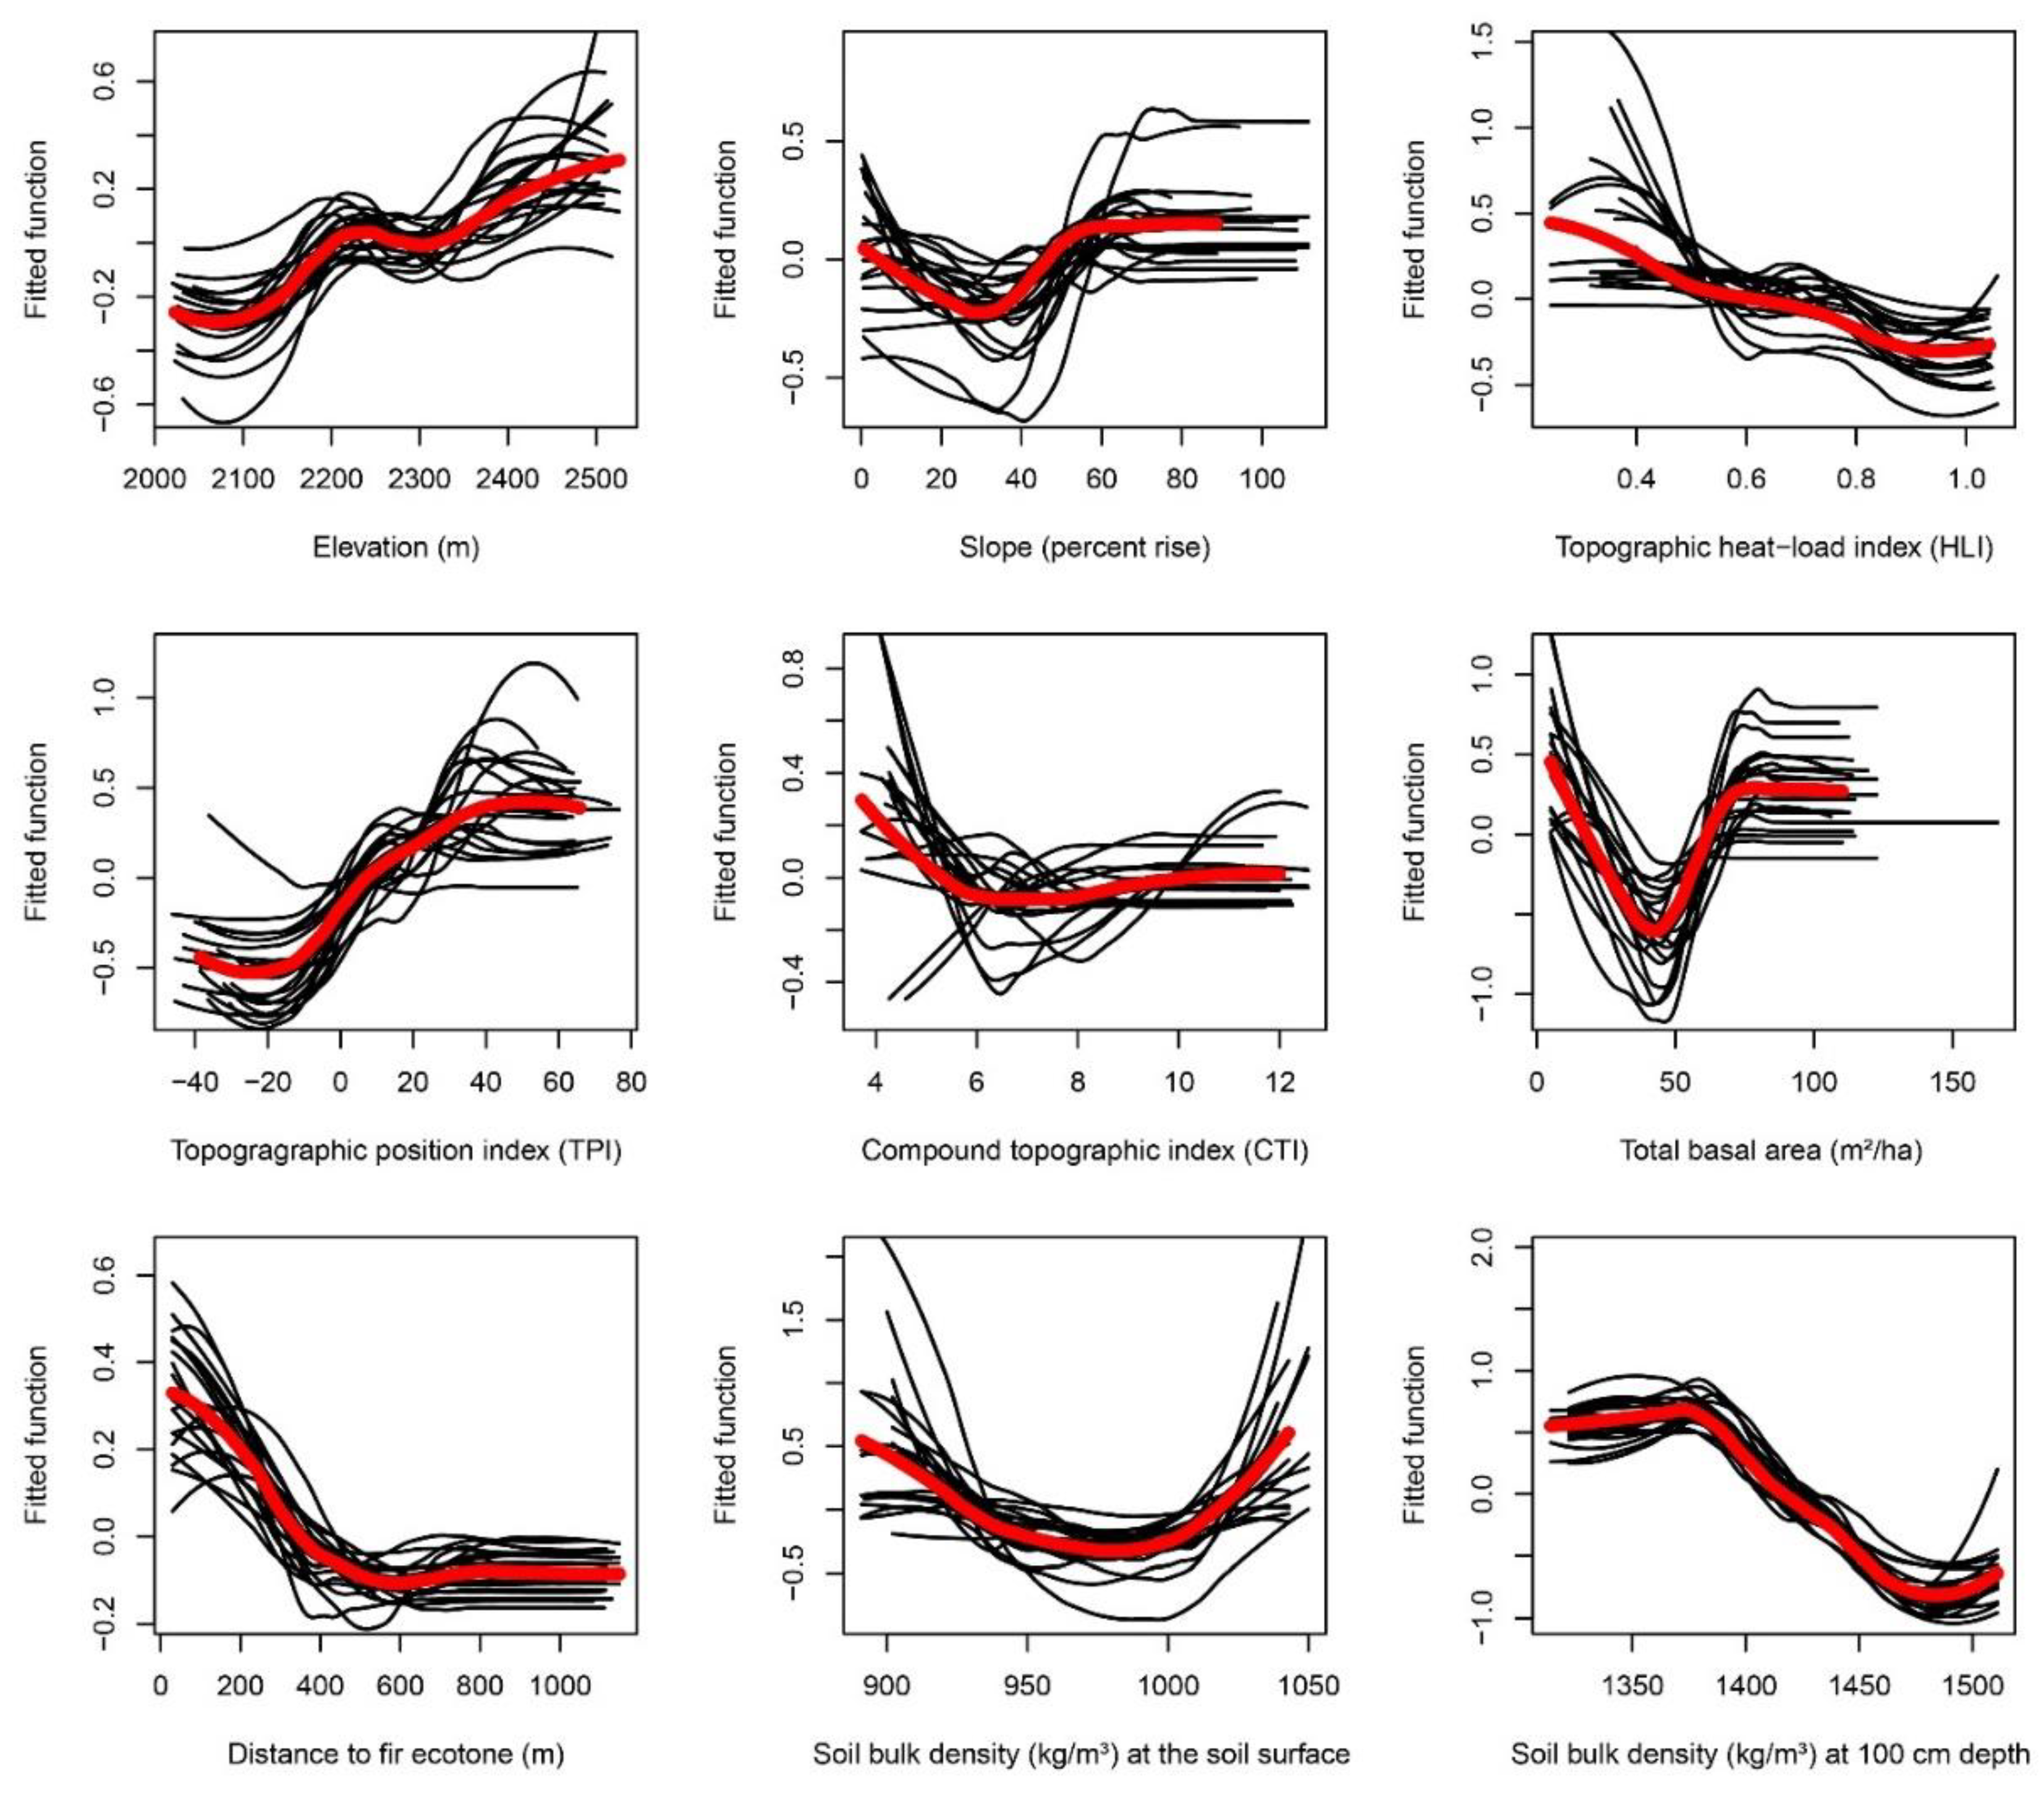
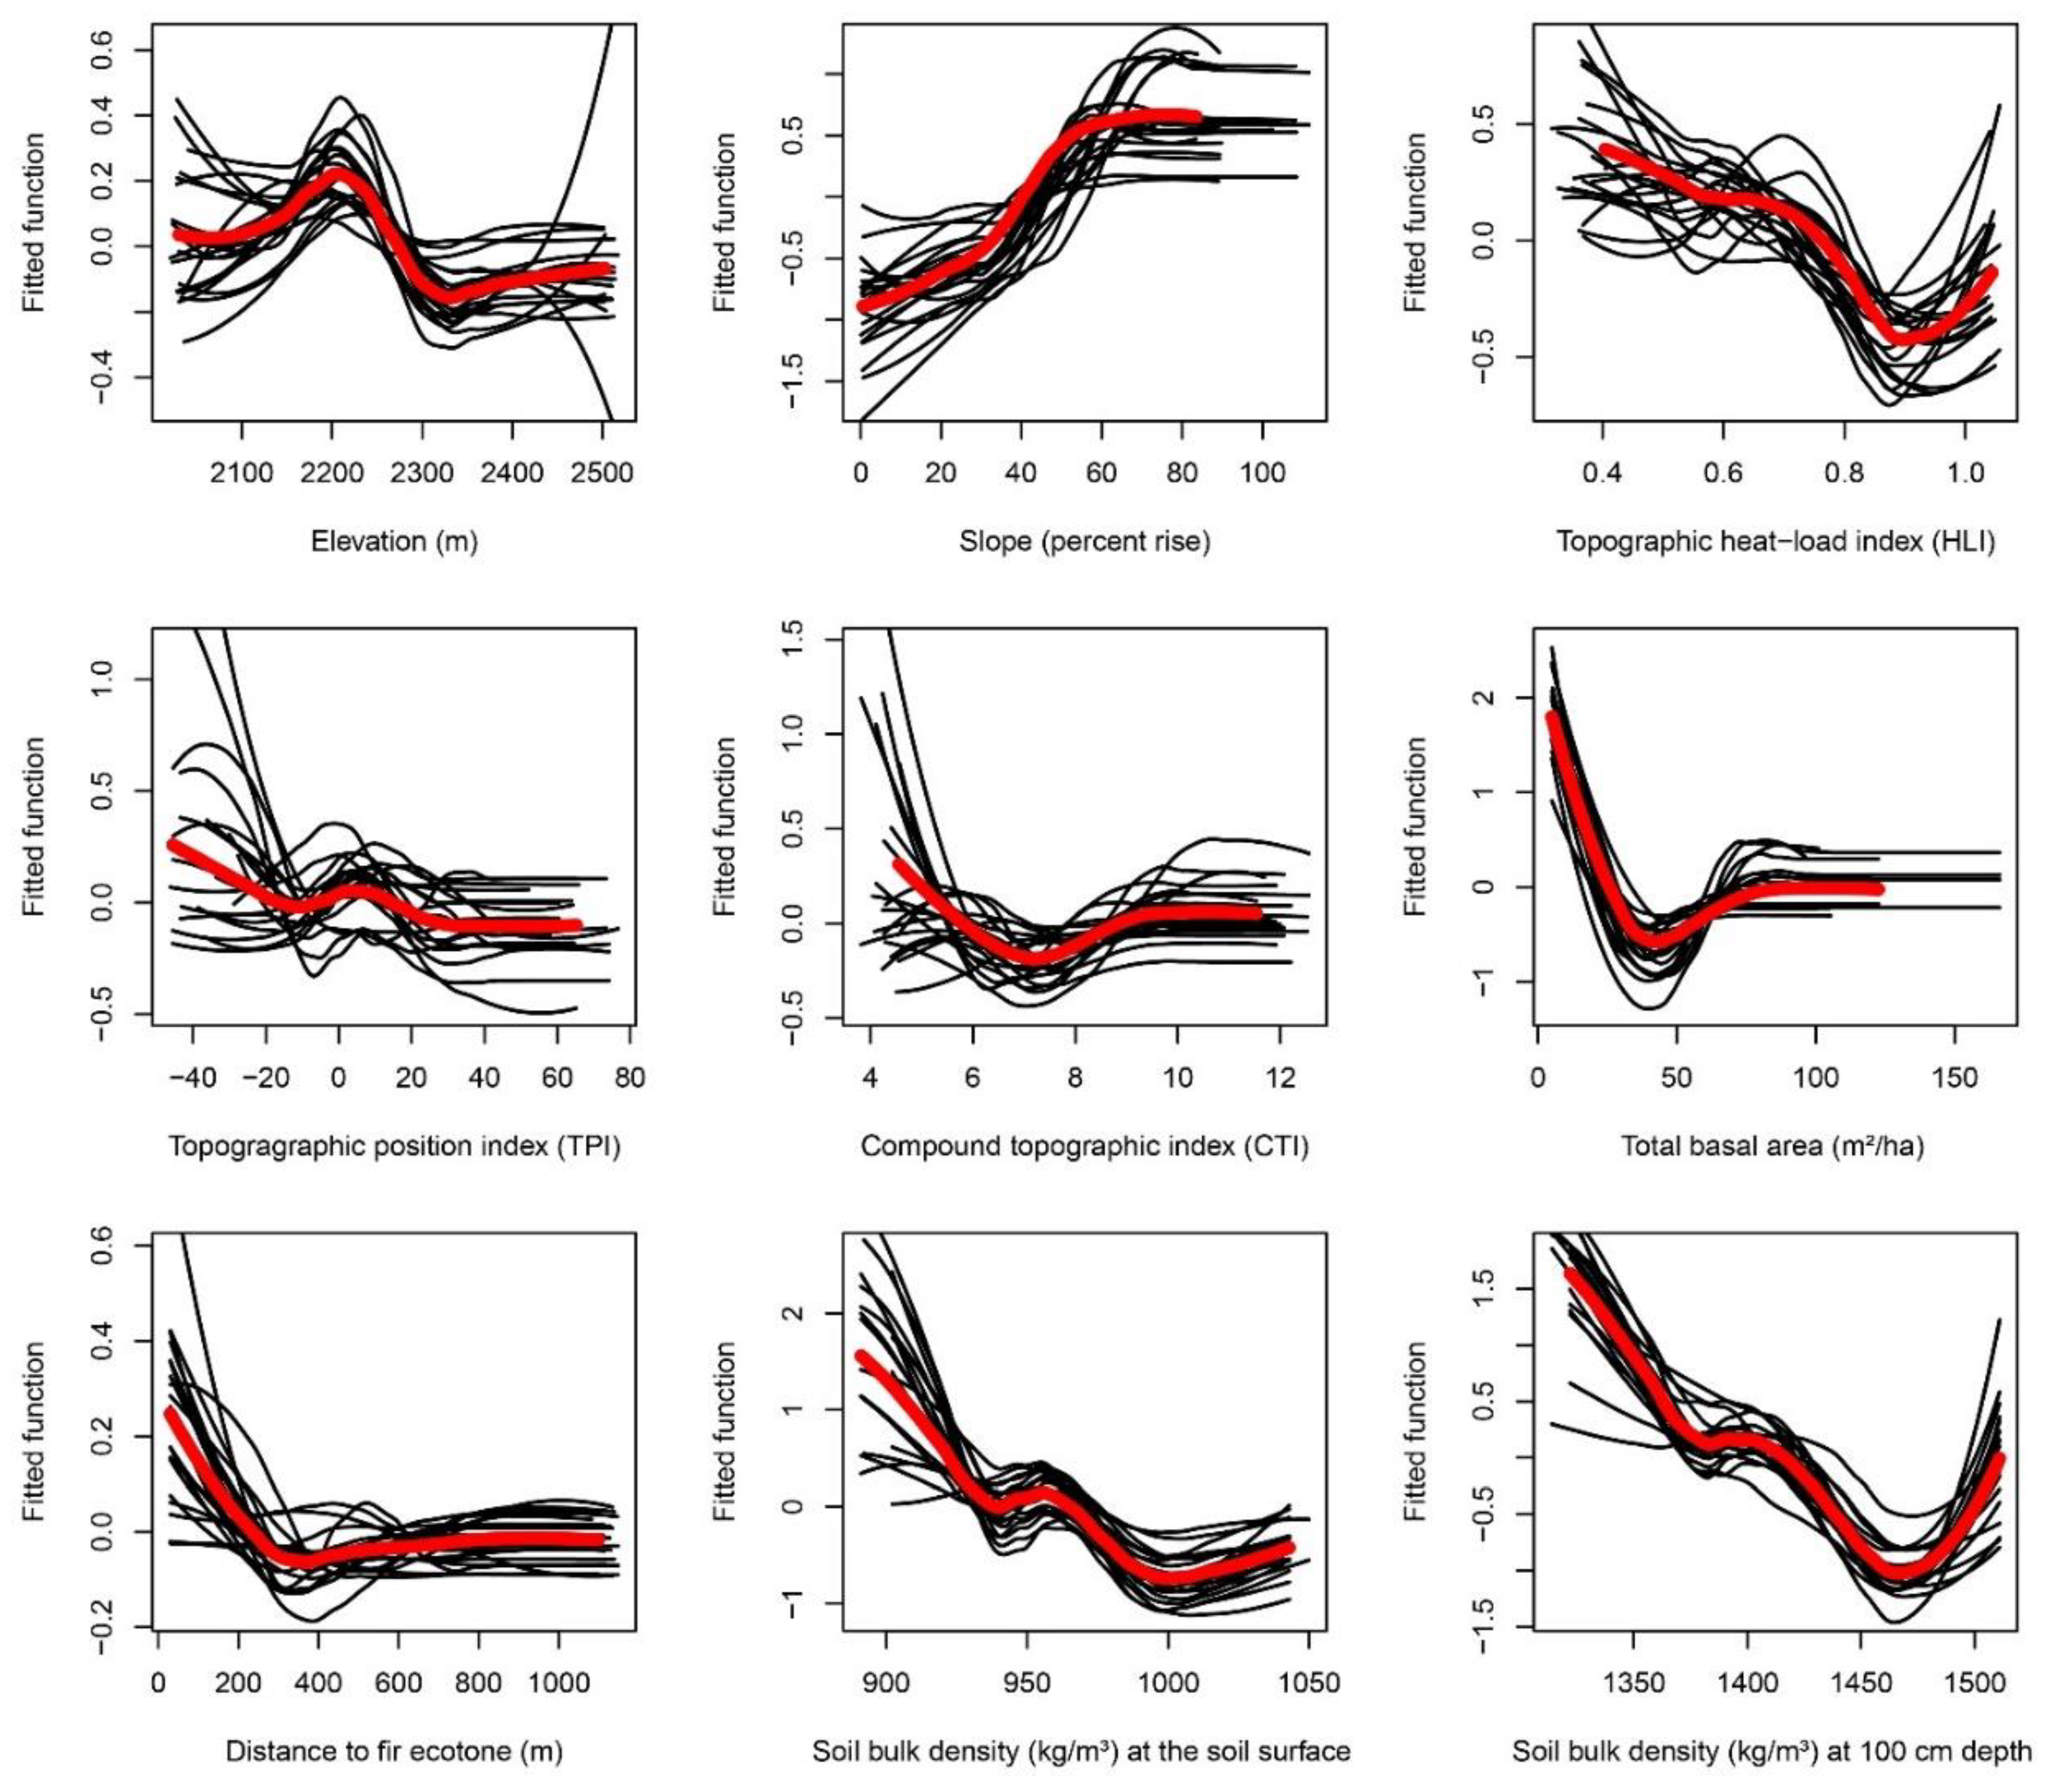
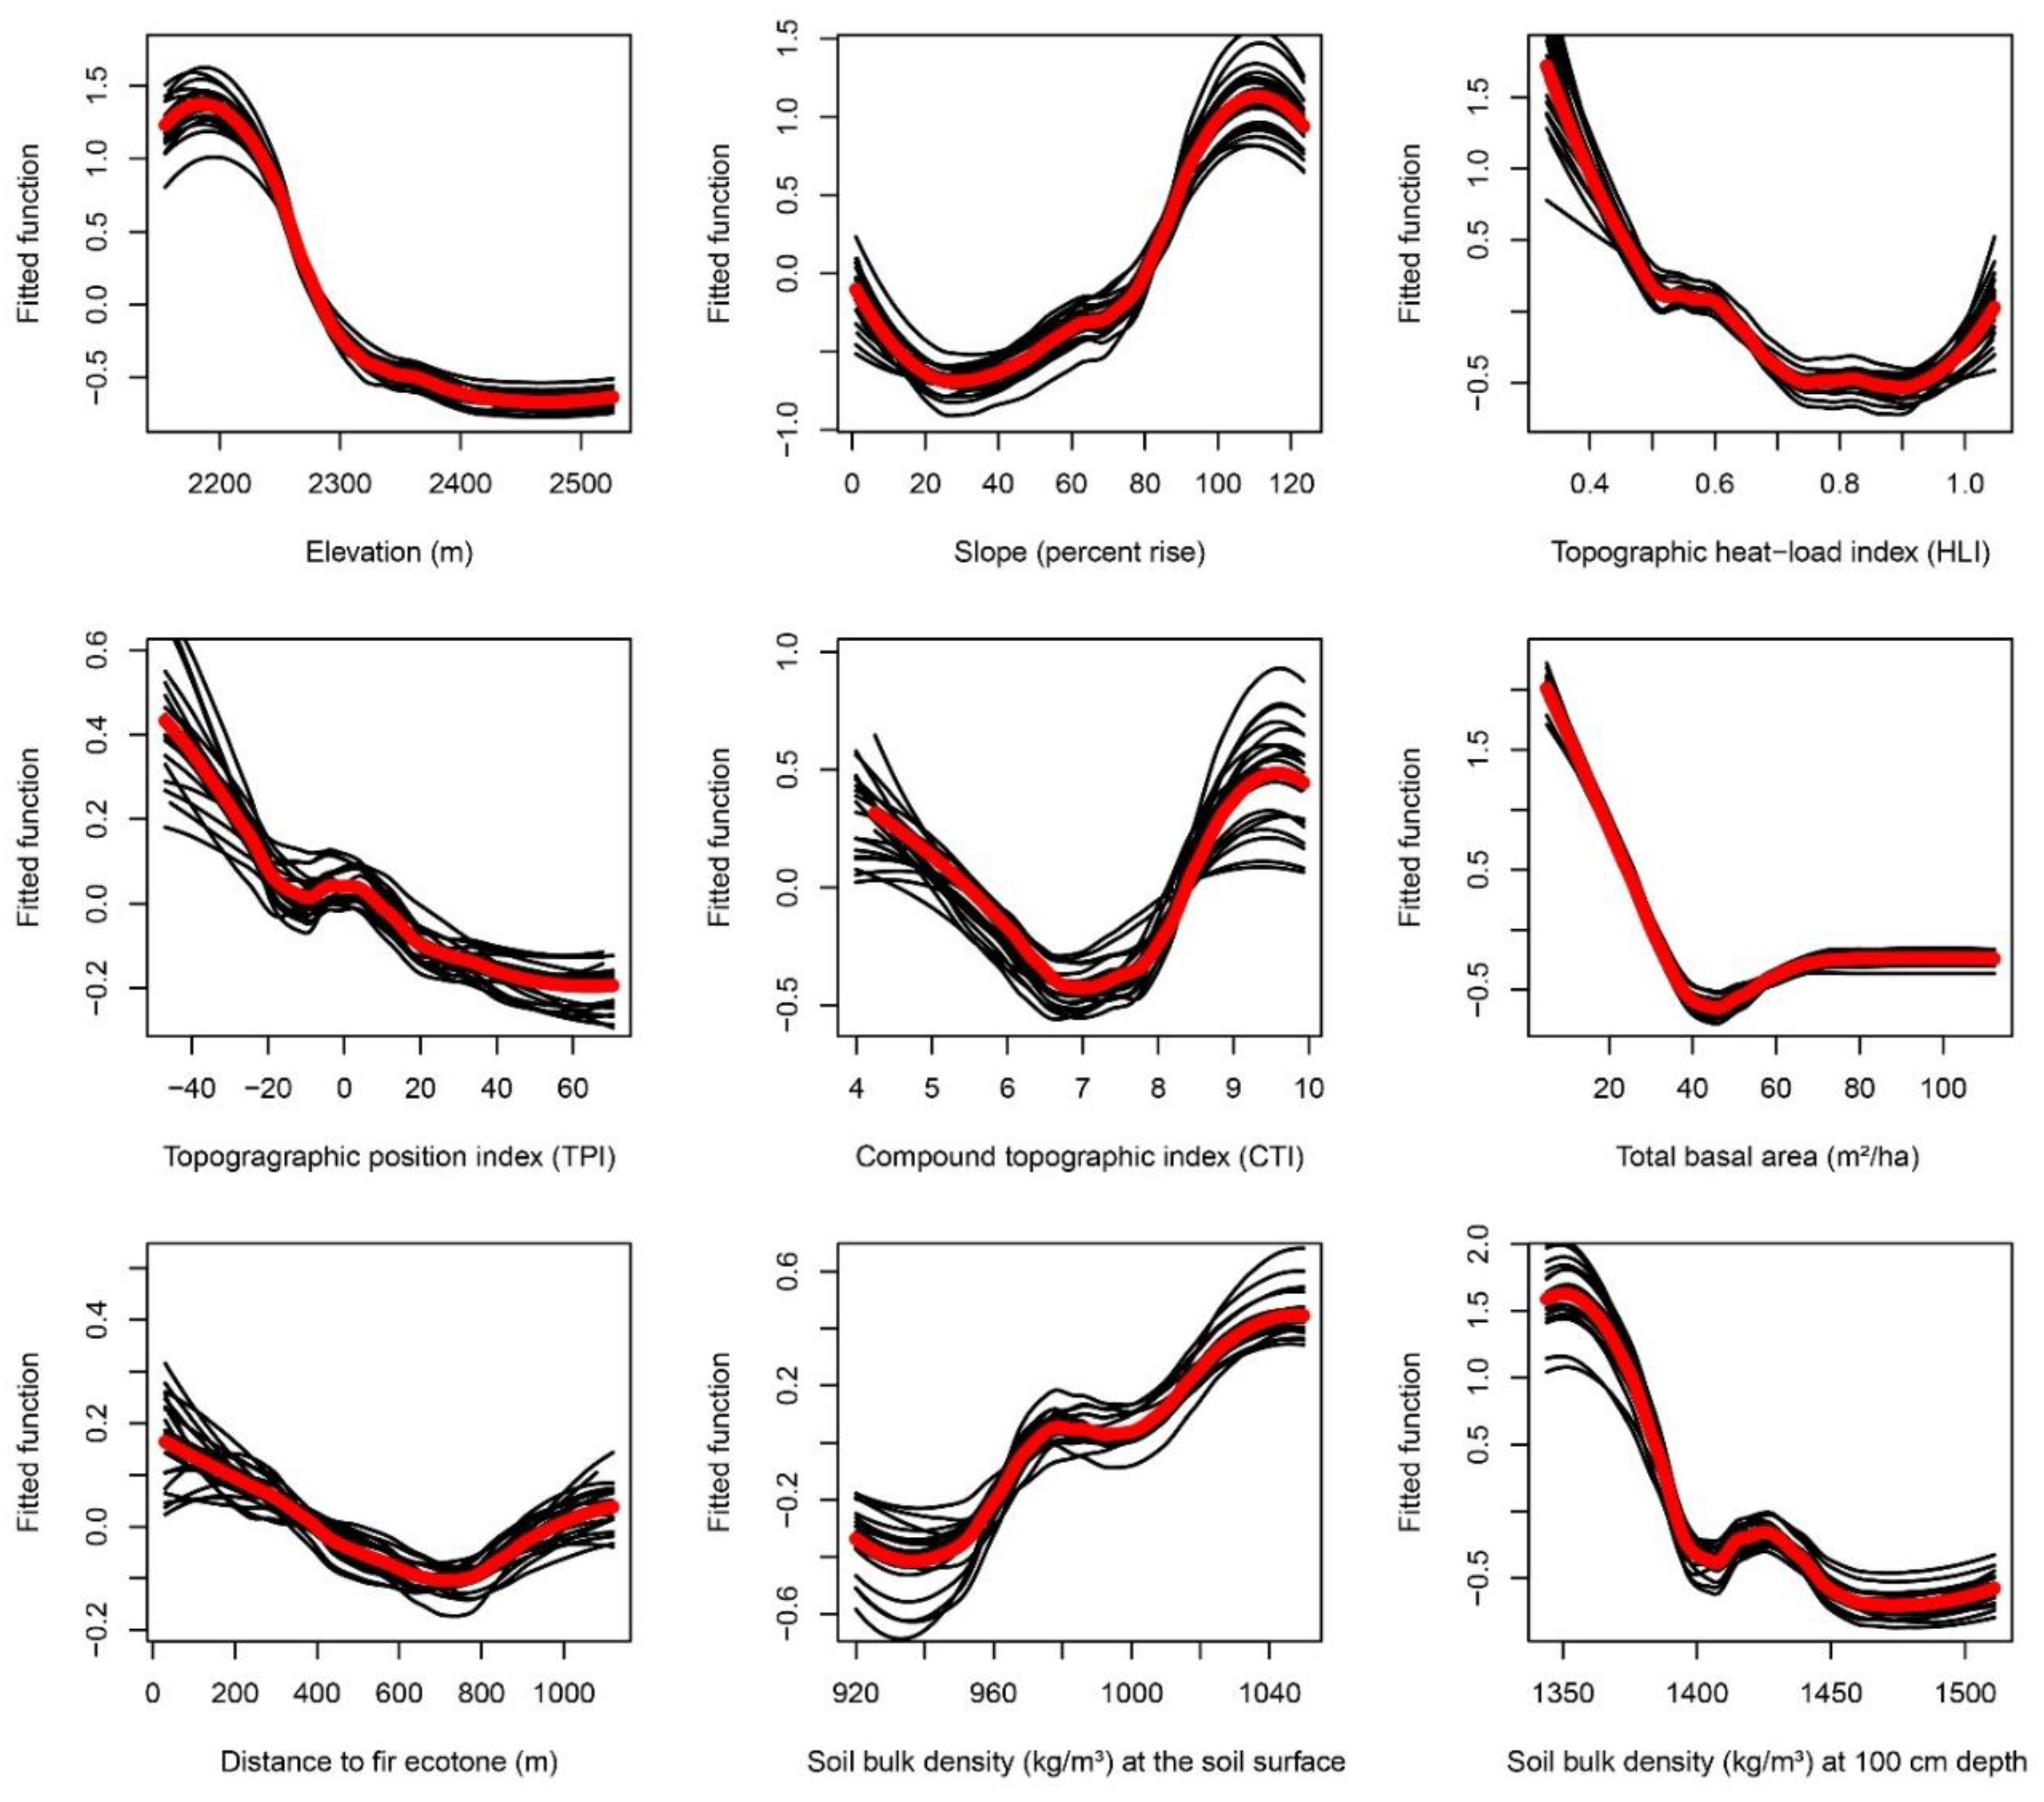
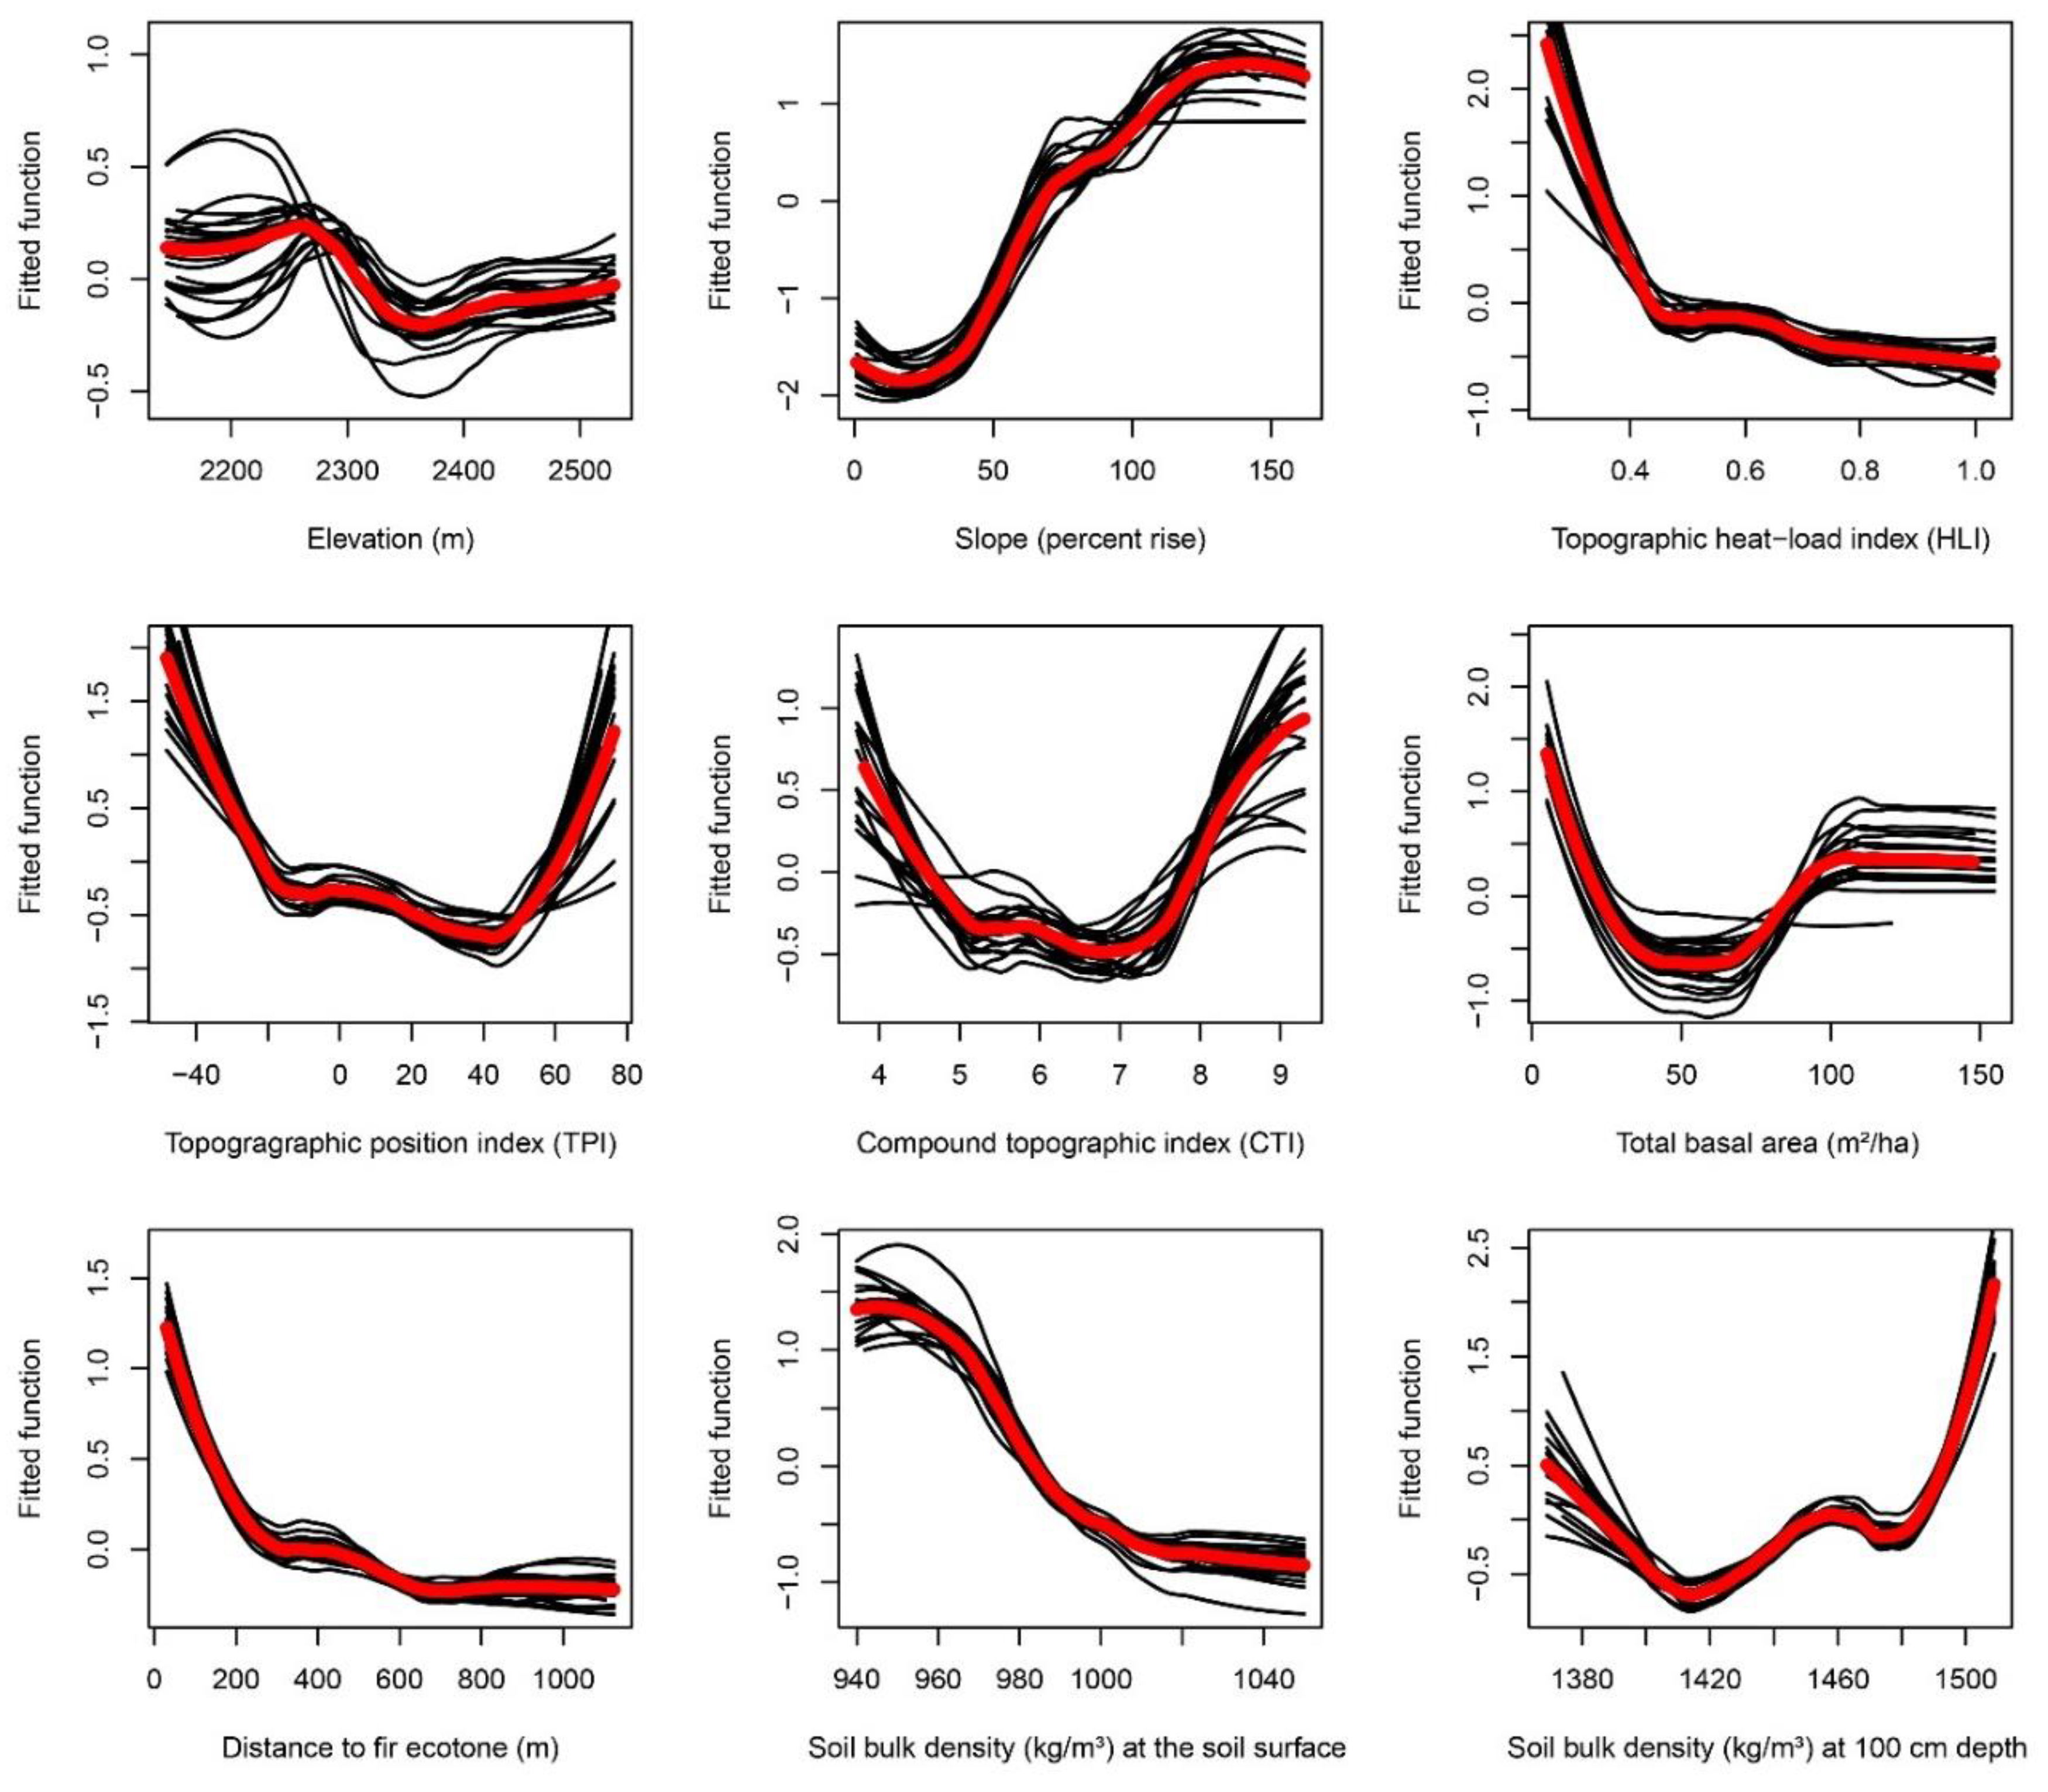
Appendix F. Partial-Dependence Plots from Boosted Regression Tree Models across 20 Bootstrapped Model Runs


References
- Allen, C.D.; Macalady, A.K.; Chenchouni, H.; Bachelet, D.; McDowell, N.; Vennetier, M.; Kitzberger, T.; Rigling, A.; Breshears, D.D.; Hogg, E.T.; et al. A global overview of drought and heat-induced tree mortality reveals emerging climate change risks for forests. For. Ecol. Manag. 2010, 259, 660–684. [Google Scholar] [CrossRef]
- Dale, V.H.; Joyce, L.; Mcnulty, S.; Neilson, R.P.; Ayres, M.P.; Flannigan, M.D.; Hanson, P.J.; Irland, L.C.; Lugo, A.E.; Peterson, C.J.; et al. Climate change and forest disturbances. Bioscience 2013, 51, 723–734. [Google Scholar] [CrossRef]
- Mattson, W.J.; Haack, R. Role of drought in outbreaks of plant-eating insects. Bioscience 1987, 37, 110–118. [Google Scholar] [CrossRef]
- Raffa, K.F.; Aukema, B.H.; Bentz, B.J.; Carroll, A.L.; Hicke, J.; Turner, M.G.; Romme, W.H. Cross-scale drivers of natural disturbances prone to anthropogenic amplification: The dynamics of bark beetle eruptions. Bioscience 2008, 58, 501–517. [Google Scholar] [CrossRef]
- Chapman, T.B.; Veblen, T.T.; Schoennagel, T. Spatiotemporal patterns of mountain pine beetle activity in the southern Rocky Mountains. Ecology 2012, 93, 2175–2185. [Google Scholar] [CrossRef] [PubMed]
- Logan, J.; Powell, J. Ghost forests, global warming, and the mountain pine beetle (Coleoptera: Scolytidae). Am. Entomol. 2001, 47, 160–173. [Google Scholar] [CrossRef]
- Buotte, P.C.; Hicke, J.; Preisler, H.K.; Abatzoglou, J.T.; Raffa, K.F.; Logan, J. Climate influences on whitebark pine mortality from mountain pine beetle in the Greater Yellowstone Ecosystem. Ecol. Appl. 2016, 26, 2507–2524. [Google Scholar] [CrossRef] [PubMed]
- Bentz, B.; Regniere, J.; Fettig, C.; Hansen, M.; Hayes, J.; Hicke, J.; Kelsey, R.; Negron, J.; Seybold, S. Climate change and bark beetles of the western United States and Canada: Direct and indirect effects. Bioscience 2010, 60, 602–613. [Google Scholar] [CrossRef]
- Perkins, D.L.; Roberts, D.W. Predictive models of whitebark pine mortality from mountain pine beetle. For. Ecol. Manag. 2003, 174, 495–510. [Google Scholar] [CrossRef]
- Keane, R.E.; Tomback, D.F.; Aubry, C.A.; Bower, A.D.; Campbell, E.M.; Cripps, C.L.; Jenkins, M.B.; Mahalovich, M.F.; Manning, M.; McKinney, S.T.; et al. A Range-Wide Restoration Strategy for Whitebark Pine (Pinus albicaulis); General Technical Report RMRS-GTR-279; Department of Agriculture, Forest Service, Rocky Mountain Research Station: Fort Collins, CO, USA, 2012. [Google Scholar]
- U.S. Fish and Wildlife Service. Endangered and threatened wildlife and plants; 12-month finding on a petition to list Pinus albicaulis as endangered or threatened with critical habitat. Fed. Regist. 2011, 76, 42631–42654. [Google Scholar]
- Morelli, T.; Maher, S.; Nydick, K.; Monahan, W.; Ebersole, J.; Daly, C.; Dobrowski, S.; Dulen, D.; Jackson, S.; Lundquist, J.; et al. Managing climate change refugia for climate adaptation. PLoS ONE 2016, 11, e0159909. [Google Scholar] [CrossRef] [PubMed]
- Dobrowski, S. A climatic basis for microrefugia: The influence of terrain on climate. Glob. Chang. Biol. 2011, 17, 1022–1035. [Google Scholar] [CrossRef]
- Lenoir, J.; Hattab, T.; Pierre, G. Climatic microrefugia under anthropogenic climate change: Implications for species redistribution. Ecography 2016, 39, 1–14. [Google Scholar] [CrossRef]
- McLaughlin, B.; Ackerly, D.D.; Klos, P.Z.; Natali, J.; Dawson, T.E.; Thompson, S.E. Hydrologic refugia, plants and climate change. Glob. Chang. Biol. 2017, 23, 1–21. [Google Scholar] [CrossRef] [PubMed]
- Krawchuk, M.; Haire, S.L.; Coop, J.D.; Parisien, M.-A.; Whitman, E.; Chong, G.W.; Miller, C. Topographic and fire weather controls of fire refugia in forested ecosystems of northwestern North America. Ecosphere 2016, 7, e01632. [Google Scholar] [CrossRef]
- Mackey, B.; Berry, S.; Hugh, S.; Ferrier, S.; Harwood, T.D.; Williams, K.J.; Mackey, B.; Berry, S.; Hugh, S.; Ferrier, S.; et al. Ecosystem greenspots: Identifying potential drought, fire, and climate-change micro-refuges. Ecol. Appl. 2012, 22, 1852–1864. [Google Scholar] [CrossRef] [PubMed]
- Gould, S.F.; Hugh, S.; Porfirio, L.L.; Mackey, B. Ecosystem greenspots pass the first test. Landsc. Ecol. 2015, 30, 141–151. [Google Scholar] [CrossRef]
- Ashcroft, M.B. Identifying refugia from climate change. J. Biogeogr. 2010, 37, 1407–1413. [Google Scholar] [CrossRef]
- Keppel, G.; Mokany, K.; Wardell-Johnson, G.W.; Phillips, B.L.; Welbergen, J.A.; Reside, A.E. The capacity of refugia for conservation planning under climate change. Front. Ecol. Environ. 2015, 13, 106–112. [Google Scholar] [CrossRef]
- Dunne, T.; Zhang, W.; Aubry, B.F. Effects of rainfall, vegetation, and microtopography on infiltration and runoff. Water Resour. Res. 1991, 27, 2271–2285. [Google Scholar] [CrossRef]
- Lundquist, J.D.; Flint, A.L. Onset of snowmelt and streamflow in 2004 in the western United States: How shading may affect spring streamflow timing in a warmer world. J. Hydrometeorol. 2006, 7, 1199–1217. [Google Scholar] [CrossRef]
- Geroy, I.J.; Gribb, M.M.; Marshall, H.P.; Chandler, D.G.; Benner, S.G.; Mcnamara, J.P. Aspect influences on soil water retention and storage. Hydrol. Process. 2011, 25, 3836–3842. [Google Scholar] [CrossRef]
- Holden, Z.; Jolly, W.M. Modeling topographic influences on fuel moisture and fire danger in complex terrain to improve wildland fire management decision support. For. Ecol. Manag. 2011, 262, 2133–2141. [Google Scholar] [CrossRef]
- Jencso, K.G.; McGlynn, B.L. Hierarchical controls on runoff generation: Topographically driven hydrologic connectivity, geology, and vegetation. Water Resour. Res. 2011, 47, 1–16. [Google Scholar] [CrossRef]
- Flint, L.E.; Flint, A.L. Downscaling future climate scenarios to fine scales for hydrologic and ecological modeling and analysis. Ecol. Process. 2012, 1, 2. [Google Scholar] [CrossRef]
- Gutiérrez-Jurado, H.; Vivoni, E.R.; Cikoski, C.; Harrison, B.J.; Bras, R.L.; Istanbulluoglu, E. On the observed ecohydrologic dynamics of a semiarid basin with aspect-delimited ecosystems. Water Resour. Res. 2013, 49, 8263–8284. [Google Scholar] [CrossRef]
- Godfree, R.; Lepschi, B.; Reside, A.; Bolger, T.; Robertson, B.; Marshall, D.; Carnegie, M. Multiscale topoedaphic heterogeneity increases resilience and resistance of a dominant grassland species to extreme drought and climate change. Glob. Chang. Biol. 2011, 17, 943–958. [Google Scholar] [CrossRef]
- Shore, T.; Safranyik, L.; Lemieux, J. Susceptibility of lodgepole pine strands to the mountain pine beetle: Testing of a rating system. Can. J. For. Res. 2000, 30, 44–49. [Google Scholar] [CrossRef]
- Guarín, A.; Taylor, A.H. Drought triggered tree mortality in mixed conifer forests in Yosemite National Park, California, USA. For. Ecol. Manag. 2005, 218, 229–244. [Google Scholar] [CrossRef]
- Gibson, K.; Skov, K.; Kegley, S.; Jorgensen, C.; Smith, S.; Witcosky, J. Mountain Pine Beetle Impacts in High-Elevation Five-Needle Pines: Current Trends and Challenges; R1-08-020; USDA Forest Service: Missoula, MT, USA, 2008. [Google Scholar]
- Cooper, L.A.; Reed, C.C.; Ballantyne, A.P. Mountain pine beetle attack faster growing lodgepole pine at low elevations in western Montana, USA. For. Ecol. Manag. 2018, 427, 200–207. [Google Scholar] [CrossRef]
- Kaiser, K.E.; Mcglynn, B.L.; Emanuel, R.E. Ecohydrology of an outbreak: Mountain pine beetle impacts trees in drier landscape positions first. Ecohydrology 2013, 6, 444–454. [Google Scholar] [CrossRef]
- Daly, C.; Neilson, R.; Phillips, D. A statistical-topographic model for mapping climatological precipitation over mountainous terrain. J. Appl. Meteorol. 1994, 33, 140–158. [Google Scholar] [CrossRef]
- Stephenson, N.L. Actual evapotranspiration and deficit: Biologically meaningful correlates of vegetation distribution across spatial scales. J. Biogeogr. 1998, 25, 855–870. [Google Scholar] [CrossRef]
- Amman, G.D. Population changes of the mountain pine beetle in relation to elevation. Environ. Entomol. 1973, 4, 541–547. [Google Scholar] [CrossRef]
- Régnière, J.; Bentz, B. Modeling cold tolerance in the mountain pine beetle, Dendroctonus ponderosae. J. Insect Physiol. 2007, 53, 559–572. [Google Scholar] [CrossRef] [PubMed]
- Essery, R.; Li, L.; Pomeroy, J. A distributed model of blowing snow over complex terrain. Hydrol. Process. 1999, 13, 2423–2438. [Google Scholar] [CrossRef]
- Billings, W.; Bliss, L. An alpine snowbank environment and its effects on vegetation, plant development, and productivity. Ecology 1959, 40, 388–397. [Google Scholar] [CrossRef]
- Sturm, M.; McFadden, J.P.; Liston, G.E.; Chapin III, F.S.; Racine, C.H.; Holmgren, J.; Stuart Chapin, F.; Racine, C.H.; Holmgren, J. Snow—Shrub interactions in arctic tundra: A hypothesis with climatic implications. J. Clim. 2001, 14, 336–344. [Google Scholar] [CrossRef]
- Coops, N.C.; Wulder, M.; White, J.C. Integrating remotely sensed and ancillary data sources to characterize a mountain pine beetle infestation. Remote Sens. Environ. 2006, 105, 83–97. [Google Scholar] [CrossRef]
- Millar, C.I.; Charlet, D.A.; Westfall, R.D.; King, J.C.; Delany, D.L.; Flint, A.L.; Flint, L.E. Do low-elevation ravines provide climate refugia for subalpine limber pine (Pinus flexilis) in the Great Basin, USA? Can. J. For. Res. 2018, 48, 663–671. [Google Scholar] [CrossRef]
- Wulder, M.; White, J.C.; Bentz, B.; Alvarez, M.F.; Coops, N.C. Estimating the probability of mountain pine beetle red-attack damage. Remote Sens. Environ. 2006, 101, 150–166. [Google Scholar] [CrossRef]
- Buttrick, S.; Popper, K.; Schindel, M.; Mcrae, B.; Unnasch, B.; Jones, A.; Platt, J. Conserving Nature’s Stage: Identifying Resilient Terrestrial Landscapes in the Pacific Northwest; The Nature Conservancy: Portland, OR, USA, 2015. [Google Scholar]
- Basso, A.S.; Miguez, F.E.; Laird, D.; Horton, R.; Westgate, M. Assessing potential of biochar for increasing water-holding capacity of sandy soils. GCB Bioenergy 2013, 5, 132–143. [Google Scholar] [CrossRef]
- Siegel-Issem, C.M.; Burger, J.; Powers, R.; Ponder, F.; Patterson, S. Seedling root growth as a function of soil density and water content. Soil Sci. Soc. Am. J. 2005, 69, 215–226. [Google Scholar] [CrossRef]
- Wulder, M.; Dymond, C.C.; White, J.C.; Leckie, D.G.; Carroll, A.L. Surveying mountain pine beetle damage of forests: A review of remote sensing opportunities. For. Ecol. Manag. 2006, 221, 27–41. [Google Scholar] [CrossRef]
- Vogelmann, J.E.; Xian, G.; Homer, C.; Tolk, B. Monitoring gradual ecosystem change using Landsat time series analyses: Case studies in selected forest and rangeland ecosystems. Remote Sens. Environ. 2012, 122, 92–105. [Google Scholar] [CrossRef]
- Meddens, A.J.H.; Hicke, J.A.; Vierling, L.A.; Hudak, A.T. Evaluating methods to detect bark beetle-caused tree mortality using single-date and multi-date Landsat imagery. Remote Sens. Environ. 2013, 132, 49–58. [Google Scholar] [CrossRef]
- Walter, J.; Platt, R.V. Multi-temporal analysis reveals that predictors of mountain pine beetle infestation change during outbreak cycles. For. Ecol. Manag. 2013, 302, 308–318. [Google Scholar] [CrossRef]
- Assal, T.J.; Anderson, P.J.; Sibold, J. Spatial and temporal trends of drought effects in a heterogeneous semi-arid forest ecosystem. For. Ecol. Manag. 2016, 365, 137–151. [Google Scholar] [CrossRef]
- Schwantes, A.M.; Swenson, J.J.; Jackson, R.B. Quantifying drought-induced tree mortality in the open canopy woodlands of central Texas. Remote Sens. Environ. 2016, 181, 54–64. [Google Scholar] [CrossRef]
- Walker, G.; Ridenour, J. Mineral. Resource Potential of the Gearhart Mountain Wilderness and Roadless Area, Lake and Klamath Counties, Oregon; U.S. Geological Survey: Reston, VA, USA, 1982. [Google Scholar]
- PRISM Climate Group. PRISM Data Explorer: Time Series Values for Individual Locations. Available online: http://prism.oregonstate.edu/explorer/ (accessed on 1 December 2016).
- Ellenwood, J.R.; Krist, F.J.J.; Romero, S.A. National Individual Tree Species Atlas; U.S. Forest Service, Forest Health Technology Enterprise Team: Fort Collins, CO, USA, 2015. [Google Scholar]
- Beguería, S.; Vicente-Serrano, S. Global SPEI Database, SPEIbase Version 2.4. Available online: http://spei.csic.es/database.html (accessed on 1 May 2017).
- U.S. Forest Service Aerial Insect and Disease Survey GIS Data for Oregon and Washington 1947-Present. Available online: https://www.fs.usda.gov/detail/r6/forest-grasslandhealth/insects-diseases/?cid=stelprd3791643 (accessed on 1 December 2016).
- Eidenshink, J.; Schwind, B.; Brewer, K.; Zhu, Z.; Quayle, B.; Howard, S. A project for monitoring trends in burn severity. Fire Ecol. 2007, 3, 3–21. [Google Scholar] [CrossRef]
- LandFire Program LandFire Data Distribution Site. Available online: https://www.landfire.gov/viewer/ (accessed on 1 November 2016).
- Goodwin, N.R.; Coops, N.C.; Wulder, M.; Gillanders, S.; Schroeder, T.; Nelson, T. Estimation of insect infestation dynamics using a temporal sequence of Landsat data. Remote Sens. Environ. 2008, 112, 3680–3689. [Google Scholar] [CrossRef]
- Czerwinski, C.J.; King, D.J.; Mitchell, S.W. Mapping forest growth and decline in a temperate mixed forest using temporal trend analysis of Landsat imagery, 1987–2010. Remote Sens. Environ. 2014, 141, 188–200. [Google Scholar] [CrossRef]
- Hope, A.; Fouad, G.; Granovskaya, Y. Evaluating drought response of Southern Cape Indigenous Forests, South Africa, using MODIS data. Int. J. Remote Sens. 2014, 35, 4852–4864. [Google Scholar] [CrossRef]
- Huntington, J.; Mcgwire, K.; Morton, C.; Snyder, K.; Peterson, S.; Erickson, T.; Niswonger, R.; Carroll, R.; Smith, G.; Allen, R. Assessing the role of climate and resource management on groundwater dependent ecosystem changes in arid environments with the Landsat archive. Remote Sens. Environ. 2016, 185, 186–197. [Google Scholar] [CrossRef]
- U.S. Geological Survey. Product Guide: Landsat Surface Reflectance-Derived Spectral Indices; USGS Earth Resources Observation and Science (EROS): Sioux Falls, SD, USA, 2016.
- R Core Team. R: A Language and Environment for Statistical Computing. Available online: https://www.r-project.org (accessed on 1 February 2017).
- Hijmans, R.J. Raster: Geographic Data Analysis and Modeling, R Package Version 2.5-8. Available online: https://cran.r-project.org/web/packages/raster/raster.pdf (accessed on 1 May 2017).
- Cartwright, J. Analysis of Remotely-sensed Vegetation Conditions during Droughts and a Mountain Pine Beetle Outbreak, Gearhart Mountain Wilderness, Oregon. U.S. Geological Survey data release. Available online: https://doi.org/10.5066/f74q7swx (accessed on 16 November 2018).
- U.S. Geological Survey National Elevation Dataset (NED). Available online: https://lta.cr.usgs.gov/NED (accessed on 23 February 2017).
- Hengl, T.; de Jesus, J.M.; Heuvelink, G.B.M.; Gonzalez, M.R.; Kilibarda, M.; Blagotí, A.; Shangguan, W.; Wright, M.N.; Geng, X.; Bauer-Marschallinger, B.; et al. SoilGrids250m: Global gridded soil information based on machine learning. PLoS ONE 2017, 12, e0169748. [Google Scholar] [CrossRef] [PubMed]
- Friedman, J.; Hastie, T.; Tibshirani, R. Additive logistic regression: A statistical view of boosting. Ann. Stat. 2000, 28, 337–407. [Google Scholar] [CrossRef]
- Elith, J.; Leathwick, J.R.; Hastie, T. A working guide to boosted regression trees. J. Anim. Ecol. 2008, 77, 802–813. [Google Scholar] [CrossRef] [PubMed]
- Parisien, M.; Mortiz, M. Environmental controls on the distribution of wildfire at multiple spatial scales. Ecol. Monogr. 2009, 79, 127–154. [Google Scholar] [CrossRef]
- Perry, G.; Wilmshurst, J.; Mcglone, M.; Napier, A. Reconstructing spatial vulnerability to forest loss by fire in pre-historic New Zealand. Glob. Ecol. Biogeogr. 2012, 21, 1029–1041. [Google Scholar] [CrossRef]
- Swets, J. Measuring the accuracy of diagnostic systems. Science 1988, 240, 1285–1293. [Google Scholar] [CrossRef] [PubMed]
- Trumbo, D.R.; Burgett, A.; Hopkins, R.L.; Biro, E.G.; Chase, J.M.; Knouft, J.H. Integrating local breeding pond, landcover, and climate factors in predicting amphibian distributions. Landsc. Ecol. 2012, 27, 1183–1196. [Google Scholar] [CrossRef]
- Ridgeway, G. Gbm: Generalized Boosted Regression Models, R Package Version 2.1.3. Available online: https://cran.r-project.org/web/packages/gbm/gbm.pdf (accessed on 1 May 2017).
- Hijmans, R.; Phillips, S.; Leathwick, J.; Elith, J. Dismo: Species Distribution Modeling, R Package Version 1.1-4. Available online: https://cran.r-project.org/web/packages/dismo/dismo.pdf (accessed on 1 May 2017).
- Powers, J.S.; Sollins, P.; Harmon, M.E.; Jones, J. Plant-pest interactions in time and space: A Douglas-fir bark beetle outbreak as a case study. Landsc. Ecol. 1999, 14, 105–120. [Google Scholar] [CrossRef]
- Huang, C.Y.; Anderegg, W.R.L. Large drought-induced aboveground live biomass losses in southern Rocky Mountain aspen forests. Glob. Chang. Biol. 2012, 18, 1016–1027. [Google Scholar] [CrossRef]
- Adams, H.R.; Barnard, H.R.; Loomis, A.K. Topography alters tree growth–climate relationships in a semi-arid forested catchment. Ecosphere 2014, 5, art148. [Google Scholar] [CrossRef]
- Matimati, I. The Relevance of Fog and Dew Precipitation to Succulent Plant Hydrology in an Arid South African Ecosystem. Ph.D. Thesis, University of the Western Cape, Bellville, South Africa, May 2009. [Google Scholar]
- Hill, A.J.; Dawson, T.E.; Shelef, O.; Rachmilevitch, S. The role of dew in Negev Desert plants. Oecologia 2015, 178, 317–327. [Google Scholar] [CrossRef] [PubMed]
- Fischer, D.T.; Still, C.J.; Williams, A.P. Significance of summer fog and overcast for drought stress and ecological functioning of coastal California endemic plant species. J. Biogeogr. 2009, 36, 783–799. [Google Scholar] [CrossRef]
- Sevruk, B. Regional dependency of precipitation-altitude relationship in the swiss alps. Clim. Chang. 1997, 36, 355–369. [Google Scholar] [CrossRef]
- Watson, F.G.R.; Anderson, T.N.; Kramer, M.; Detka, J.; Masek, T.; Cornish, S.S.; Moore, S.W. Chapter 5: Effects of wind, terrain, and vegetation on snow pack. In The Ecology of Large Mammals in Central Yellowstone; Garrott, R., White, P., Watson, F., Eds.; Elsevier Inc.: Boston, MA, USA, 2009; Volume 3, pp. 68–84. [Google Scholar]
- Lundquist, J.D.; Pepin, N.; Rochford, C. Automated algorithm for mapping regions of cold-air pooling in complex terrain. J. Geophys. Res. 2008, 113, D22. [Google Scholar] [CrossRef]
- Scott, G.L.; McCaughey, W.W. Whitebark pine guidelines for planting prescriptions. In National Proceedings: Forest and Conservation Nursery Associations—2005; Proc. RMRS-P-43; Riley, L.E., Dumroese, R.K., Landis, T.D., Eds.; U.S. Department of Agriculture, Forest Service, Rocky Mountain Research Station: Fort Collins, CO, USA, 2006; pp. 84–90. [Google Scholar]
- Miller, D.A.; White, R.A. A conterminous United States multilayer soil characteristics dataset for regional climate and hydrology modeling. Earth Interact. 1998, 2, 1–26. [Google Scholar] [CrossRef]
- Larsson, S.; Oren, R.; Waring, R.H.; Barrett, J.W. Attacks of mountain pine beetle as related to tree vigor of ponderosa pine. For. Sci. 1983, 29, 395–402. [Google Scholar]
- Whitehead, R.; Safranyik, L.; Shore, T. Preventative management. In The Mountain Pine Beetle: A Synthesis of Biology, Management, and Impacts on Lodgepole Pine; Safranyik, L., Wilson, B., Eds.; Natural Resources Canada, Canadian Forest Service: Victoria, BC, Canada, 2006; pp. 173–193. [Google Scholar]
- Woods, S.W.; Ahl, R.; Sappington, J.; Mccaughey, W. Snow accumulation in thinned lodgepole pine stands, Montana, USA. For. Ecol. Manag. 2006, 235, 202–211. [Google Scholar] [CrossRef]
- McKinney, S.T.; Fiedler, C.E. Tree squirrel habitat selection and predispersal seed predation in a declining subalpine conifer. Oecologia 2010, 162, 697–707. [Google Scholar] [CrossRef] [PubMed]
- Weaver, T. Whitebark pine and its environment. In Whitebark Pine Communities: Ecology and Restoration; Tomback, D.F., Arno, S.F., Keane, R.E., Eds.; Island Press: Washington, DC, USA, 2001; pp. 42–73. [Google Scholar]
- Raffa, K.F.; Mason, C.J.; Bonello, P.; Cook, S.; Erbilgin, N.; Keefover-Ring, K.; Klutsch, J.G.; Villari, C.; Townsend, P.A. Defence syndromes in lodgepole—Whitebark pine ecosystems relate to degree of historical exposure to mountain pine beetles. Plant Cell. Environ. 2017, 40, 1791–1806. [Google Scholar] [CrossRef] [PubMed]
- Keppel, G.; van Niel, K.; Wardell-Johnson, G.; Yates, C.J.; Byrne, M.; Mucina, L.; Schut, A.G.T.; Hopper, S.D.; Franklin, S.E. Refugia: Identifying and understanding safe havens for biodiversity under climate change. Glob. Ecol. Biogeogr. 2012, 21, 393–404. [Google Scholar] [CrossRef]
- Buma, B. Disturbance interactions: Characterization, prediction, and the potential for cascading effects. Ecosphere 2015, 6, 1–15. [Google Scholar] [CrossRef]
- Meddens, A.J.H.; Kolden, C.A.; Lutz, J.A.; Smith, A.M.S.; Cansler, C.A.; Abatzoglou, J.T.; Meigs, G.W.; Downing, W.M.; Krawchuk, M.A. Fire refugia: What are they, and why do they matter for global change? Bioscience 2018, 1–11. [Google Scholar] [CrossRef]
- Ruefenacht, B.; Finco, M.V.; Nelson, M.D.; Czaplewski, R.; Helmer, E.H.; Blackard, J.A.; Holden, G.R.; Lister, A.J.; Salajanu, D.; Weyermann, D.; et al. Conterminous, U.S. and Alaska forest type mapping using Forest Inventory and Analysis data. Photogramm. Eng. Remote Sens. 2008, 74, 1379–1388. [Google Scholar] [CrossRef]


| Variable | Hypothesized Relationship | Mechanism |
|---|---|---|
| Elevation (m) | positive | More refugia are expected at higher elevations. Higher elevations are generally associated with greater precipitation [34] and lower evaporative demand [35]. Greater snowpack and later onset of spring snowmelt at higher elevations may help maintain soil moisture, especially on leeward slopes and in topographically shaded areas. Cooler temperatures at higher elevations are less conducive to MPB brood survival [36,37]. |
| Slope (percent rise) | unknown | Depending on which physical mechanisms dominate, refugia might be associated with flatter areas or alternatively with steeper slopes. Steeper slopes promote faster runoff and less infiltration of rainfall and snowmelt, potentially creating drier soils [33]; however, steep leeward slopes near ridgelines where snowdrifts accumulate may have deeper snowpack that persists later into the growing season [38,39,40]. Snowmelt may be further delayed and growing season temperatures and evapotranspiration (ET) may be reduced on steep slopes that are topographically shaded [22,24]. Steeper slopes may also support lower density stands with fewer large-diameter mature trees, resulting in less competition for soil water during droughts and less favorable conditions for MPB [41]. |
| Topographic position index (TPI) calculated with 300-m radius | negative | More refugia are expected in topographically concave areas. Low TPI indicates landscape concavity, e.g., coves or valley bottoms where cold-air pooling (CAP) may occur. CAP may enable dew formation and/or higher humidity, moderating the effects of drought [15,42]. Cooler temperatures and higher humidity associated with CAP might suppress MPB infestation. |
| Topographic heat load index (HLI) Low HLI indicates topographic shading | negative | More refugia are expected in topographically shaded areas on poleward-facing slopes). In low-HLI (topographically shaded) areas, reduced evaporative demand could maintain greater soil moisture during droughts [30,35,42]. Spring snowmelt may occur later in these areas, allowing soil moisture to last longer into the growing season [22,24]. Topographically shaded slopes have been shown to have greater soil water retention [23]. MPB generally favors warmer, south-facing slopes (high HLI areas) that are more favorable to brood survival [43]. |
| Compound topographic index (CTI) Higher CTI associated with streams & riparian areas, lower values are ridgetops | positive | More refugia are expected in riparian areas. Topographic convergence predicts groundwater expression in streams and riparian water tables [15] and acts as a steady-state wetness index [44]. CTI is positively related to soil depth, silt and clay content, and water holding capacity [41]. Areas of high CTI (stream channels, riparian areas) are expected to maintain greater soil moisture during droughts than low CTI-areas (ridgetops). |
| Soil bulk density (SBD; kg/m3) SBD0 cm = SBD at the soil surface; SBD100 cm = SBD at 1-m depth | negative | More refugia are expected where soils are less dense/compacted. Lower soil bulk density allows greater infiltration of rainfall and snowmelt and is associated with higher porosity and thus greater water-holding capacity of soil [23,45]. Also, lower bulk density facilitates greater root elongation and density [45,46]. In turn, trees with more extensive root systems may be more resilient to drought. |
| Total basal area (m2/ha) Higher basal area indicates greater forest density | negative | More refugia are expected in areas with low forest density. Densely stocked forests may have increased vulnerability to drought mortality [30]. Forest density is positively associated with severity of MPB damage and mortality, particularly for large-diameter trees [9,31]. |
| Distance to ecotone with fir forest (m) | negative | More refugia (in LP and WP stands) are expected closer to the ecotone with fir forest. MPB host tree species (LP and WP) may be buffered from MPB outbreak severity near forest ecotones to MPB-resistant fir species. |
| Percent fir (%) | positive | More refugia (in LP and WP stands) are expected in grid cells with a greater percentage of fir trees. MPB host species may be buffered from MPB outbreak severity if they are in less-homogenous forest stands or embedded in a matrix of MPB-resistant fir species. |
| BRT Model Parameters | Canopy Type | |||||
|---|---|---|---|---|---|---|
| Lodgepole | Lodgepole–Whitebark | Whitebark | ||||
| Year | 2001 * | 2009 * | 2001 | 2009 * | 2001 | 2009 * |
| Learning rate | 0.0015 | 0.0025 | 0.0015 | 0.003 | 0.002 | 0.0045 |
| Number of trees | 3750 (769) | 4250 (596) | 3475 (617) | 3125 (535) | 3525 (786) | 3725 (658) |
| AUC-ROC | 0.77 (0.02) | 0.86 (0.02) | 0.71 (0.01) | 0.85 (0.01) | 0.74 (0.01) | 0.88 (0.01) |
| Cross-validated correlation | 0.3 (0.03) | 0.44 (0.05) | 0.19 (0.02) | 0.42 (0.02) | 0.27 (0.03) | 0.51 (0.02) |
| Percent deviance explained | 39.4 (4.21) | 56.75 (4.08) | 33.4 (3.45) | 52.65 (3.53) | 39.35 (4.52) | 66 (3.71) |
| Relative influence | ||||||
| Total basal area (15.9) | 14.29 (2.11) | 16.97 (2.08) | 20.69 (1.17) | 11.72 (0.77) | ||
| SBD100cm (13.4) | 16.35 (2.49) | 15.26 (2.48) | 12.51 (0.86) | 9.28 (0.79) | ||
| Slope (12.5) | 8.36 (1.63) | 10.16 (0.93) | 12.27 (0.57) | 19.22 (1.18) | ||
| Elevation (11.2) | 10.86 (1.78) | 11.54 (1.51) | 13.9 (0.71) | 8.38 (0.88) | ||
| HLI (10.9) | 9.96 (1.97) | 9.26 (1.43) | 11.81 (0.83) | 12.5 (1.09) | ||
| SBD0cm (10.3) | 9.2 (2.54) | 14.06 (2.78) | 6.78 (0.72) | 10.98 (1.09) | ||
| TPI (9.0) | 11.43 (2.14) | 6.67 (1.04) | 7.34 (0.7) | 10.54 (0.95) | ||
| CTI (8.1) | 8.8 (1.38) | 7.11 (1.05) | 8.33 (0.51) | 8 (0.92) | ||
| Distance to fir (7.3) | 7.68 (1.97) | 6.28 (1.23) | 5.7 (0.45) | 9.41 (0.61) | ||
| Percent fir (1.6) | 3.04 (1.18) | 2.69 (0.76) | 0.66 (0.18) | 0 (0) | ||
© 2018 by the author. Licensee MDPI, Basel, Switzerland. This article is an open access article distributed under the terms and conditions of the Creative Commons Attribution (CC BY) license (http://creativecommons.org/licenses/by/4.0/).
Share and Cite
Cartwright, J. Landscape Topoedaphic Features Create Refugia from Drought and Insect Disturbance in a Lodgepole and Whitebark Pine Forest. Forests 2018, 9, 715. https://doi.org/10.3390/f9110715
Cartwright J. Landscape Topoedaphic Features Create Refugia from Drought and Insect Disturbance in a Lodgepole and Whitebark Pine Forest. Forests. 2018; 9(11):715. https://doi.org/10.3390/f9110715
Chicago/Turabian StyleCartwright, Jennifer. 2018. "Landscape Topoedaphic Features Create Refugia from Drought and Insect Disturbance in a Lodgepole and Whitebark Pine Forest" Forests 9, no. 11: 715. https://doi.org/10.3390/f9110715
APA StyleCartwright, J. (2018). Landscape Topoedaphic Features Create Refugia from Drought and Insect Disturbance in a Lodgepole and Whitebark Pine Forest. Forests, 9(11), 715. https://doi.org/10.3390/f9110715