Whitebark and Foxtail Pine in Yosemite, Sequoia, and Kings Canyon National Parks: Initial Assessment of Stand Structure and Condition

Abstract
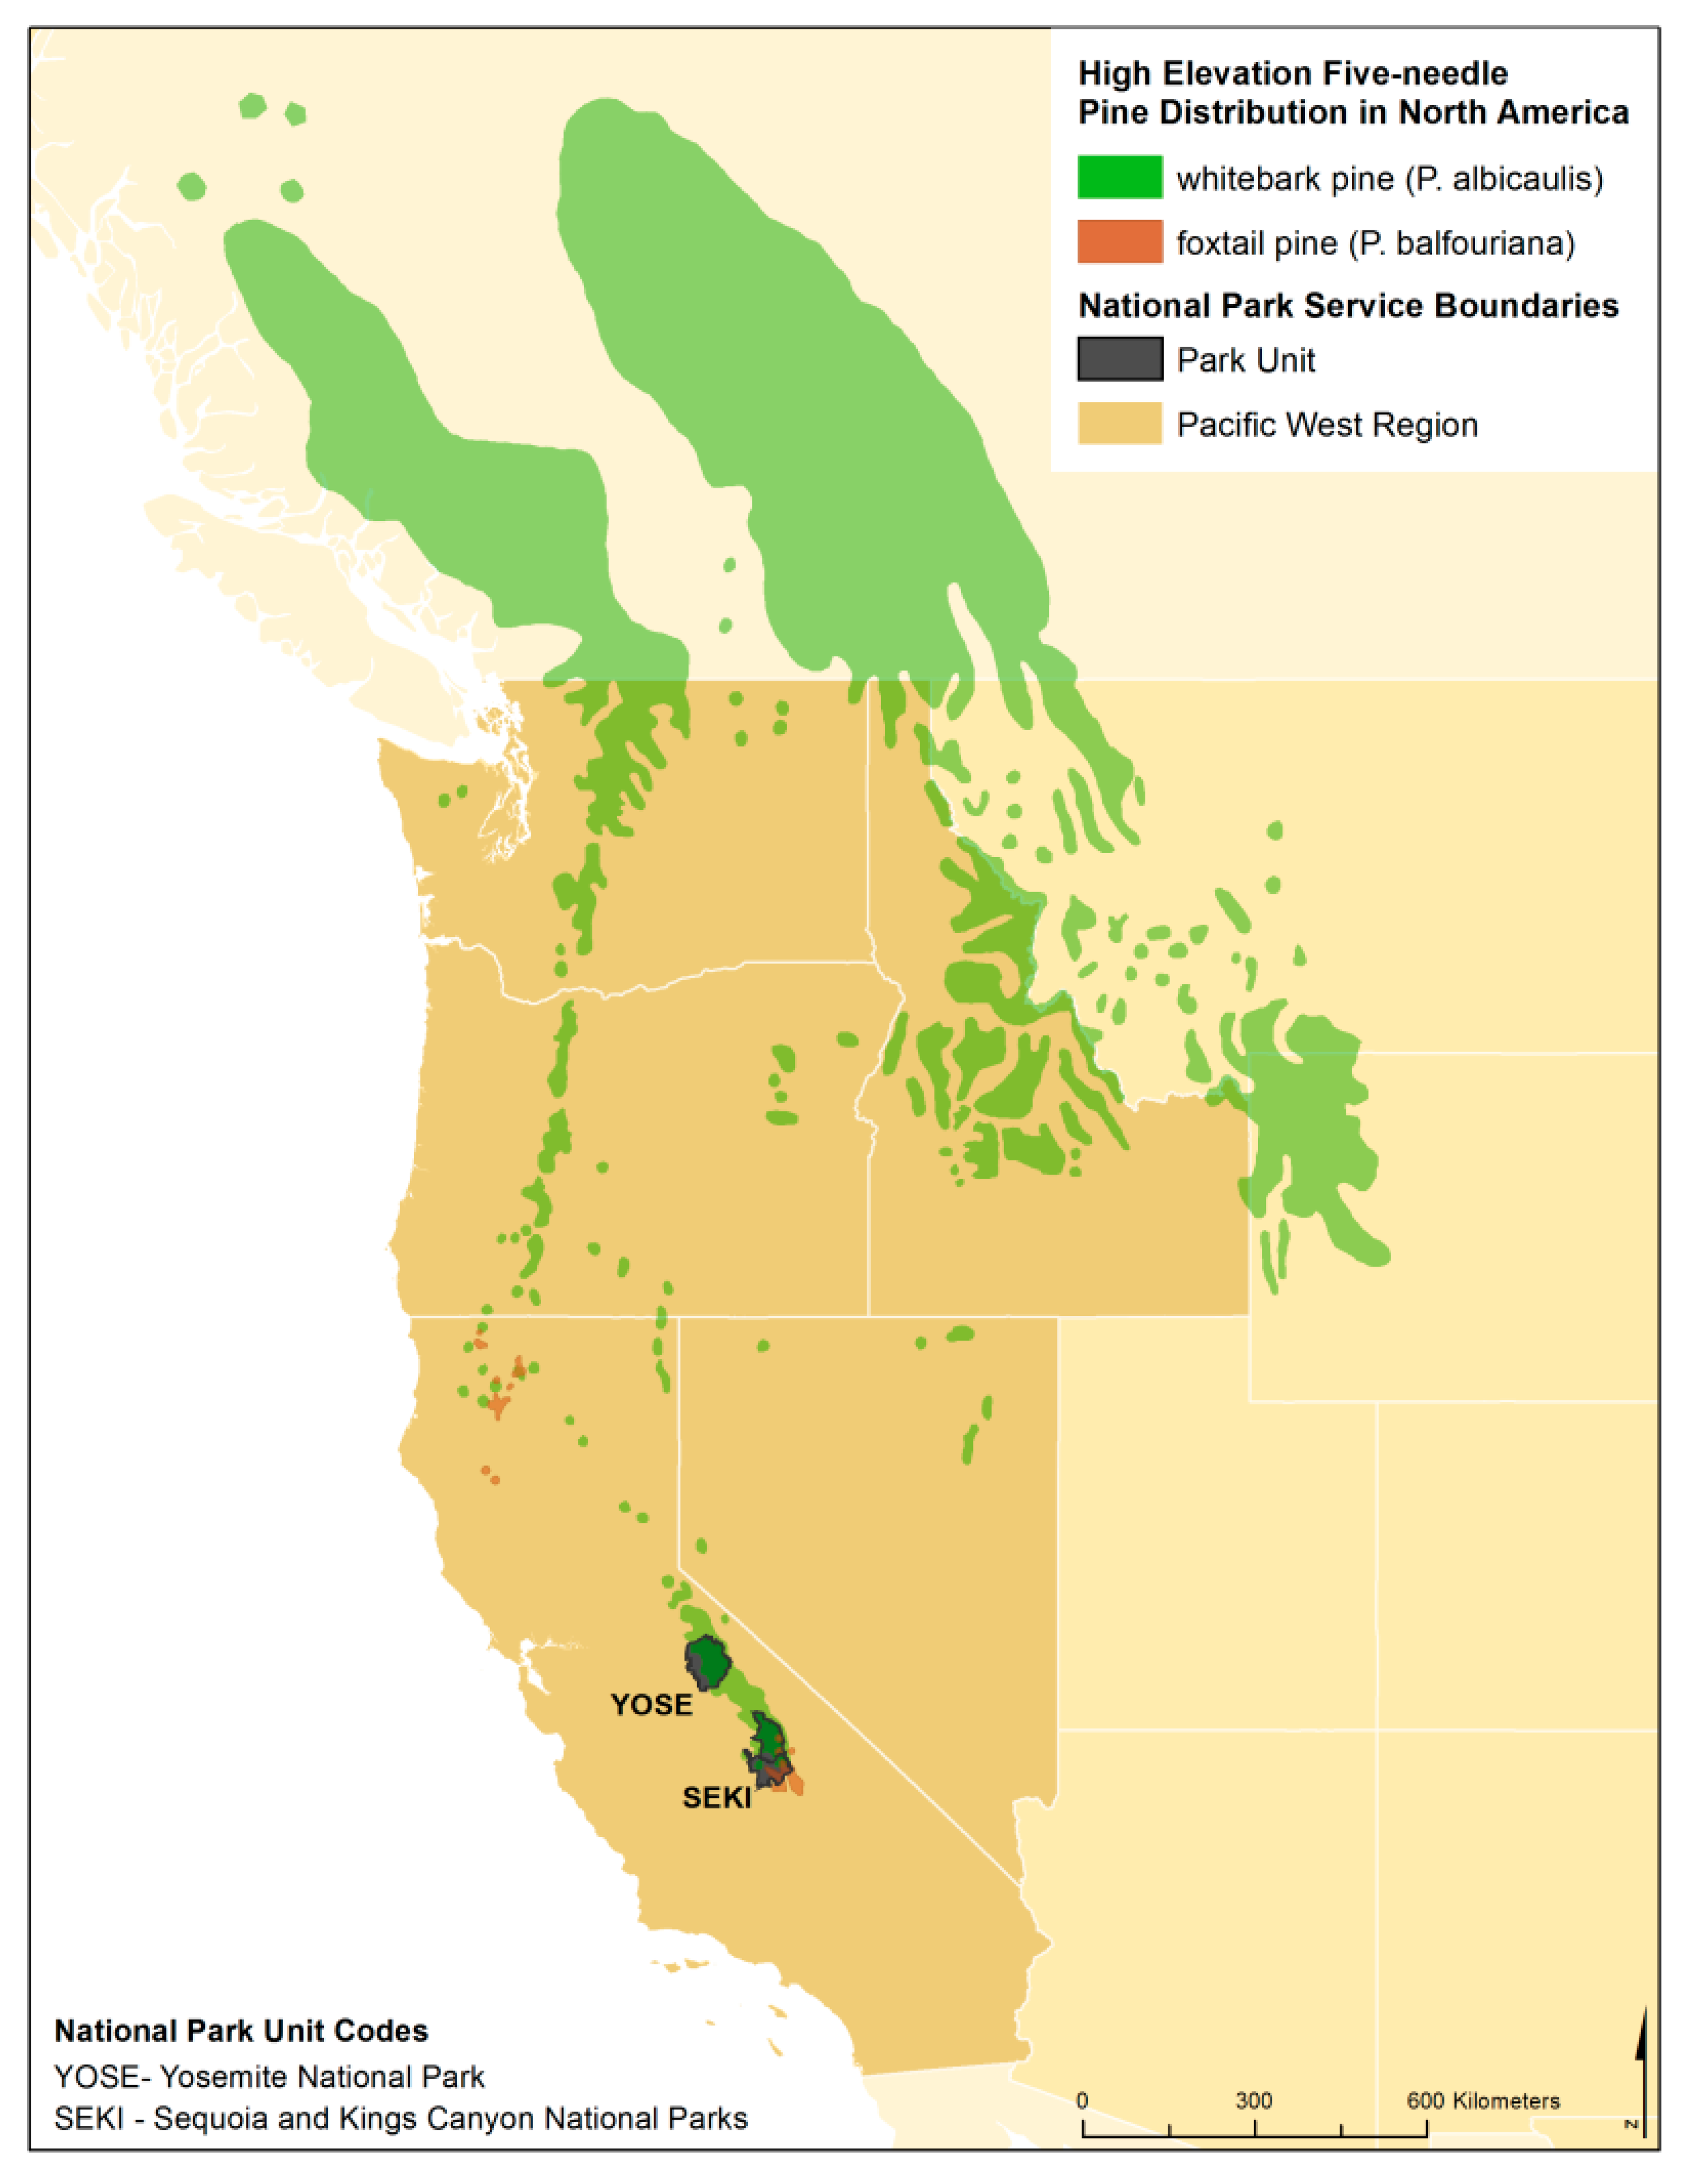
1. Introduction
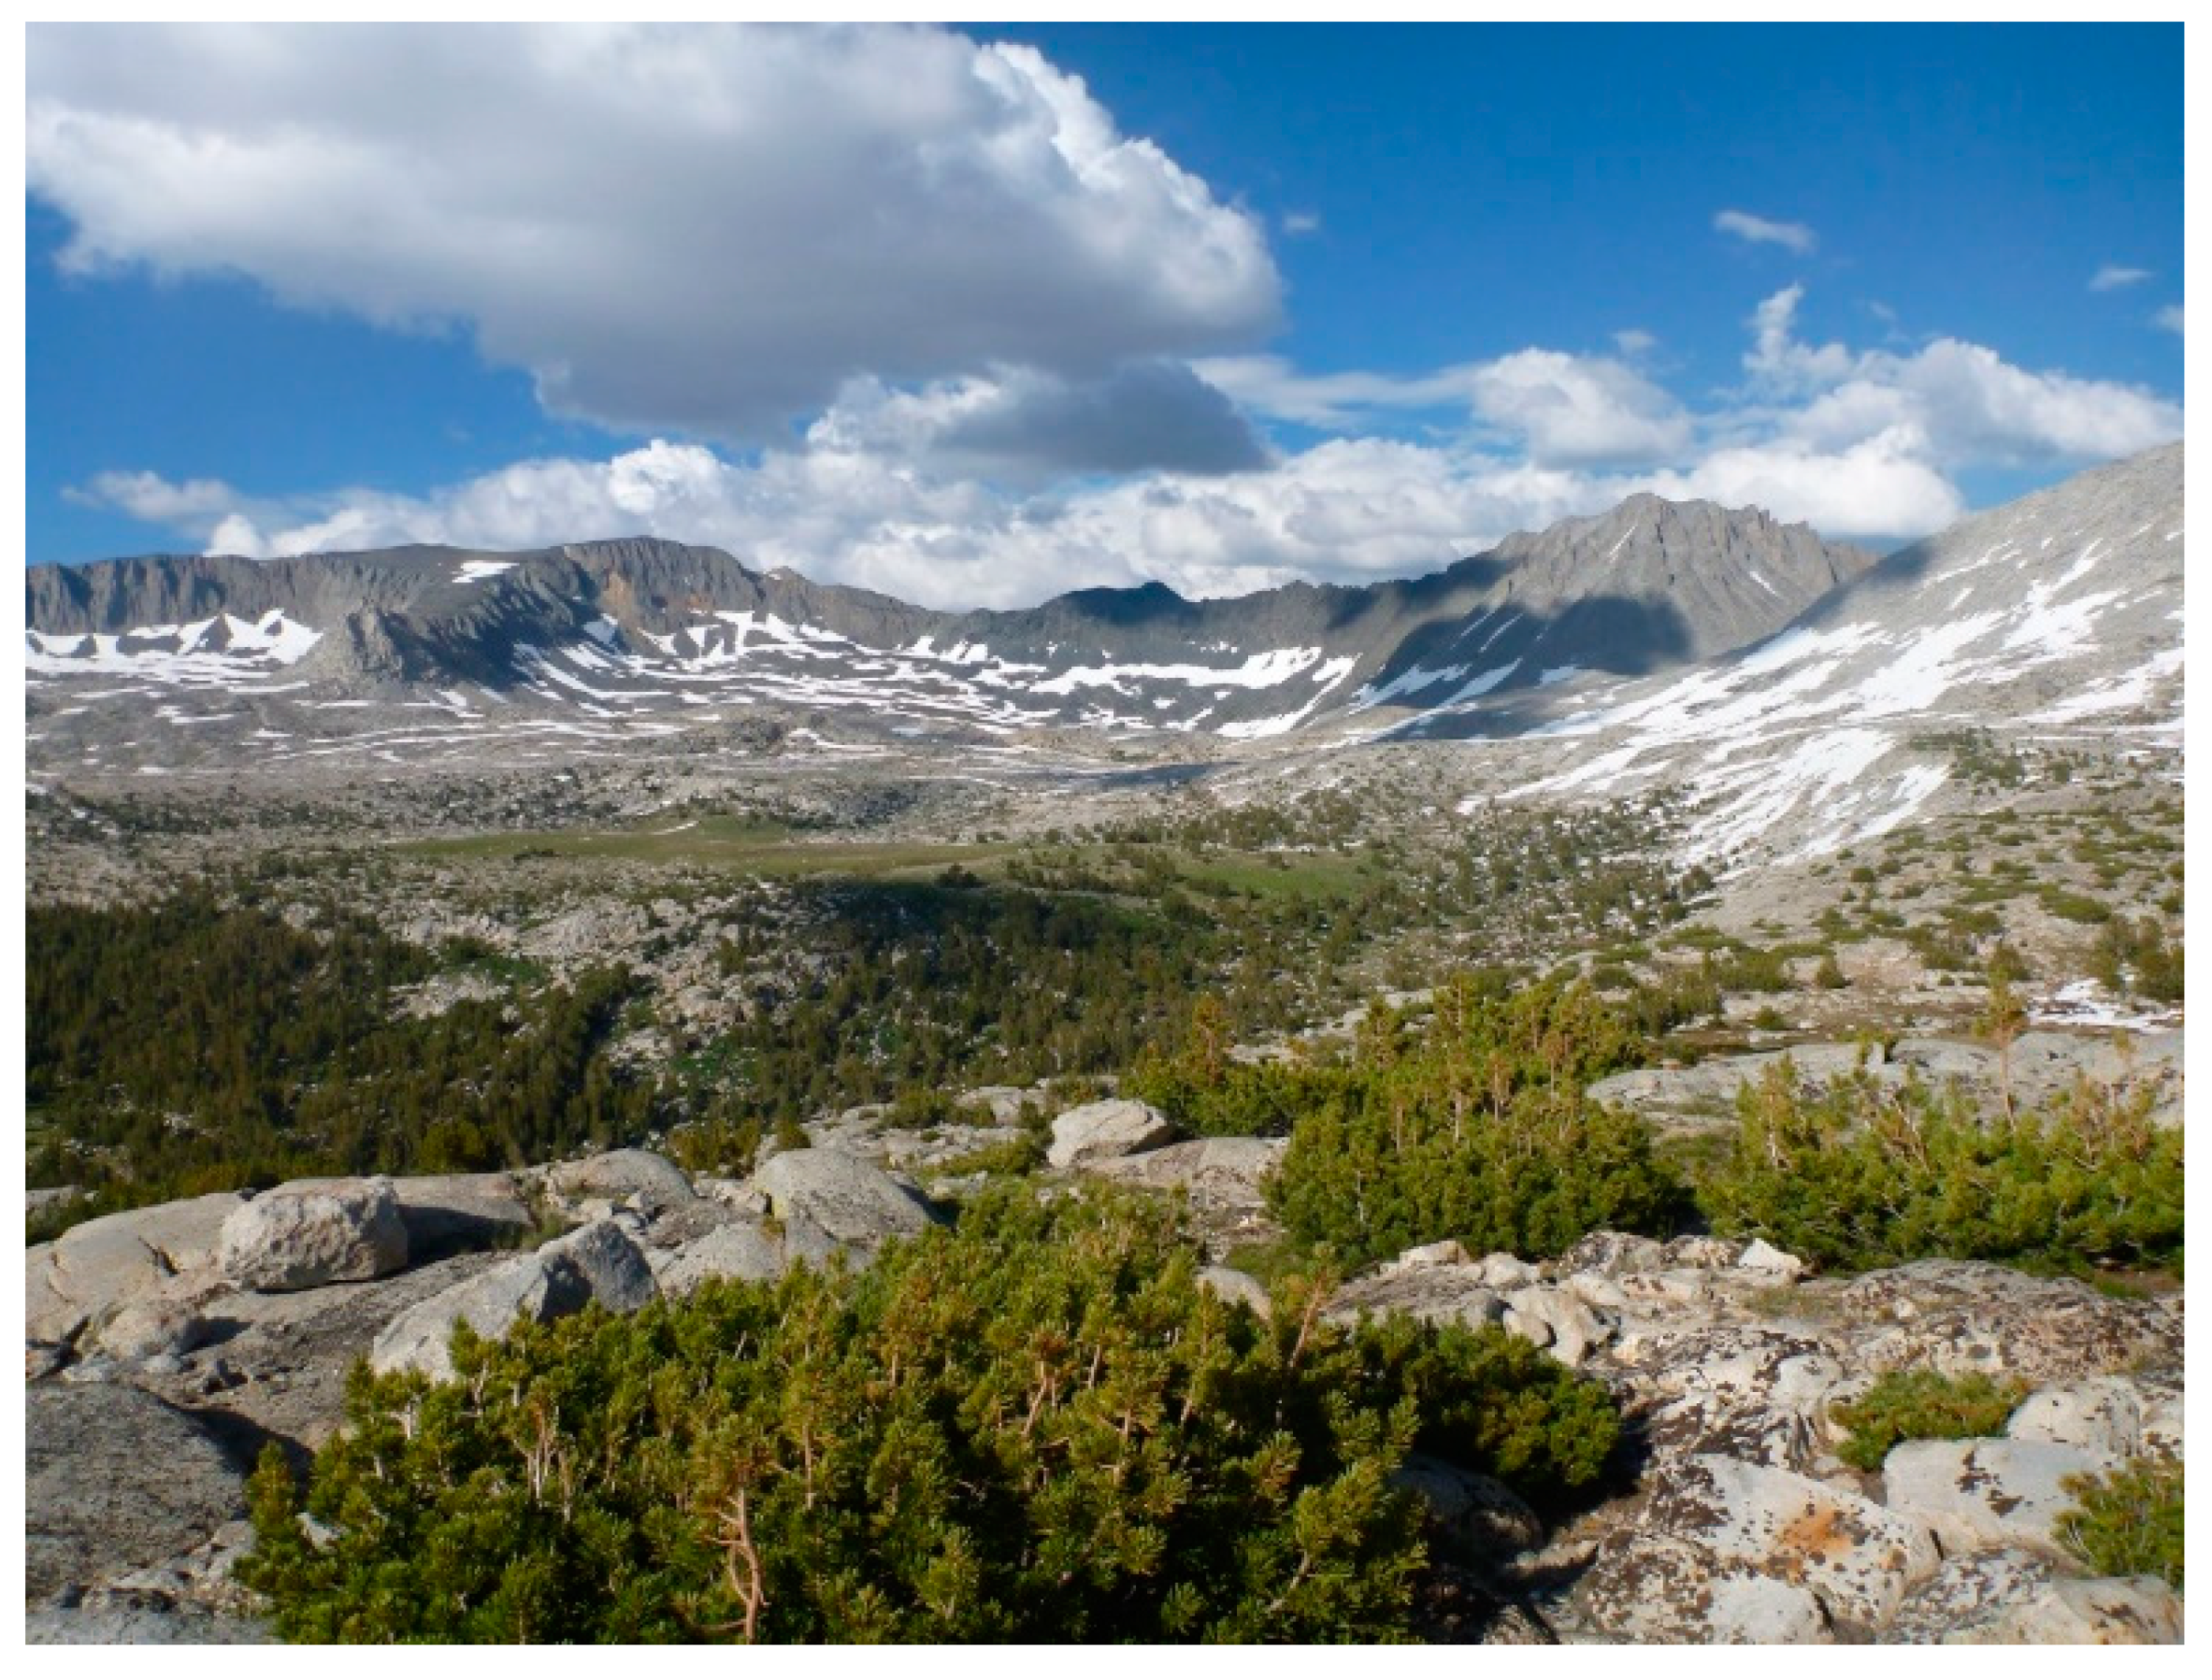
1.1. Whitebark Pine
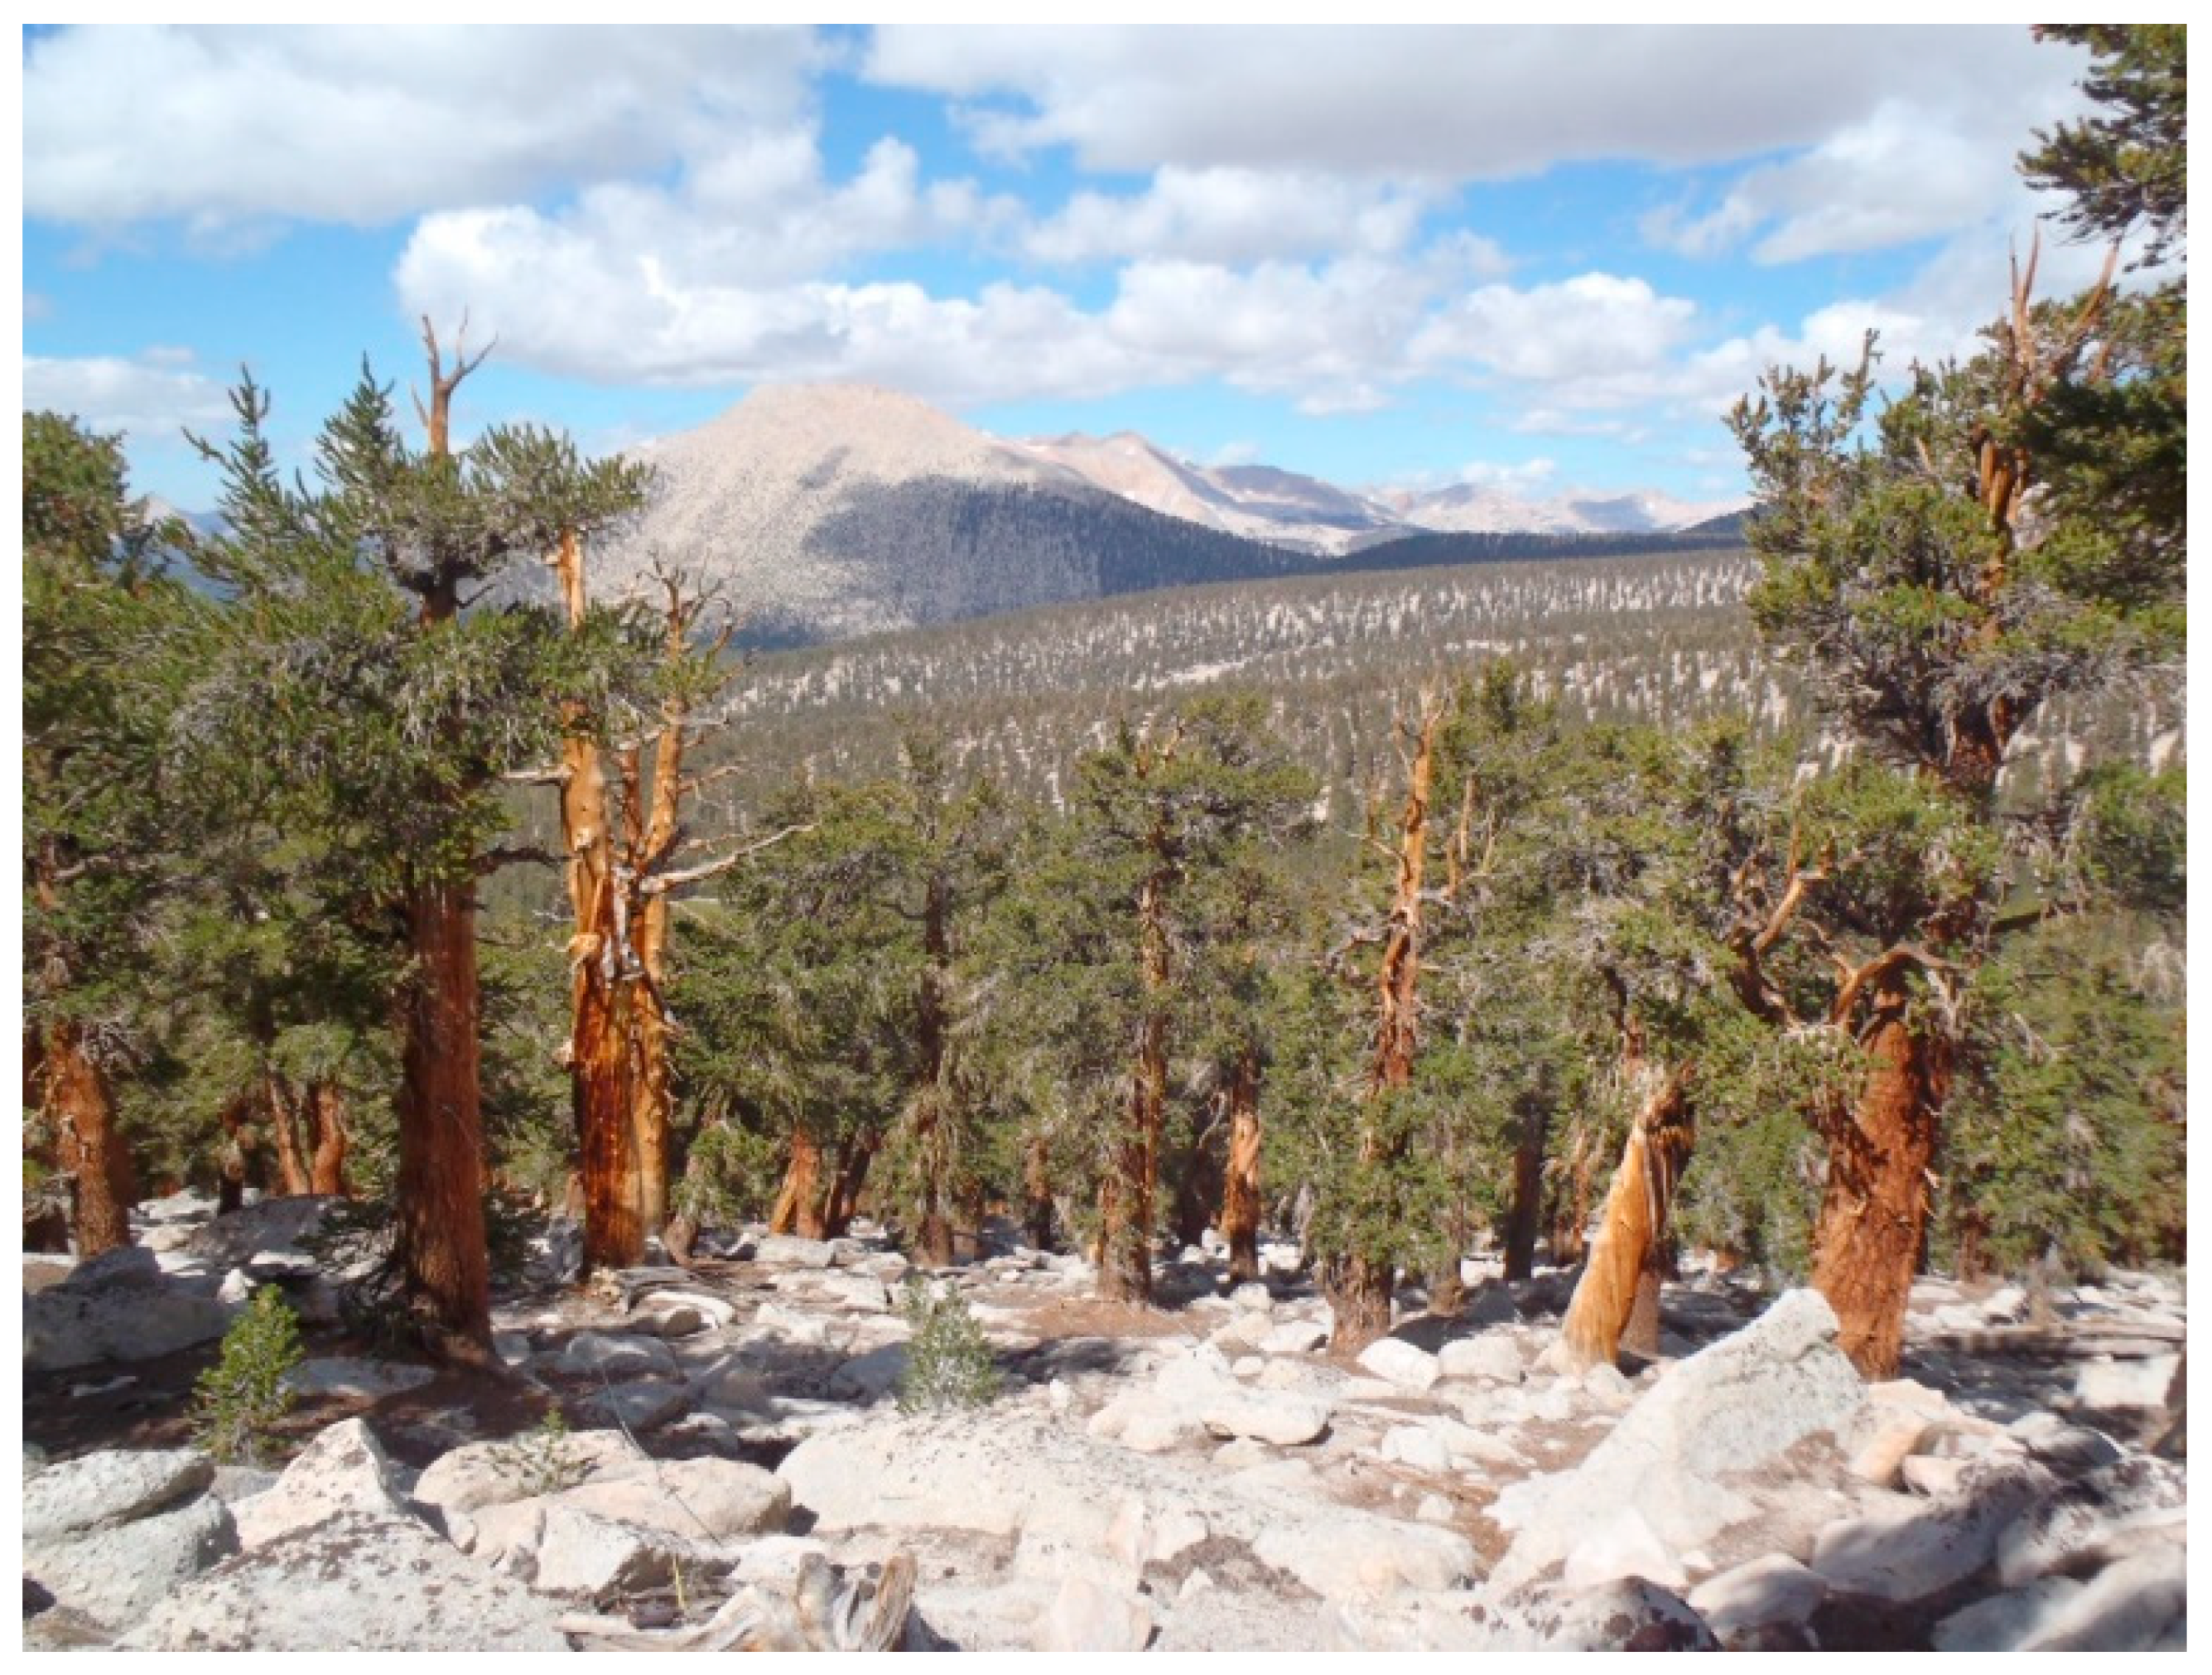
1.2. Foxtail Pine
1.3. Objectives
- Trees species composition and structure
- Tree species birth, death, and growth rates
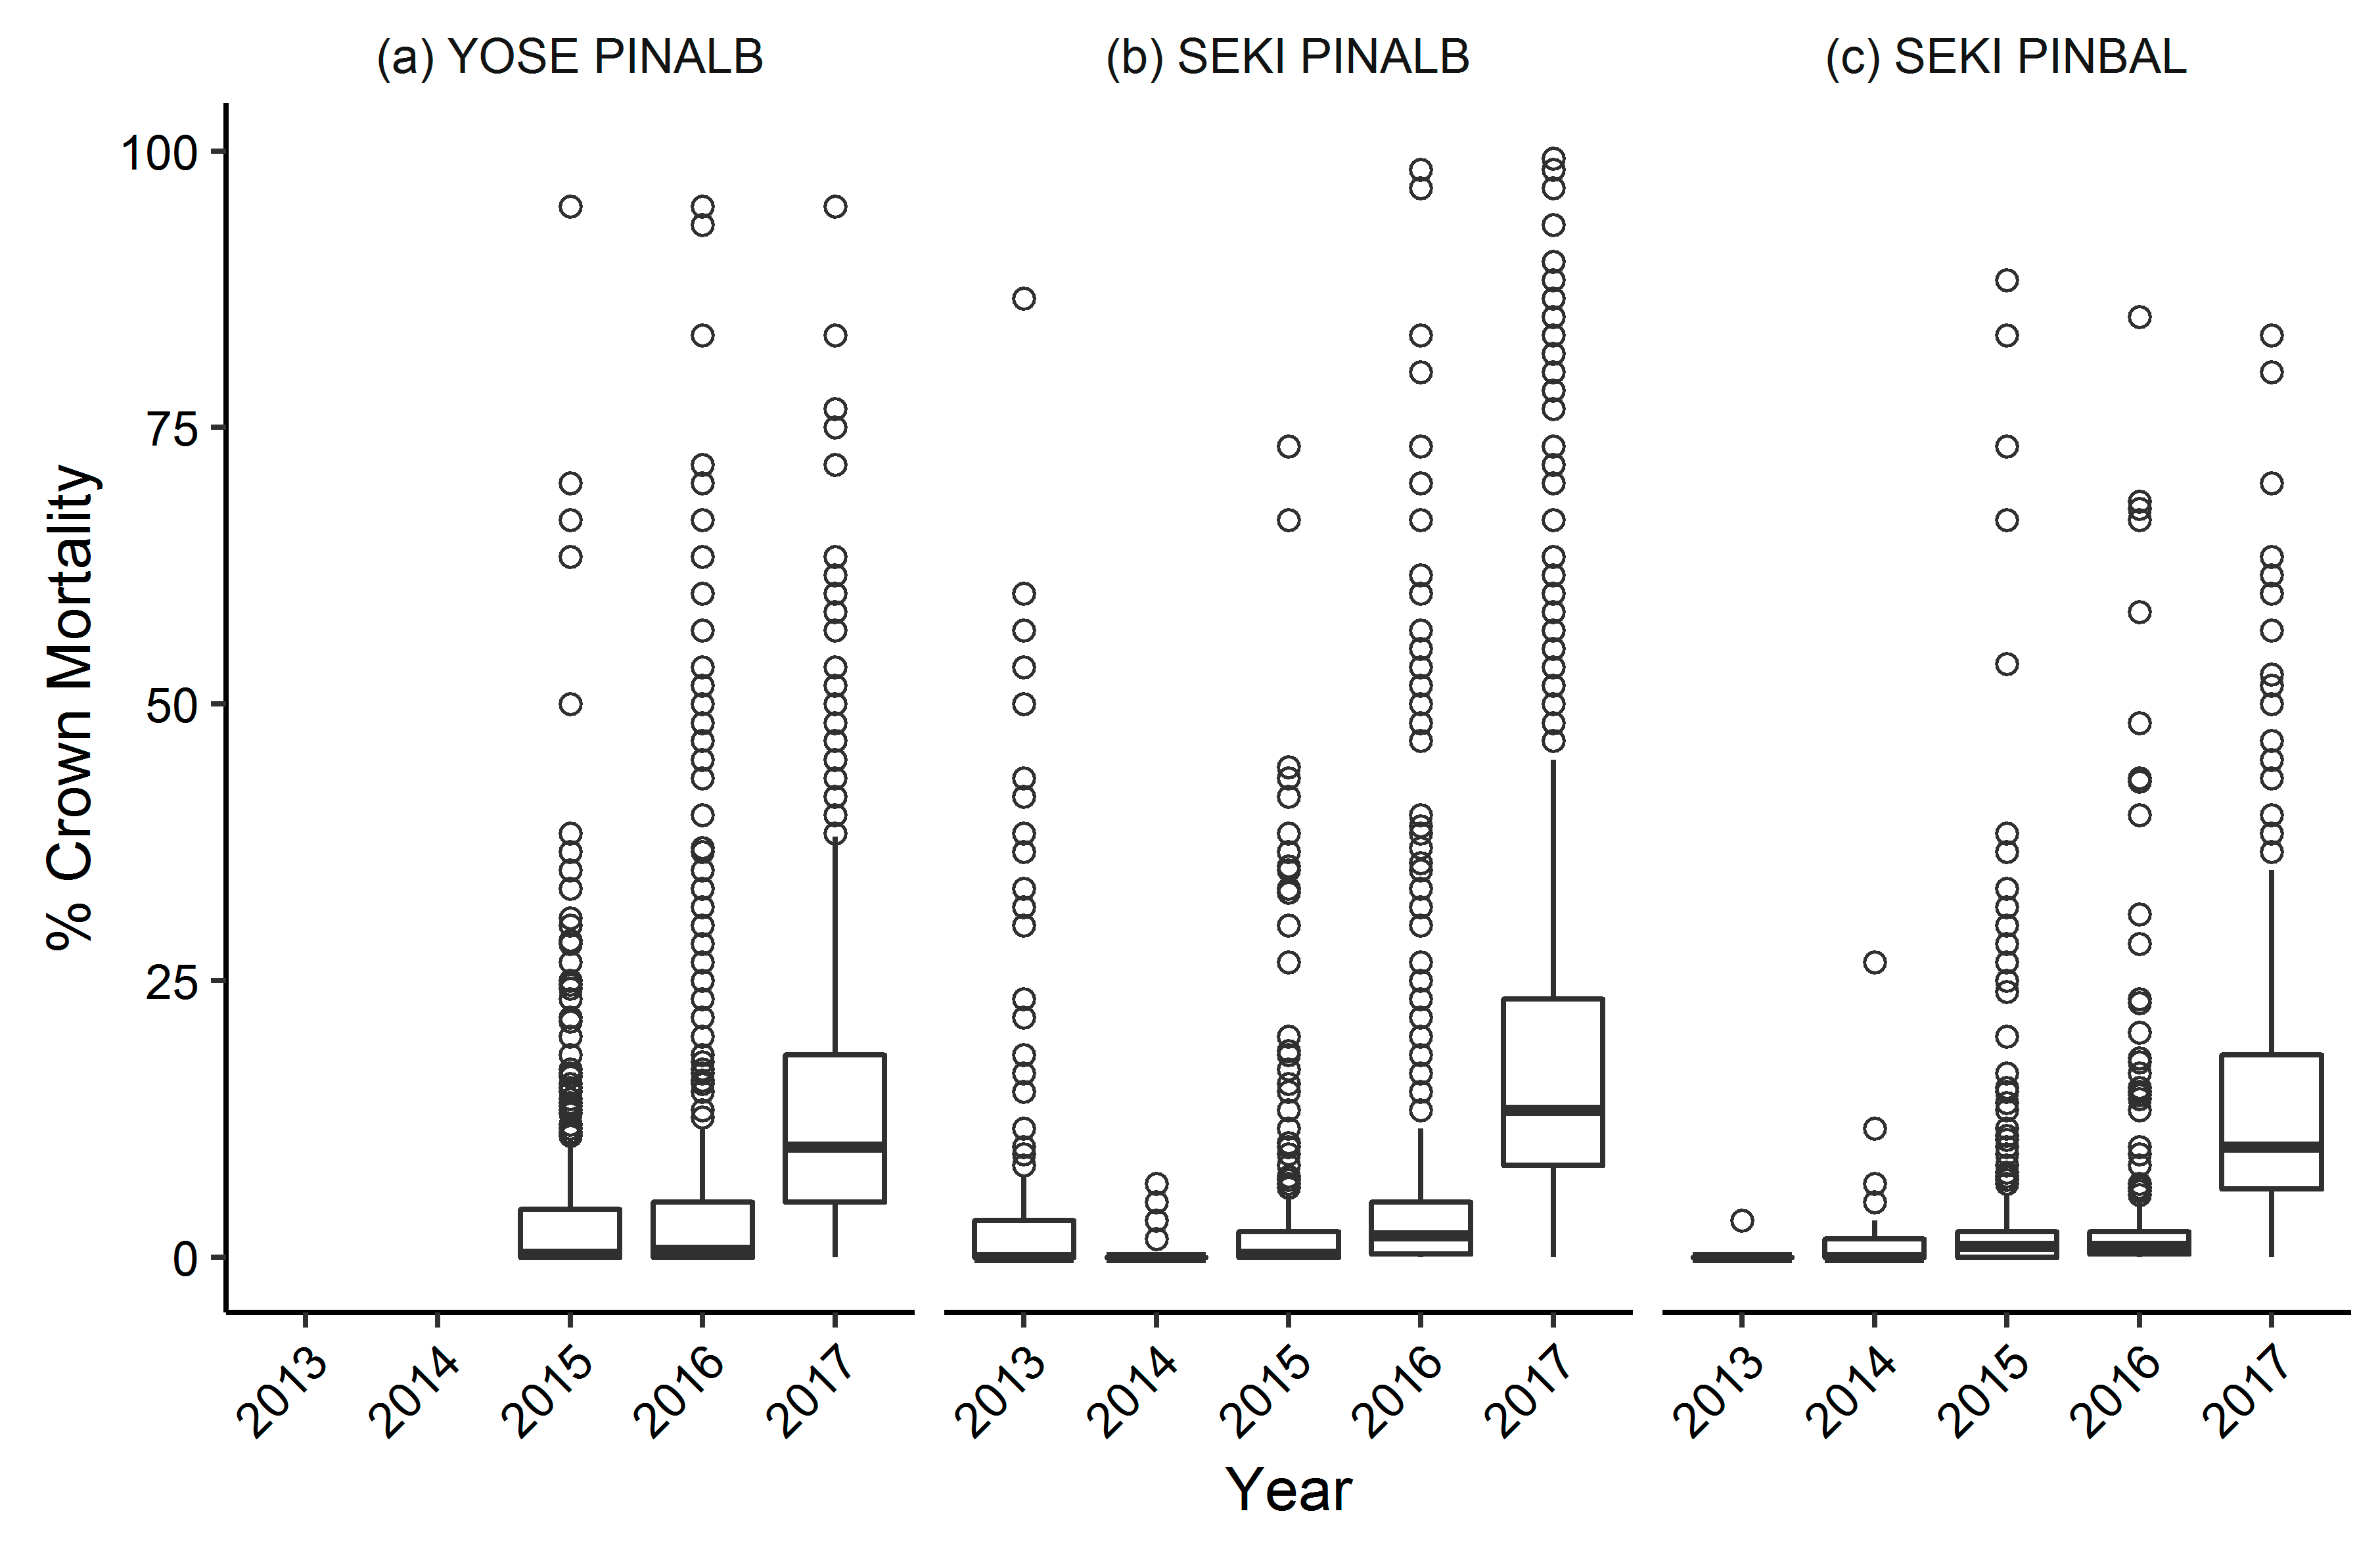
- Incidence of white pine blister rust and level of crown mortality
- Incidence of bark beetles
- Cone production of white pine species
2. Materials and Methods
2.1. Plot Establishment
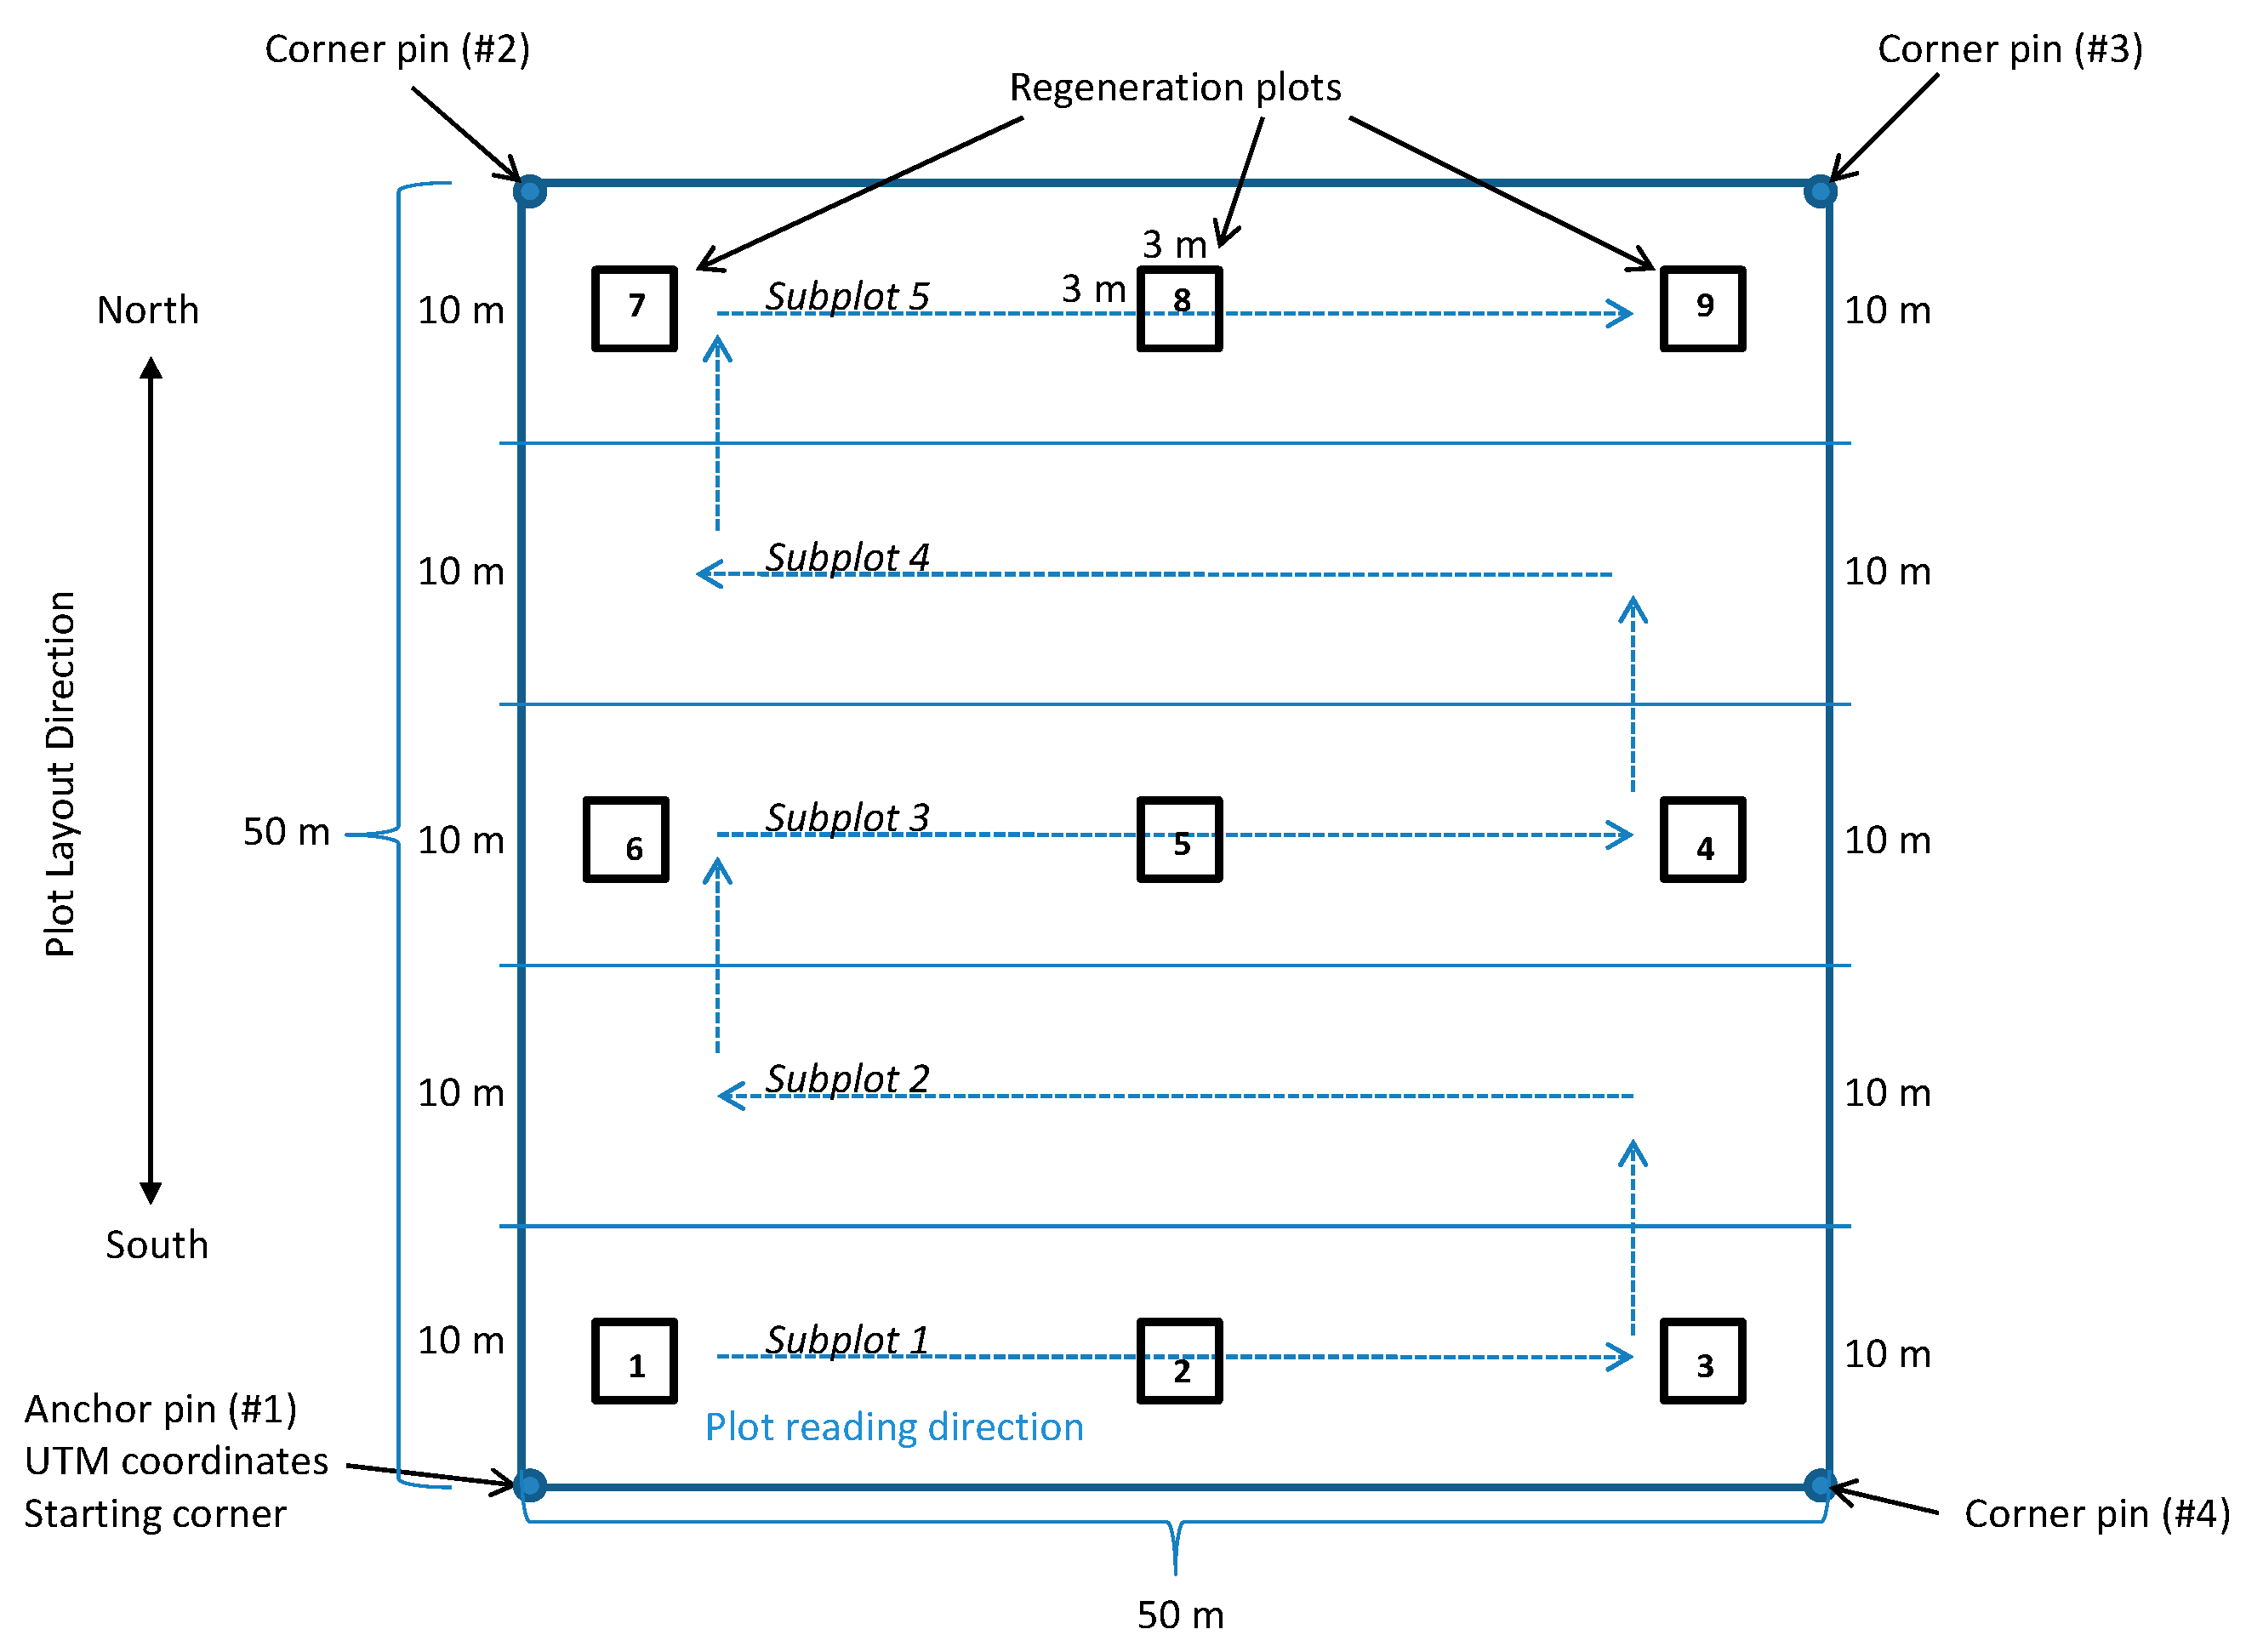
2.2. Plot Layout
2.3. Tree Measurements
2.4. Data Analysis
3. Results
3.1. Yosemite National Park
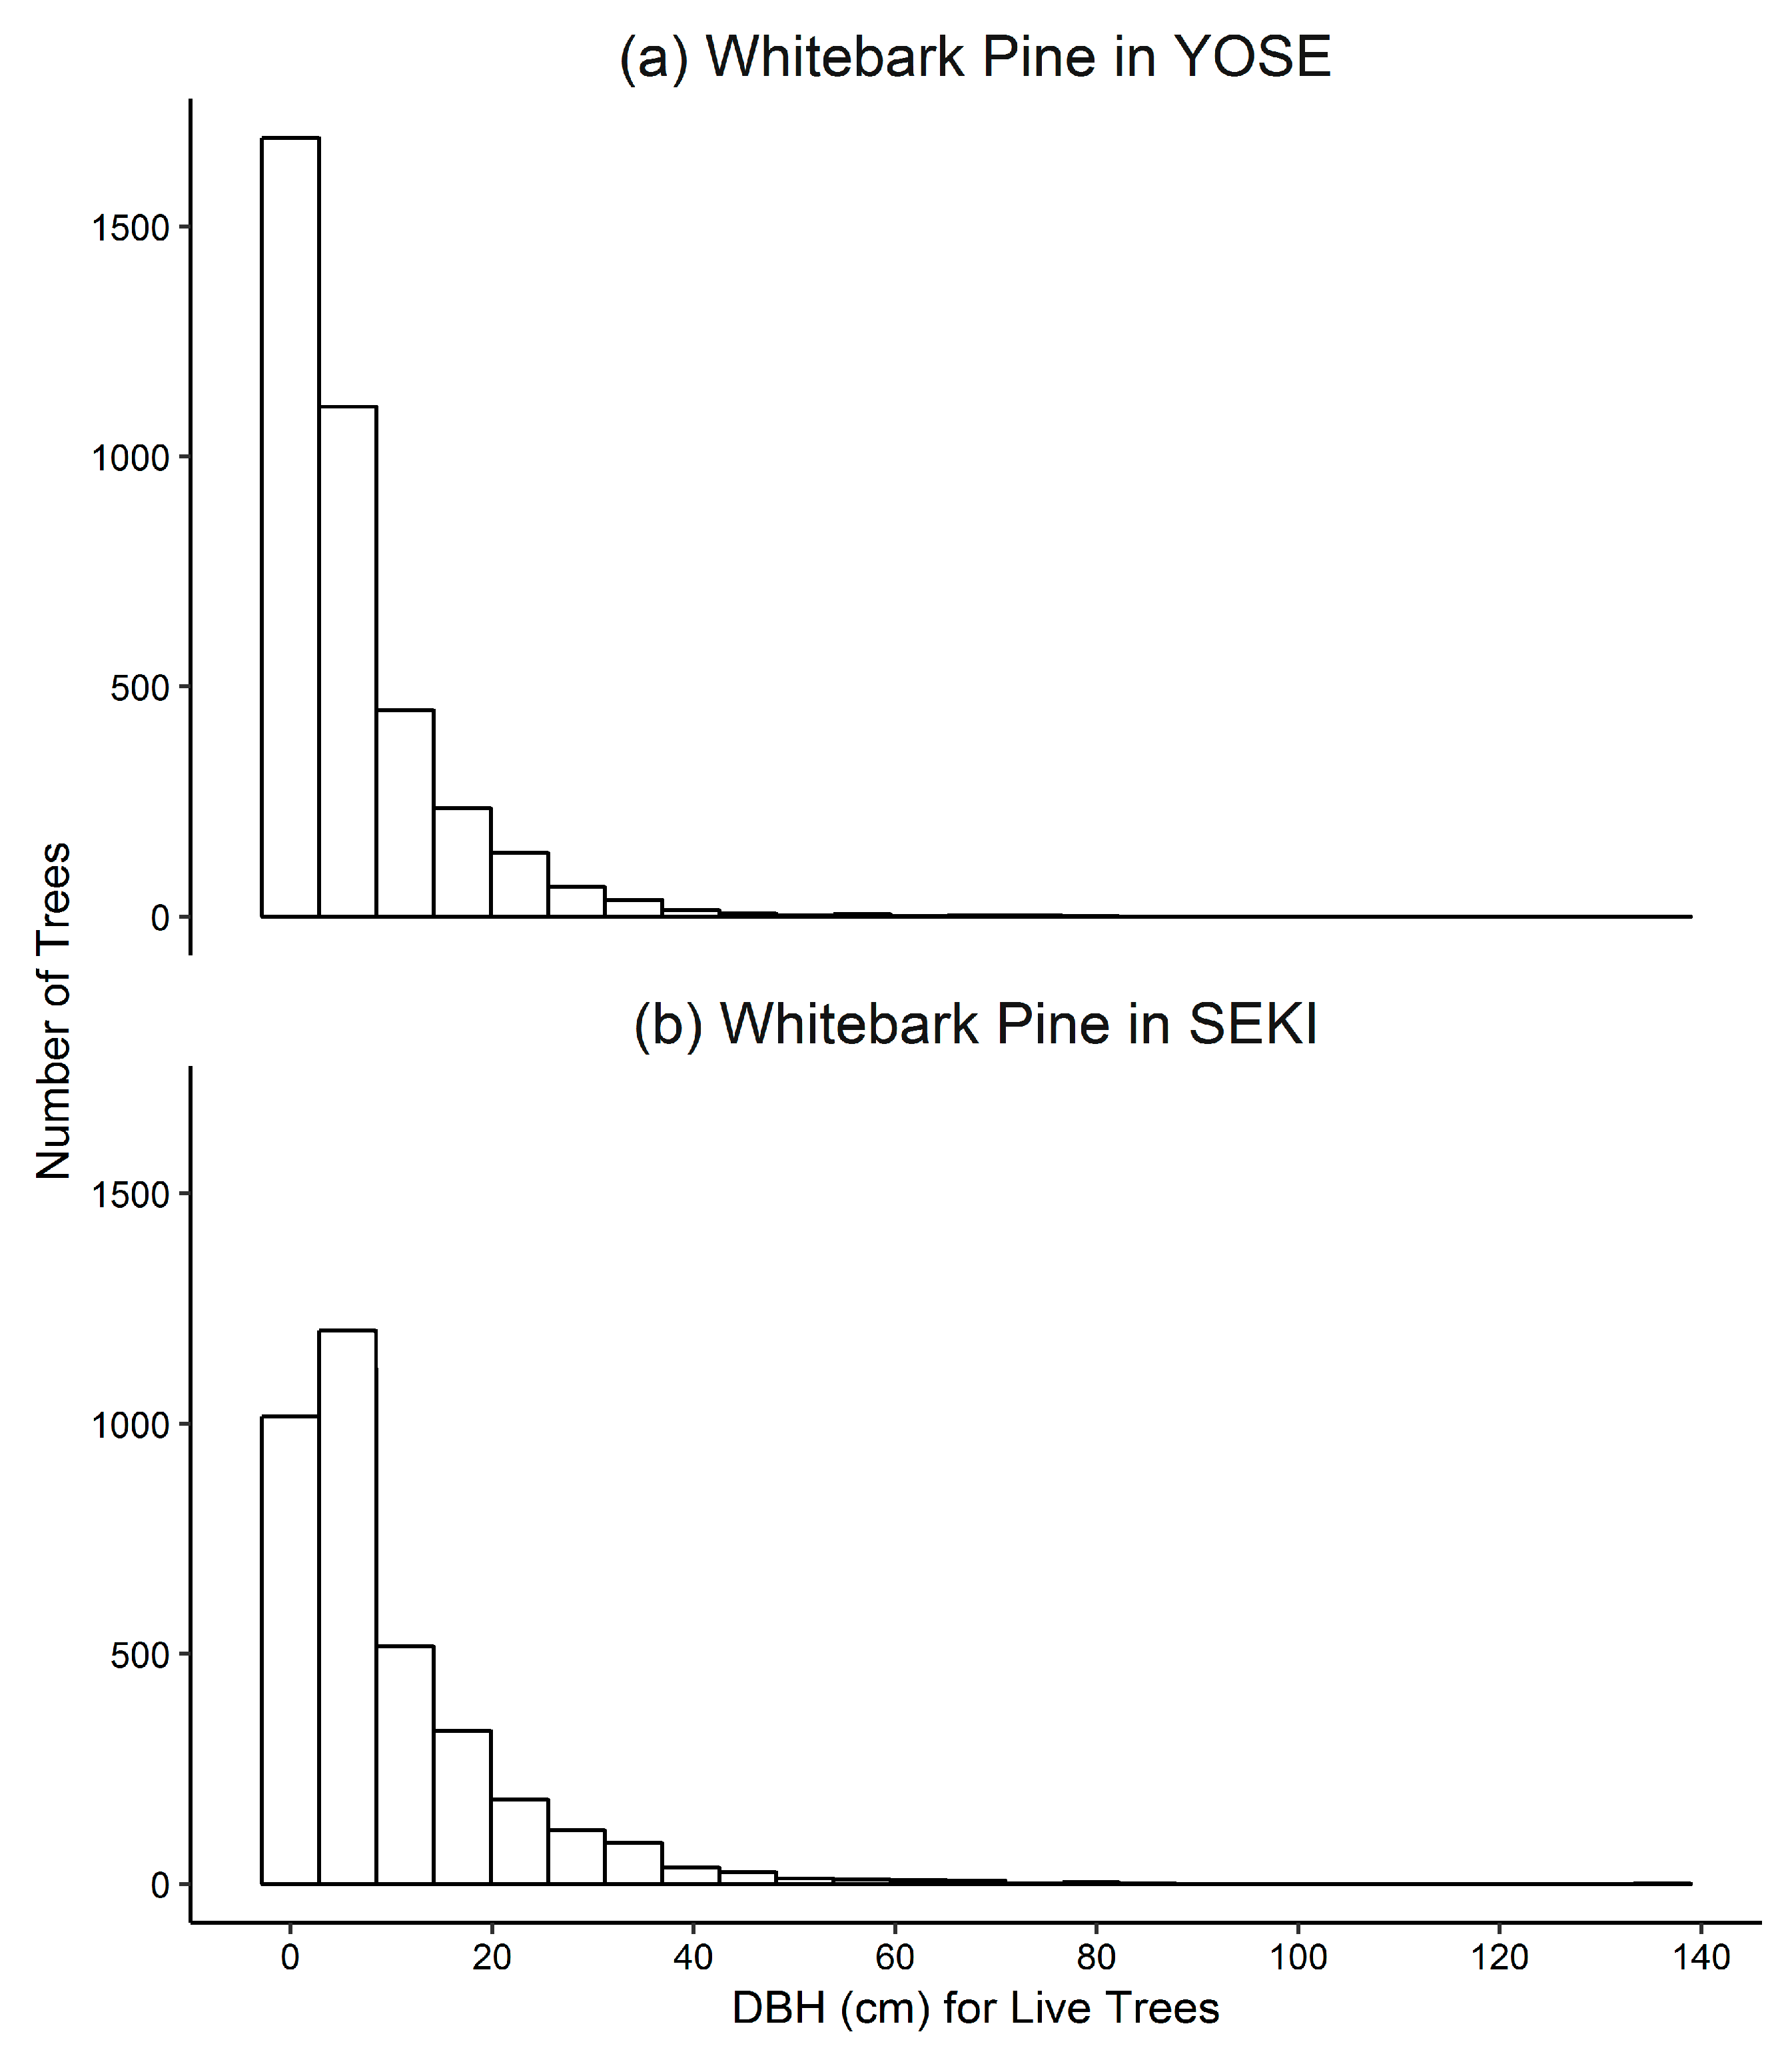
Whitebark Pine
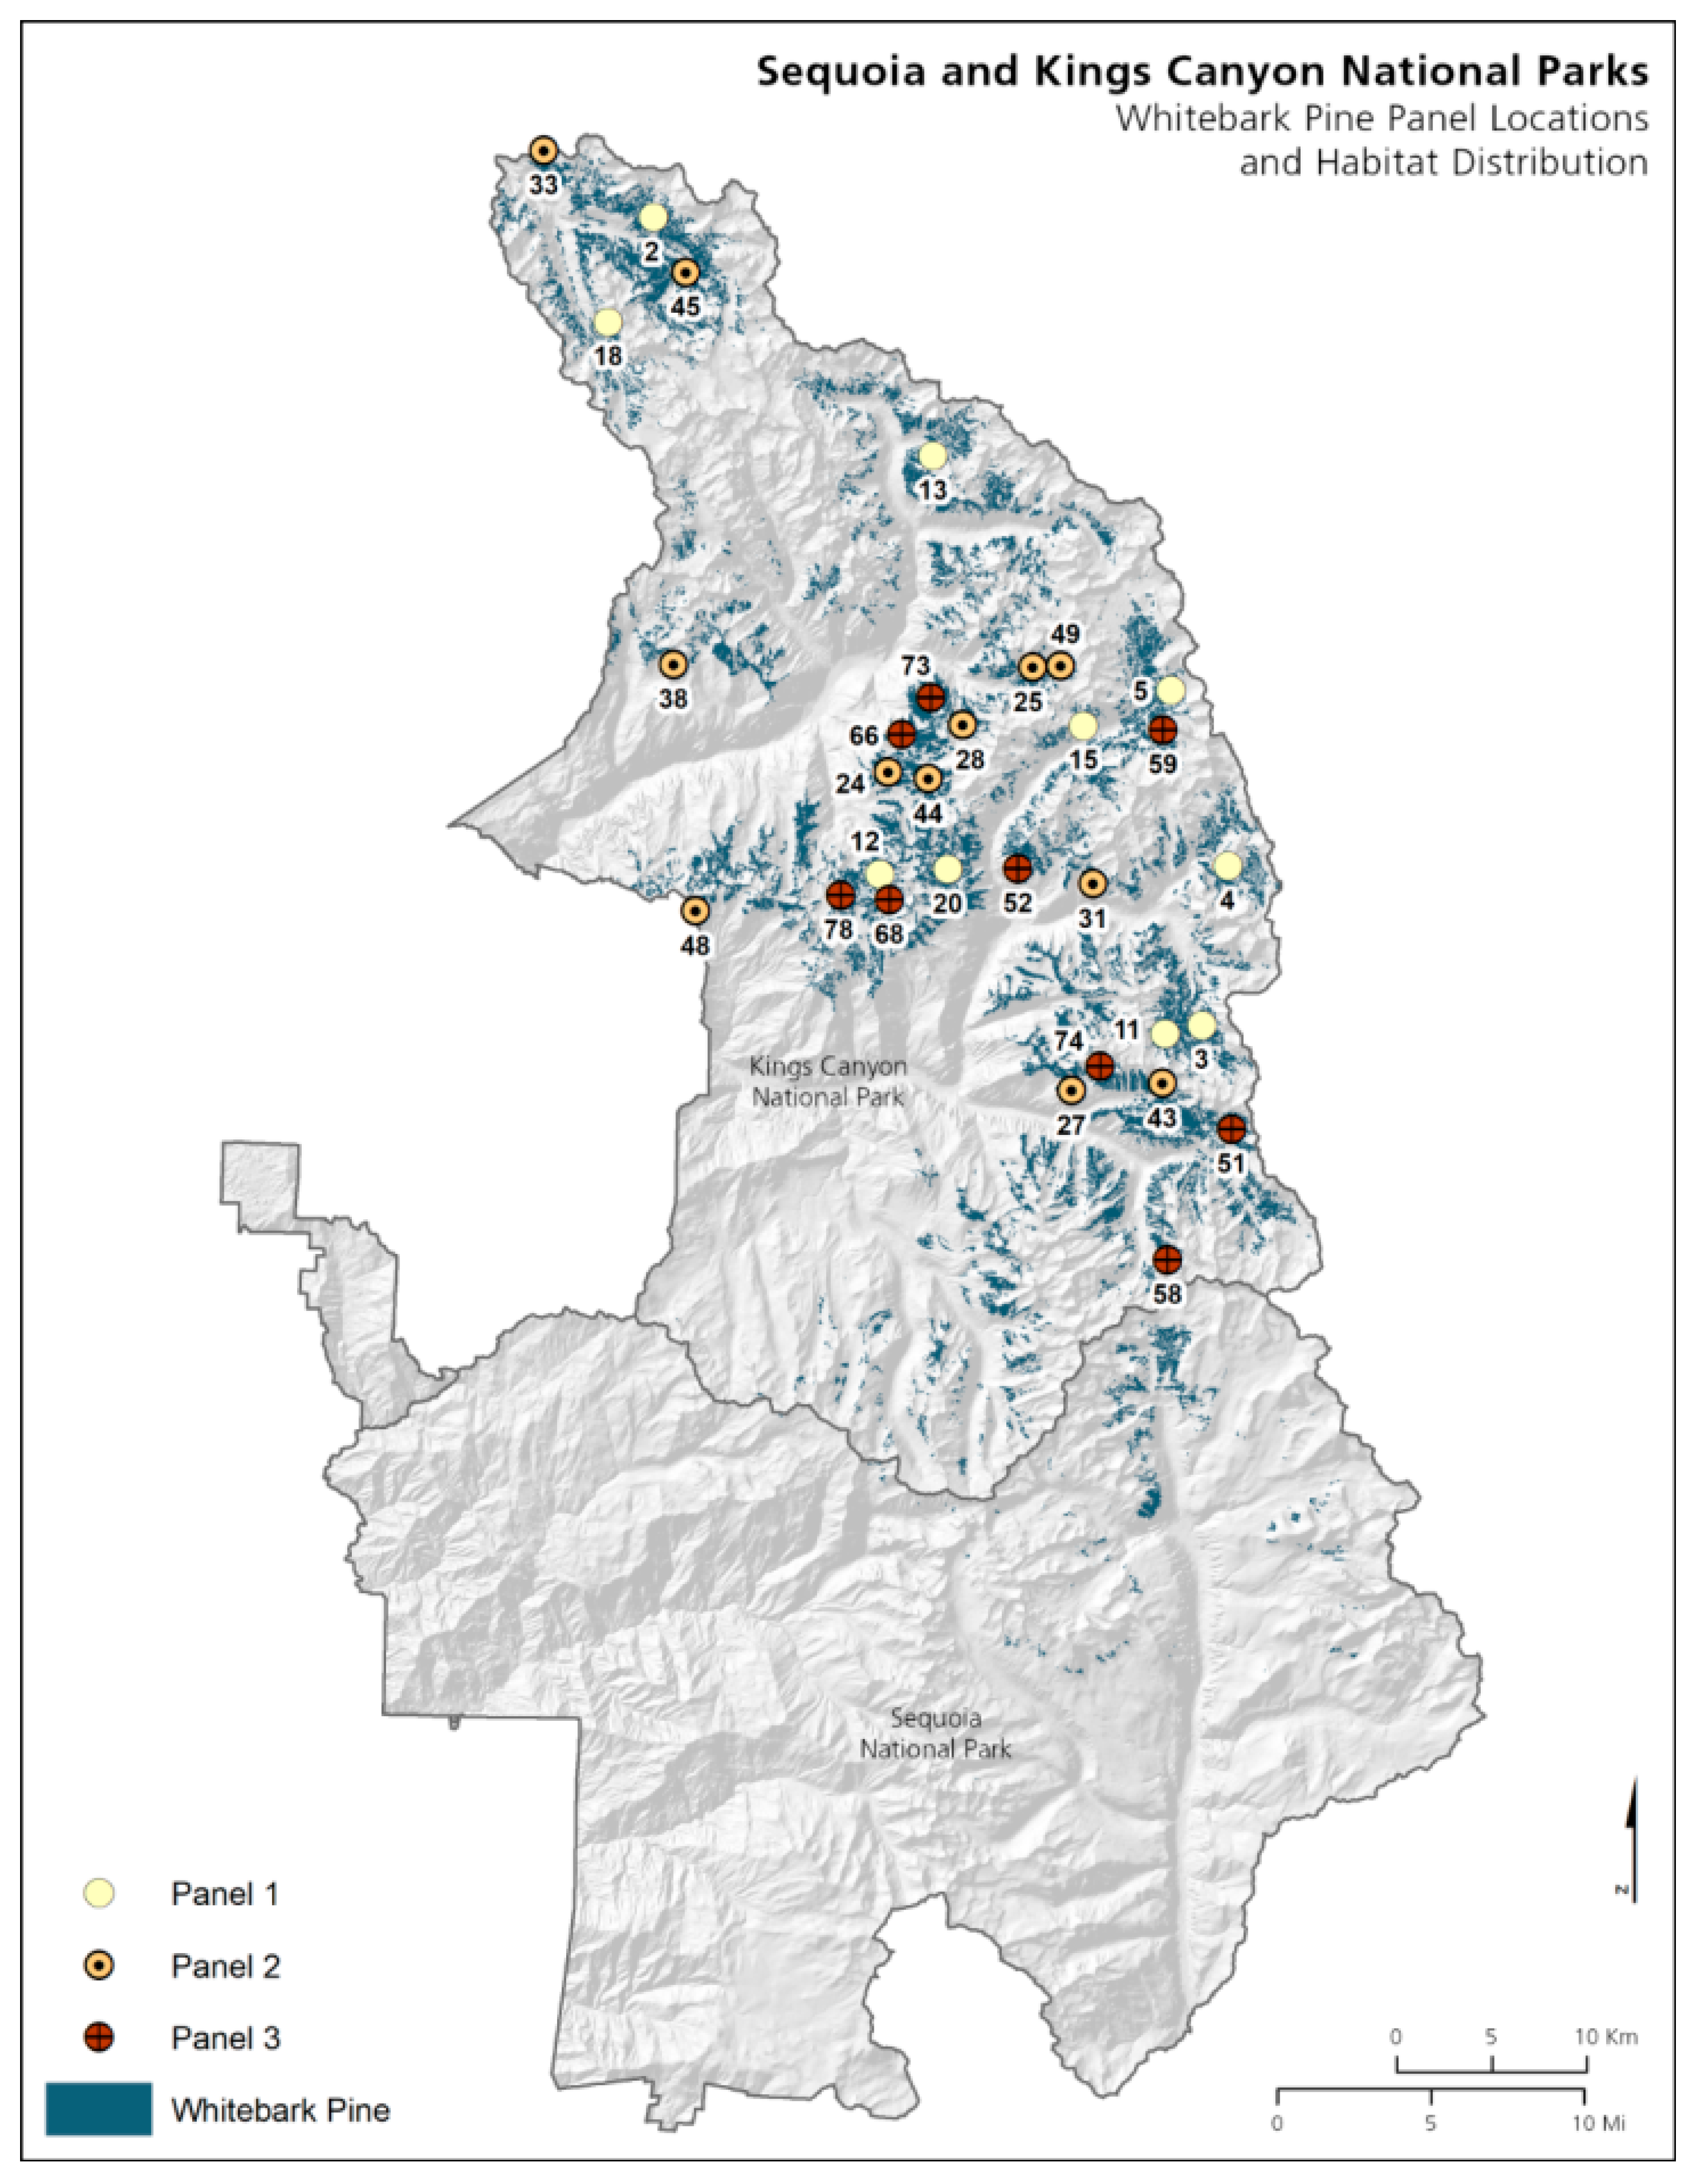
3.2. Sequoia and Kings Canyon National Parks
3.2.1. Whitebark Pine
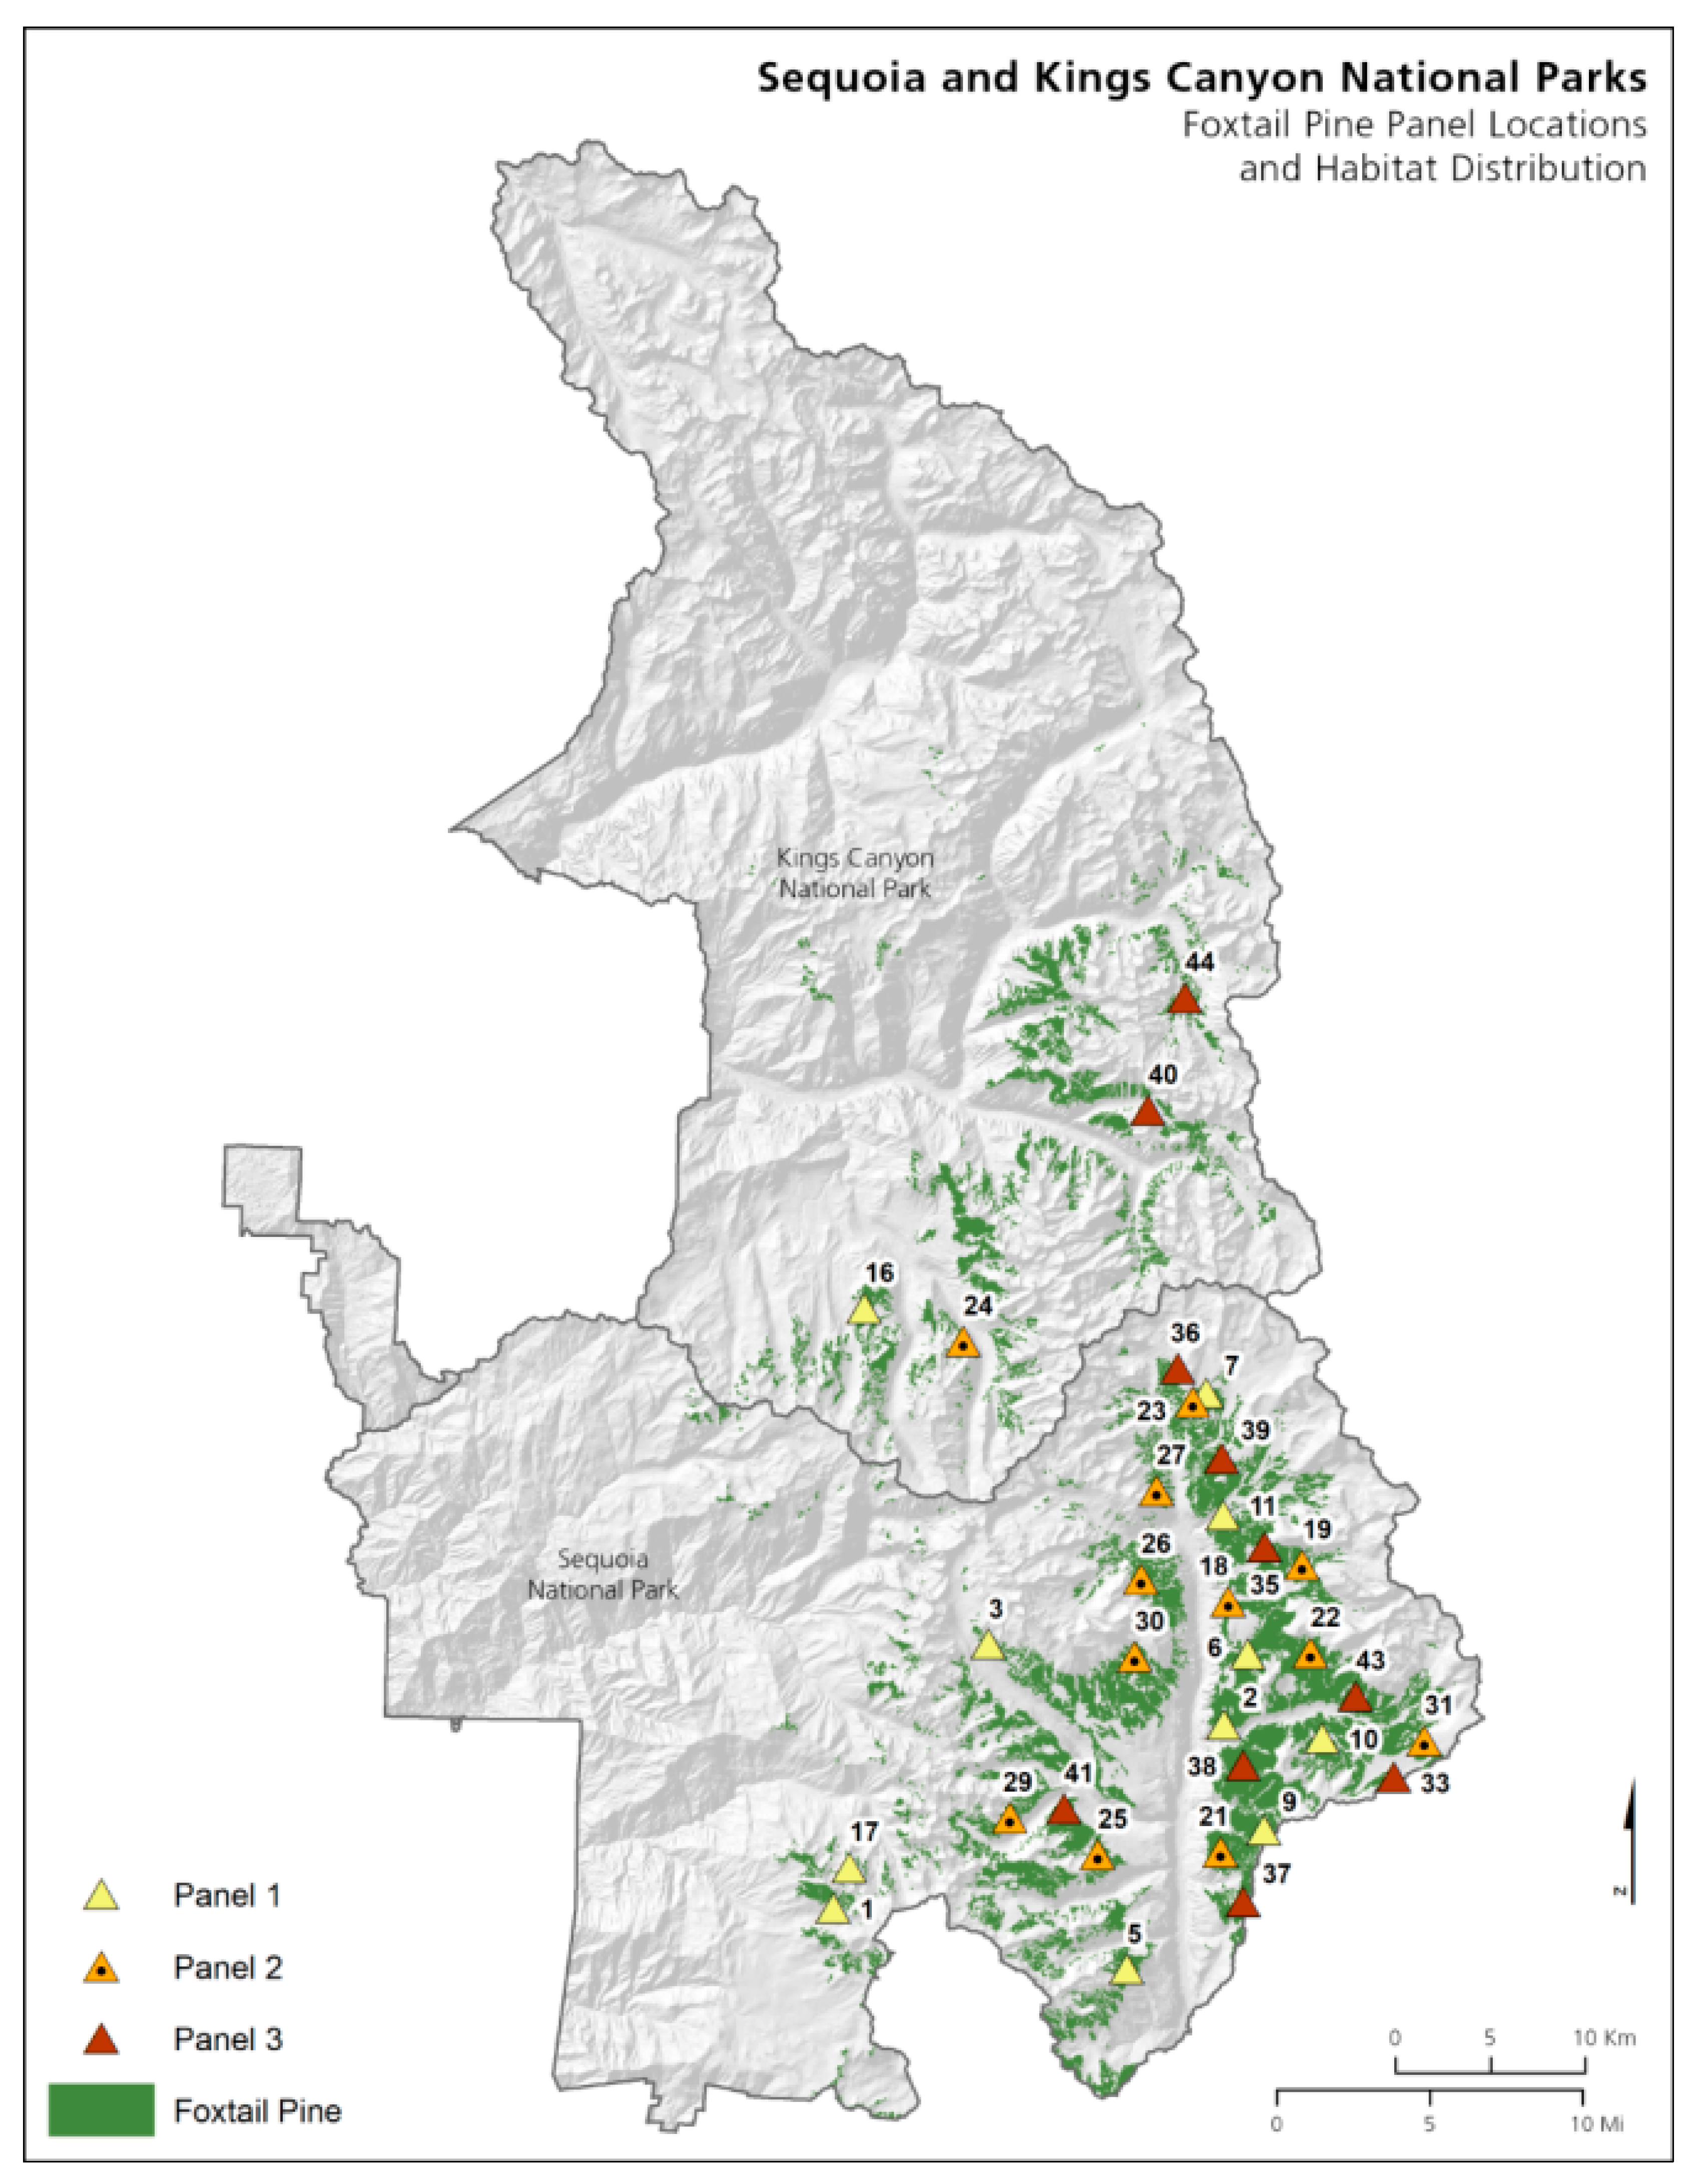
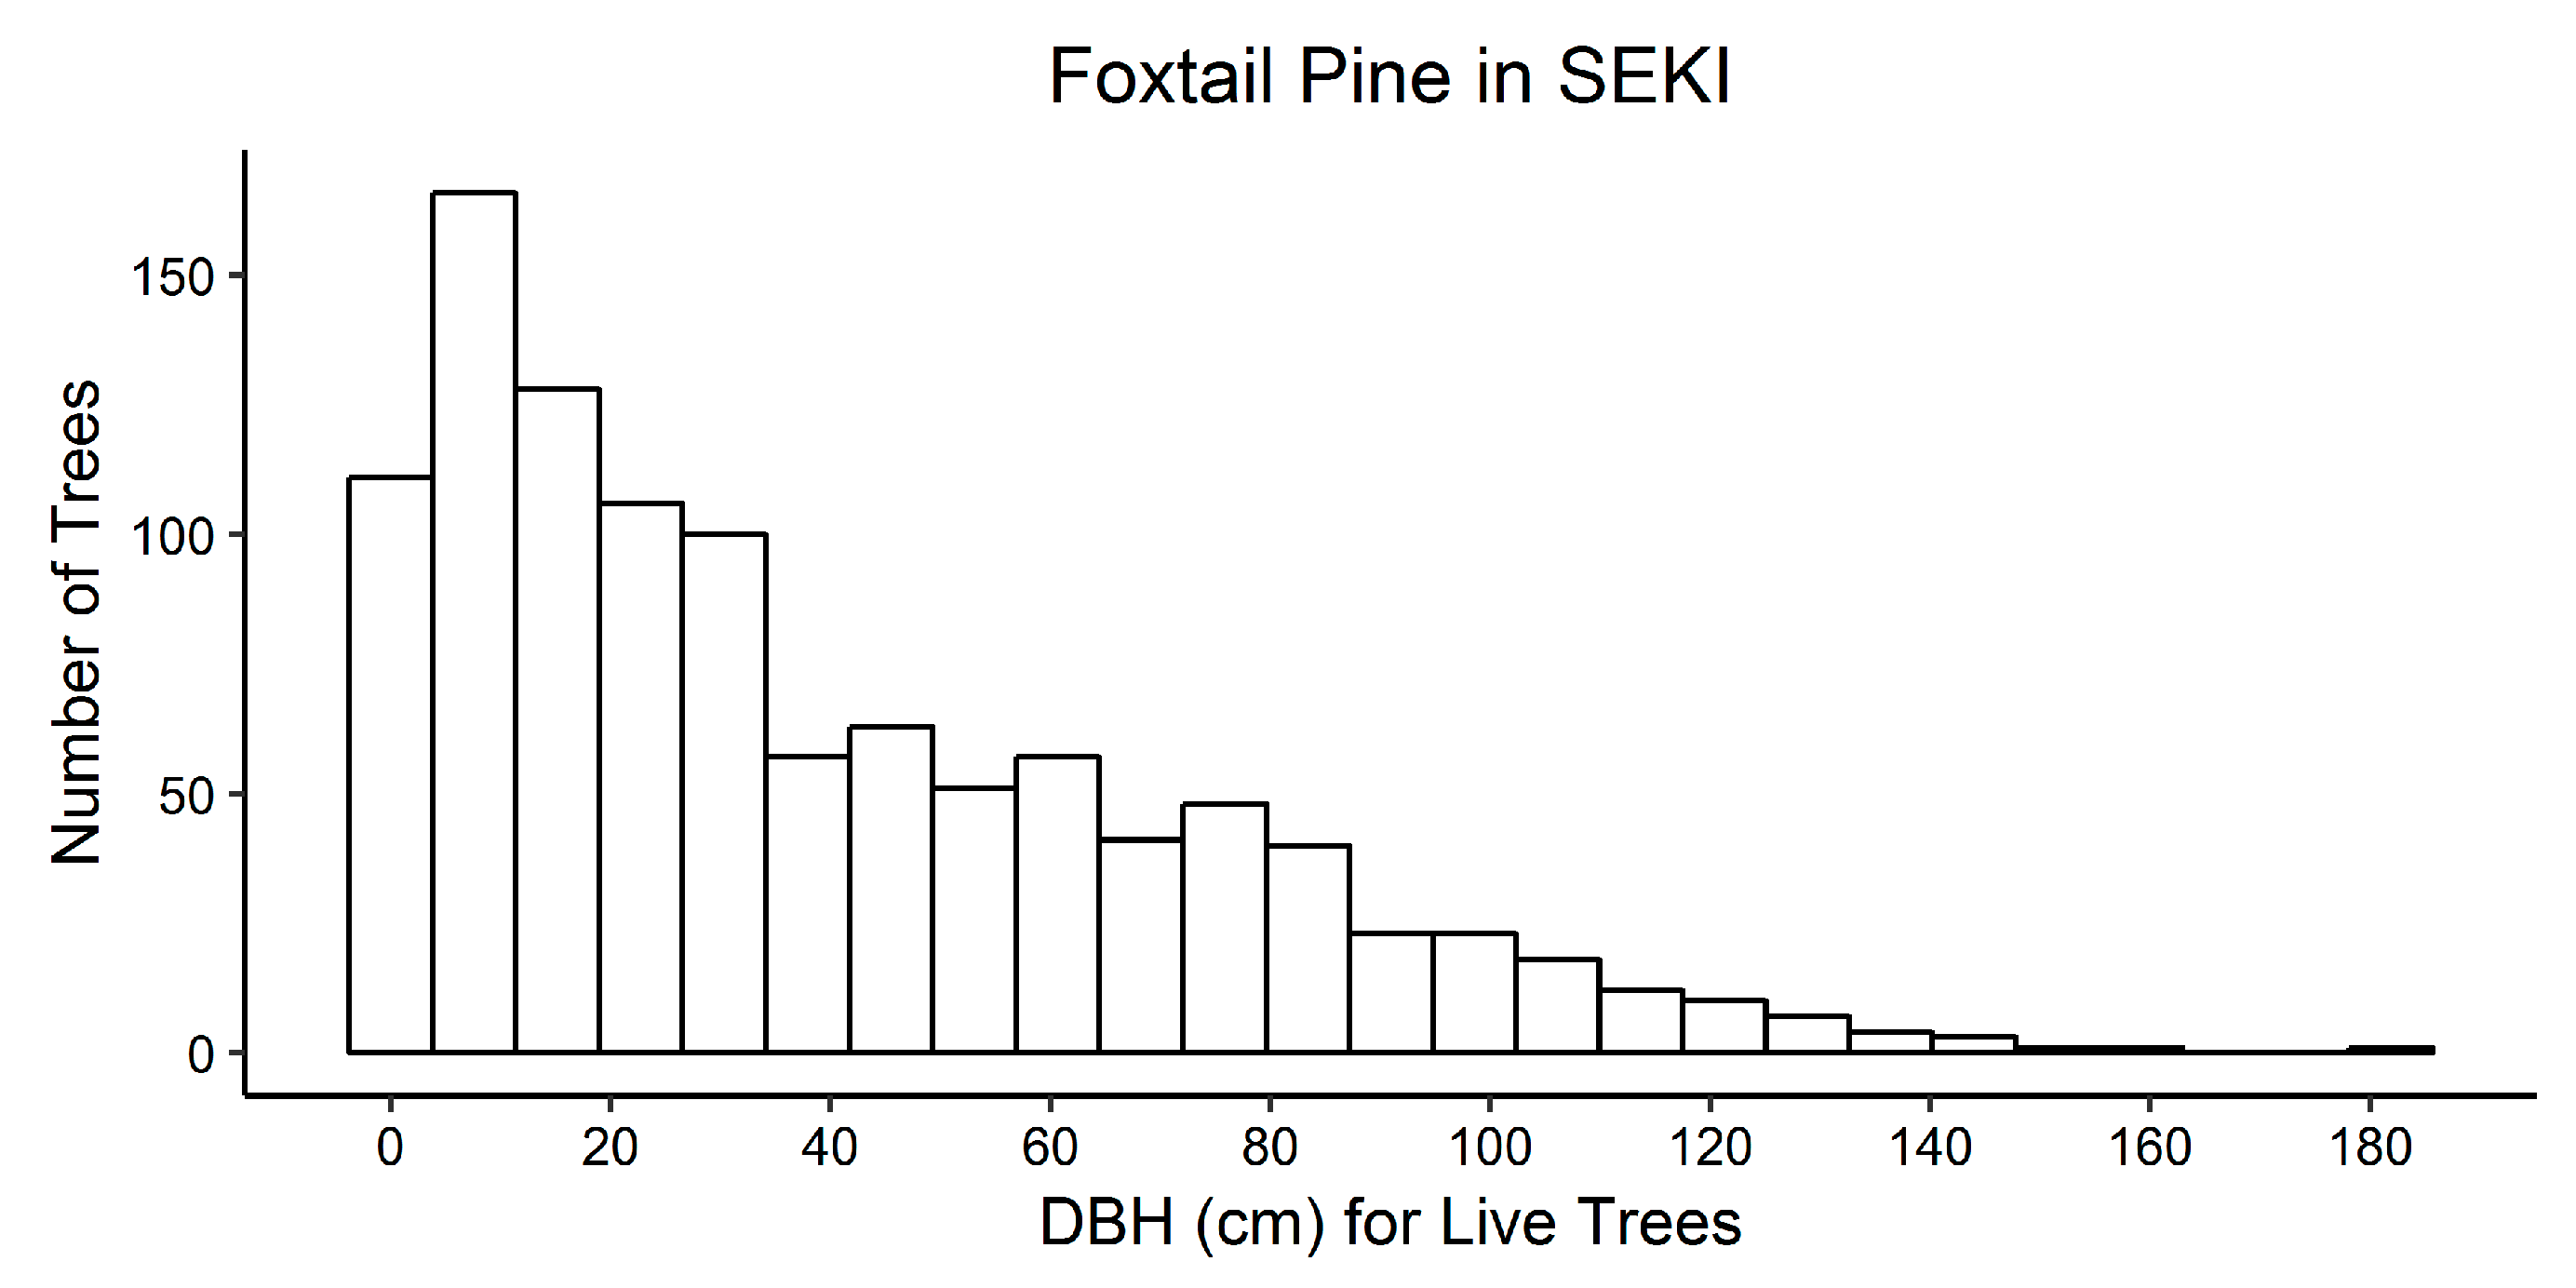
3.2.2. Foxtail Pine
4. Discussion
5. Conclusions
Supplementary Materials
Author Contributions
Funding
Acknowledgments
Conflicts of Interest
References
- Raffa, K.F.; Aukema, B.H.; Bentz, B.J.; Carroll, A.L.; Hicke, J.A.; Turner, M.G.; Romme, W.H. Cross-scale drivers of natural disturbances prone to anthropogenic amplification: The dynamics of bark beetle eruptions. Bioscience 2008, 58, 501–517. [Google Scholar] [CrossRef]
- Weed, A.S.; Ayres, M.P.; Hicke, J.A. Consequences of climate change for biotic disturbances in North American forests. Ecol. Monogr. 2013, 83, 441–470. [Google Scholar] [CrossRef]
- Allen, C.D.; Breshears, D.D.; McDowell, N.G. On underestimation of global vulnerability to tree mortality and forest die-off from hotter drought in the Anthropocene. Ecosphere 2015, 6, 1–55. [Google Scholar] [CrossRef]
- Trumbore, S.; Brando, P.; Hartmann, H. Forest health and global change. Science 2015, 349, 814–818. [Google Scholar] [CrossRef]
- Paine, R.T.; Tegner, M.J.; Johnson, E.A. Compounded perturbations yield ecological surprises. Ecosystems 1998, 1, 535–545. [Google Scholar] [CrossRef]
- Ratajczak, Z.; Carpenter, S.R.; Ives, A.R.; Kucharik, C.J.; Ramiadantsoa, T.; Stegner, M.A.; Williams, J.W.; Zhang, J.; Turner, M.G. Abrupt Change in Ecological Systems: Inference and Diagnosis. Trends Ecol. Evol. 2018, 33, 513–526. [Google Scholar] [CrossRef] [PubMed]
- Pecl, G.T.; Araújo, M.B.; Bell, J.D.; Blanchard, J.; Bonebrake, T.C.; Chen, I.-C.; Clark, T.D.; Colwell, R.K.; Danielsen, F.; Evengård, B. Biodiversity redistribution under climate change: Impacts on ecosystems and human well-being. Science 2017, 355, 1–9. [Google Scholar] [CrossRef] [PubMed]
- van Mantgem, P.J.; Stephenson, N.L.; Byrne, J.C.; Daniels, L.D.; Franklin, J.F.; Fulé, P.Z.; Harmon, M.E.; Larson, A.J.; Smith, J.M.; Taylor, A.H.; et al. Widespread increase of tree mortality rates in the Western United States. Science 2009, 323, 521–524. [Google Scholar] [CrossRef] [PubMed]
- Seidl, R.; Thom, D.; Kautz, M.; Martin-Benito, D.; Peltoniemi, M.; Vacchiano, G.; Wild, J.; Ascoli, D.; Petr, M.; Honkaniemi, J.; et al. Forest disturbances under climate change. Nat. Clim. Chang. 2017, 7, 395–402. [Google Scholar] [CrossRef] [PubMed]
- Tomback, D.F.; Achuff, P. Blister rust and western forest biodiversity: Ecology, values and outlook for white pines. For. Pathol. 2010, 40, 186–225. [Google Scholar] [CrossRef]
- Ellison, A.M.; Bank, M.S.; Clinton, B.D.; Colburn, E.A.; Elliott, K.; Ford, C.R.; Foster, D.R.; Kloeppel, B.D.; Knoepp, J.D.; Lovett, G.M.; et al. Loss of foundation species: Consequences for the structure and dynamics of forested ecosystems. Front. Ecol. Environ. 2005, 3, 479–486. [Google Scholar] [CrossRef]
- Ebenman, B.; Jonsson, T. Using community viability analysis to identify fragile systems and keystone species. Trends Ecol. Evol. 2005, 20, 568–575. [Google Scholar] [CrossRef] [PubMed]
- Keane, R.E.; Holsinger, L.M.; Mahalovich, M.F.; Tomback, D.F. Restoring Whitebark Pine Ecosystems in the Face of Climate CHANGE; Gen. Tech. Rep. RMRS-GTR-361; U.S. Department of Agriculture, Forest Service, Rocky Mountain Research Station: Fort Collins, CO, USA, 2017; pp. 1–123.
- Environmental and Climate Change Canada. Recovery Strategy for the Whitebark Pine (Pinus albicaulis) in Canada [Proposed]; Environmental and Climate Change Canada: Ottawa, ON, USA, 2017.
- U.S. Fish and Wildlife Service. Endangered and threatened wildlife and plants; 12-month finding on a petition to list Pinus albicaulis as endangered or threatened with critical habitat. Fed. Regist. 2011, 76, 42631–42654. [Google Scholar]
- Millar, C.I.; Westfall, R.D.; Delany, D.L.; Bokach, M.J.; Flint, A.L.; Flint, L.E. Forest mortality in high-elevation whitebark pine (Pinus albicaulis) forests of Eastern California, USA; Influence of Environmental Context, Bark Beetles, Climatic Water Deficit, and Warming. Can. J. For. Res. 2012, 42, 749–765. [Google Scholar] [CrossRef]
- Doak, D.F.; Morris, W.F. Demographic compensation and tipping points in climate-induced range shifts. Nature 2010, 467, 959. [Google Scholar] [CrossRef] [PubMed]
- Kremer, A.; Ronce, O.; Robledo-Arnuncio, J.J.; Guillaume, F.; Bohrer, G.; Nathan, R.; Bridle, J.R.; Gomulkiewicz, R.; Klein, E.K.; Ritland, K.; et al. Long-distance gene flow and adaptation of forest trees to rapid climate change. Ecol. Lett. 2012, 15, 378–392. [Google Scholar] [CrossRef]
- Tomback, D.F.; Kendall, K.C. Biodiversity losses: The downward spiral. In Whitebark Pine Communities: Ecology and Restoration; Tomback, D.F., Arno, S.F., Keane, R.E., Eds.; Island Press: Washington, DC, USA, 2001; pp. 243–262. [Google Scholar]
- Tomback, D.F.; Arno, S.F.; Keane, R.E.; Tomback, S.F.; Washington, D.C.; Achuff, P. The compelling case for management intervention. In Whitebark Pine Communities: Ecology and Restoration; Island Press: Washington, DC, USA, 2001; pp. 3–25. [Google Scholar]
- Keane, R.E.; Tomback, D.F.; Aubry, C.A.; Bower, A.D.; Campbell, E.M.; Cripps, C.L.; Jenkins, M.B.; Mahalovich, M.F.; Manning, M.; McKinney, S.T. A Range-Wide Restoration Strategy for Whitebark Pine (Pinus albicaulis); Gen. Tech. Rep. RMRS-GTR-279; U.S. Department of Agriculture, Forest Service, Rocky Mountain Research Station: Fort Collins, CO, USA, 2012; 108p.
- Tomback, D.F. Dispersal of whitebark pine seeds by Clark’s nutcracker: A mutualism hypothesis. J. Anim. Ecol. 1982, 51, 451–467. [Google Scholar] [CrossRef]
- Mckinney, S.T.; Fiedler, C.E.; Tomback, D.F. Invasive pathogen threatens bird-pine mutualism: Implications for sustaining a high-elevation ecosystem. Ecol. Appl. 2009, 19, 597–607. [Google Scholar] [CrossRef] [PubMed]
- Arno, S.F.; Hoff, R.J. Silvics of Whitebark Pine (Pinus albicaulis); Gen. Tech. Rep. INT-253; United States Department of Agriculture, Intermountain Research Station, Forest Service: Ogden, UT, USA, 1989; 11p.
- Arno, S.F.; Weaver, T. Pinus albicaulis Engelm. Whitebark pine. In Proceedings of the Symposium on Whitebark Pine Ecosystems: Ecology and Management of a High-Elevation Resource, Bozeman, MT, USA, 29–31 March 1989; Schmidt, W.C., McDonald, K.J., Eds.; United States Department of Agriculture, Intermountain Research Station, Forest Service: Fort Collins, CO, USA, 1990; pp. 97–105. [Google Scholar]
- Farnes, P.E. SNOTEL and snow course data: Describing the hydrology of whitebark pine ecosystems. In Proceedings of the Symposium on Whitebark Pine Ecosystems: Ecology and Management of a High-Elevation Resource, Bozeman, MT, USA, 29–31 March 1989; Schmidt, W.C., McDonald, K.J., Eds.; Vol. General Te. USDA Forest Service, Intermountain Research Station: Fort Collins, CO, USA, 1990; pp. 302–304. [Google Scholar]
- Smith, C.M.; Wilson, B.; Rasheed, S.; Walker, R.C.; Carolin, T.; Shepherd, B. Whitebark pine and white pine blister rust in the Rocky Mountains of Canada and northern Montana. Can. J. For. Res. 2008, 38, 982–995. [Google Scholar] [CrossRef]
- Duriscoe, D.M.; Duriscoe, C.S. Survey and Monitoring of White Pine Blister Rust in Sequoia and Kings Canyon National Parks—Final Report of 1995–1999 Survey and Monitoring Plot Network; Science and Natural Resources Management Division, Sequoia and Kings Canyon National Parks: Three Rivers, CA, USA, 2002. [Google Scholar]
- Gibson, K.; Skov, K.; Kegley, S.; Jorgensen, C.; Smith, S.; Witcosky, J. Mountain Pine Beetle Impacts in High-Elevation Five-Needle Pines: Current Trends and Challenges; USDA Forest Service, Forest Health Protection: Missoula, MT, USA, 2008.
- Meyer, M.D.; Bulaon, B.; MacKenzie, M.; Safford, H.D. Mortality, structure, and regeneration in whitebark pine stands impacted by mountain pine beetle in the southern Sierra Nevada. Can. J. For. Res. 2016, 46, 572–581. [Google Scholar] [CrossRef]
- Diffenbaugh, N.S.; Swain, D.L.; Touma, D. Anthropogenic warming has increased drought risk in California. Proc. Natl. Acad. Sci. USA 2015, 112, 3931–3936. [Google Scholar] [CrossRef] [PubMed]
- Mastrogiuseppe, R.J.; Mastrogiuseppe, J.D. A study of Pinus balfouriana Grev. & Balf. (Pinaceae). Syst. Bot. 1980, 5, 86–104. [Google Scholar]
- Lloyd, A.H. Response of tree-line populations of foxtail pine (Pinus balfouriana) to climate variation over the last 1000 years. Can. J. For. Resour. 1997, 27, 936–942. [Google Scholar] [CrossRef]
- Scuderi, L.A. A 2000-year tree ring record of annual temperatures in the Sierra Nevada mountains. Science 1993, 259, 1433–1436. [Google Scholar] [CrossRef] [PubMed]
- Eckert, A.J.; Sawyer, J.O. Foxtail pine importance and conifer diversity in the Klamath Mountains and southern Sierra Nevada, California. Madroño 2002, 49, 33–45. [Google Scholar]
- Garrett, L.K.; Rodhouse, T.J.; Dicus, G.H.; Caudill, C.C.; Shardlow, M.R. Upper Columbia Basin Network vital signs monitoring plan. Natural Resource Report NPS/UCBN/NRR—2007/002; National Park Service: Fort Collins, CO, USA, 2007.
- Mutch, L.S.; Rose, M.G.; Heard, A.M.; Cook, R.R.; Entsminger, G.L. Sierra Nevada Network vital signs monitoring plan; Natural Resource Report NPS/SIEN/NRR-2008/072; National Park Service: Fort Collins, CO, USA, 2008.
- Sarr, D.A.; Odion, D.C.; Mohren, S.R.; Perry, E.E.; Hoffman, R.L.; Bridy, L.K.; Merton, A.A. Vital Signs Monitoring Plan for the Klamath Network: Phase III Report; Klamath Network National Park Service: Ashland, OR, USA, 2005.
- McKinney, S.T.; Rodhouse, T.; Chow, L.; Chung-Mac Coubrey, A.; Dicus, G.; Garrett, L.; Irvine, K.; Mohren, S.; Odion, D.; Sarr, D.; et al. Monitoring White Pine (Pinus albicaulis, P. balfouriana, P. flexilis) Community Dynamics in the Pacific West Region—Klamath, Sierra Nevada, and Upper Columbia Basin Networks: Narrative version 1.0; Natural Resource Report NPS/PWR/–2012/532; National Park Service: Fort Collins, CO, USA, 2012.
- National Park Service Sierra Nevada Inventory & Monitoring Program High-Elevation Forest Monitoring. Available online: https://www.nps.gov/im/sien/high-elevation-forests.htm (accessed on 17 December 2018).
- Keeler-Wolf, T.; Moore, P.E.; Reyes, E.T.; Menke, J.M.; Johnson, D.N.; Karavidas, D.L. Yosemite National Park Vegetation Classification and Mapping Project Report; Natural Resource Report NPS/XXXX/NRR-20XX/XXX; National Park Service: Fort Collins, CO, USA, 2012.
- Stevens, D.L., Jr.; Olsen, A.R. Spatially balanced sampling of natural resources. J. Am. Stat. Assoc. 2004, 99, 262–278. [Google Scholar] [CrossRef]
- McDonald, T. Spatial sampling designs for long-term ecological monitoring. In Design and Analysis of Long-term Ecological Monitoring Studies; Cambridge University Press: Cambridge, UK, 2012; pp. 102–125. [Google Scholar]
- Greater Yellowstone Whitebark Pine Monitoring Working Group. Interagency Whitebark Pine Monitoring Protocol for the Greater Yellowstone Ecosystem, v 1.0; Greater Yellowstone Coordinating Committee: Bozeman, MT, USA, 2007. [Google Scholar]
- Tomback, D.F.; Keane, R.E.; McCaughey, W.W.; Smith, C. Methods for Surveying and Monitoring Whitebark Pine for Blister Rust Infection and Damage; Whitebark Pine Ecosystem Foundation: Missoula, MT, USA, 2005. [Google Scholar]
- Das, A.J.; Stephenson, N.L.; Davis, K.P. Why do trees die? Characterizing the drivers of background tree mortality. Ecology 2016, 97, 2616–2627. [Google Scholar] [CrossRef]
- Bates, D.; Mächler, M.; Bolker, B.; Walker, S. Fitting linear mixed-effects models using lme4. J. Stat. Softw. 2015. [Google Scholar] [CrossRef]
- R Developement Core Team. R: A language and Environment for Statistical Computing; R Developement Core Team: Vienna, Austria, 2016. [Google Scholar]
- Fournier, D.A.; Skaug, H.J.; Ancheta, J.; Ianelli, J.; Magnusson, A.; Maunder, M.N.; Nielsen, A.; Sibert, J. AD Model Builder: Using automatic differentiation for statistical inference of highly parameterized complex nonlinear models. Optim. Methods Softw. 2012, 27, 233–249. [Google Scholar] [CrossRef]
- Smithson, M.; Verkuilen, J. A better lemon squeezer? Maximum-likelihood regression with beta-distributed dependent variables. Psychol. Methods 2006, 11, 54–71. [Google Scholar] [CrossRef]
- Lefcheck, J.S. piecewiseSEM: Piecewise structural equation modelling in r for ecology, evolution, and systematics. Methods Ecol. Evol. 2016, 7, 573–579. [Google Scholar] [CrossRef]
- Nakagawa, S.; Schielzeth, H. A general and simple method for obtaining R2 from generalized linear mixed-effects models. Methods Ecol. Evol. 2013, 4, 133–142. [Google Scholar] [CrossRef]
- McFadden, D. Conditional logit analysis of qualitative choice behavior. In Frontiers in Econometrics; Zarembka, P., Ed.; Institute of Urban and Regional Development, University of California Berkeley: Berkeley, CA, USA, 1974; pp. 105–142. [Google Scholar]
- Brodrick, P.G.; Asner, G.P. Remotely sensed predictors of conifer tree mortality during severe drought. Environ. Res. Lett. 2017, 12, 115013. [Google Scholar] [CrossRef]
- Paz-Kagan, T.; Brodrick, P.G.; Vaughn, N.R.; Das, A.J.; Stephenson, N.L.; Nydick, K.R.; Asner, G.P. What mediates tree mortality during drought in the southern Sierra Nevada. Ecol. Appl. 2017, 2443–2457. [Google Scholar] [CrossRef] [PubMed]
- Fettig, C.J.; Mortenson, L.A.; Bulaon, B.M.; Foulk, P.B. Tree mortality following drought in the central and southern Sierra Nevada, California, US. For. Ecol. Manag. 2019, 432, 164–178. [Google Scholar] [CrossRef]
- Meddens, A.J.H.; Hicke, J.A.; Macalady, A.K.; Buotte, P.C.; Cowles, T.R.; Allen, C.D. Patterns and causes of observed piñon pine mortality in the southwestern United States. New Phytol. 2015, 206, 91–97. [Google Scholar] [CrossRef] [PubMed]
- MacFarlane, W.W.; Logan, J.A.; Kern, W.R. An innovative aerial assessment of Greater Yellowstone Ecosystem mountain pine beetle-caused whitebark pine mortality. Ecol. Appl. 2013, 23, 421–437. [Google Scholar] [CrossRef]
- Jules, E.S.; Jackson, J.I.; Smith, S.B.; Nesmith, J.C.B.; Starcevich, L.A.; Sarr, D.A. Whitebark pine in Crater Lake and Lassen Volcanic National Parks: Initial Assessment of Stand Structure and Condition; Natural Resource Report. NPS/KLMN/NRR—2017/1459; National Park Service: Fort Collins, CO, USA, 2017.
- Maloney, P.E. Population ecology and demography of an endemic subalpine conifer (Pinus balfouriana) with a disjunct distribution in California. Madroño 2011, 58, 234–248. [Google Scholar] [CrossRef]
- Maloney, P.E. The multivariate underpinnings of recruitment for three Pinus species in montane forests of the Sierra Nevada, USA. Plant Ecol. 2014, 215, 261–274. [Google Scholar] [CrossRef]
- Crone, E.E.; McIntire, E.J.B.; Brodie, J. What defines mast seeding? Spatio-temporal patterns of cone production by whitebark pine. J. Ecol. 2011, 99, 438–444. [Google Scholar] [CrossRef]
- Keane, R.E.; Morgan, P.; Menakis, J.P. Landscape Assessment of the Decline of Whitebark pine (Pinus albicaulis) in the Bob Marshall Wilderness Complex, Montana, USA. Northwest Sci. 1994, 68, 213–229. [Google Scholar]
- Dolanc, C.R.; Thorne, J.H.; Safford, H.D. Widespread shifts in the demographic structure of subalpine forests in the Sierra Nevada, California, 1934 to 2007. Glob. Ecol. Biogeogr. 2013, 22, 264–276. [Google Scholar] [CrossRef]


| Tree Density (trees/ha) | Mean (sd) | Range |
|---|---|---|
| P. contorta density | 331 (450) | 0–1760 |
| T. mertensiana density | 133 (338) | 0–1376 |
| Other species density | 4 (22) | 0–132 |
| Snag density | 21 (25) | 0–100 |
| Tree DBH (cm) | ||
| P. albicaulis | 7.9 (5.2) | 1.6–29.7 |
| P. contorta | 14.5 (9.6) | 1.7–34.6 |
| T. mertensiana | 10.7 (4.2) | 1.7–15.4 |
| Other species | 21.6 (12.0) | 13.1–30.1 |
| Snags | 24.8 (14.3) | 0.9–56.2 |
| Tree basal area (m2/ha) | ||
| P. albicaulis | 3.7 (5.1) | <0.1–19.0 |
| P. contorta | 18.3 (24.3) | 0–76.9 |
| T. mertensiana | 2.8 (7.3) | 0–32.7 |
| Other species | 0.8 (4.8) | 0–28.1 |
| Snags | 1.7 (2.9) | 0–14.7 |
| Seedling regeneration 20–136 cm (seedlings/ha) | ||
| P. albicaulis | 853 (2434) | 0–13,210 |
| Other species | 320 (519) | 0–1605 |
| Incidence of stressors | ||
| P. albicaulis crown mortality (%) | 8.2 (9.0) | 0.7–43.3 |
| P. albicaulis WPBR infection rate (# of infected trees/ha) | 1.4 (8.1) | 0–48 |
| WPBR occurrence rate (% of infected P. albicaulis/plot) | 0.1 (0.8) | 0–4.8 |
| MPB infestation rate (# of infested trees/ha) | 1.0 (2.4) | 0–12 |
| P. albicaulis MPB infestation rate (# of infested P. albicaulis/ha) | 0.2 (0.9) | 0–4 |
| P. albicaulis MPB occurrence rate (% of attacked P. albicaulis/plot) | <0.1 (0.2) | 0–1.0 |
| Female cone production (# of trees with cones/ha) | ||
| P. albicaulis | 101 (150) | 0–620 |
| Sample Frame | Term | Est | SE | p-Value | CI (95%) |
|---|---|---|---|---|---|
| Whitebark pine | Intercept | −3.264 | 0.127 | <0.001 | −3.513, −3.014 |
| YOSE | Elevation (m) | 0.016 | 0.106 | 0.880 | −0.193, 0.225 |
| Easting | 0.005 | 0.099 | 0.960 | −0.188, 0.198 | |
| PINALB BA | −0.130 | 0.096 | 0.179 | −0.319, 0.059 | |
| Other BA | −0.034 | 0.100 | 0.735 | −0.229, 0.161 | |
| DBH (cm) | 0.031 | 0.017 | 0.076 | −0.003, 0.065 | |
| 2016 | 0.202 | 0.175 | 0.248 | −0.141, 0.546 | |
| 2017 | 1.443 | 0.198 | <0.001 | 1.055, 1.830 | |
| Whitebark pine | Intercept | −3.286 | 0.133 | <0.001 | −3.546, −3.026 |
| SEKI | Elevation (m) | −0.044 | 0.045 | 0.328 | −0.133, 0.044 |
| Easting | −0.065 | 0.040 | 0.105 | −0.144, 0.014 | |
| PINALB BA | 0.135 | 0.039 | <0.001 | 0.059, 0.212 | |
| Other BA | −0.003 | 0.036 | 0.923 | −0.074, 0.067 | |
| DBH (cm) | 0.027 | 0.016 | 0.099 | −0.005, 0.059 | |
| 2014 | −0.084 | 0.194 | 0.664 | −0.464, 0.296 | |
| 2015 | 0.141 | 0.16 | 0.380 | −0.174, 0.455 | |
| 2016 | 0.443 | 0.135 | 0.001 | 0.177, 0.708 | |
| 2017 | 1.804 | 0.147 | <0.001 | 1.515, 2.093 | |
| Foxtail pine | Intercept | −3.657 | 0.560 | <0.001 | −4.756, −2.559 |
| SEKI | Elevation (m) | −0.003 | 0.084 | 0.969 | −0.168, 0.162 |
| Easting | −0.019 | 0.076 | 0.801 | −0.168, 0.130 | |
| PINBAL BA | 0.176 | 0.080 | 0.028 | 0.019, 0.332 | |
| Other BA | 0.023 | 0.075 | 0.755 | −0.123, 0.170 | |
| DBH (cm) | 0.136 | 0.032 | <0.001 | 0.073, 0.199 | |
| 2014 | 0.047 | 0.641 | 0.941 | −1.209, 1.303 | |
| 2015 | 0.482 | 0.564 | 0.393 | −0.623, 1.587 | |
| 2016 | 0.640 | 0.558 | 0.251 | −0.454, 1.734 | |
| 2017 | 1.645 | 0.591 | 0.005 | 0.486, 2.804 |
| Sample Frame | Term | Est | SE | p-Value | CI (95%) |
|---|---|---|---|---|---|
| Whitebark pine | Intercept | −1.889 | 0.266 | <0.001 | −2.410, −1.368 |
| YOSE | Elevation (m) | 1.775 | 0.447 | <0.001 | 0.899, 2.651 |
| Easting | −1.075 | 0.342 | 0.002 | −1.745, −0.406 | |
| PINALB BA | 0.331 | 0.305 | 0.278 | −0.267, 0.929 | |
| Other BA | 0.21 | 0.334 | 0.529 | −0.444, 0.864 | |
| DBH (cm) | 2.427 | 0.111 | <0.001 | 2.210, 2.644 | |
| Avg. Crown Mort. | −0.571 | 0.093 | <0.001 | −0.753, −0.388 | |
| Whitebark pine | Intercept | −2.852 | 0.592 | <0.001 | −4.013, −1.690 |
| SEKI | Elevation (m) | 0.086 | 0.205 | 0.676 | −0.316, 0.488 |
| Easting | 0.139 | 0.178 | 0.436 | −0.210, 0.488 | |
| PINALB BA | −0.242 | 0.168 | 0.151 | −0.572, 0.088 | |
| Other BA | −0.430 | 0.164 | 0.009 | −0.751, −0.108 | |
| DBH (cm) | 2.295 | 0.091 | <0.001 | 2.116, 2.473 | |
| Avg. Crown Mort. | −0.531 | 0.077 | <0.001 | −0.681, −0.380 | |
| 2014 | 1.055 | 0.849 | 0.214 | −0.609, 2.718 | |
| 2015 | 2.002 | 0.702 | 0.004 | 0.625, 3.378 | |
| 2016 | 0.808 | 0.624 | 0.195 | −0.415, 2.030 | |
| 2017 | 1.793 | 0.671 | 0.008 | 0.477, 3.109 | |
| Foxtail pine | Intercept | 2.117 | 0.195 | <0.001 | 1.734, 2.500 |
| SEKI | Elevation (m) | 0.146 | 0.155 | 0.347 | −0.158, 0.450 |
| Easting | 0.135 | 0.143 | 0.346 | −0.145, 0.415 | |
| PINBAL BA | −0.234 | 0.166 | 0.159 | −0.559, 0.091 | |
| Other BA | −0.130 | 0.144 | 0.366 | −0.413, 0.152 | |
| DBH (cm) | 3.267 | 0.247 | <0.001 | 2.782, 3.751 | |
| Avg. Crown Mort. | −0.963 | 0.124 | <0.001 | −1.206, −0.72 |
| Tree Density (trees/ha) | Mean (sd) | Range |
|---|---|---|
| P. albicaulis | 442 (386) | 32–1568 |
| P. contorta | 181 (335) | 0–1516 |
| Other species | 7 (22) | 0–116 |
| Snag density | 16 (23) | 0–112 |
| Tree DBH (cm) | ||
| P. albicaulis | 10.1 (5.4) | 1.9–30.2 |
| P. contorta | 19.7 (11.8) | 2.6–47.3 |
| Other species | 18.0 (10.7) | 4.2–31.2 |
| Snags | 27.1 (13.2) | 8.9–50.8 |
| Tree basal area (m2/ha) | ||
| P. albicaulis | 7.4 (7.5) | <0.1–23.0 |
| P. contorta | 11.3 (16.6) | 0–56.5 |
| Other species | 0.5 (2.0) | 0–10.9 |
| Snags | 1.9 (3.9) | 0–20.3 |
| Seedling regeneration 20–136 cm (seedlings/ha) | ||
| P. albicaulis | 785 (2226) | 0–11,605 |
| Other species | 147 (269) | 0–988 |
| Incidence of stressors | ||
| P. albicaulis crown mortality (%) | 8.2 (7.1) | <0.1–23.8 |
| P. albicaulis WPBR infection rate (# of infected trees/ha) | 0.8 (2.2) | 0–8 |
| WPBR occurrence rate (% of infected P. albicaulis/plot) | 0.1 (0.4) | 0–1.4 |
| MPB infestation rate (# of infested trees/ha) | 4.2 (15.2) | 0–84 |
| P. albicaulis MPB infestation rate (# of infested P. albicaulis/ha) | 3.7 (15.2) | 0–84 |
| MPB occurrence rate (% of P. albicaulis/plot with MPB activity) | 1.0 (3.5) | 0–17.6 |
| Female cone production (# of trees with cones/ha) | ||
| P. albicaulis | 134 (130) | 0–524 |
| Tree Density (trees/ha) | Mean (sd) | Range |
|---|---|---|
| P. balfouriana | 130 (107) | 4–436 |
| P. albicaulis | 68 (137) | 0–520 |
| P. contorta | 66 (108) | 0–376 |
| Other species | 1 (3) | 0–12 |
| Snags | 23 (22) | 0–92 |
| Tree DBH (cm) | ||
| P. balfouriana | 48.1 (32.3) | 3.6–182.3 |
| P. albicaulis | 19.7 (28.1) | 3.0–94.6 |
| P. contorta | 28.1 (15.2) | 7.2–58.7 |
| Other species | 23.3 (21.2) | 2.4–54.4 |
| Snags | 58.7 (24.2) | 6.2–119.0 |
| Tree basal area (m2/ha) | ||
| P. balfouriana | 26.0 (18.1) | <0.1–72.5 |
| P. albicaulis | 1.2 (2.5) | 0–10.6 |
| P. contorta | 6.7 (11.3) | 0–41.1 |
| Other species | 0.2 (0.8) | 0–4.3 |
| Snags | 6.6 (6.9) | 0–31.4 |
| Seedling regeneration 20 – 136 cm (seedlings/ha) | ||
| P. balfouriana | 45 (106) | 0–494 |
| Other species | 37 (133) | 0–741 |
| Incidence of stressors | ||
| P. balfouriana crown mortality (%) | 6.2 (7.0) | 0–25.5 |
| P. balfouriana WPBR infection rate (# of infected trees/ha) | 0 | 0 |
| P. albicaulis WPBR infection rate (# of infected trees/ha) | 0.1 (0.7) | 0–4 |
| WPBR occurrence rate (% of infected P. balfouriana/plot) | 0 | 0 |
| MPB infestation rate (# of infested trees/ha) | 0.6 (1.5) | 0–4 |
| P. balfouriana MPB infestation rate (# of infested P. balfouriana/ha) | 0.1 (0.7) | 0–4 |
| MPB occurrence rate (% of P. balfouriana/plot with MPB activity) | 0.1 (0.7) | 0–4 |
| Female cone production (# of trees with cones/ha) | ||
| P. balfouriana female cone production (# of trees with cones/ha) | 90 (69) | 0–284 |
© 2019 by the authors. Licensee MDPI, Basel, Switzerland. This article is an open access article distributed under the terms and conditions of the Creative Commons Attribution (CC BY) license (http://creativecommons.org/licenses/by/4.0/).
Share and Cite
Nesmith, J.C.B.; Wright, M.; Jules, E.S.; McKinney, S.T. Whitebark and Foxtail Pine in Yosemite, Sequoia, and Kings Canyon National Parks: Initial Assessment of Stand Structure and Condition. Forests 2019, 10, 35. https://doi.org/10.3390/f10010035
Nesmith JCB, Wright M, Jules ES, McKinney ST. Whitebark and Foxtail Pine in Yosemite, Sequoia, and Kings Canyon National Parks: Initial Assessment of Stand Structure and Condition. Forests. 2019; 10(1):35. https://doi.org/10.3390/f10010035
Chicago/Turabian StyleNesmith, Jonathan C.B., Micah Wright, Erik S. Jules, and Shawn T. McKinney. 2019. "Whitebark and Foxtail Pine in Yosemite, Sequoia, and Kings Canyon National Parks: Initial Assessment of Stand Structure and Condition" Forests 10, no. 1: 35. https://doi.org/10.3390/f10010035
APA StyleNesmith, J. C. B., Wright, M., Jules, E. S., & McKinney, S. T. (2019). Whitebark and Foxtail Pine in Yosemite, Sequoia, and Kings Canyon National Parks: Initial Assessment of Stand Structure and Condition. Forests, 10(1), 35. https://doi.org/10.3390/f10010035