Article

Predicting the Potential Distribution of Eleutherococcus nodiflorus in China Under Future Climate Scenarios Using MaxEnt Modeling


1
School of Pharmacy, Anhui University of Chinese Medicine, Hefei 230012, China
2
Key Laboratory of Research and Development of Chinese Medicine of Anhui Province, School of Pharmacy, Anhui University of Chinese Medicine, Hefei 230012, China
3
Institute for Conservation and Development of Traditional Chinese Medicine Resources, Anhui Academy of Chinese Medicine, Hefei 230012, China
*
Author to whom correspondence should be addressed.
Forests 2026, 17(7), 854; https://doi.org/10.3390/f17070854
Submission received: 11 June 2026 / Revised: 11 July 2026 / Accepted: 17 July 2026 / Published: 20 July 2026
(This article belongs to the Special Issue Modeling of Forest Dynamics and Species Distribution)

Abstract

Climate change and intensified forest destruction are severely threatening the habitats of numerous wildlife species and plants. Known for its roots, Eleutherococcus nodiflorus (Araliaceae) is a plant used in traditional Chinese medicine, which contains diverse active compounds with significant medicinal value. However, studies indicate its wild populations are undergoing an accelerating decline due to combined pressures from climate change and human activities. To elucidate the climate change response of E. nodiflorus habitat suitability, we used the ENMeval package to develop an optimized MaxEnt model, incorporating 184 occurrence records and 12 environmental factors. Under the SSP1-2.6 and SSP5-8.5 climate scenarios, we simulated and projected the potential distribution of this species across China for the current period and four future time intervals (2021–2040, 2041–2060, 2061–2080, and 2081–2100). The results indicate that key environmental factors governing the distribution of E. nodiflorus include November precipitation, January minimum temperature, temperature seasonality, and June minimum temperature. Currently, the suitable habitat for E. nodiflorus spans approximately 1.38 × 10⁶ km2 and is predominantly located in central, eastern, and southern China. The high-suitability habitats are concentrated in Hunan Province, southern Anhui, and eastern Zhejiang. According to model projections under both climate scenarios, the suitable habitat of E. nodiflorus will first expand and then contract, while its distribution centroid moves generally toward higher latitudes. Under the trend of ongoing global warming, this study provides valuable references for formulating effective climate change adaptation plans and protecting biodiversity.

1. Introduction

Climate profoundly influences plant distributions. Plant species occupy specific ecological niches and adjust their ranges in response to climate fluctuations [1]. The decline in global biodiversity is partly attributed to changes in plant habitats and ecosystems induced by climate change [2]. As reported in the IPCC Sixth Assessment Report (AR6), the impacts and risks of climate warming are increasingly complex and have imposed profound and irreversible consequences on ecosystems [3]. Research indicates that over the coming decades, the primary threat to biodiversity will shift from habitat destruction to global warming [4]. Under projected climate scenarios, plant populations with diminished adaptive capacity in their native habitats typically shift to higher latitudes [5]. However, the ability of species to adapt to climate change is limited. Without adaptation or successful migration to suitable habitats, a part of or the entire population will face the risk of extinction [6]. Therefore, it is essential to understand how global climate change affects the potential geographic distribution of plants. Such knowledge supports the assessment of plant responses to climate change and is valuable for species protection, utilization, and sustainable development [7].
Species distribution models (SDMs) are extensively utilized in ecology and conservation science. Among various species distribution models, such as Bioclim (Bioclimatic Prediction System), Domain, ENFA (Ecological Niche Factor Analysis), and GARP (Genetic Algorithm for Rule-set Prediction) [8,9,10,11], the Maximum Entropy model (MaxEnt) demonstrates superior performance [12,13]. This model exhibits high predictive accuracy and robustness [14], proving particularly valuable for assessing climate change impacts on species distributions and developing conservation strategies for threatened taxa. Its applications span multiple domains, including forestry, agronomy, and epidemiology [15,16,17]. MaxEnt is capable of predicting potential habitats and migration routes for species. This information supports the development of targeted conservation plans for endangered species. Although requiring fewer parameter adjustments than many complex models, dedicated R packages (e.g., ENMeval, Kuenm) have been developed to optimize default settings for enhanced predictive outcomes [18,19].
Eleutherococcus nodiflorus (Dunn) S. Y. Hu (formerly known as Acanthopanax gracilistylus W.W.Sm.; E. gracilistylus and A. gracilistylus are synonyms) is a slow-growing understory shrub occurring at elevations of 500–3000 m in broadleaf forests, mixed forests, and forest fringes [20]. Its distribution is predominantly concentrated in central China (Hubei, Hunan), eastern China (Jiangsu, Zhejiang, Anhui), and southern China (Guangdong, Guangxi) [21]. Its deep root system enhances soil erosion resistance and provides food resources for wildlife. This species holds significant medicinal value: traditionally used to alleviate symptoms of rheumatic pain and hepatic injury, its extracts have been shown by modern pharmacological studies to exhibit anti-diabetic activity [22,23]. Due to the dual pressures of human activities and climate change, coupled with its slow-growing characteristic in forest understories, its wild populations have declined dramatically. Although belonging to the same Araliaceae family as Panax quinquefolius and Panax notoginseng [24,25], fundamental research on E. nodiflorus remains relatively limited. Therefore, identifying the potential distribution of this species under current and future climate scenarios is crucial for germplasm conservation and utilization.
This study focuses on E. nodiflorus, employing both the MaxEnt model and ArcGIS 10.8.1 (Geographic Information Systems) to forecast its contemporary and future suitable habitats. By analyzing the key bioclimatic variables that affect its geographic distribution, we analyzed the spatial dynamics of suitable habitats to identify climate refugia and priority conservation zones. The results elucidate the species’ ecological response pathways to climate change, providing scientific foundations for germplasm conservation strategies.

2. Materials and Methods

2.1. E. nodiflorus Distribution Data Sources

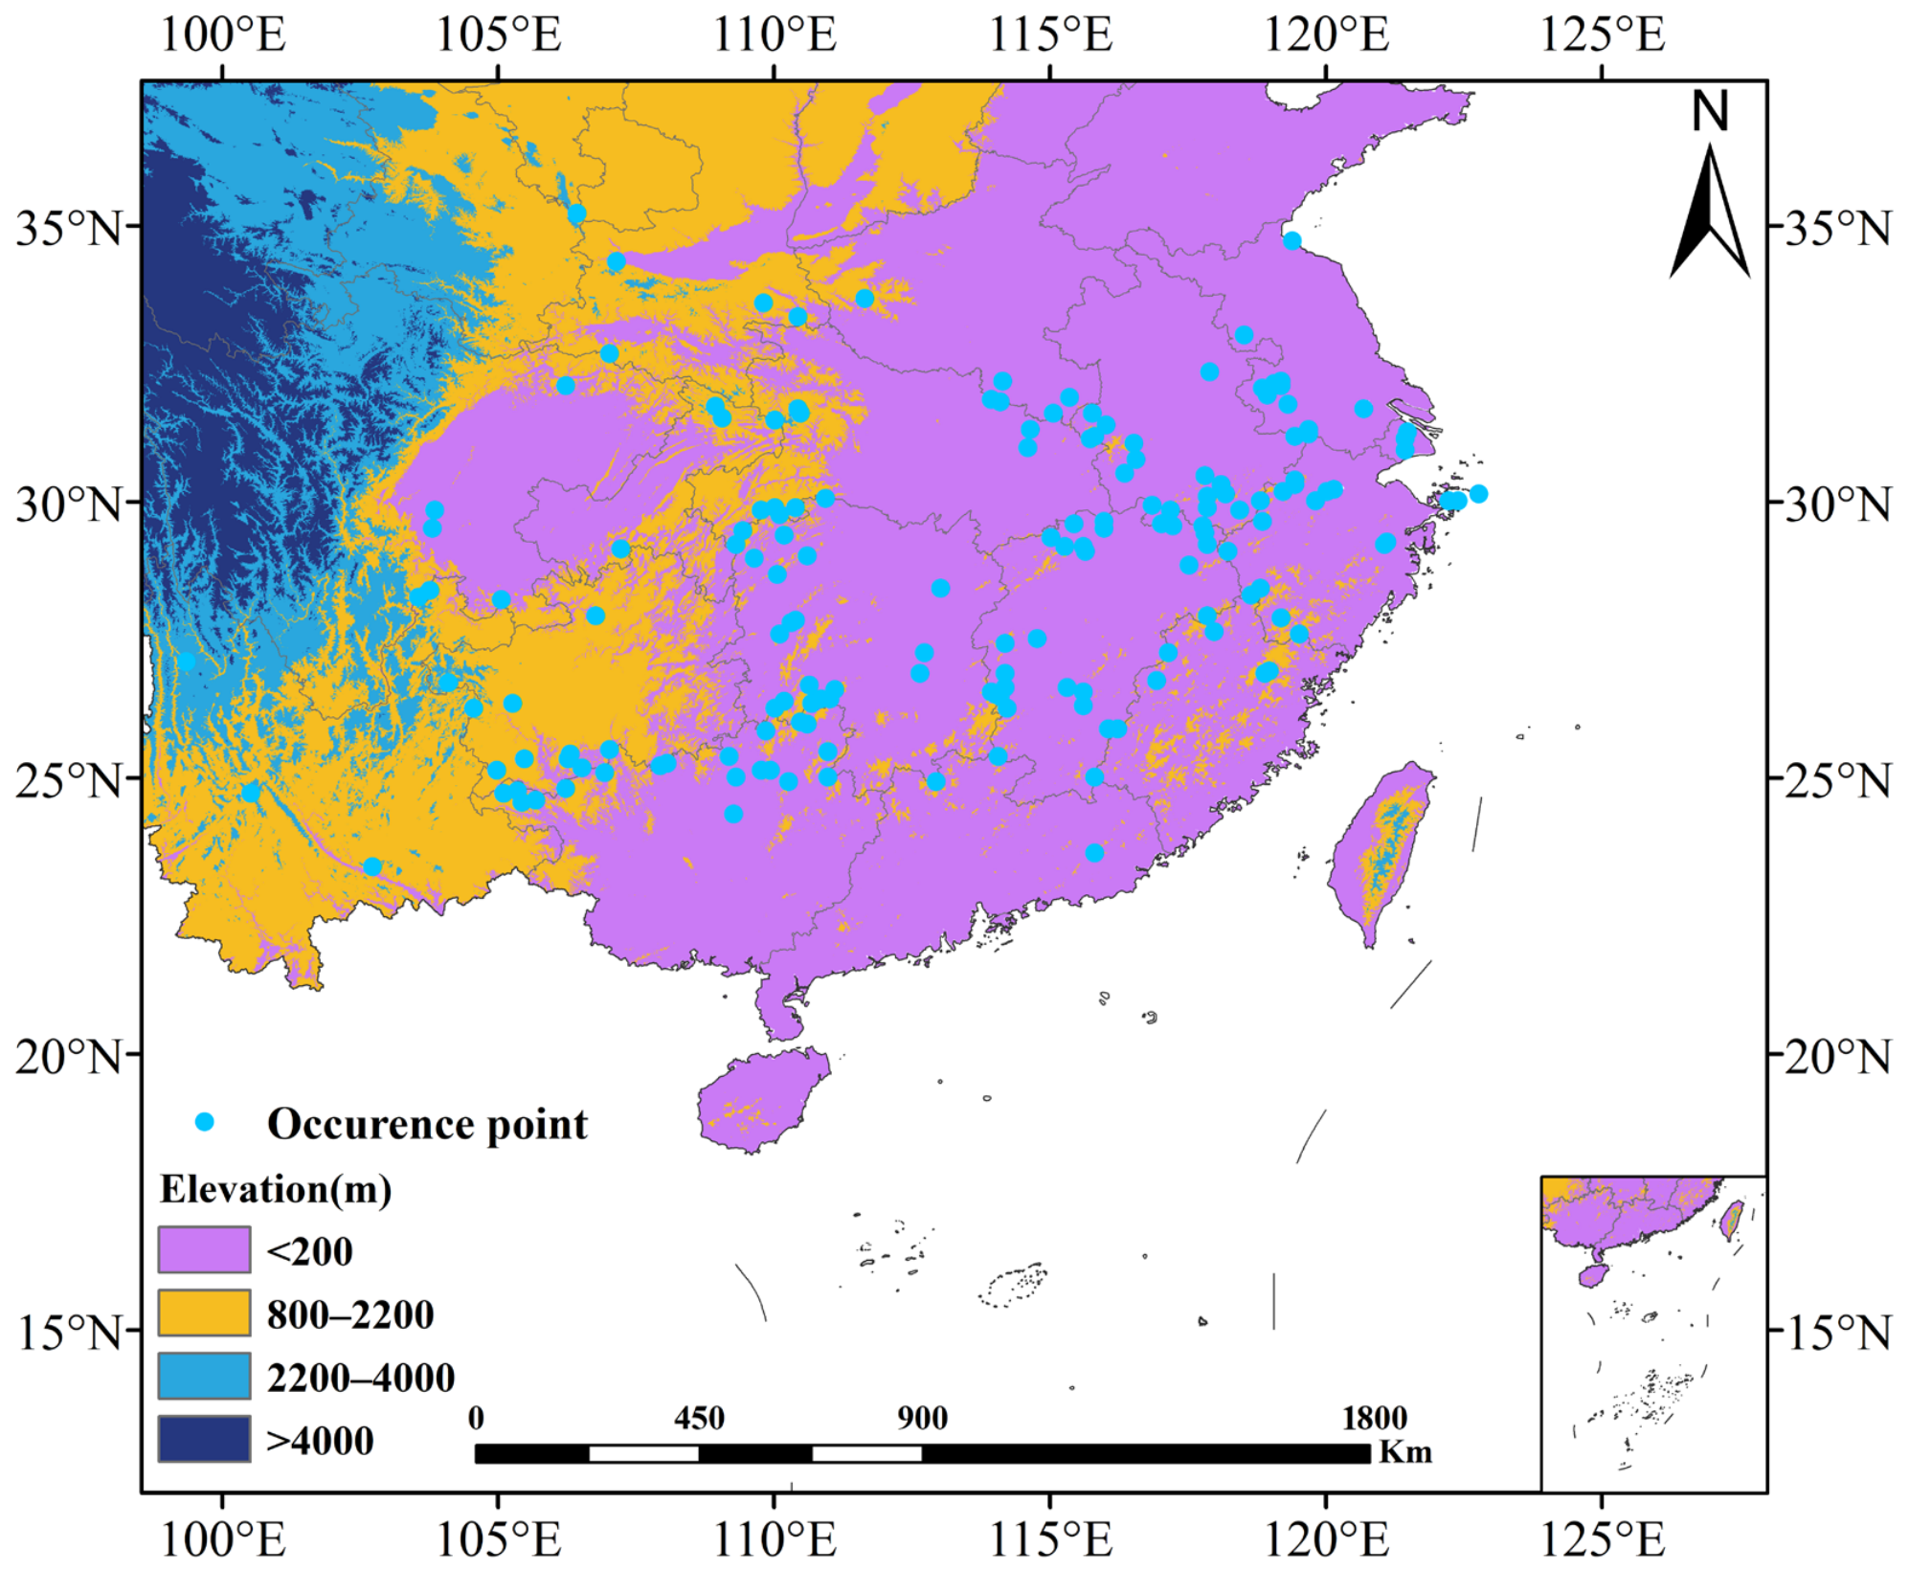
We collected 204 distribution records of E. nodiflorus in China by querying the China Virtual Herbarium (CVH) and the National Specimen Information Infrastructure of China (NSII) [26,27]. Records with precise latitude and longitude coordinates were verified via Google Maps [28], while geographic coordinates for partially incomplete records were supplemented [29]. To mitigate spatial autocorrelation effects, we employed a 5 km × 5 km grid filtering protocol using ENMTools, eliminating duplicate or spatially proximal occurrence records. This process yielded 184 spatially independent occurrence records for final analysis [30]. All occurrence records were converted to the degree-minute-second format and stored as CSV files (Figure 1). The base map of China used for geographical analysis was obtained from the Standard Map Service System of the Ministry of Natural Resources [31] (Inspection number: GS (2024) 0650). Although field collections of E. nodiflorus were made in Yaohai District (Hefei, Anhui), Huoshan County (Lu’an, Anhui), and Hong’an County (Hubei) for experimental purposes, these materials were not prepared as voucher specimens. All occurrence records used for modeling were derived from published literature and online databases.

2.2. Environmental Data

This study incorporated environmental variables (detailed specifications of these variables are provided in Table S1), including contemporary and future climate data, topographic factors, soil type datasets and human activity data. WorldClim provided contemporary climate data [32], including 19 bioclimatic factors (Bio1 to Bio19), monthly rainfall, and minimum/maximum temperature records, and average temperature records. Specifically, monthly precipitation (prec1–12), average temperature (tavg1–12), maximum temperature (tmax1–12), and minimum temperature (tmin1–12) each consist of 12 variables representing monthly values. Topographic factors (elevation, slope, and aspect) were obtained from the Digital Elevation Model (DEM) data, while soil composition datasets came from the Harmonized World Soil Database (HWSD). The human activity data was sourced from the Resource and Environmental Science Data Platform (RESDC) [33]. Future climate projections utilized model outputs based on the BCC-CSM2-MR model developed by the Beijing Climate Center, within the framework of CMIP6 (Coupled Model Intercomparison Project Phase 6) [34]. This study utilized climate data under two representative Shared Socioeconomic Pathways (SSP1-2.6 and SSP5-8.5), representing a low-forcing sustainability scenario and a high-forcing fossil-fuel-dependent scenario, respectively, for the periods 2021–2040, 2041–2060, 2061–2080, and 2081–2100. All environmental predictors (totaling 91) were uniformly rescaled to 2.5 arc-minute spatial resolution. Before analyzing future shifts in the spatial distribution of E. nodiflorus suitable habitat, we installed the SDMtoolbox and employed its “Distribution Change” tool to analyze the direction and distance of habitat change across periods and emission pathways.
To reduce multicollinearity-induced errors among environmental predictors, highly correlated variables were systematically filtered by applying a Pearson correlation coefficient threshold of |r| < 0.8 and contribution rate ≥ 0.3 [35]. Additionally, variables with lower contributions but known ecological relevance were also included to ensure comprehensive model interpretability. The following sequential procedure was implemented to screen key variables from the initial 91 environmental variables for MaxEnt modeling: (1) Integrate the 91 environmental variables with 184 occurrence records into the MaxEnt model for preliminary runs and assess each variable’s contribution rate to model performance; (2) Variable pairs with |r| < 0.8 were identified using ENMTools. Variables meeting this threshold, and also showing a contribution value of at least 0.3 during the first MaxEnt execution, were kept for further analysis [36]. This procedure yielded 12 environmental variables for model building, tuning, and validation: November precipitation (prec11), January minimum temperature (tmin1), temperature seasonality (bio4), vegetation classification (zbyl), aluminum saturation (alum_sat), June minimum temperature (tmin6), calcium carbonate (eq), slope, August precipitation (prec8), aspect, gypsum content (gypsum), and coarse fragments (coarse).

2.3. MaxEnt Model Development, Tuning, and Assessment

Current studies suggest that employing default settings in MaxEnt modeling may yield suboptimal predictive performance [37]. Model accuracy and projection quality are primarily governed through two critical parameters: the regularization multiplier (RM) and feature class combinations (FC). To address the fact that different RM and FC parameter combinations lead to varying model outputs, we performed optimization with the Kuenm package using R version 4.4.1 [38]. The package evaluates five fundamental feature classes: Threshold (T), Hinge (H), Product (P), Quadratic (Q), and Linear (L) feature classes. Combinations of these feature classes yielded 31 distinct parameter settings. The default configuration employs LQPH feature combinations. The regularization multiplier (RM) was varied between 0.1 and 4.0 in steps of 0.5, generating eight discrete parameter configurations. The Kuenm package evaluated 8 RM values and 31 FC configurations, yielding 248 parameter combinations in total through tripartite performance metrics: (1) statistical significance ROC (receiver operating characteristic) curve; (2) prediction omission proportion; (3) and model complexity (Akaike information criterion corrected, AICc) [39].
The 12 environmental variables and the filtered occurrence records (CSV format) were loaded into MaxEnt. Parameter settings were configured according to the optimized model specifications. We configured the MaxEnt model with the following settings: 75% of occurrence records were used for training and 25% for testing (random test percentage). The bootstrap method was used, with a maximum of 10,000 background points. A random seed was enabled for reproducibility. The model ran 10 times, and outputs were generated as logistic values [40].
The AUC (Area Under the Curve) quantifies the surface area beneath the receiver operating characteristic curve, serving as a threshold-independent metric for evaluating model accuracy [41]. AUC values fall between 0.5 to 1.0 and are widely adopted as a robust performance indicator for species distribution model projections. AUC values ranging from 0.5 to 0.6 indicate a failing model, 0.6–0.7 reflect poor accuracy, 0.7–0.8 represent moderate accuracy, 0.8–0.9 demonstrate good performance, and 0.9–1.0 show excellent performance [42]. This study employed AUC as the primary model evaluation metric. Higher AUC values indicate stronger predictive importance of environmental variables for E. nodiflorus distribution, concurrently reflecting enhanced discriminative ability and predictive reliability of the model.

2.4. Data Preparation and Preprocessing for MaxEnt Modeling

Using ArcGIS 10.8.1, we partitioned and visualized potential suitable habitats for E. nodiflorus to quantify area changes under current and future climate scenarios. The MTSPS (Maximum Test Sensitivity Plus Specificity) threshold [43], which comes directly from MaxEnt outputs, was then applied to distinguish suitable from non-suitable areas. The averaged MaxEnt output in ASCII grid format was loaded into ArcGIS. In ArcGIS, the reclassify tool categorized suitability as: non-suitable (0–MTSPS); low (MTSPS–0.5); medium (0.5–0.7); high (0.7–1). Spatial distribution areas were quantified by calculating pixel counts per suitability class in ArcGIS 10.8.1, converted to areal units using grid resolution parameters.
Using ArcGIS, the potential suitable habitat of E. nodiflorus was dichotomized into: non-suitable areas (0–MTSPS), and suitable habitat (MTSPS–1.0) for both current and future climate projections [44,45]. The “Intersect tool” in ArcGIS was employed to conduct spatial overlay analysis between current and future suitable habitats. Based on the overlay results, future suitable habitats were grouped according to three change patterns: expanding regions, shrinking regions, and stable regions. To quantify spatiotemporal shifts in suitable habitat distribution, this study computed geometric centroids of habitat patches to characterize directional displacement patterns. Given the assumed migration capacity of E. nodiflorus, the ArcGIS Zonal Geometry tool was utilized to compute geometric centroids across climate scenarios [46]. Spatial shifts of these centroids were analyzed to establish a migration model, which quantifies displacement distance and direction of habitat cores, with centroid dynamics reflecting range shift trajectories [47].

3. Results

3.1. Optimizing and Evaluating Model Performance

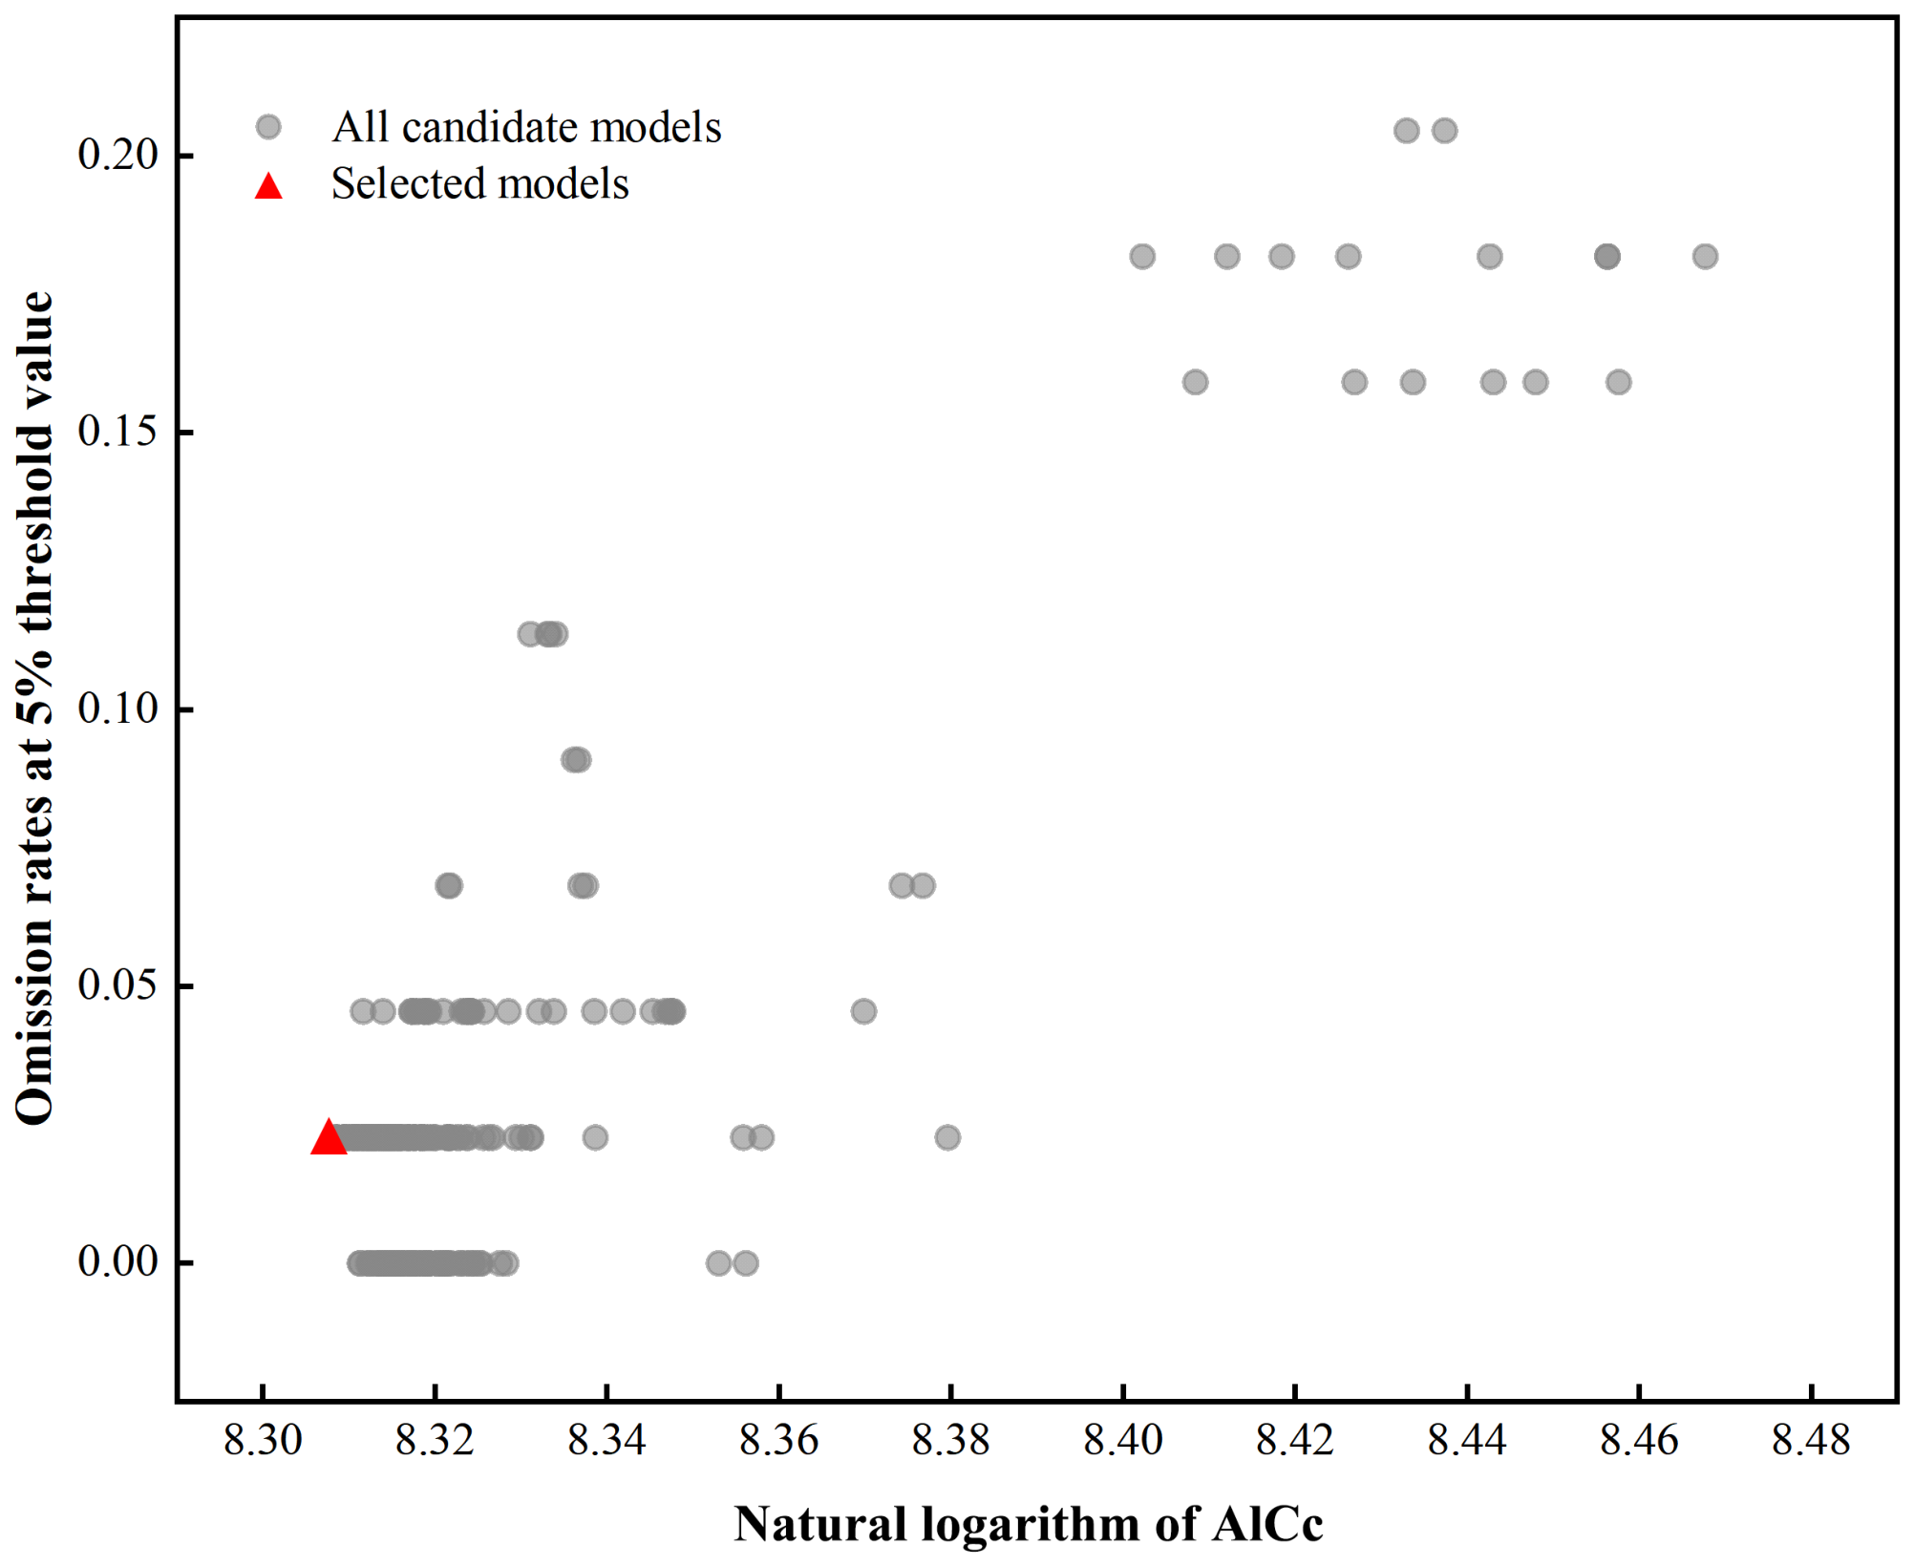
Under default parameters (FC = LQPH, RM = 1), the model yielded a mean AUC ratio of 1.795. After optimization with the Kuenm package using FC = LQPT and RM = 4, the mean AUC ratio increased to 1.803. Consequently, FC = LQPT and RM = 4 were selected as the optimal parameters in final distribution modeling of E. nodiflorus (Figure 2). Under optimized parameters, the MaxEnt AUC decreased from an initial 0.975 to 0.952 [48]. Although the AUC on the test set showed a minor reduction, the model’s generalization capability increased (Table 1).

3.2. Impacts of Key Environmental Factors on E. nodiflorus Distribution

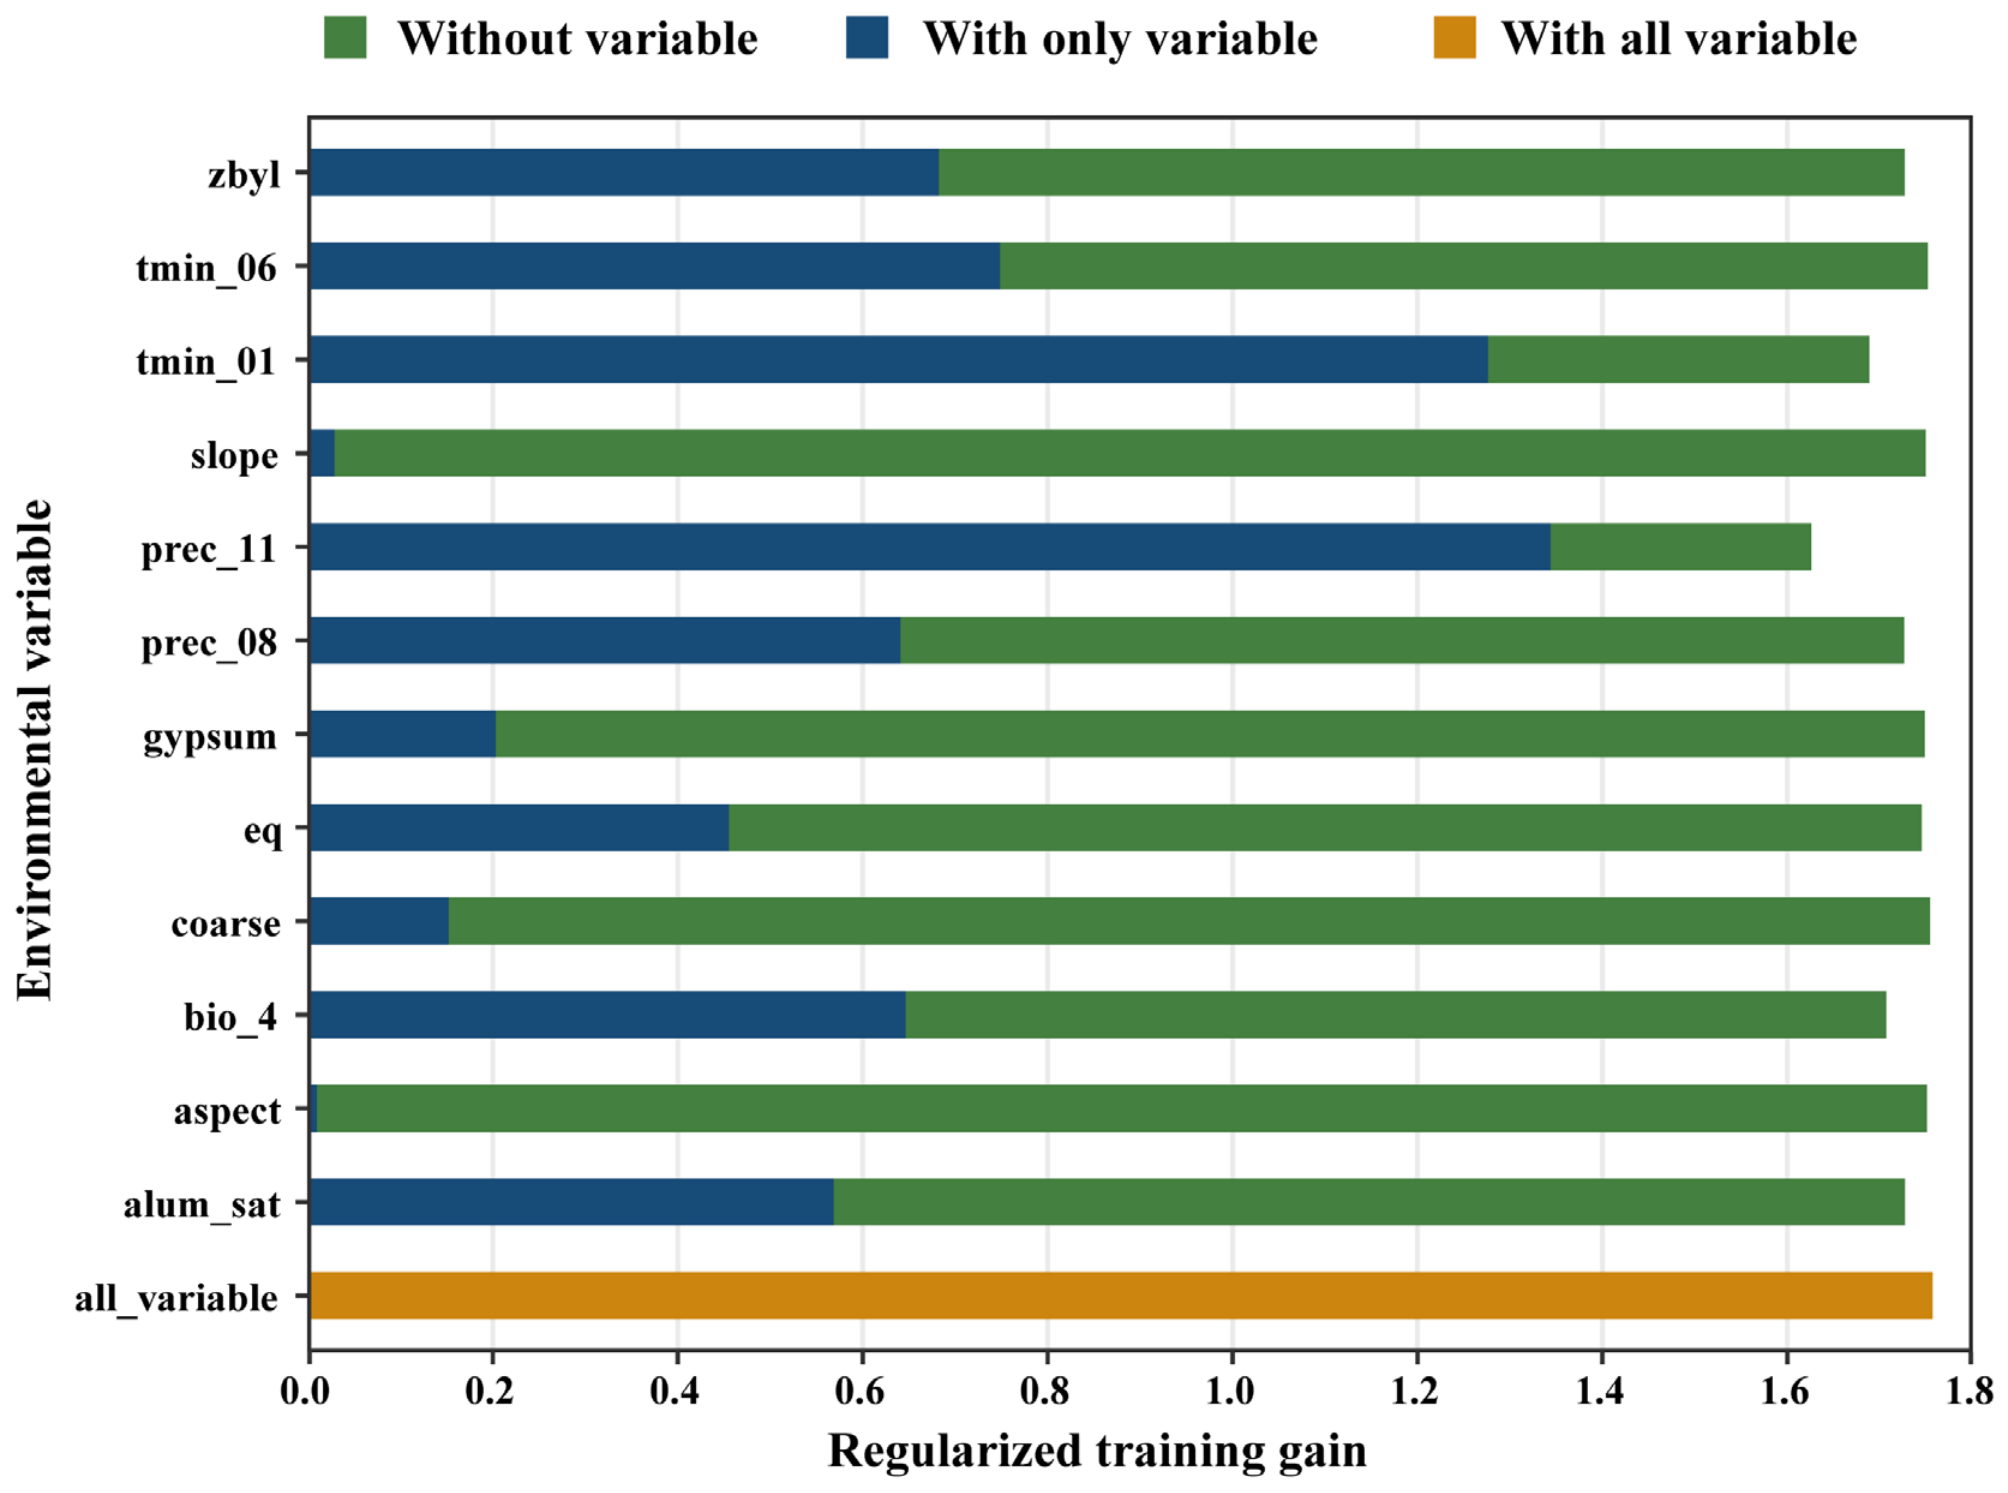
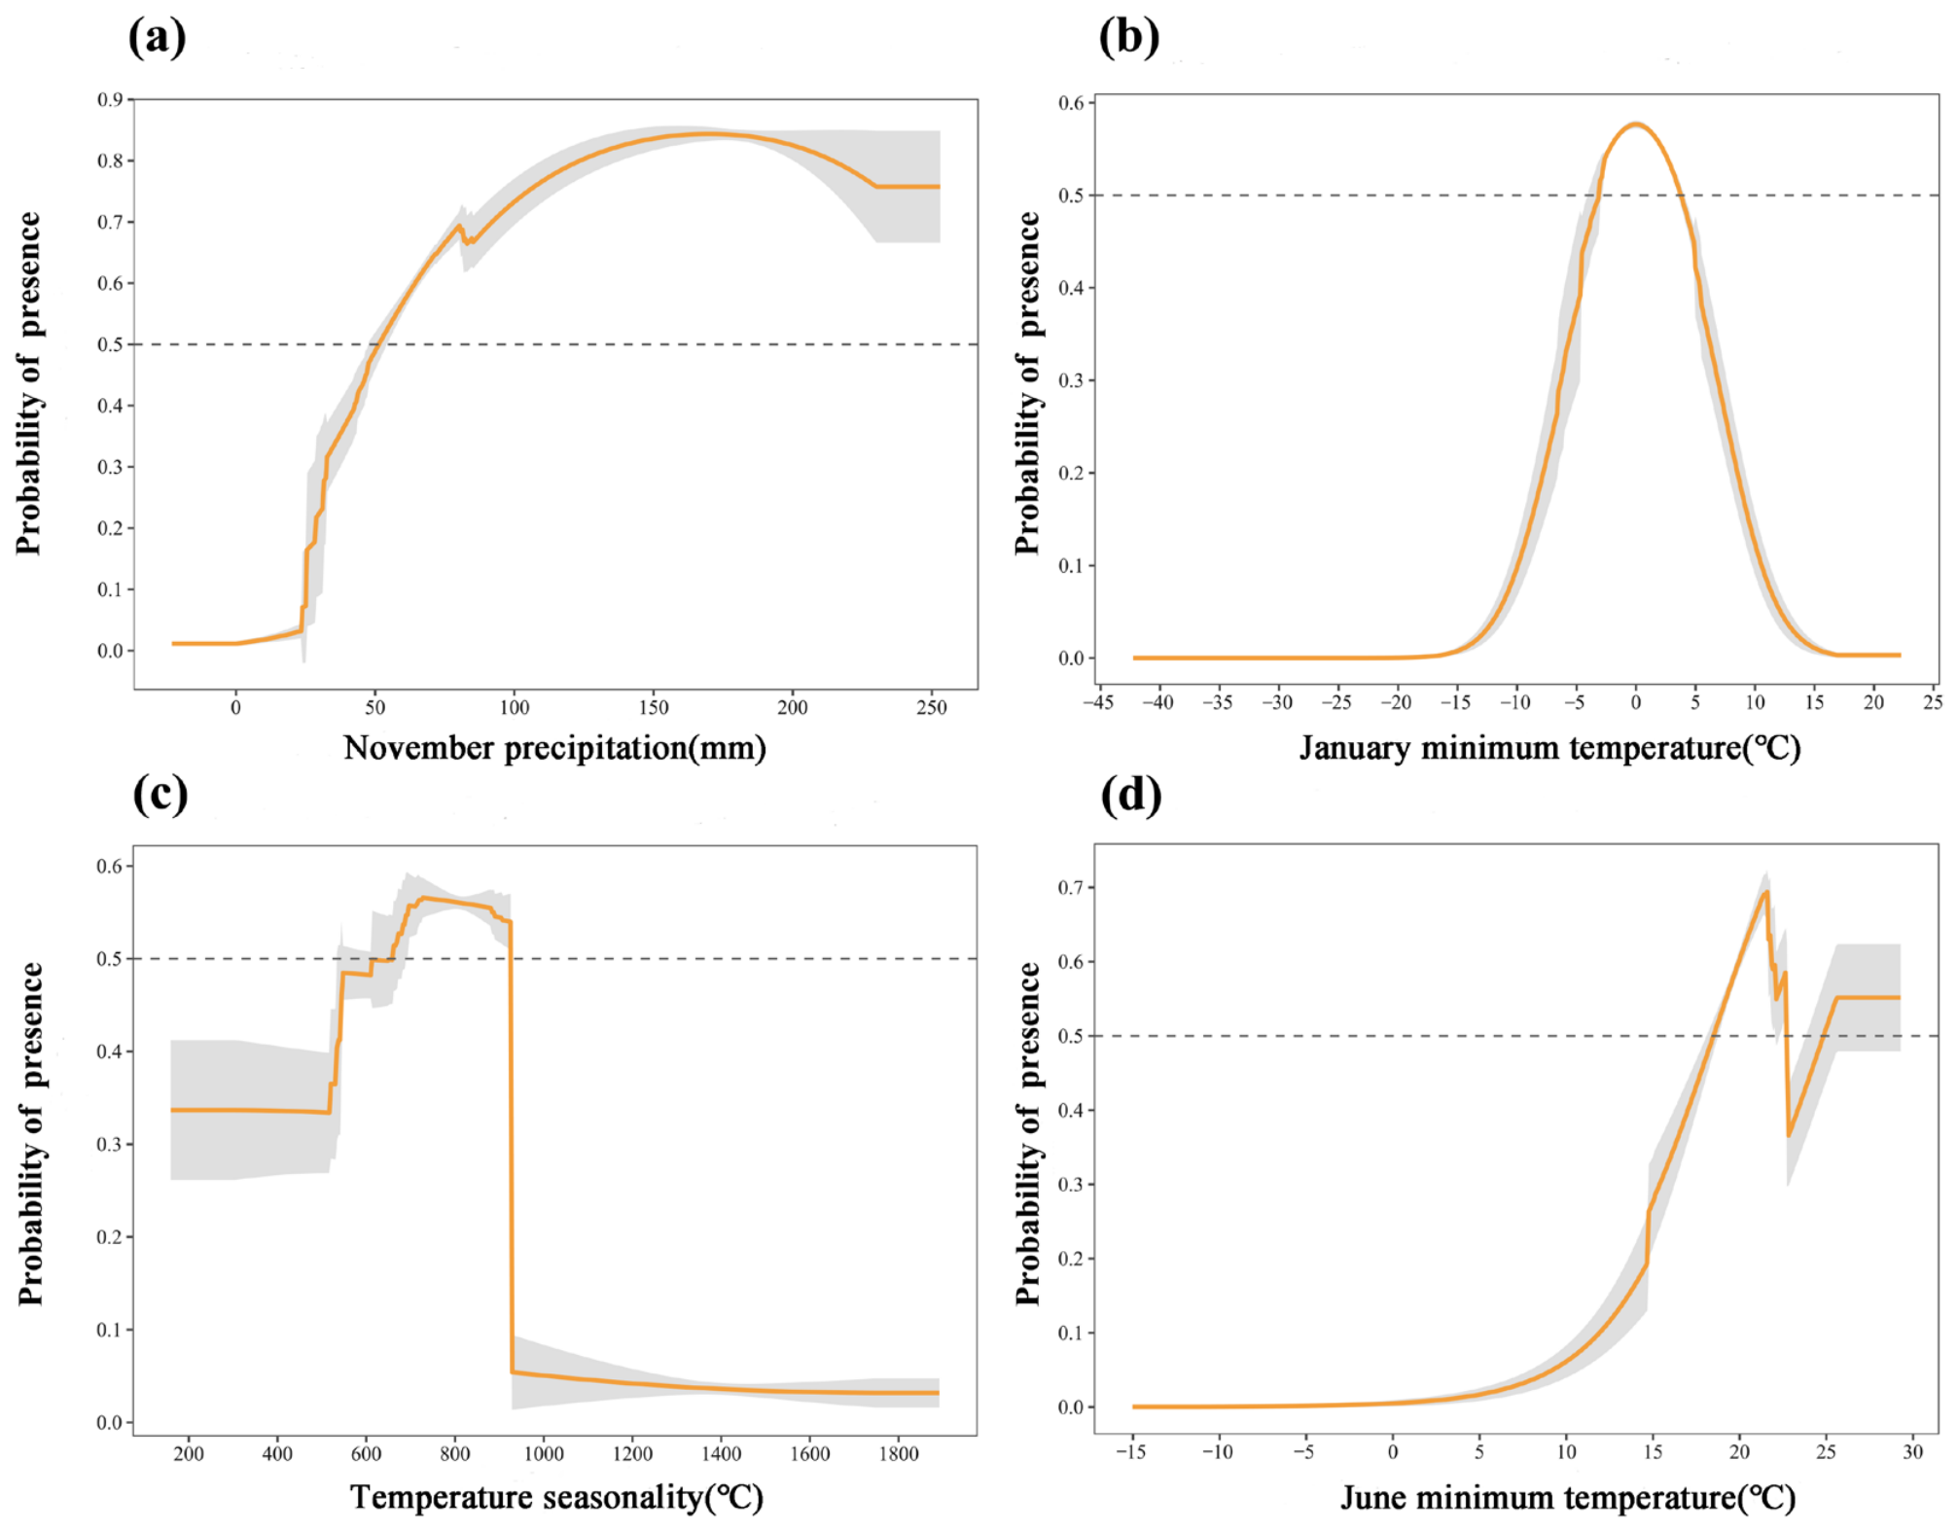
Based on contribution rates, November precipitation (prec11) and January minimum temperature (tmin1) emerged as the primary drivers for model construction, together accounting for 83.5% of the total contribution. November precipitation was the dominant factor, with a contribution rate of 66.0%. Other variables with lower contributions were temperature seasonality (bio4, 6.1%), vegetation classification (zbyl, 2.8%), aluminum saturation (alum_sat, 2.3%), minimum temperature in June (tmin6, 1.3%), calcium carbonate (eq, 1.1%), slope (slp, 1.0%), August precipitation (prec8, 0.9%), aspect (asp, 0.5%), gypsum content (gypsum, 0.3%), and coarse fragments (coarse, 0.2%). The Jackknife test showed that prec11, tmin1, bio4, and tmin6 yielded the highest regularized training gain values when used alone (Figure 3; Table 2). Therefore, November precipitation, January minimum temperature, temperature seasonality, and June minimum temperature were recognized as the primary determinants of E. nodiflorus distribution.
Optimal conditions for E. nodiflorus survival occurred when November precipitation ranged from 51.52 mm to 253.00 mm, January minimum temperature ranged from −3.09 °C to 3.76 °C, temperature seasonality ranged from 660.24 to 925.18, and June minimum temperature ranged from 18.52 °C to 22.69 °C or from 24.86 °C to 26.19 °C (Figure 4).

3.3. Present Areas of E. nodiflorus

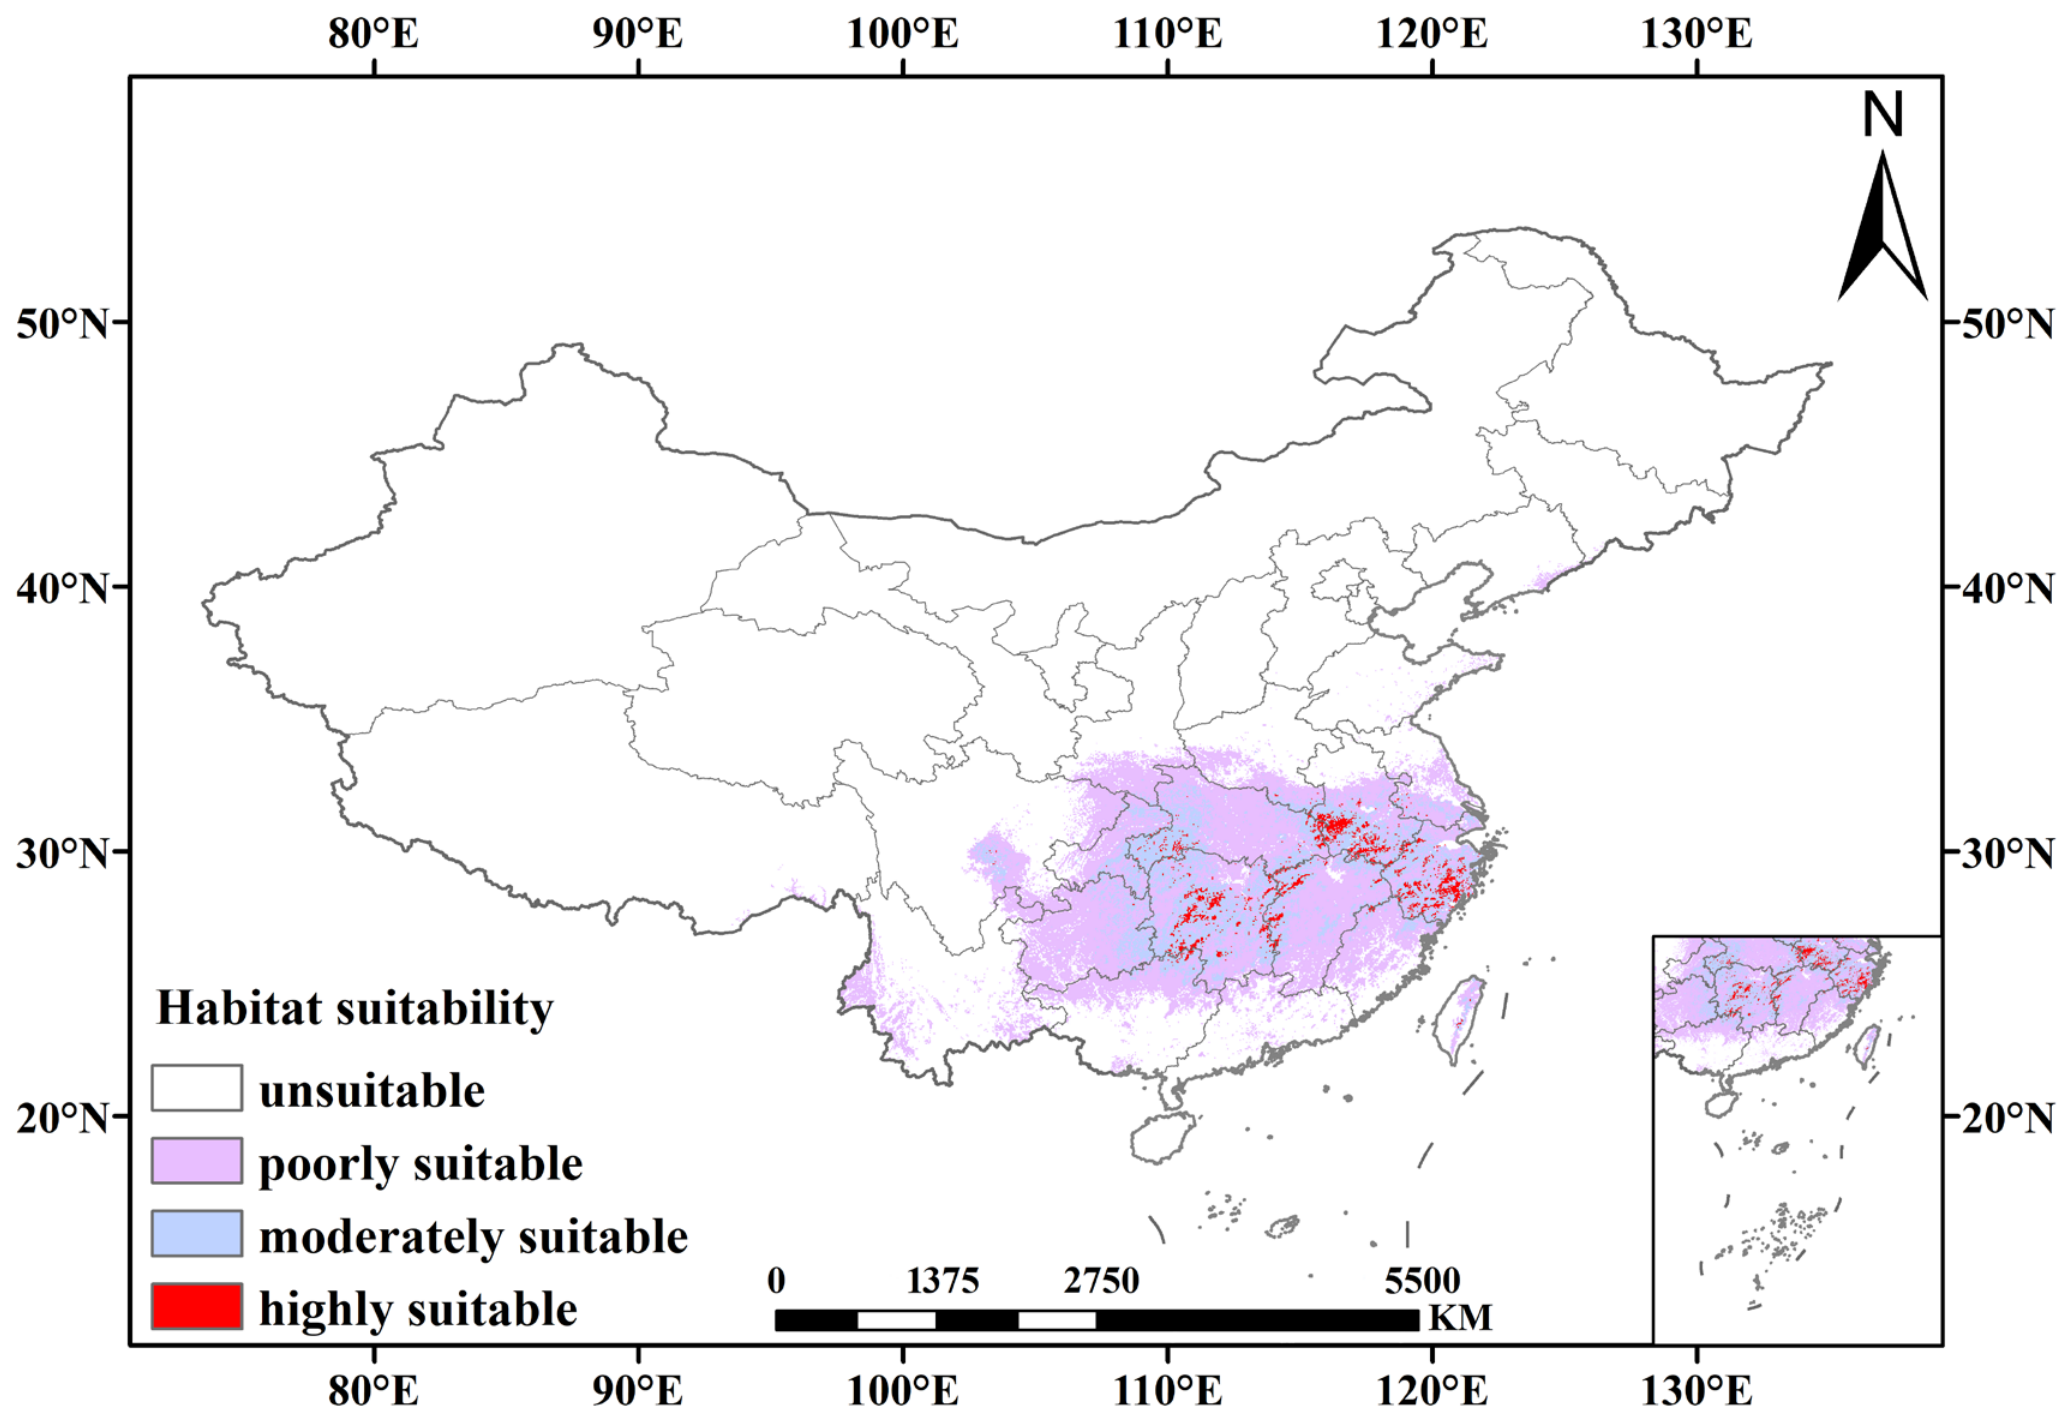
Under the contemporary climate conditions, the entire potentially suitable habitat for E. nodiflorus across China (encompassing poor, moderate, and high suitability areas) covers approximately 1.38 × 10⁶ km2, representing approximately 14.36% of the nation’s total land area. The habitat is predominantly located in central, eastern, and southern China. High-suitability areas are predominantly located in southeastern China, specifically southern Anhui, eastern Zhejiang, Jiangxi, Hunan, and Hubei. It covers roughly 5.26 × 10⁴ km2, representing about 0.55% of China’s total area. The moderate-suitability habitat surrounds the high-suitability areas, covering provinces including Anhui, Jiangsu, Hubei, Guizhou, and Guangdong. Its area is approximately 34.99 × 10⁴ km2, covering around 3.64% of China’s entire area. The poor-suitability habitat covers provinces including Henan, Shandong, Sichuan, Chongqing, and Shanxi, with a total area of approximately 97.98 × 10⁴ km2, constituting around 10.18% of China’s total land area (Figure 5).

3.4. Suitable Distribution of E. nodiflorus for Future Climates

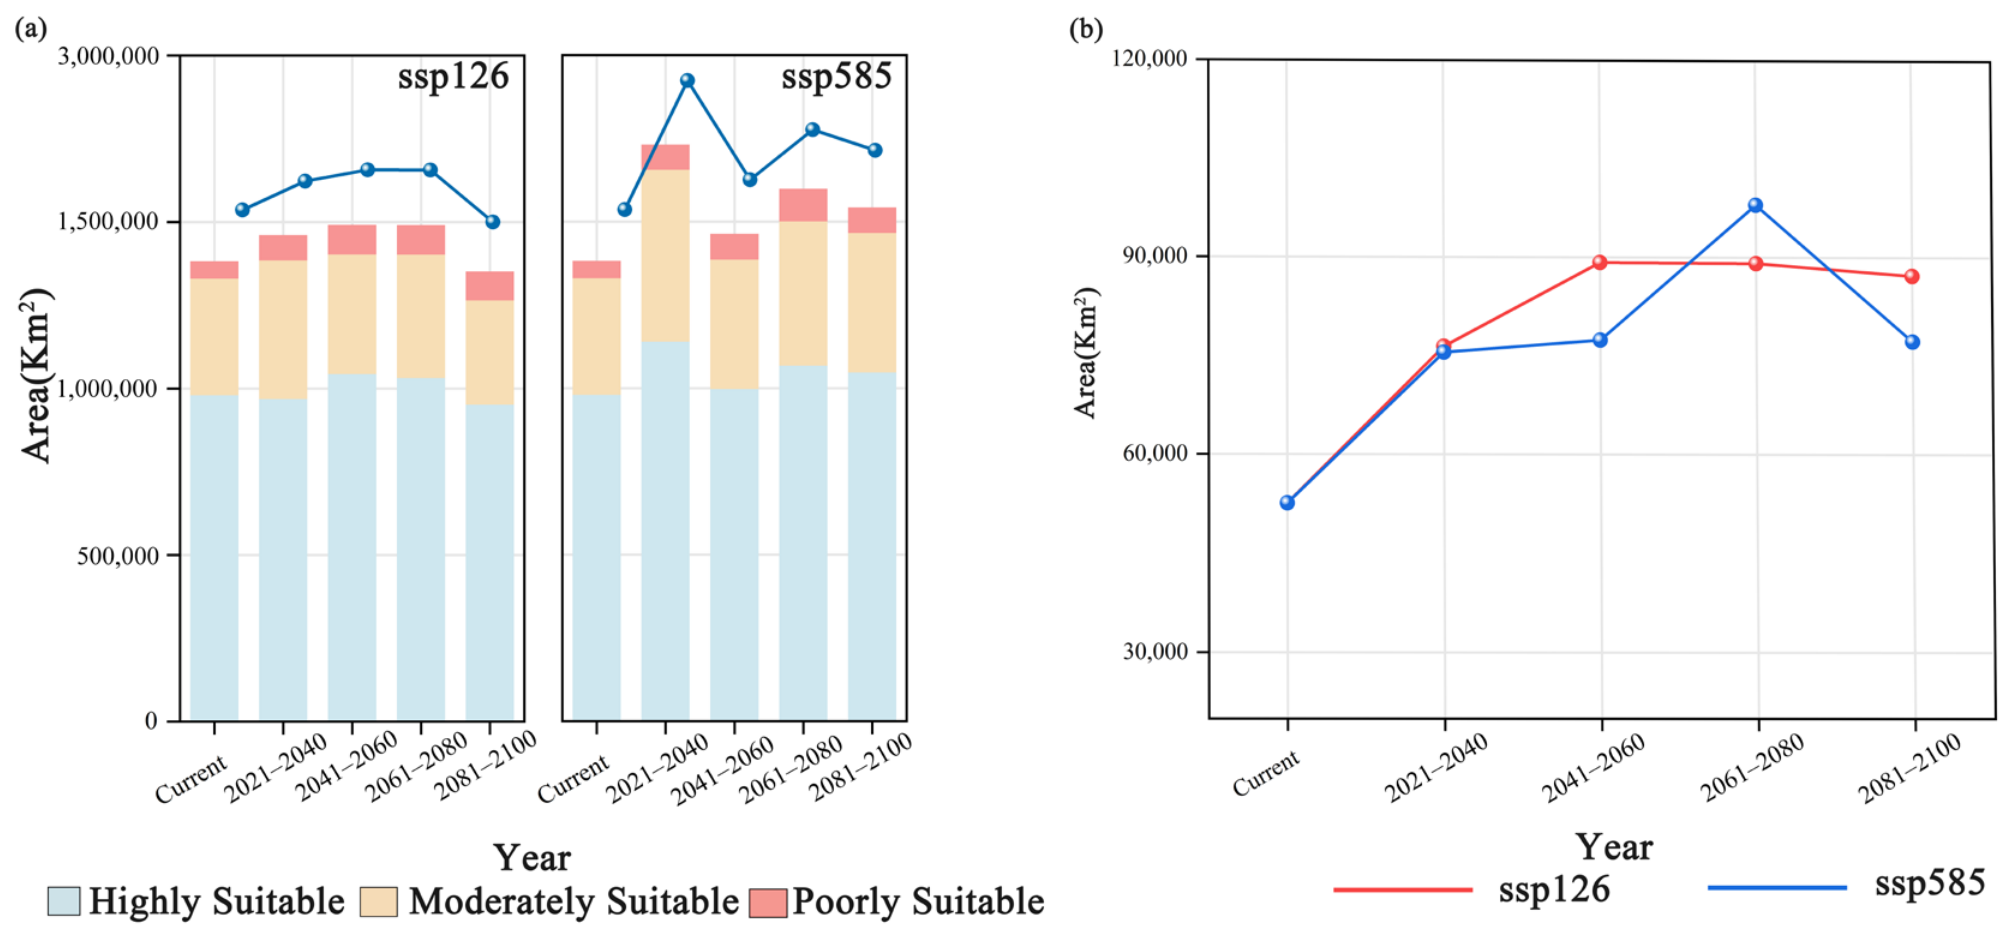
Under SSP1-2.6, total suitable habitat area for E. nodiflorus showed a sustained growth trend. The high-suitability habitat exhibited the most pronounced expansion, with a cumulative increase reaching 3.65 × 10⁴ km2 by the 2061–2080 period. In contrast, medium-suitability and low-suitability habitats displayed significant instability, with their areas gradually contracting over time following a period of initial short-term expansion. The expansion of suitable habitat became even more pronounced under the high-emission SSP5-8.5 scenario. Projections indicate that the total suitable habitat area will peak at 1.73 × 10⁶ km2 during the 2021–2040 period—representing a 25.2% increase (34.87 × 10⁴ km2) compared to current conditions. Notably, high-suitability habitat shows the most dramatic expansion under this pathway, reaching 4.54 × 10⁴ km2 by the 2061–2080 period with a 38.6% increase (Figure 6; Figure S1). Linear regression analysis was used to test whether suitable habitat area changed significantly over time. Under SSP1-2.6, the total suitable habitat area showed no significant temporal trend (R2= 0.006, p = 0.893). Under SSP5-8.5, the trend was also not significant (R2 = 0.050, p = 0.719). For highly suitable habitat area (Figure 6b), an increasing trend under SSP1-2.6 approached statistical significance (R2 = 0.497, p = 0.083), while under SSP5-8.5 the trend was not significant (R2 = 0.687, p = 0.184).

3.5. Future Redistribution of Suitable Areas for E. nodiflorus

For SSP1-2.6, expansion areas increased continuously from 5.06 × 10⁴ km2 in the 2021–2040 period to 11.67 × 10⁴ km2 by the 2061–2080 period, representing a net gain of 6.61 × 10⁴ km2, and the no change areas consistently ranged between 1.30 × 10⁶ km2 and 1.37 × 10⁶ km2 across all periods. The contraction areas decreased from 12.98 × 10⁴ km2 in the 2021–2040 period to 8.72 × 10⁴ km2 by the 2061–2080 period but would show a significant rebound during the 2081–2100 period. Spatially, expansion was concentrated in higher-latitude regions, with major gains occurring in the northern North China (the mountainous areas of Hebei and Shanxi), Northeast China (Heilongjiang, Jilin), and Southwest China (Yunnan, western Sichuan). The contraction primarily occurred in East, Central, and South China, notably within the Yangtze River Delta (Shanghai, Nanjing, Hangzhou), the Pearl River Delta (Guangzhou, Shenzhen), and coastal areas of Fujian Province (Figure S2).
For the high-emission pathway SSP5-8.5, expansion regions exhibited the most pronounced changes, showing an initial decline followed by stabilization. The expansion areas plummeted from 28.34 × 10⁴ km2 during the 2021–2040 period to 7.43 × 10⁴ km2 by the 2041–2060 period, then rebounded slightly and stabilized between 14.00 × 10⁴ km2 and 16.22 × 10⁴ km2. The stable areas showed minor fluctuations, consistently ranging from 1.39 × 10⁶ km2 to 1.45 × 10⁶ km2. The coastal southeast China emerged as the primary contraction zone, with habitat loss peaking at 7.10 × 10⁴ km2 during the 2041–2060 period before gradually decreasing. Overall, the total suitable habitat displayed a northwestward and higher-latitude shift.

3.6. Future Centroid Movement of Suitable Habitats

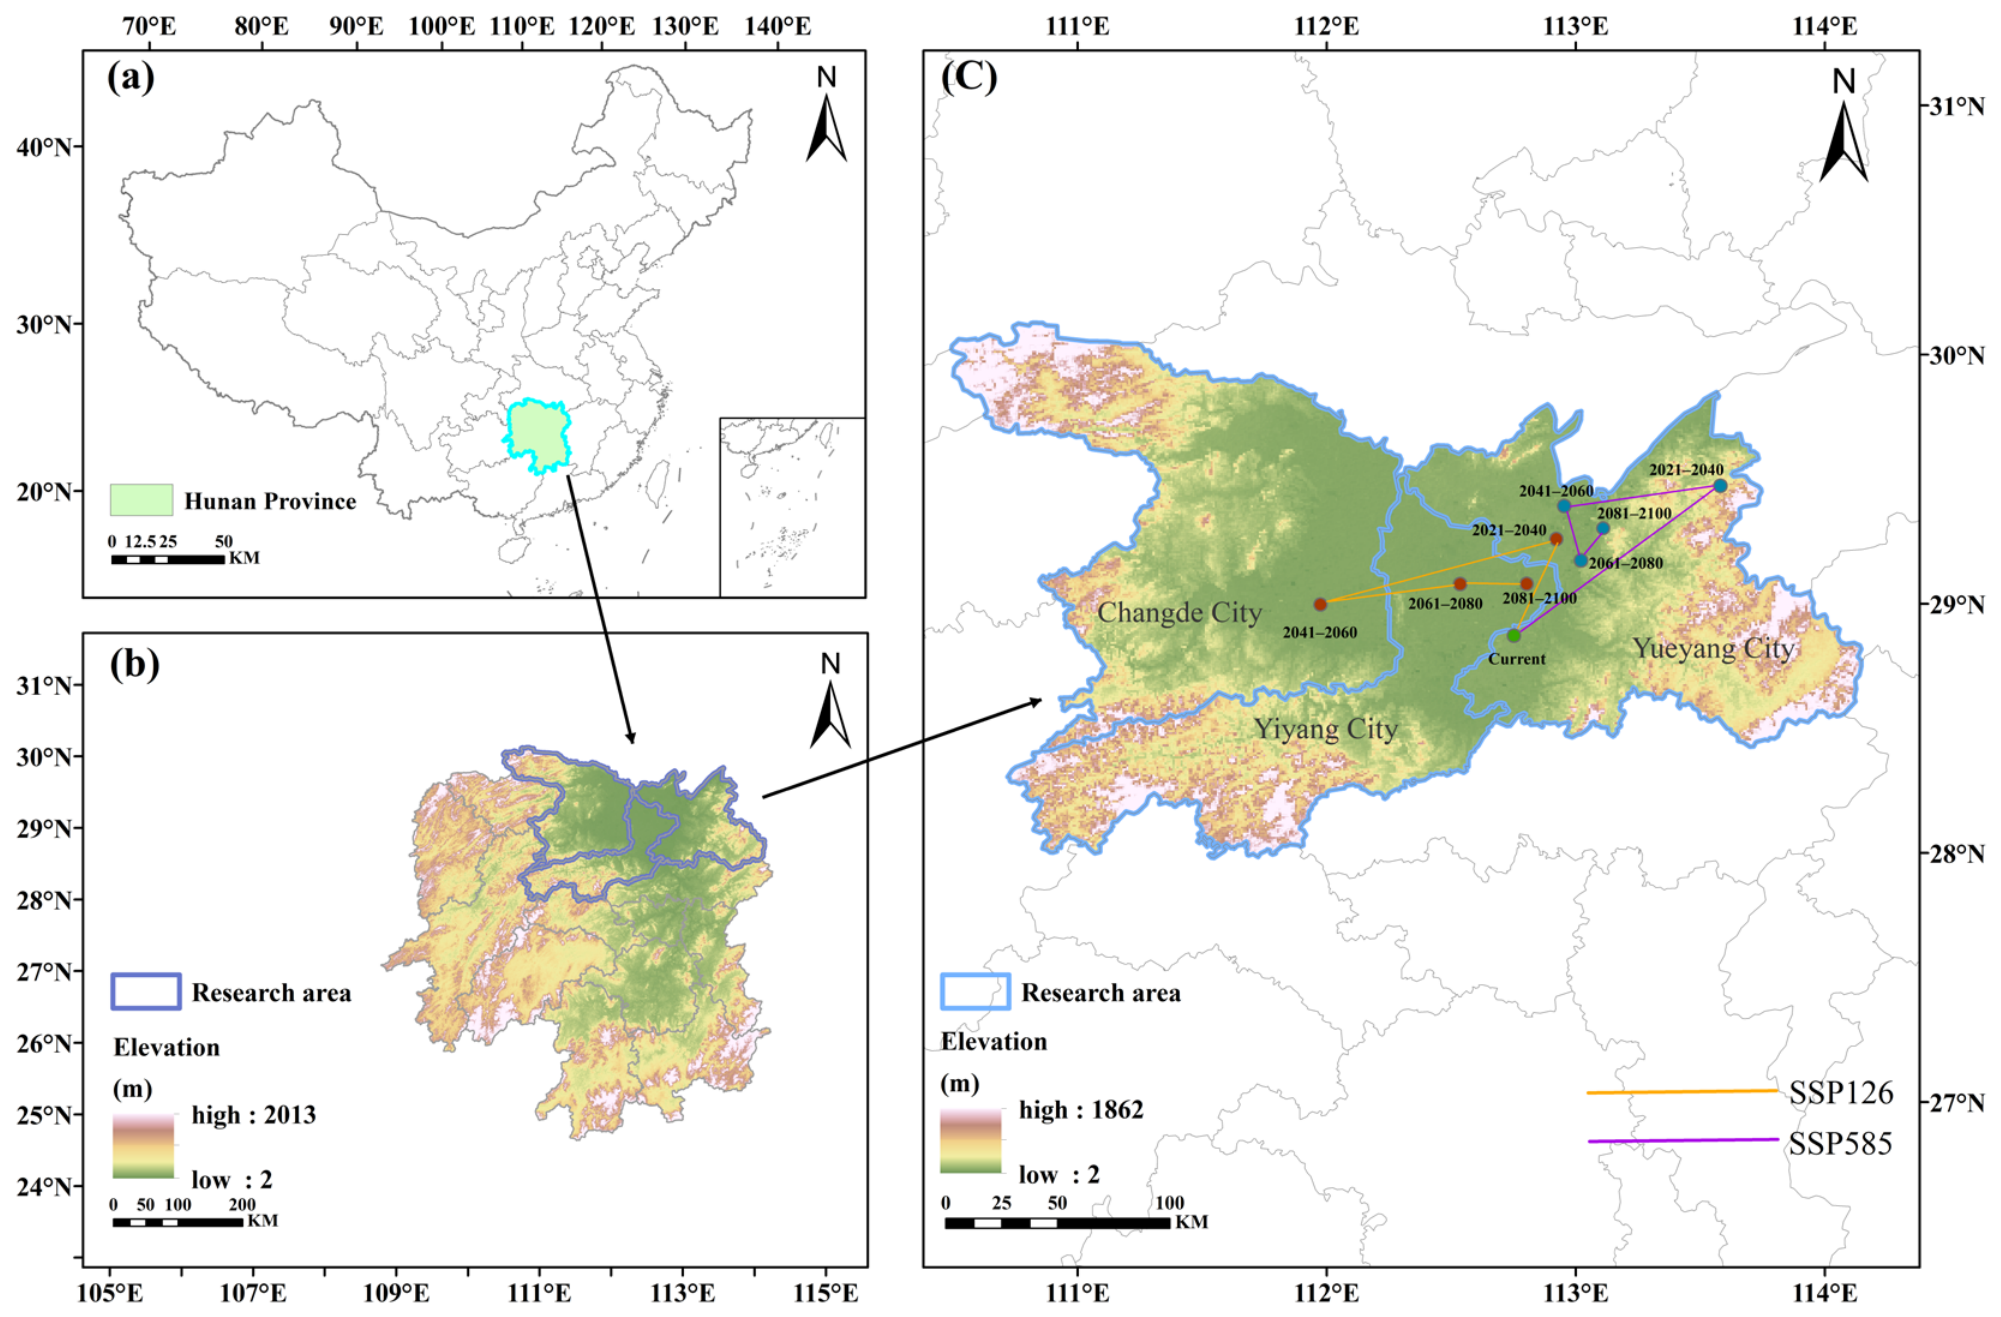
Under present-day climate conditions, the suitable habitat centroid of E. nodiflorus lies in Xiangyin County (112.9091° E, 28.6901° N), Yueyang, Hunan, China. For SSP1-2.6 and SSP5-8.5, the centroid shows a general northeastward shift over time, with notable southwestward fluctuations during the 2041–2060 period under SSP1-2.6 (Figure 7).

4. Discussion

4.1. Model Performance

This study integrated MaxEnt with ArcGIS to project suitable habitat distributions for E. nodiflorus. MaxEnt is widely adopted in species distribution modeling due to its high predictive accuracy, minimal sample dependency, and operational stability [49]. To enhance prediction accuracy, we implemented three key optimizations. Firstly, distribution records of E. nodiflorus were spatially filtered using ENMTools to reduce sampling bias by eliminating points with high spatial autocorrelation. Secondly, 91 environmental variables comprising climate, soil, terrain, and human activity data were evaluated to comprehensively predict suitable habitat. We removed variables exhibiting absolute pairwise correlations > 0.8 to prevent multicollinearity-induced overfitting. Finally, feature combinations and regularization parameters were optimized using the Kuenm package, effectively mitigating overfitting while improving the predictive accuracy and dependability from the MaxEnt model. The optimized model reached an AUC of 0.952, proving highly reliable predictions. Furthermore, the MTSPS method used here offers a fuller evaluation of suitable habitat for E. nodiflorus, integrating both model accuracy and environmental dynamics. In contrast, the natural breaks classification method relies solely on algorithmic calculations lacking flexibility. Thus, the MTSPS approach demonstrates broader applicability.

4.2. The Influence of Key Environmental Variables on the Distribution of E. nodiflorus

Research has demonstrated that precipitation and temperature are two major climatic drivers shaping species distribution and forest ecosystem characteristics [50,51]. The results indicate that November precipitation and January minimum temperature are the most important environmental variables shaping the geographic distribution of E. nodiflorus, while temperature seasonality and June minimum temperature also constitute critical determinants of its distribution patterns. Model analysis indicates that within a specific range, the growth probability of E. nodiflorus exhibits a positive correlation with precipitation. Optimal growth occurs when November precipitation exceeds 51.52 mm. For January minimum temperatures, the species shows peak suitability within the range of −3.09 to 3.76 °C, reaching its maximum growth probability at 3.31 °C followed by a declining trend. These results indicate that precipitation mainly affects the growth and distribution of E. nodiflorus, whereas temperature constrains its range limits. Furthermore, model projections indicate optimal survival conditions for E. nodiflorus occur within specific thermal ranges: temperature seasonality between 660.24 to 925.18, and June minimum temperatures of 18.52–22.69 °C or 24.86–29.29 °C. This indicates that climate factors exert a specific effect on plant distribution. Although soil and terrain variables were included in the model, their combined contribution was relatively minor, further underscoring the importance of water availability to the growth of E. nodiflorus.

4.3. Climate-Driven Responses in the Distribution of E. nodiflorus

Global Climate change is modifying temperature and precipitation patterns, necessitating species migration to novel habitats in response to degradation of original habitats [52]. Research indicates that numerous species will shift toward higher latitudes or elevations to adapt to climatic shifts [53]. To elucidate the response mechanisms of montane species, this study focuses on E. nodiflorus, simulating future habitat dynamics within its suitable ranges under projected scenarios.
Under current climatic conditions, E. nodiflorus is predominantly distributed across Hunan, Zhejiang, Anhui, Jiangxi and Hubei provinces. Model projections reveal the species’ high sensitivity to variations in moisture and temperature. Against the backdrop of future warming and elevated greenhouse gas concentrations, its range is projected to shift toward coastal zones. This coastal redistribution likely correlates with higher precipitation levels in littoral regions. Analysis of future habitat suitability suggests expansion potential in southwestern China, a phenomenon potentially resulting from the region’s topographic complexity at higher elevations.
For the SSP1-2.6 scenario, the potentially suitable habitat area demonstrates significant expansion by the 2061–2080 period, followed by an abrupt contraction in the 2081–2100 period, primarily concentrated in Yunnan Province. This pattern reveals that climate change impacts on species’ suitable habitats manifest not as simple linear reductions but through dynamic nonlinear trajectories. Conversely, under the SSP5-8.5 pathway, continuous decline in suitable habitat area occurs, with pronounced contractions focused in the contiguous region spanning Guangxi, Guangdong, and Fujian provinces. Nevertheless, across all scenarios, highly suitable habitats persist in southwestern Hubei and Hunan, as well as southern Anhui and eastern Zhejiang provinces. Geographic areas maintaining relatively stable habitats with low climate vulnerability supply ideal natural habitats for species to survive and reproduce. Consequently, spatial overlap of suitable distributions between present and future climates qualifies as priority refugia [54]. Based on these findings, southwestern Hubei–Hunan and southern Anhui–eastern Zhejiang are projected to function as critical climate refugia. Furthermore, under SSP1-2.6 conditions, the centroid movement path follows a northeast → southwest → southeast → northeast pathway. Conversely, under SSP5-8.5, the centroid traverses a northeast → southwest → northeast → southeast route. Both pathways ultimately converge in eastern Hunan Province, confirming its capacity to function as a persistent climate refugia.

4.4. Conservation Strategies and Recommendations

Research on species geographic distributions holds critical significance for conservation planning [55]. This study shows that highly suitable habitats for E. nodiflorus will persist in Hunan (distribution centroid), Hubei, Zhejiang, and Anhui provinces, forming key climate refugia. These areas should be designated as interprovincial core reserves, with canopy management strategies implemented to maintain native habitat integrity. For climate-driven range expansion zones (e.g., Chongqing and Shanxi), integrated measures combining assisted migration and in situ restoration are imperative. In severely degraded Yunnan regions, priority should be given to establishing germplasm repositories with cryopreservation to rescue endemic genetic diversity. By enhancing germplasm conservation efficacy and ecological rehabilitation efficiency, this framework synergistically strengthens ecosystem barrier functions while promoting sustainable utilization of medicinal resources.

4.5. Constraints and Future Directions

A few limitations of this study should be acknowledged. Species distribution model predictions rely heavily on the integrity of input occurrence data. The occurrence records used in this study were primarily obtained from public databases, including the National Specimen Information Infrastructure of China (NSII) and the Chinese Virtual Herbarium (CVH). These data inherently suffer from data bias, as collection records are clustered in areas accessible to humans (e.g., along roads, near towns, and within nature reserves), while the species may occur in remote or inaccessible regions without being documented. Such sampling bias may bias habitat suitability predictions upward or downward in certain areas. Although this limitation cannot be fully resolved given the current data availability, future studies should integrate systematic field surveys to supplement distribution records from undersampled regions, thereby improving the reliability of model predictions.

5. Conclusions

Results indicate that November precipitation and January minimum temperatures constitute critical constraining factors determining the growth performance and distribution patterns of E. nodiflorus. The potential habitats of E. nodiflorus are predominantly distributed across central, eastern, and southern China. Under projected climate scenarios, the total suitable habitat shows a decreasing trend, while the area of high-suitability zones shows consistent expansion. Significantly, the southwestern Hubei–Hunan border region and the southern Anhui–eastern Zhejiang zone are identified as pivotal climatic refugia, sustaining consistently high habitat suitability throughout all time periods. This study reveals how subtropical forest plants respond to climate change and the formation mechanism of refugia, offering a theoretical foundation for the maintenance of biodiversity of sympatric species and the planning of priority conservation areas.

Supplementary Materials

The following supporting information can be downloaded at: https://www.mdpi.com/article/10.3390/f17070854/s1, Figure S1: Suitable habitat distribution of Eleutherococcus nodiflorus (E. nodiflorus) under different future climate scenarios (SSP1-2.6 and SSP5-8.5) across four future periods (2021–2040, 2041–2060, 2061–2080, 2081–2100) (a–h); Figure S2: Spatial pattern changes in the potential suitable habitats of E. nodiflorus under SSP1-2.6 and SSP5-8.5 across four future periods (2021–2040, 2041–2060, 2061–2080, 2081–2100) (a–h); Table S1: Detailed information on the 91 environmental variables.

Author Contributions

Conceptualization, project administration, methodology, data curation, and writing—original draft, Y.C.; software, validation, and data curation, T.P.; visualization, validation, and writing—review and editing, Q.Y. All authors have read and agreed to the published version of the manuscript.

Funding

This research was funded by the Team Project of Anhui Provincial University Research Plan (2022AH010036); the Industry-Academia-Research Collaboration Project of Anhui University of Chinese Medicine (2022HZ05); and the National Training Program for Inheritance Talents in Characteristic Chinese Medicine Techniques (GZYRJH [2023]96).

Data Availability Statement

The original contributions presented in this study are included in the article/Supplementary Material. Further inquiries can be directed to the corresponding author.

Acknowledgments

During the preparation of this work the authors used ChatGPT (GPT-5.4) in order to improve language. After using this tool, the authors reviewed and edited the content as needed and take full responsibility for the content of the publication.

Conflicts of Interest

The authors declare that the research was conducted in the absence of any commercial or financial relationships that could be construed as a potential conflict of interest.

References

  1. Yang, J.; Huang, Y.; Jiang, X.; Chen, H.; Liu, M.; Wang, R. Potential geographical distribution of the endangred plant Isoetes under human activities using MaxEnt and GARP. Glob. Ecol. Conserv. 2022, 38, e02186. [Google Scholar] [CrossRef]
  2. Liu, X.J.; Ferreira-Rodríguez, N.; Wu, R.W.; Ouyang, S.; Wu, X.P. Sixty years of species diversity and population density decline of freshwater mussels in a global biodiversity hotspot. Glob. Ecol. Conserv. 2023, 46, e02573. [Google Scholar] [CrossRef]
  3. Michelozzi, P.; De’ Donato, F. IPCC Sixth Assessment Report: Stopping climate change to save our planet. Epidemiol. Prev. 2021, 45, 227–229. [Google Scholar] [CrossRef] [PubMed]
  4. Atwoli, L.; Baqui, A.H.; Benfield, T.; Bosurgi, R.; Godlee, F.; Hancocks, S.; Horton, R.; Laybourn-Langton, L.; Monteiro, C.A.; Norman, I.; et al. #HealthyClimate: Call for Emergency Action to Limit Global Temperature Increases, Restore Biodiversity, and Protect Health. JMIR Public Health Surveill. 2021, 7, e32958. [Google Scholar] [CrossRef] [PubMed]
  5. Oke, T.A.; Stralberg, D.; Reid, D.G.; Bennett, B.A.; Cannings, S.; Willier, C.; Fulkerson, J.R.; Cooke, H.A.; Mantyka-Pringle, C.S. Warming drives poleward range contractions of Beringian endemic plant species at high latitudes. Divers. Distrib. 2023, 29, 509–523. [Google Scholar] [CrossRef]
  6. Wiens, J.J. Climate-Related Local Extinctions Are Already Widespread among Plant and Animal Species. PLoS Biol. 2016, 14, e2001104. [Google Scholar] [CrossRef] [PubMed]
  7. Wei, B.; Wang, R.; Hou, K.; Wang, X.; Wu, W. Predicting the current and future cultivation regions of Carthamus tinctorius L. using MaxEnt model under climate change in China. Glob. Ecol. Conserv. 2018, 16, e00477. [Google Scholar] [CrossRef]
  8. Yang, Z.; Ren, Z.D.; Wang, J.; Dong, W. Based on the MaxEnt model the analysis of influencing factors and simulation of potential risk areas of human infection with avian influenza A (H7N9) in China. Front. Cell. Infect. Microbiol. 2025, 14, 1496991. [Google Scholar] [CrossRef] [PubMed]
  9. Adineh, F.; Motamedvaziri, B.; Ahmadi, H.; Moeini, A. Landslide susceptibility mapping using Genetic Algorithm for the Rule Set Production (GARP) model. J. Mt. Sci. 2018, 15, 2013–2026. [Google Scholar] [CrossRef]
  10. Carpenter, G.; Gillison, A.N.; Winter, J. DOMAIN: A flexible modelling procedure for mapping potential distributions of plants and animals. Biodivers. Conserv. 1993, 2, 667–680. [Google Scholar] [CrossRef]
  11. Gaynor, M.L.; Fu, C.N.; Gao, L.M.; Lu, L.M.; Soltis, D.E.; Soltis, P.S. Biogeography and ecological niche evolution in Diapensiaceae inferred from phylogenetic analysis. J. Syst. Evol. 2020, 58, 646–662. [Google Scholar] [CrossRef]
  12. Li, Y.L.; Ding, C.Q. Effects of sample size, sample accuracy and environmental variables on predictive performance of MaxEnt model. Pol. J. Ecol. 2016, 64, 303–312. [Google Scholar] [CrossRef]
  13. Li, Z.J.; Liu, Y.M.; Zeng, H. Application of the MaxEnt model in improving the accuracy of ecological red line identification: A case study of Zhanjiang, China. Ecol. Indic. 2022, 137, 108767. [Google Scholar] [CrossRef]
  14. Cobben, M.M.P.; van Treuren, R.; Castañeda-Alvarez, N.P.; Khoury, C.K.; Kik, C.; van Hintum, T.J.L. Robustness and accuracy of Maxent niche modelling for Lactuca species distributions in light of collecting expeditions. Ecol. Indic. 2015, 13, 153–161. [Google Scholar] [CrossRef]
  15. Zhao, Z.X.; Feng, X.L.; Wang, Y.J.; Zhou, Z.X.; Zhang, Y.B. Potential suitability areas of Sitobion miscanthi in China based on the MaxEnt model: Implications for management. Crop Prot. 2024, 183, 106755. [Google Scholar] [CrossRef]
  16. Xie, M.; Song, X.B.; Zhang, X.X.; Ma, Y.P.; Song, Z.L.; Li, F.J.; Li, W.; Fan, L.Y.; Ma, H. Suitability mapping of native tree species in dry-hot valleys of Yunnan based on InVEST-MaxEnt coupled modeling: Model validation framework with native tree species actual distribution and seed germination. Front. Plant Sci. 2025, 16, 1577623. [Google Scholar] [CrossRef] [PubMed]
  17. Ciss, M.; Biteye, B.; Fall, A.G.; Fall, M.; Gahn, M.C.B.; Leroux, L.; Apolloni, A. Ecological niche modelling to estimate the distribution of Culicoides, potential vectors of bluetongue virus in Senegal. BMC Ecol. 2019, 19, 45. [Google Scholar] [CrossRef] [PubMed]
  18. Kass, J.M.; Muscarella, R.; Galante, P.J.; Bohl, C.L.; Pinilla-Buitrago, G.E.; Boria, R.A.; Soley-Guardia, M.; Anderson, R.P. ENMeval 2.0: Redesigned for customizable and reproducible modeling of species’ niches and distributions. Methods Ecol. Evol. 2021, 12, 1602–1608. [Google Scholar] [CrossRef]
  19. Cobos, M.E.; Peterson, A.T.; Barve, N.; Osorio-Olvera, L. kuenm: An R package for detailed development of ecological niche models using Maxent. Peer J. 2019, 7, e6281. [Google Scholar] [CrossRef] [PubMed]
  20. Li, X.; Tang, S.; Luo, J.; Zhang, X.; Yook, C.; Huang, H.; Liu, X. Botany, traditional usages, phytochemistry, pharmaceutical analysis, and pharmacology of Eleutherococcus nodiflorus (Dunn) S.Y.Hu: A systematic review. J. Ethnopharmacol. 2023, 306, 116152. [Google Scholar] [CrossRef] [PubMed]
  21. Zhang, W.; Zhang, S. Herbal Textual Research on Acanthopanacis cortex in Famous Classical Formulas. Chin. J. Exp. Tradit. Med. Formulae 2023, 29, 26–37. [Google Scholar] [CrossRef]
  22. Yang, H.D.; Yang, Y.G.; Tang, Z.S.; Ma, K.; Xu, H.B. Identification of lignans as selective cyclooxygenase-2 inhibitors from the extract of Acanthopanacis cortex. Phytochemistry 2024, 226, 114208. [Google Scholar] [CrossRef] [PubMed]
  23. Lu, M.X.; Yang, Y.; Zou, Q.P.; Luo, J.; Zhang, B.B.; Liu, X.Q.; Hwang, E.-H. Anti-Diabetic Effects of Acankoreagenin from the Leaves of Acanthopanax gracilistylus Herb in RIN-m5F Cells via Suppression of NF-κB Activation. Molecules 2018, 23, 958. [Google Scholar] [CrossRef] [PubMed]
  24. Shen, L.; Li, X.W.; Meng, X.X.; Wu, J.; Tang, H.; Huang, L.F.; Xiao, S.M.; Xu, J.; Chen, S.L. Prediction of the globally ecological suitability of Panax quinquefolius by the geographic information system for global medicinal plants (GMPGIS). Chin. J. Nat. Med. 2019, 17, 481–489. [Google Scholar] [CrossRef] [PubMed]
  25. Ji, W.; Gao, G.; Wei, J. Potential Global Distribution of Daktulosphaira vitifoliae under Climate Change Based on MaxEnt. Insects 2021, 12, 347. [Google Scholar] [CrossRef] [PubMed]
  26. China Virtual Herbarium (CVH). Available online: https://www.cvh.ac.cn/ (accessed on 17 November 2025).
  27. National Specimen Information Infrastructure of China (NSII). Available online: http://www.nsii.org.cn/ (accessed on 26 December 2025).
  28. Google Maps. Available online: http://ditu.google.cn/ (accessed on 26 December 2025).
  29. Warren, D.L.; Matzke, N.J.; Cardillo, M.; Baumgartner, J.B.; Beaumont, L.J.; Turelli, M.; Glor, R.E.; Huron, N.A.; Simões, M.; Iglesias, T.L.; et al. ENMTools 1.0: An R package for comparative ecological biogeography. Ecography 2021, 44, 504–511. [Google Scholar] [CrossRef]
  30. Liu, Y.-W.; Zhao, L.; Tan, G.-R.; Shen, X.-Y.; Nie, S.-P.; Li, Q.-Q.; Zhang, L. Evaluation of multidimensional simulations of summer air temperature in China from CMIP5 to CMIP6 by the BCC models: From trends to modes. Adv. Clim. Change Res. 2022, 13, 28–41. [Google Scholar] [CrossRef]
  31. Ministry of Natural Resources of China. Standard Map Service System. Available online: http://bzdt.ch.mnr.gov.cn/ (accessed on 14 January 2026).
  32. WorldClim. Available online: https://www.worldclim.org/ (accessed on 20 December 2025).
  33. Resource and Environmental Science Data Platform (RESDC). Available online: https://www.resdc.cn/ (accessed on 22 December 2025).
  34. Wan, J.Z.; Wang, C.J.; Yu, F.H. Effects of occurrence record number, environmental variable number, and spatial scales on MaxEnt distribution modelling for invasive plants. Biologia 2019, 74, 757–766. [Google Scholar] [CrossRef]
  35. Zhang, X.R.; Wang, H.W.; Dai, T.T. Predicting the Potential Geographic Distribution of Phytophthora cinnamomi in China Using a MaxEnt-Based Ecological Niche Model. Agriculture 2025, 15, 1411. [Google Scholar] [CrossRef]
  36. Muscarella, R.; Galante, P.J.; Soley-Guardia, M.; Boria, R.A.; Kass, J.M.; Uriarte, M.; Anderson, R.P.; McPherson, J. ENMeval: An R package for conducting spatially independent evaluations and estimating optimal model complexity for Maxent ecological niche models. Methods Ecol. Evol. 2014, 5, 1198–1205. [Google Scholar] [CrossRef]
  37. Yang, M.; Li, Z.; Liu, L.; Bo, A.; Zhang, C.; Li, M. Ecological niche modeling of Astragalus membranaceus var. mongholicus medicinal plants in Inner Mongolia, China. Sci. Rep. 2020, 10, 12482. [Google Scholar] [CrossRef] [PubMed]
  38. Liu, Y.; Shi, J. Predicting the Potential Global Geographical Distribution of Two Icerya Species under Climate Change. Forests 2020, 11, 684. [Google Scholar] [CrossRef]
  39. Wu, Y.M.; Shen, X.L.; Tong, L.; Lei, F.W.; Mu, X.Y.; Zhang, Z.X. Impact of Past and Future Climate Change on the Potential Distribution of an Endangered Montane Shrub Lonicera oblata and Its Conservation Implications. Forests 2021, 12, 125. [Google Scholar] [CrossRef]
  40. Duan, X.G.; Li, J.Q.; Wu, S.H. MaxEnt Modeling to Estimate the Impact of Climate Factors on Distribution of Pinus densiflora. Forests 2022, 13, 402. [Google Scholar] [CrossRef]
  41. Li, H.Q.; Liu, X.H.; Wang, J.H.; Xing, L.G.; Fu, Y.Y. Maxent modelling for predicting climate change effects on the potential planting area of tuber mustard in China. J. Agric. Sci. 2019, 157, 375–381. [Google Scholar] [CrossRef]
  42. Liu, C.; Berry, P.M.; Dawson, T.P.; Pearson, R.G. Selecting thresholds of occurrence in the prediction of species distributions. Ecography 2005, 28, 385–393. [Google Scholar] [CrossRef]
  43. Wang, X.; Jiang, Y.Y.; Wu, W.P.; He, X.Z.; Wang, Z.H.; Guan, Y.Y.; Xu, N.; Chen, Q.L.; Shen, Y.J.; Cao, J.P. Cryptosporidiosis threat under climate change in China: Prediction and validation of habitat suitability and outbreak risk for human-derived Cryptosporidium based on ecological niche models. Infect. Dis. Poverty 2023, 12, 35. [Google Scholar] [CrossRef] [PubMed]
  44. Thurtell, L.; Rajaratnam, R.; Thomas, P.; Ballard, G.; Bayne, P.; Vernes, K. Predictively modelling the distribution of the threatened brush-tailed rock-wallaby (Petrogale penicillata) in Oxley Wild Rivers National Park, north-eastern New South Wales, Australia. Wildl. Res. 2022, 49, 169–182. [Google Scholar] [CrossRef]
  45. Lenoir, J.; Gégout, J.-C.; Marquet, P.A.; de Ruffray, P.; Brisse, H. A significant upward shift in plant species optimum elevation during the 20th century. Science 2008, 320, 1768–1771. [Google Scholar] [CrossRef] [PubMed]
  46. Yuan, C.C.; Jiang, M. Migration and Land Exploitation from Yuan to Qing Dynasties: Insights from 252 Traditional Villages in Hunan, China. Sustainability 2023, 15, 1001. [Google Scholar] [CrossRef]
  47. Zhan, P.; Wang, F.Y.; Xia, P.G.; Zhao, G.H.; Wei, M.T.; Wei, F.G.; Han, R.L. Assessment of suitable cultivation region for Panax notoginseng under different climatic conditions using MaxEnt model and high-performance liquid chromatography in China. Ind. Crops Prod. 2022, 176, 114416. [Google Scholar] [CrossRef]
  48. Zhao, Z.Y.; Xiao, N.W.; Shen, M.; Li, J.S. Comparison between optimized MaxEnt and random forest modeling in predicting potential distribution: A case study with Quasipaa boulengeri in China. Sci. Total Environ. 2022, 842, 156867. [Google Scholar] [CrossRef] [PubMed]
  49. Bradie, J.; Leung, B. A quantitative synthesis of the importance of variables used in MaxEnt species distribution models. J. Biogeogr. 2017, 44, 1344–1361. [Google Scholar] [CrossRef]
  50. Ding, Y.; Shi, Y.; Yang, S. Molecular Regulation of Plant Responses to Environmental Temperatures. Mol. Plant 2020, 13, 544–564. [Google Scholar] [CrossRef] [PubMed]
  51. Zeppel, M.J.B.; Wilks, J.V.; Lewis, J.D. Impacts of extreme precipitation and seasonal changes in precipitation on plants. Biogeosciences 2014, 11, 3083–3093. [Google Scholar] [CrossRef]
  52. Mishra, A.K. Plant Adaptation to Global Climate Change. Atmosphere 2021, 12, 451. [Google Scholar] [CrossRef]
  53. Zhang, F.G.; Liang, F.R.; Wu, K.F.; Xie, L.Y.; Zhao, G.H.; Wang, Y.J. The potential habitat of Angelica dahurica in China under climate change scenario predicted by Maxent model. Front. Plant Sci. 2024, 15, 1388099. [Google Scholar] [CrossRef] [PubMed]
  54. Petford, M.A.; Alexander, G.J. Potential range shifts and climatic refugia of rupicolous reptiles in a biodiversity hotspot of South Africa. Environ. Conserv. 2021, 48, 264–273. [Google Scholar] [CrossRef]
  55. He, X.; Burgess, K.S.; Gao, L.M.; Li, D.Z. Distributional responses to climate change for alpine species of Cyananthus and Primula endemic to the Himalaya-Hengduan Mountains. Plant Divers. 2019, 41, 26–32. [Google Scholar] [CrossRef] [PubMed]
Figure 1. Eleutherococcus nodiflorus (E. nodiflorus) occurrence locations in China.
Forests 17 00854 g001
Figure 2. Results of parameter optimization for the MaxEnt model. Note: AICc: Akaike information criterion corrected for small sample sizes.
Forests 17 00854 g002
Figure 3. Jackknife test for variable importance in MaxEnt.
Forests 17 00854 g003
Figure 4. Environmental predictors response curves for E. nodiflorus: (a) November precipitation (prec11), (b) January minimum temperature (tmin1), (c) temperature seasonality (bio4), and (d) June minimum temperature (tmin6). The orange dashed lines indicate the optimal ranges for each variable: prec11: 51.52–253.00 mm; tmin1: –3.09 to 3.76 °C; bio4: 660.24–925.18; tmin6: 18.52–22.69 °C or 24.86–26.19 °C. The x-axis shows the variable value, and the y-axis shows the logistic probability of presence (0 to 1), where values above 0.5 indicate favorable conditions for the species. Note: the shaded areas indicate ± one standard deviation (SD) of the mean response curves from the 10 replicate model runs.
Forests 17 00854 g004
Figure 5. Potential suitable range of E. nodiflorus under the current climate.
Forests 17 00854 g005
Figure 6. Trends in suitable habitat zones for E. nodiflorus under SSP1-2.6 and SSP5-8.5 across different periods. (a) Stacked bar chart showing the area (×104 km2) of low-, medium-, and high-suitability habitat for each period and scenario (bar outlines are visual guides only). (b) highly suitable habitat area only. Note: Statistical significance of temporal trends was assessed using linear regression. For total suitable habitat area (a), no significant trend was detected under SSP1-2.6 (R2 = 0.006, p = 0.8929) or SSP5-8.5 (R2 = 0.050, p = 0.7186). For highly suitable habitat area (b), the increasing trend under SSP1-2.6 approached significance (R2 = 0.497, p = 0.083), while no significant trend was found under SSP5-8.5 (R2 = 0.687, p = 0.184).
Forests 17 00854 g006
Figure 7. Centroid movement paths of E. nodiflorus habitats under future climate. (a) Location of Hunan Province within China, showing the study area. (b) Expanded view of Hunan Province, highlighting the three focal cities (Yueyang, Yiyang, and Changde), where centroid shifts were observed. (c) Centroid migration trajectories under both SSP pathways (SSP1-2.6 and SSP5-8.5) for the 2021–2040, 2041–2060, 2061–2080, and 2081–2100 periods.
Forests 17 00854 g007
Table 1. Evaluating MaxEnt model performance with initial versus calibrated values.
Model AssessmentFeature SetRegularization FactorMean AUC RatioAICc Score
DefaultLQPH11.795123.962
OptimizedLQPT41.8030
Note: AUC: Area Under the receiver operating characteristic curve. Model performance metrics (mean AUC ratio and AICc) are calculated directly from the MaxEnt outputs; as these are deterministic values rather than sample estimates, statistical comparisons were not performed.
Table 2. Percent contribution.
Variable CodeEnvironmental VariableContribution/%Importance/%
prec11November precipitation66.026.2
tmin1January minimum temperature17.547.4
bio4temperature seasonality6.19.3
zbylvegetation classification2.81.9
alum_sataluminum saturation2.33.5
tmin6June minimum temperature1.31.0
eqcalcium carbonate1.14.7
slpslope1.00.7
prec8August precipitation0.93.1
aspaspect0.50.4
gypsumgypsum content0.31.5
coarsecoarse fragments0.20.2
Disclaimer/Publisher’s Note: The statements, opinions and data contained in all publications are solely those of the individual author(s) and contributor(s) and not of MDPI and/or the editor(s). MDPI and/or the editor(s) disclaim responsibility for any injury to people or property resulting from any ideas, methods, instructions or products referred to in the content.