Review

Remote Sensing of Vegetation Dynamics: A Systematic Review on Disturbances in Protected Areas

by
Ifigeneia Morfopoulou
1,
Ioannis P. Kokkoris
2,
Ioannis Mitsopoulos
3 and
Giorgos Mallinis
1,*
1
School of Rural and Surveying Engineering, Aristotle University of Thessaloniki, 54124 Thessaloniki, Greece
2
Department of Sustainable Agriculture, University of Patras, 2 G. Seferi St., 30131 Agrinio, Greece
3
School of Forestry and Natural Environment, Aristotle University of Thessaloniki, 54124 Thessaloniki, Greece
*
Author to whom correspondence should be addressed.
Forests 2026, 17(7), 853; https://doi.org/10.3390/f17070853
Submission received: 5 June 2026 / Revised: 2 July 2026 / Accepted: 8 July 2026 / Published: 18 July 2026

Abstract

Disturbance and vegetation-recovery monitoring is gaining growing attention in remote sensing-based studies, especially in studies focusing on protected areas. Despite this growth, the methodological diversity and the research themes addressed across these studies have not yet been systematically examined. This systematic review examines peer-reviewed studies published after 2015 to identify and document how disturbances and post-disturbance recovery are monitored using satellite Earth Observation data. We systematically reviewed 105 studies, following the PRISMA and PSALSAR guidelines, and classified the publications by disturbance type, ecosystem type, geographic region, satellite and auxiliary datasets, analytical methods, and validation approaches employed. The results reveal that the research is concentrated in a small group of countries and predominantly focused on forest ecosystems. Disturbance detection dominates the research literature, while recovery modeling and long-term predictive analysis remain underexplored. Validation practices are highly inconsistent, with limited use of standardized approaches. Overall, this review highlights substantial methodological progress over the past decade and identifies research gaps in disturbance and recovery assessment, multi-sensor integration, and alignment with emerging biodiversity and restoration policy frameworks.

1. Introduction

Over the last decade, the need for systematic protected area monitoring has grown substantially. The detection, interpretation, and modeling of ecosystem disturbances and subsequent recovery conditions and rates represent major challenges in land use change science. Disturbances, including wildfires, droughts, desertification, deforestation, agricultural expansion, and urbanization, abruptly alter carbon cycles, hydrological regimes, and biodiversity. These natural and/or human-induced disturbances disrupt ecological processes and alter ecosystem functions [1]. Strengthening protected area networks and improving their management is therefore critical for reducing the effects of disturbances on ecosystems and ensuring the long-term conservation of their functions and services.
Protected areas (PAs) play a fundamental role in biodiversity conservation and ecosystem functioning, serving as essential tools for achieving the Sustainable Development Goals (SDGs) [2]. Policies for the European Green Deal and the EU Biodiversity Strategy, as well as the EU Nature Restoration Regulation, set targets for the conservation, enhancement, and protection of ecosystems by 2030, and strengthen the management and protection of the Natura 2000 network areas [3]. Similar initiatives have been adopted worldwide, with programs such as USA’s Securities and Exchange Commission’s climate disclosure rules [4], the African Green Stimulus Programme [5], Japan’s Green Growth Strategy for achieving carbon neutrality by 2050 [6], Australia’s National Biodiversity Strategy and Action Plan [7] and more. The main aim of such initiatives is to strengthen societal resilience against the protection of wildlife species, ecosystems and their services.
Despite the continued expansion of PAs [8], concerns remain regarding the effectiveness of their management. These concerns are linked to the rising anthropogenic pressure and accelerating effects of climate change, but also due to the inadequate implementation of conservation measures [9]. In such cases, where proper protection and monitoring practices are not implemented, the ecosystems within and around PAs undergo severe degradation, which leads to Protected Area Downgrading, Downsizing or Degazettement (PADDD) [10,11]. At the same time, the international community has recognized the imperative need for ecological restoration as a main strategy towards biodiversity conservation. The United Nations (UN) have declared the 2021–2030 period the “Decade on Ecosystem Restoration” to reverse the degradation of ecosystems, and to support the resilience of biodiversity [12]. This initiative stresses the interdependence between well-managed PAs and effectively implemented restoration programs.
Given these priorities, there is a critical need for systematic monitoring of PAs and the pressures affecting them, in order to assess ecosystem conditions, detect disturbances, and evaluate recovery processes. Remote sensing has emerged as a reliable and indispensable tool for this purpose, with significant advancements in the analysis of Earth Observation (EO) data supporting the management and monitoring of PAs. As access to EO data continues to expand [13], researchers are exploring the most effective ways to leverage this growing availability [14]. Traditional field-based monitoring is costly and often constrained by limited spatial coverage and infrequent sampling, whereas remote sensing provides efficient, consistent, standardized and objective observations for a wide range of ecological attributes and environmental monitoring needs. The availability of satellite constellations with improved revisit rates, such as Sentinel and Landsat, has supported a new era in change detection and modeling, with methods capable of detecting both abrupt and gradual land surface changes across multiple temporal scales [15,16,17]. Furthermore, the integration of synthetic features, time-series algorithms, and machine learning models enables the quantification of vegetation dynamics, soil and canopy health, hydrological variation, and land use/land cover (LULC) change among other monitoring applications [18,19,20,21,22]. Within this context, the integration of deep learning is also gaining attention as a means to extract further environmental information [23,24]. Despite these methodological advancements, research specifically targeting disturbance-related vegetation dynamics within protected areas remains relatively limited. Consequently, the validation strategies also vary, depending on the specific application, the type of disturbance being assessed, and the spatial and temporal scale of analysis.
This systematic review synthesizes peer-reviewed remote sensing studies on disturbance and vegetation-recovery monitoring, with emphasis on Earth Observation data integration and methodological developments. We compile relevant information, and categorize it by algorithm type, temporal resolution, geographic region, ecosystem type, disturbance type and validation approach, to provide a structured overview of the current state of the field. By quantifying literature trends, core themes, and methodological trajectories, we aim to address the following questions: (a) Which remote sensing algorithms and analytical frameworks have shaped the methodological landscape for monitoring disturbance dynamics in protected areas? (b) Which EO datasets are used in vegetation dynamics analyses, and how are the auxiliary data sources integrated into the analytical frameworks employed? (c) How do sensor selections and remote sensing variables vary across disturbance types, and what do reported outcomes suggest about their suitability for specific applications? The findings of this review provide insights into priorities for future targeted research, while also offering practical considerations for the integration of EO datasets and remote sensing methods into protected area monitoring and management.

2. Materials and Methods

This systematic review was conducted and reported following the Preferred Reporting Items for Systematic Reviews and Meta-Analyses (PRISMA) guidelines, with the Protocol, Search, Appraisal, Literature Synthesis, Analysis, and Reporting (PSALSAR) framework [25,26], which together structured the review protocol, search strategy and synthesis process (Figure 1). The completed PRISMA checklist is provided in the Supplementary Materials (Table S1). This systematic review was not preregistered in any public review registry.

2.1. Protocol

In the first stage, the research scope and objectives were established, and predetermined inclusion and exclusion criteria as well as reviewing questions were defined, to ensure clarity and reproducibility of the results. For this review, six types of disturbances were identified: (a) fire, (b) drought, (c) meteorological-related (wind-, snow-, precipitation-related), (d) biological invasions (insects and invasive vegetation species), (e) erosion, and (f) human activity-related disturbances. Unlike meteorological-related events, which are rapid-onset disturbances and short-lived and directly observable atmospheric phenomena, drought is a complex, slow-onset, and gradually intensifying phenomenon that emerges over extended periods and is therefore treated as a distinct disturbance category [27]. Although drought originates from meteorological deficits, it is typically treated as a separate disturbance category because it represents a prolonged climatic anomaly rather than a short-duration meteorological event such as wind, precipitation, or snow. The Intergovernmental Panel on Climate Change (IPCC) Sixth Assessment Report (AR6) places windstorms, heavy precipitation, and snowstorms under meteorological hazards, whereas drought and heatwaves are under climatological hazards [28].
Regarding deforestation and how it is viewed in vegetation dynamics, the literature indicates that it constitutes “forest loss due to a disturbance” rather than a “disturbance” itself. According to the Food and Agriculture Organization of the United Nations [29], deforestation is defined as “the conversion of forest to other land use independently whether human-induced or not”. However, for the purposes of this review, it was retained and analyzed alongside other disturbance types, as it represents a consistent and measurable manifestation of disturbance across studies. This approach allows deforestation to be considered within the same analytical framework as other disturbances, facilitating comparison despite differences in how disturbance is defined or attributed in the literature. The review followed a simple two-step process in identifying how each study managed deforestation. First, it was determined whether deforestation was the main focus of the study by looking for it in the title, abstract, research questions, key variables, or major sections of the methods and results. If deforestation was the main focus of the publication, the study was then classified into one of two types: studies that treated deforestation as a disturbance itself (for example, mapping or modeling deforestation directly), or studies that treated deforestation as the result of another disturbance (i.e., wildfire, drought, meteorological events, insects and invasive species, land erosion and landslides, or human activities).
These categories capture natural and anthropogenic environmental drivers of change that lead (or potentially lead) to PA loss and/or degradation and can be consistently detectable and identifiable through remote sensing monitoring applications and EO datasets, thereby allowing for systematic and objective comparison across studies. It was integral that the reviewed studies undergo a structured literature synthesis and systematic evidence mapping, conducted through the extraction of specific information into a spreadsheet table, under various criteria. These criteria were established prior to the literature search in order to ensure transparency and consistency in study selection and data extraction. This approach was used to reduce potential selection and interpretation bias during the review process. A thorough examination of the criteria is reported in Section 2.4, the Literature Synthesis Subsection.

2.2. Search and Identification

During the search stage, relevant studies were systematically identified, using a predefined database search engine, temporal range of publication date, and keywords. In this case, the Scopus Search Engine was used, with the search being limited to scientific articles published from 2015 to 2025. The final database search was performed on the 9 September 2025. In this case, the Scopus database was selected as the single primary search database. This decision was based on the comprehensive coverage of high-impact peer-reviewed remote sensing and ecological journals that Scopus provides. Along with that, it maintains superior index uniformity and uses a consistent indexing structure that supports reliable and reproducible query string development. Alternate platforms were excluded for distinct reasons. Web of Science was omitted due to its complex filtering and thematic overlap with Scopus in environmental and geographic disciplines. A dual-database search would result in substantial record redundancy without actually contributing significant, unique papers. Meanwhile, other platforms, such as Google Scholar, were excluded due to their less-structured query string development options, and their filtering lacking strict Boolean validation tools, therefore hindering reproducibility. We acknowledge the risk of database-exclusivity selection bias; however, we maintain that Scopus serves as an appropriate and robust database for this systematic review. Furthermore, the search criteria were limited to peer-reviewed scientific articles, published in English, from 2015 to 2025, to maintain linguistic standardization. We explicitly address these boundary constraints as inherent study limitations in Section 4.4 in the Discussion.
Specific keywords aligned with the selected disturbance categories and limitations regarding PA inclusion were applied. Exclusions involved removing studies dedicated to wetlands, mangroves, or animal-specific research, to strictly align the results with terrestrial ecosystems and disturbance processes relevant to PA monitoring. The search string used is the following:
TITLE-ABS-KEY ((“remote sensing” OR “earth observation” OR “satellite”) AND (“monitoring” OR “change detection” OR “recovery” or “restoration”) AND (“protected area” OR “park” OR “reserve” OR “Natura2000” OR “Natura 2000”) AND (“wildfire” OR “fire” OR “drought” OR “desertification” OR “deforestation” OR “logging” OR “clear-cutting” OR “wind” OR “snow” OR “precipitation” OR “insects” OR “defoliation” OR “infestation” OR “pest” OR “invasive” OR “infrastructure” OR “building” OR “human development” OR “landslide” OR “erosion”)) AND PUBYEAR > 2014 AND PUBYEAR < 2026 AND (LIMIT-TO (SRCTYPE, “j”)) AND (LIMIT-TO (LANGUAGE, “English”)) AND (EXCLUDE (EXACTKEYWORD, “Wetland Ecosystem”) OR EXCLUDE (EXACTKEYWORD, “Wetland”) OR EXCLUDE (EXACTKEYWORD, “Animal”) OR EXCLUDE (EXACTKEYWORD, “Wetlands”) OR EXCLUDE (EXACTKEYWORD, “Mangrove”)).

2.3. Screening Phase

In the screening stage, the identified studies were individually evaluated to assess the data sources’ and processing methods’ quality. This was carried out by reviewing titles, abstracts, and keywords of the search results, and exclusively collecting studies that were related to remote sensing monitoring applications and specified the study area and disturbance. To ensure high methodological quality, studies were only included if they provided explicit descriptions of the satellite sensors used, the specific disturbance drivers, and a clear validation or ground-truthing component. This technical screening served as the primary quality control to ensure the reliability of the data to be reviewed and synthesized. This process represented eligibility-based methodological screening rather than a formal risk-of-bias assessment.
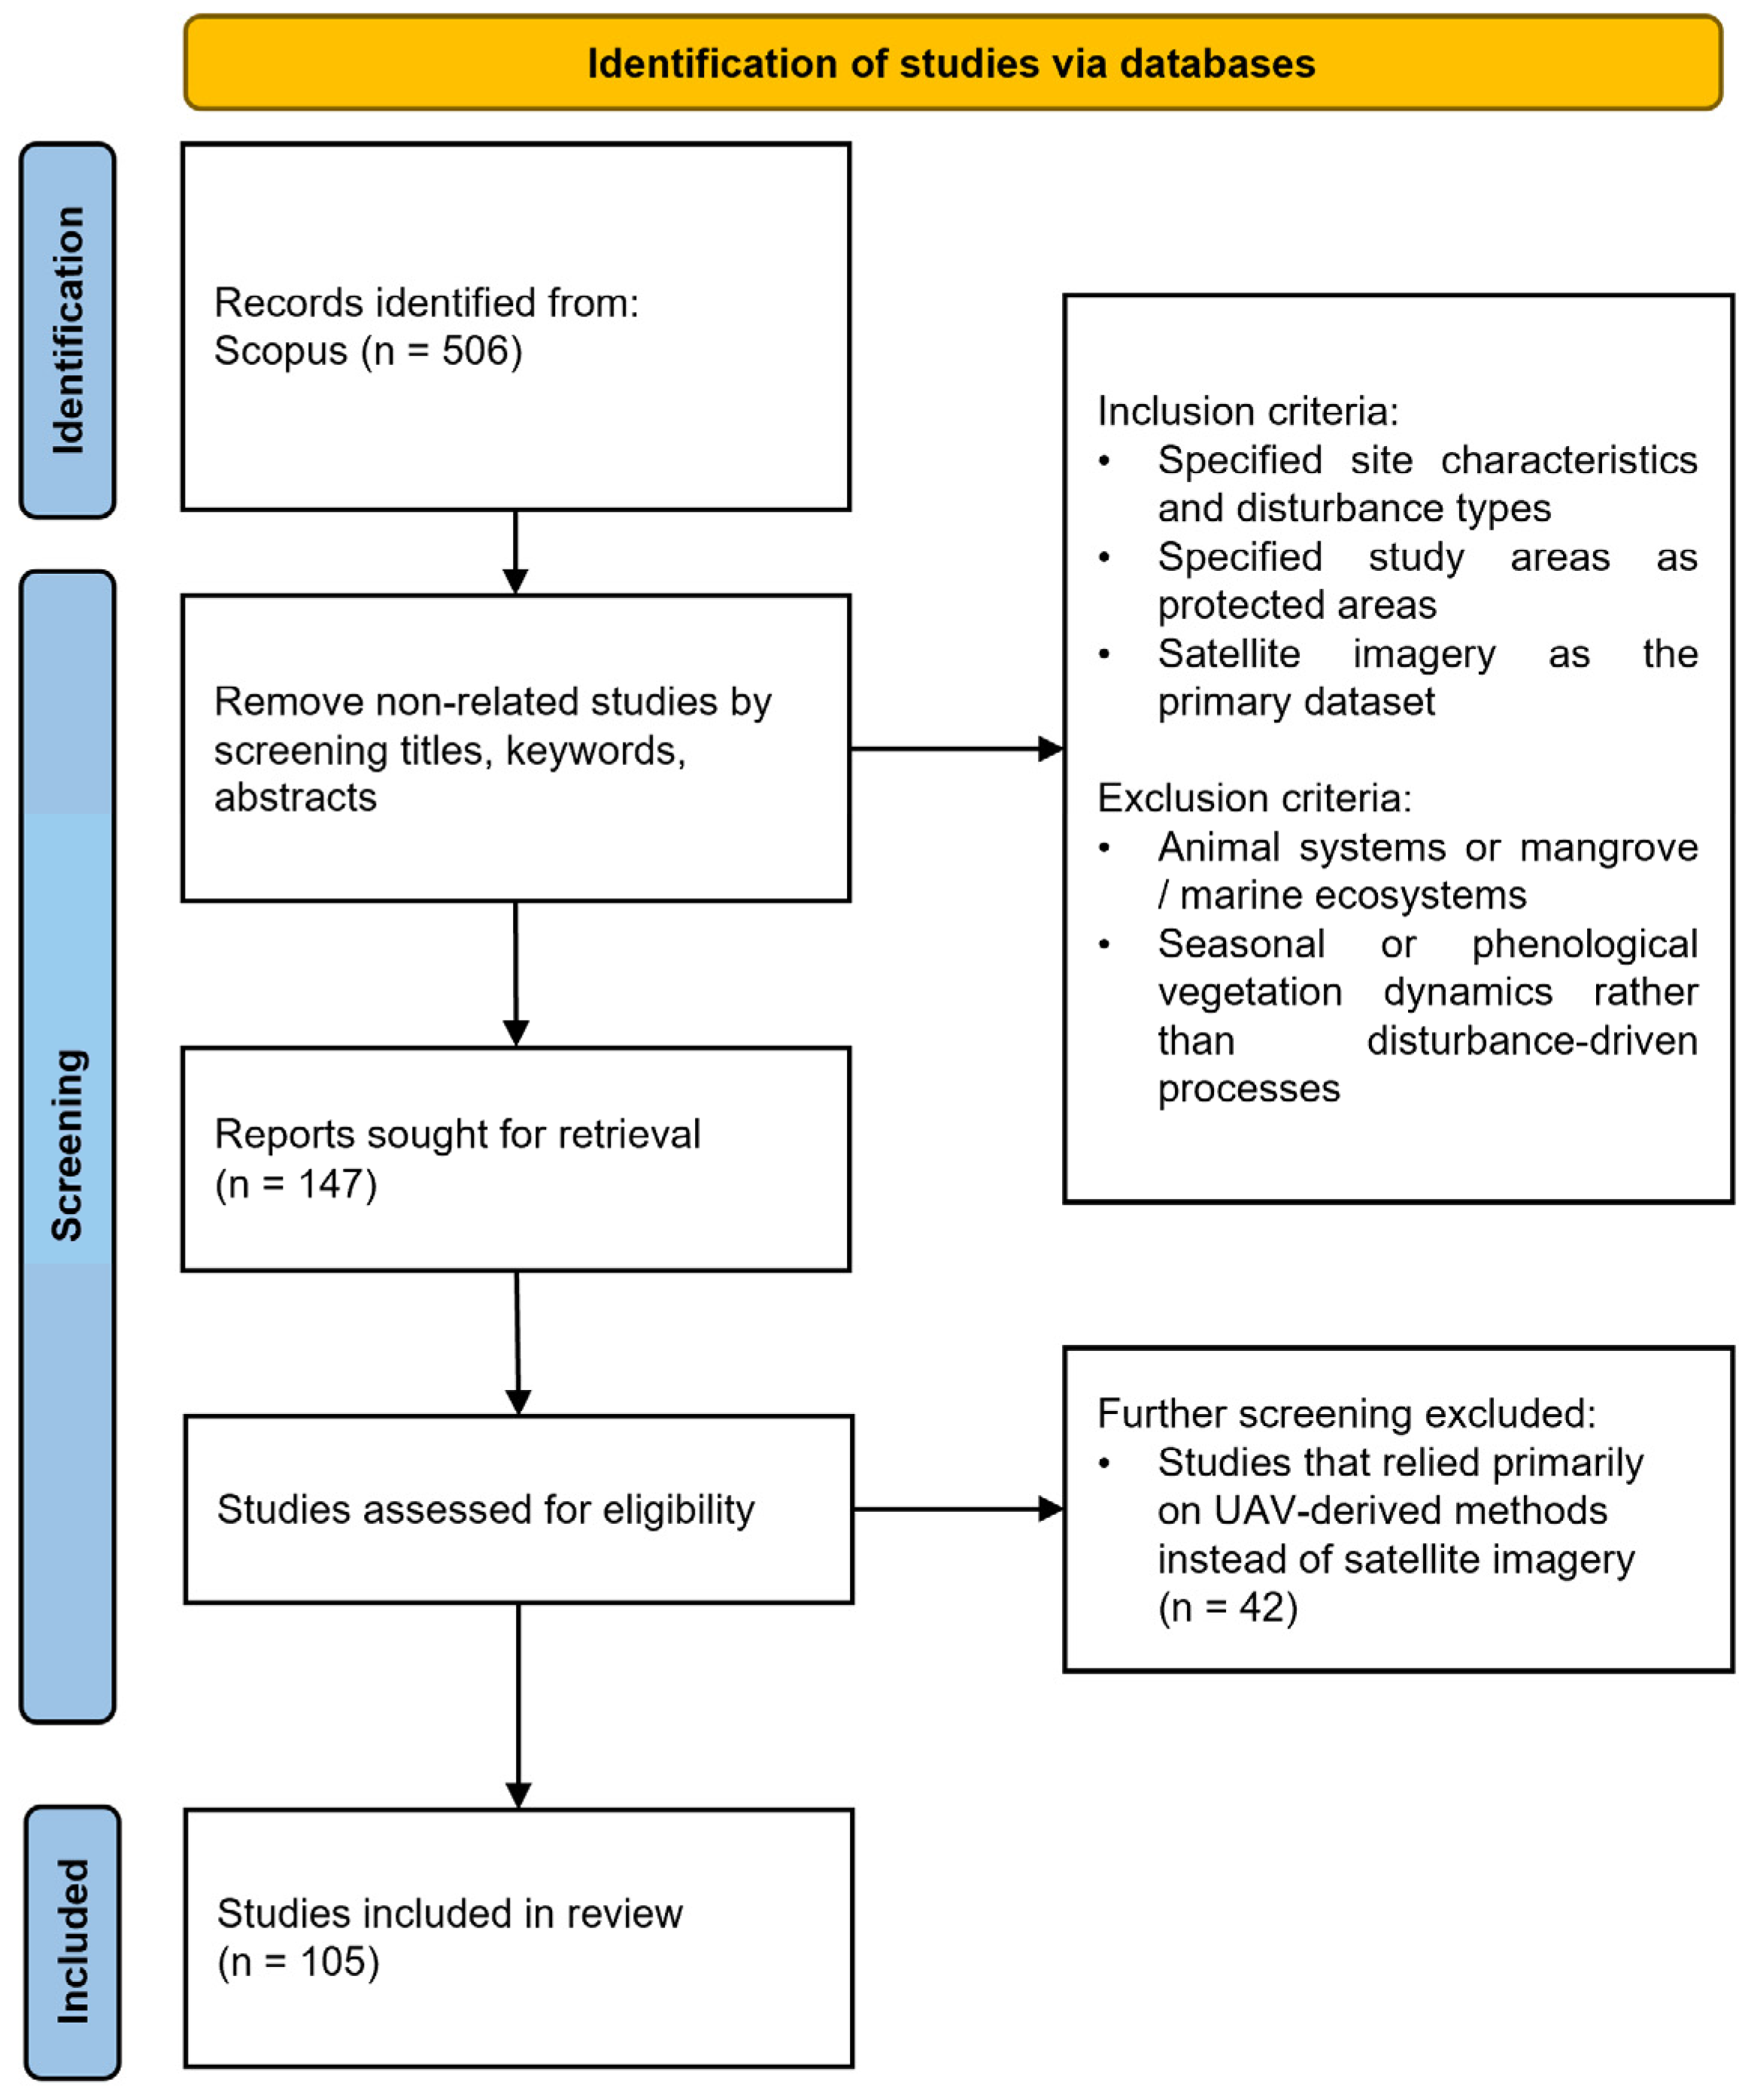
As presented in Figure 2, inclusion criteria required studies to specify site characteristics and disturbance types. Studies were included for review if they clearly specified site characteristics and disturbance types, were conducted within protected areas, and used satellite imagery as the primary dataset. To ensure alignment with disturbance-driven dynamics, studies focusing only on seasonal and phenological vegetation dynamics were excluded. Studies were excluded if they did not explicitly describe a disturbance, focused on animal systems or mangrove/marine ecosystems, or addressed only seasonal or phenological vegetation dynamics rather than disturbance-driven processes. The aforementioned filtering resulted in 147 studies. During further screening, we removed 42 studies that relied primarily on Unmanned Aerial Vehicle (UAV)-derived methods instead of satellite imagery. This review examines the remaining 105 studies. The specific criteria for exclusions at each screening stage are fully itemized in Figure 2, documenting sample counts at every stage to guarantee absolute methodological reproducibility.

2.4. Literature Synthesis

The following stage is literature synthesis, during which the collected studies were organized into consistent categories, based on location and ecological characteristics of the study area, and methodological approaches and dataset types applied, all of which have been established in the protocol stage. The classification process produced a comprehensive systematic dataset comprising numerous categorical variables. A selected subset of these categories, which are elaborated upon in later parts of this section, was utilized to identify statistical patterns within the reviewed literature and to address the research questions of the present study. The remaining categories served primarily as supporting variables to interpret and contextualize the primary variables used to generate systematic analytical results more accurately. A brief overview of the selected categories follows, while a detailed description of all categories included in the database table is presented in the Supplementary Materials (Table S2).
The protected area category was documented according to the legal or administrative terms reported in each study (e.g., national park). Disturbance type was identified as well, to specify the specific environmental or human-driven event investigated. The study area was then classified by spatial extent (global to local scale), and by the geographic name and country of the site. Temporal information classification was implemented as a range (intra-annual, multi-annual, or selected years) as well as a specific period mention (e.g., 2020–2024). Ecosystem type was identified from each study’s land cover descriptions and then aligned with the Mapping and Assessment of Ecosystems and their Services (MAES) Level 2 [30] typology (e.g., woodland and forest cropland, grassland, heathland and shrub, sparsely vegetated land, wetlands, etc.). It should be noted that studies could report multiple ecosystem types within a single study site, and no limitations were placed on the number of ecosystem types assigned per study. Studies were grouped according to their remote sensing application objective, classified into four methodological categories: recovery detection, disturbance detection, recovery modeling, and disturbance modeling. Disturbance detection identifies where and when degradation occurred, whereas disturbance modeling explains or predicts degradation [31,32]. Similarly, recovery detection involves identifying regrowth after disturbance, while recovery modeling simulates regrowth patterns [33,34]. Furthermore, when present, restoration measures and their specific types (such as reforestation, erosion control) were recorded. The data sources were documented by noting any EO satellite platforms and sensors used (such as Landsat, Sentinel-2, etc.). Any auxiliary non-satellite EO sources (e.g., aerial imagery, ground-based EO, etc.), EO products (e.g., digital elevation models, land cover maps, etc.), and non-EO data (e.g., in situ field observations, socioeconomic data, meteorological datasets, etc.) were documented also. All analytical processing methods were listed as algorithms, and then categorized by temporal analysis, unit of analysis, and processing approach. Change detection was further classified as either bi-temporal, time-series, or uni-temporal. The use of (shallow) machine learning (ML) and deep (machine) learning (DL) was documented as well. The protocol also specified whether studies conducted formal validation, and whether validation data came from a third-party source, as well as the type of dataset used.

2.5. Analysis and Reporting

During the analysis stage, patterns and trends were extracted and then synthesized to identify methodological themes and research gaps. Because the included studies were highly heterogeneous with respect to disturbance types, study objectives, remote sensing datasets, analytical methods, and reported outcomes, a quantitative meta-analysis was not considered appropriate. Therefore, the findings were synthesized using a narrative approach. The analysis was conducted through various classification schemes, including methodological, thematic, and application-based groupings, each tailored to extract information about a scientific question established in the protocol. All classifications are explained in the Results Section. The final stage, i.e., reporting, is where the results are presented in an organized and transparent manner, ensuring that the review process and findings are thoroughly explained, reproducible, and easy to follow for the interested reader.

3. Results

3.1. Trends in Sources and Methods

Trends in methodological characteristics, including spatial resolution of EO imagery used, algorithm category (traditional statistical methods, machine learning methods, deep learning methods), and validation approaches, were quantified through classification and statistical analyses. Trends were further examined across study-level contexts and data characteristics, including protected area status, ecosystem type, EO satellite and auxiliary datasets used in vegetation dynamics studies, vegetation indices, and vegetation recovery, as well as a thorough descriptive analysis for each disturbance type.

3.1.1. Spatial and Ecological Trends

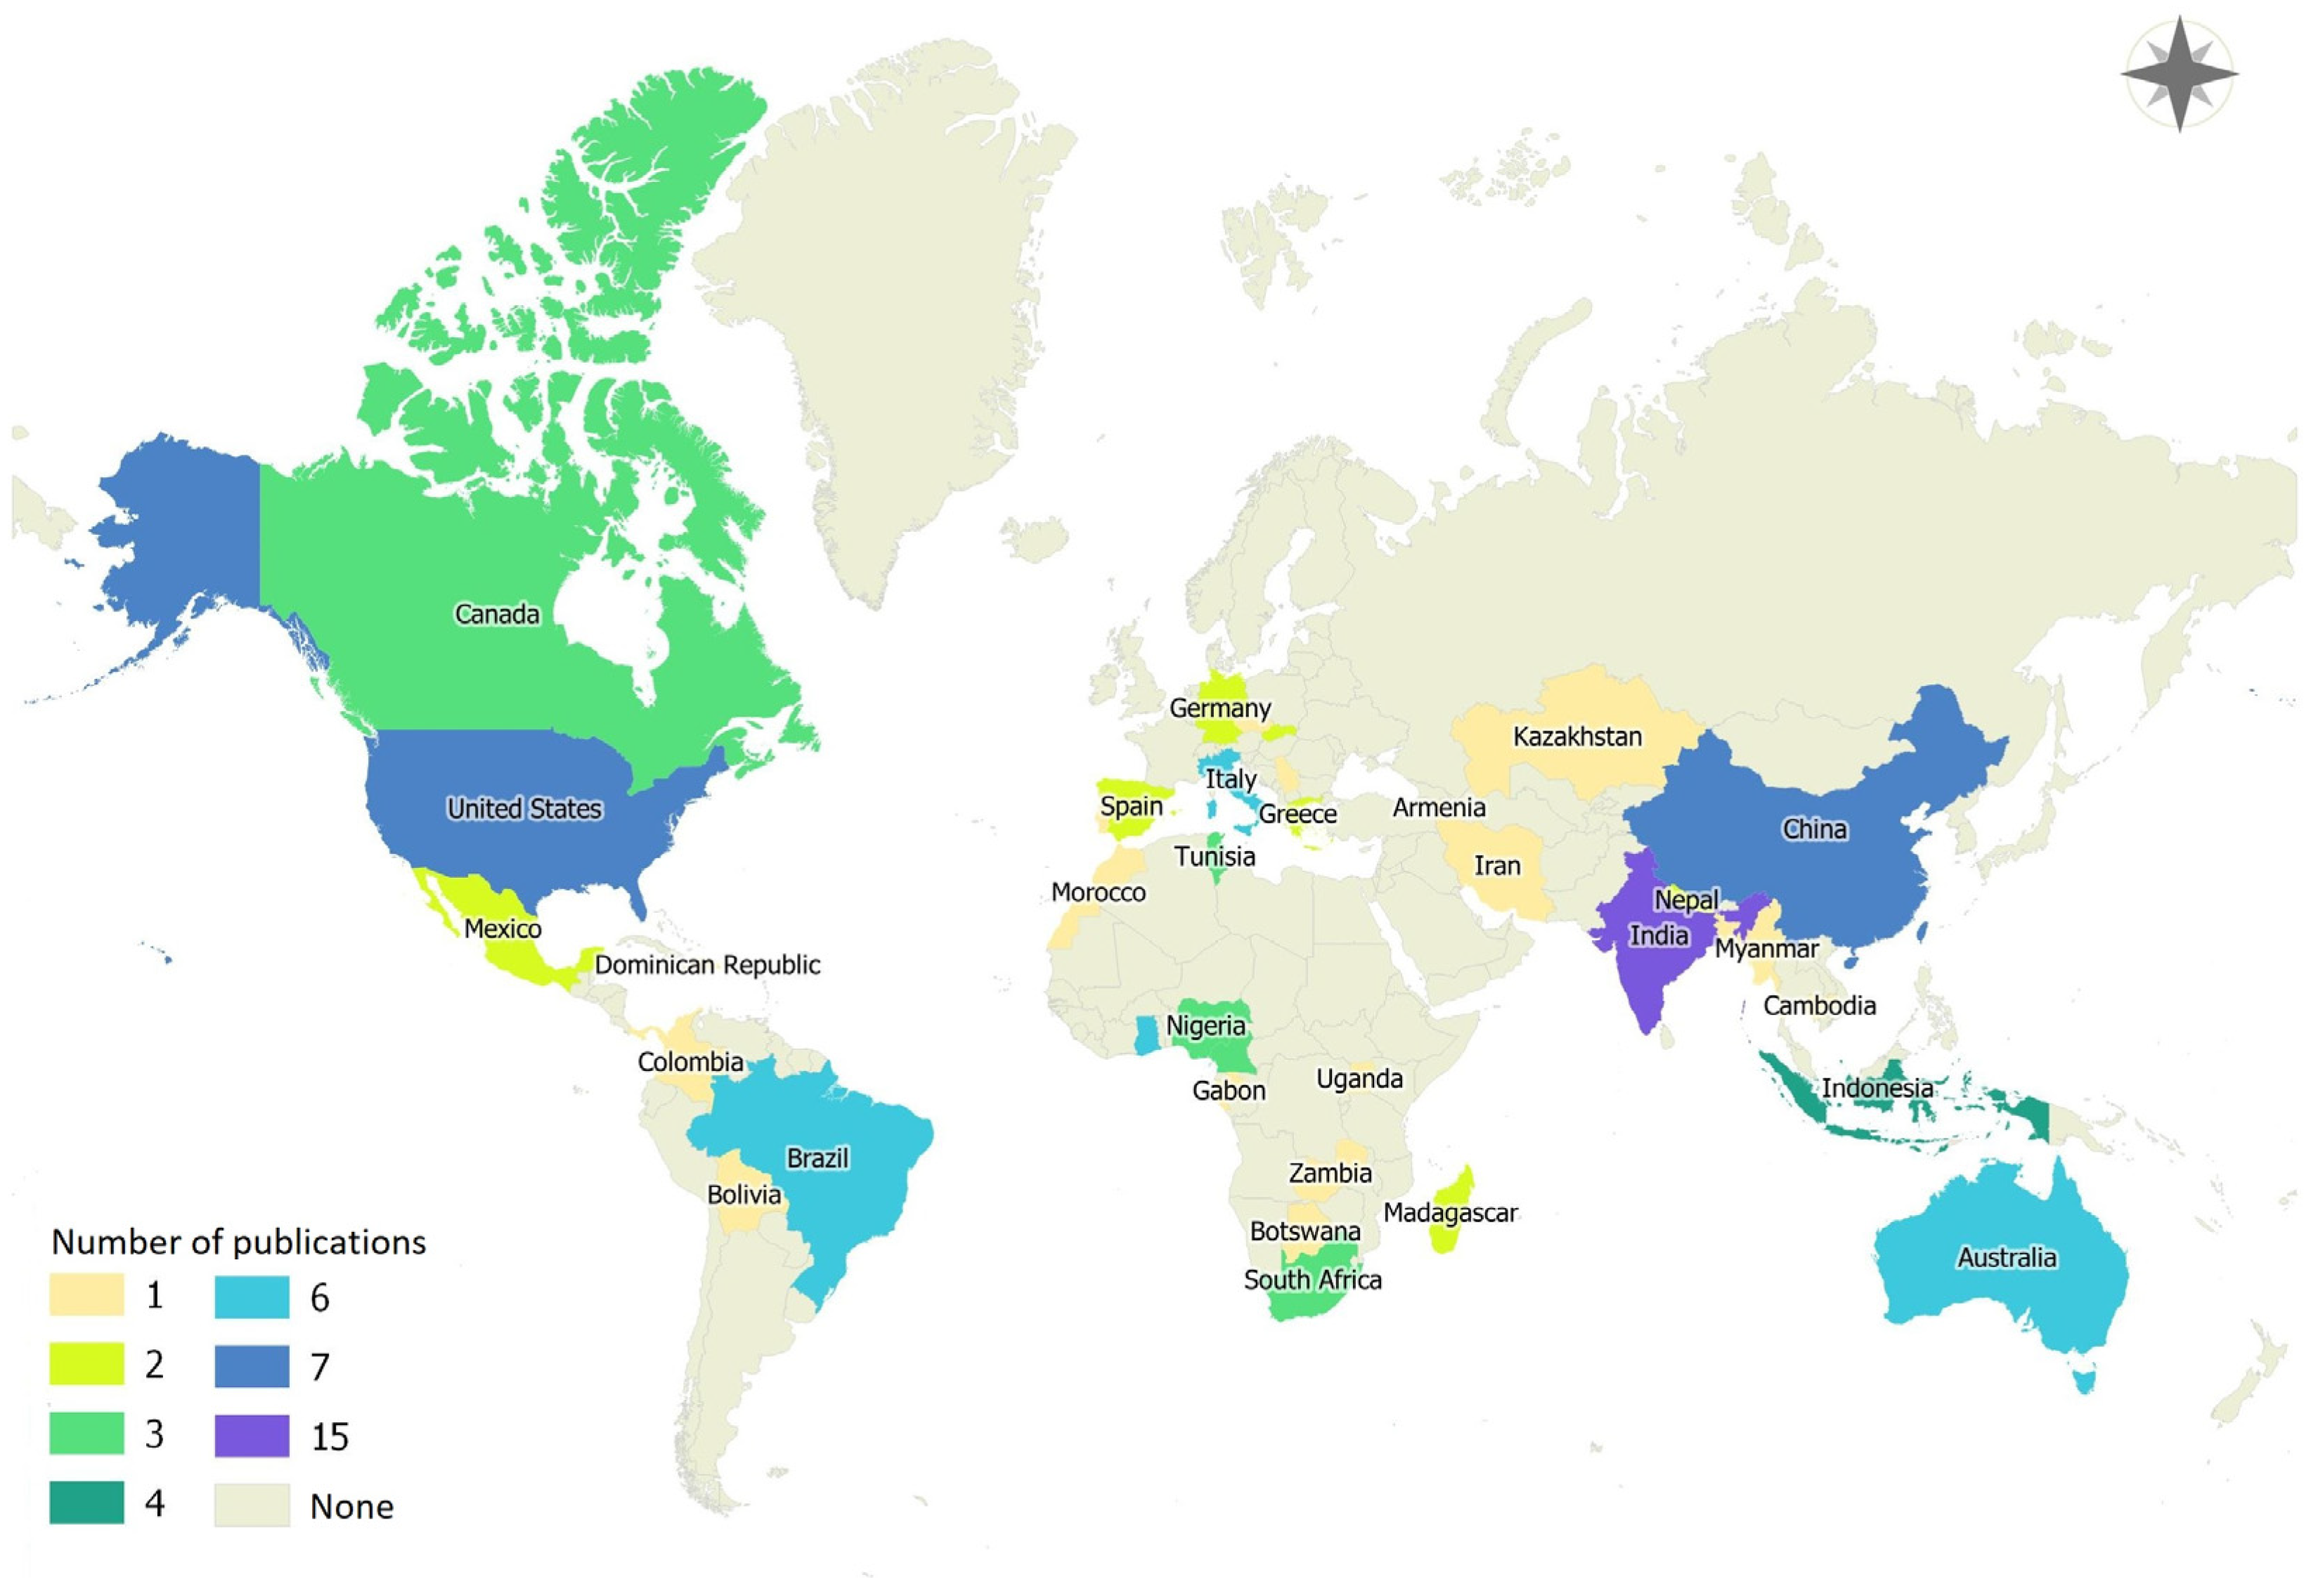
The geographic distribution (Figure 3) of study areas reveals a strong concentration in a small group of countries. India is the most frequently represented, with fifteen studies, followed by China and the USA with seven studies each, and Ghana, Australia, Brazil, and Italy with six studies each.
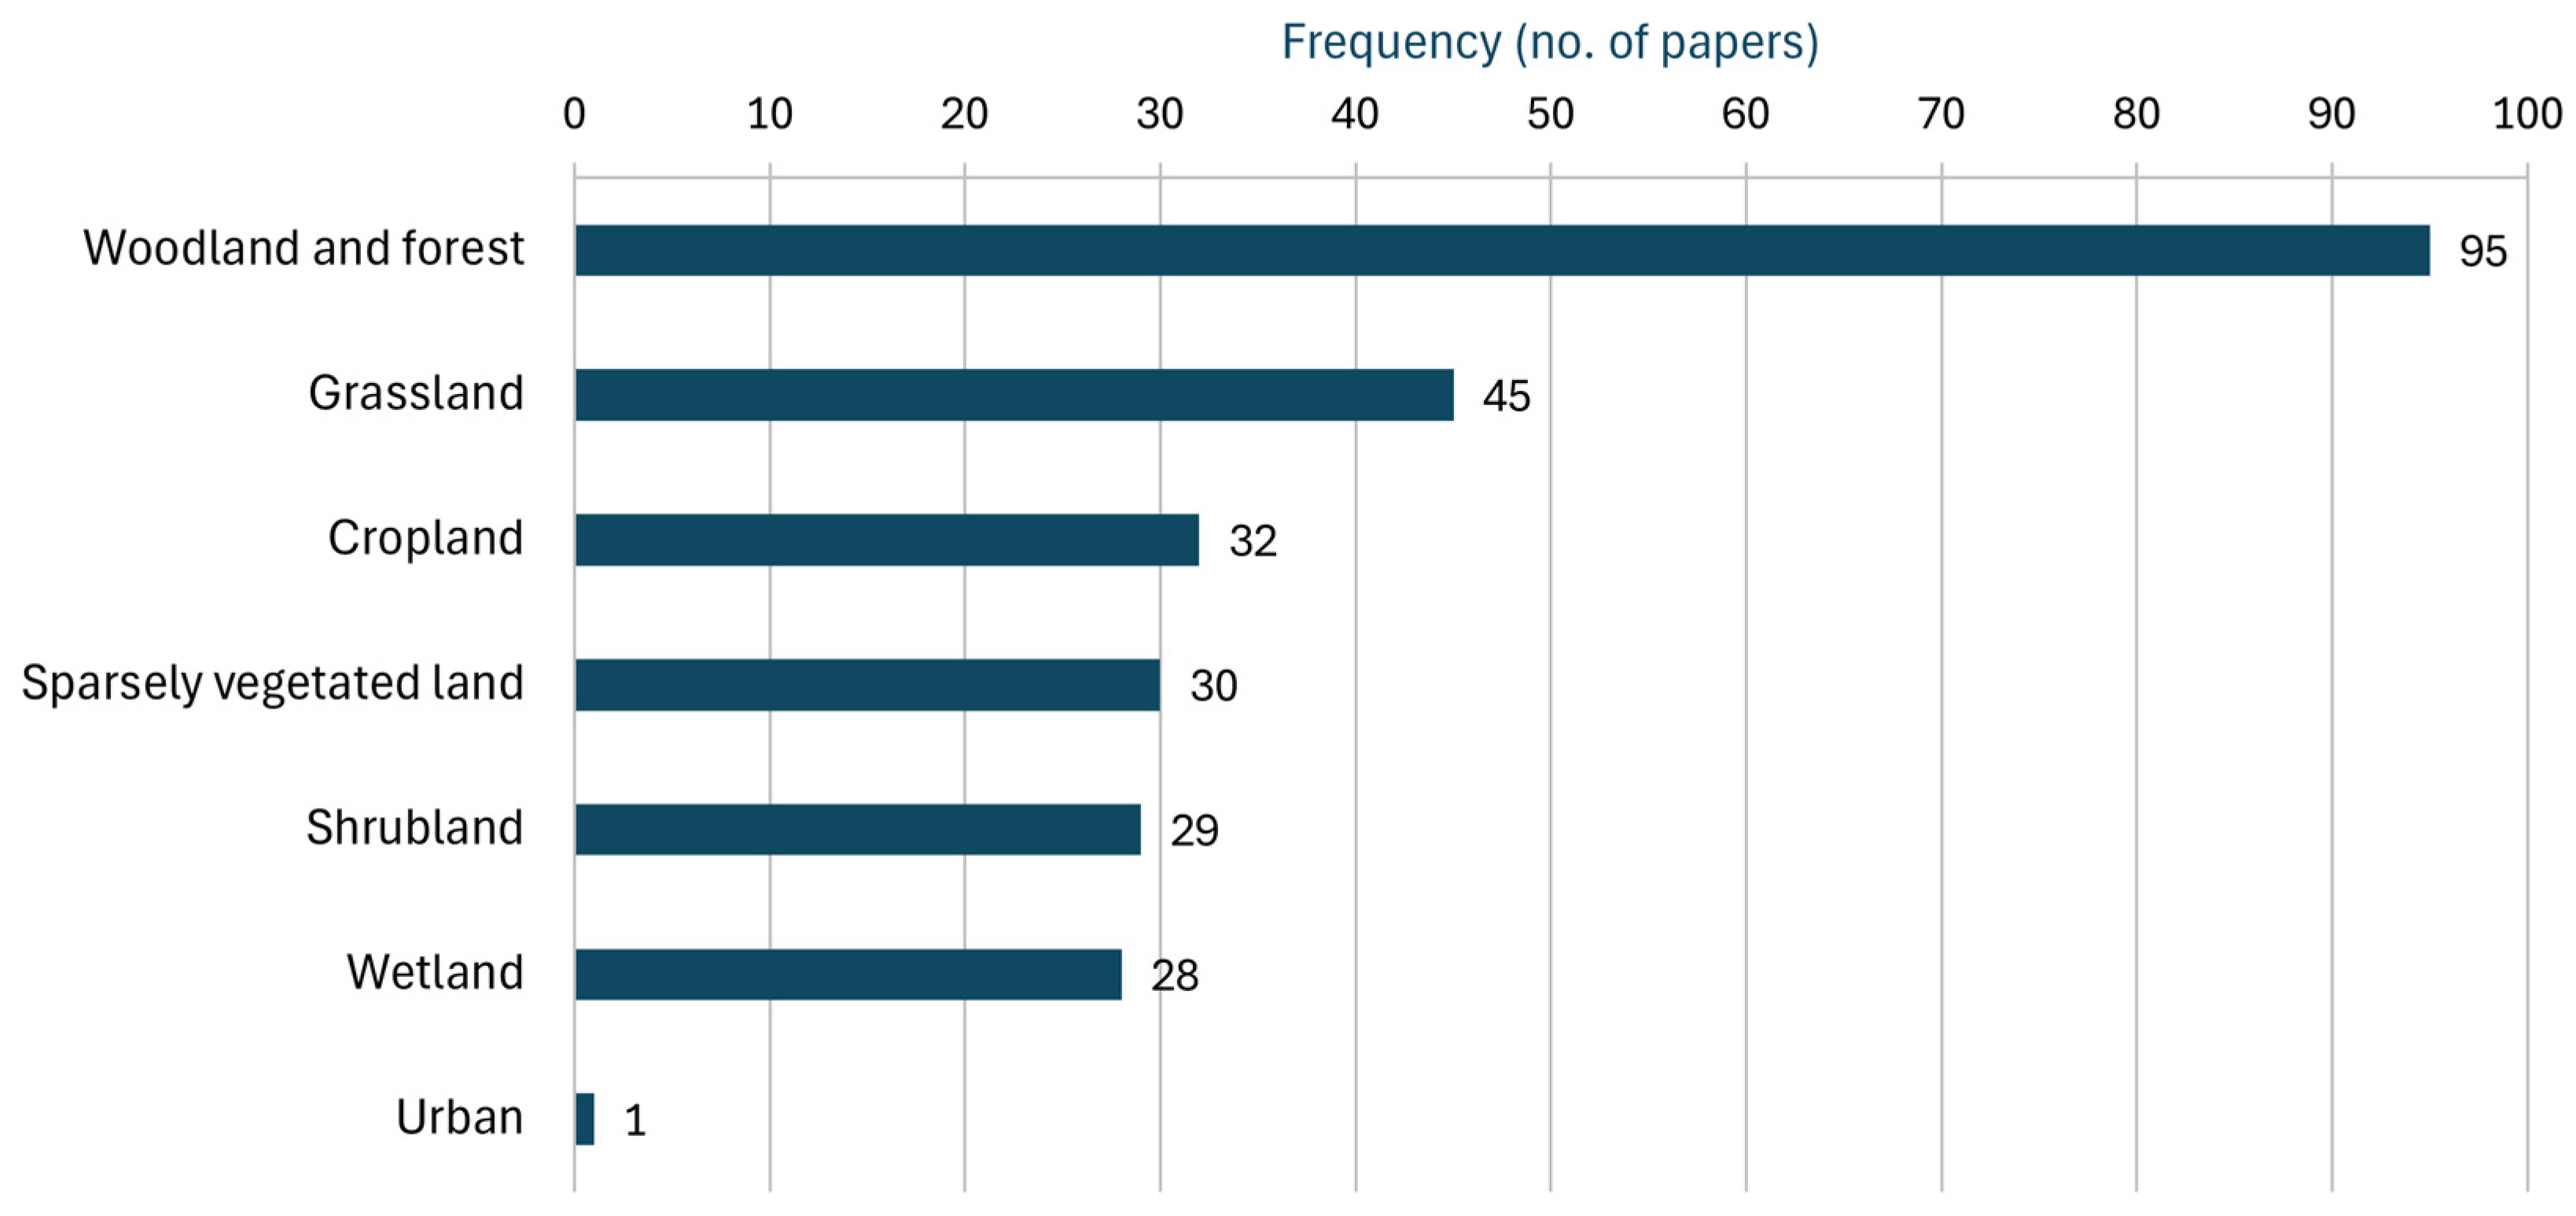
The distribution of studies across land cover ecosystem types was classified using the MAES Level 2 typology [30]. A clear emphasis on “woodland and forest” is evident, with 95 studies reflecting the dominance that forests have in conservation priorities globally, and the established effectiveness of remote sensing for forest-related disturbance monitoring (Figure 4). Grassland (45 studies), cropland (32 studies), heathland and shrub (29 studies), sparsely vegetated land (30 studies), and wetlands (28 studies) appear less frequently. While the primary focus of the search is targeting reserves categorized as terrestrial protected areas, many encompass inland, riparian, or seasonal wetland zones as secondary matrices within their legal borders, since they are rarely homogeneous, and hence these 28 occurrences were recorded under the “Wetland” category according to MAES Level 2 typology. The representation of urban areas by only a single study renders this land cover type virtually absent from the reviewed literature.
In examining the methodological scope of the reviewed studies, four categories of dynamics were identified: disturbance detection, disturbance modeling, recovery detection, and recovery modeling. From the reviewed literature, it was revealed that disturbance detection is the most common approach, with 98 studies aiming to identify disturbances, temporally and spatially. These studies included remote sensing applications for detecting both abrupt and gradual changes. Recovery detection is the focus of 45 studies, highlighting that post-disturbance regrowth and restoration assessment remains comparatively limited relative to disturbance detection. Disturbance modeling (34 studies) and recovery modeling (23 studies) appear less frequently. These figures indicate a stronger research concentration on the identification of disturbance events than on the modeling of post-disturbance regrowth and long-term ecosystem dynamics (Table 1).

3.1.2. Analysis Types and Methodological Approaches

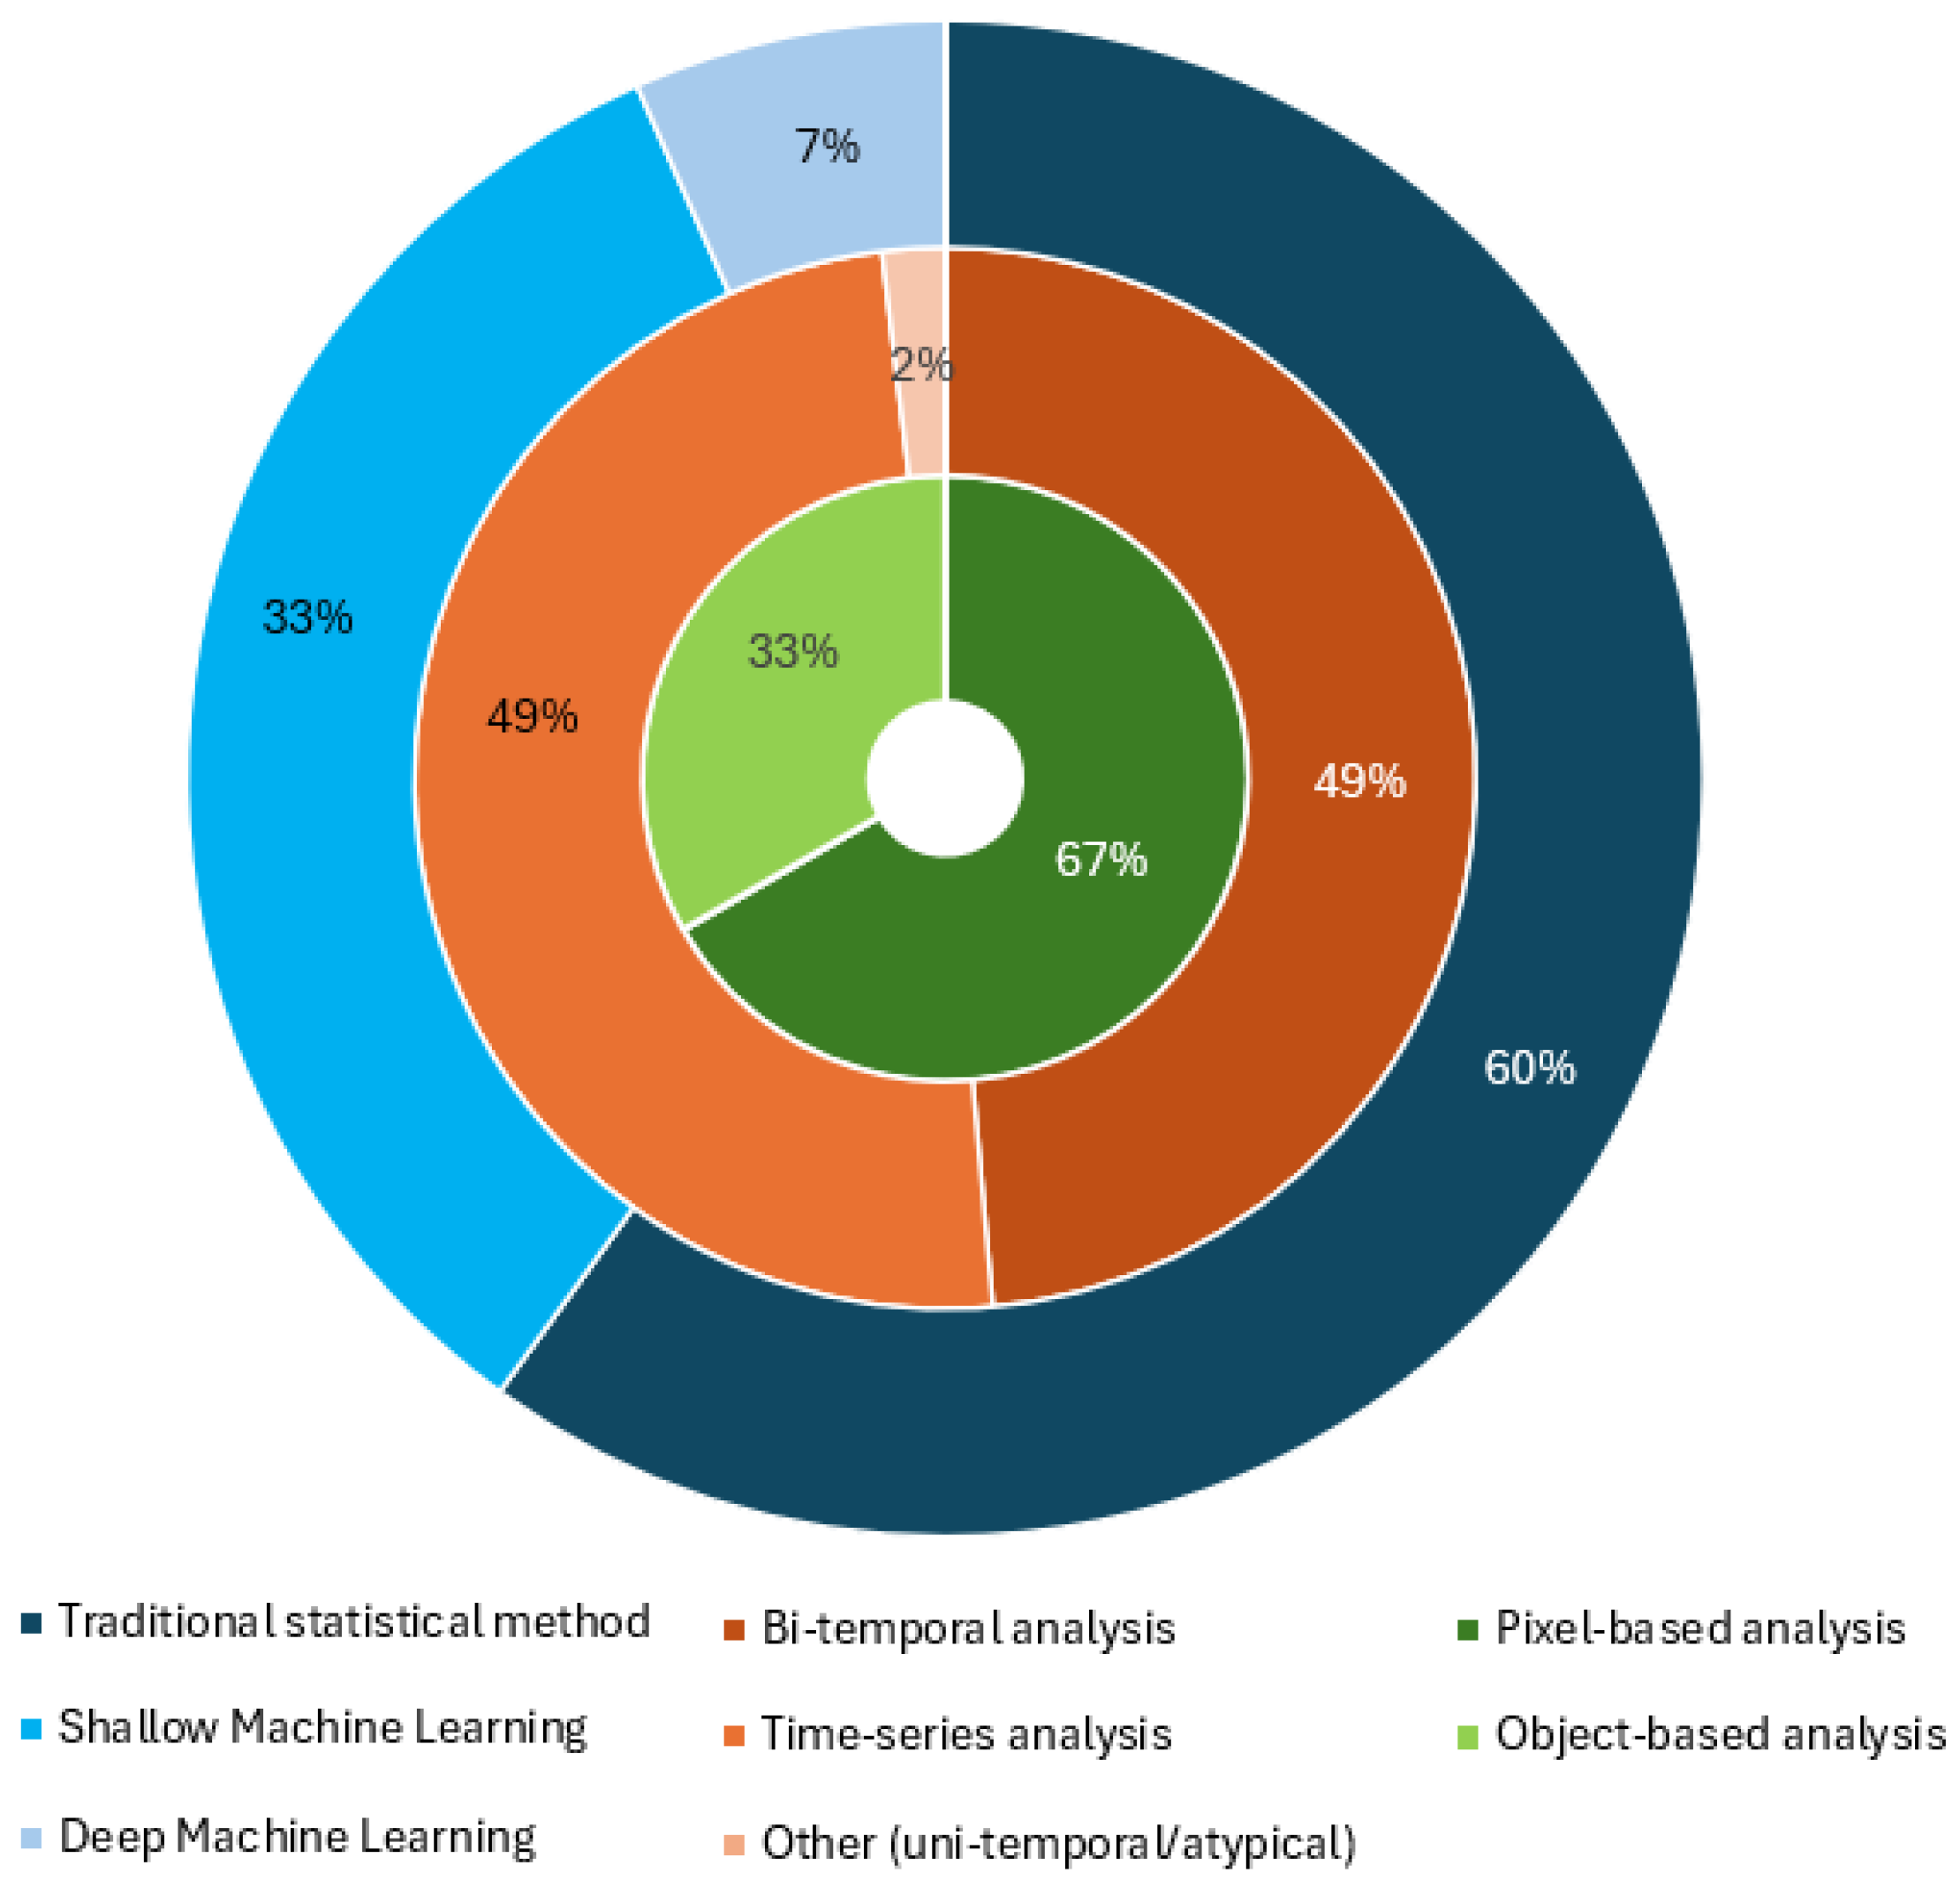
Of the 105 reviewed studies, 63 employed statistical methods, 35 applied shallow ML methods, and 7 incorporated DL methods, to detect or model disturbance-driven changes (Table 2). Statistical approaches include methods such as regression-based models, ANOVA-type tests [38,39,40], and trend analysis methods, such as the Mann–Kendall test [37,41,42] and Theil–Sen estimator [43,44]. Among shallow ML methods, Random Forest (RF) is the most widely used [45,46], followed by Support Vector Machines (SVMs) [47,48], maximum likelihood classification (MLC) [49,50], and clustering approaches [51,52,53,54]. The DL applications were fewer and primarily relied on Convolutional Neural Network (CNN)-based architectures, with U-Net variants [55], ResNet and Visual Geometry Group (VGG) [56] serving as core model architectures.
Regarding the change detection approach, 51 studies used bi-temporal methods as the primary approach for disturbance detection, whereas 52 relied on time-series analysis. Two studies did not conduct change detection or modeling analyses, but were included due to their relevance to vegetation dynamics assessment in the context of disturbance; one focused on a uni-temporal assessment [57], and the other addressed method comparison rather than temporal analysis [32]. Regarding the unit of analysis, 70 studies employed pixel-based methods, while 35 applied object-based methods (Figure A1).
Across all disturbance types, researchers employ both bi-temporal and time-series approaches. Most bi-temporal studies include a post-processing temporal analysis, to identify general trends in estimated variables over the long term. However, these analyses typically do not involve explicit time-series modeling (such as regression-based or decomposition methods). When time-series analysis is applied, the data are usually multi-annual, though intra-annual analyses have also been reported. Each study was assigned to one primary category within each methodological dimension, allowing the results to be expressed as percentages of the total number of reviewed publications.

3.1.3. Satellite Earth Observation Data Employed

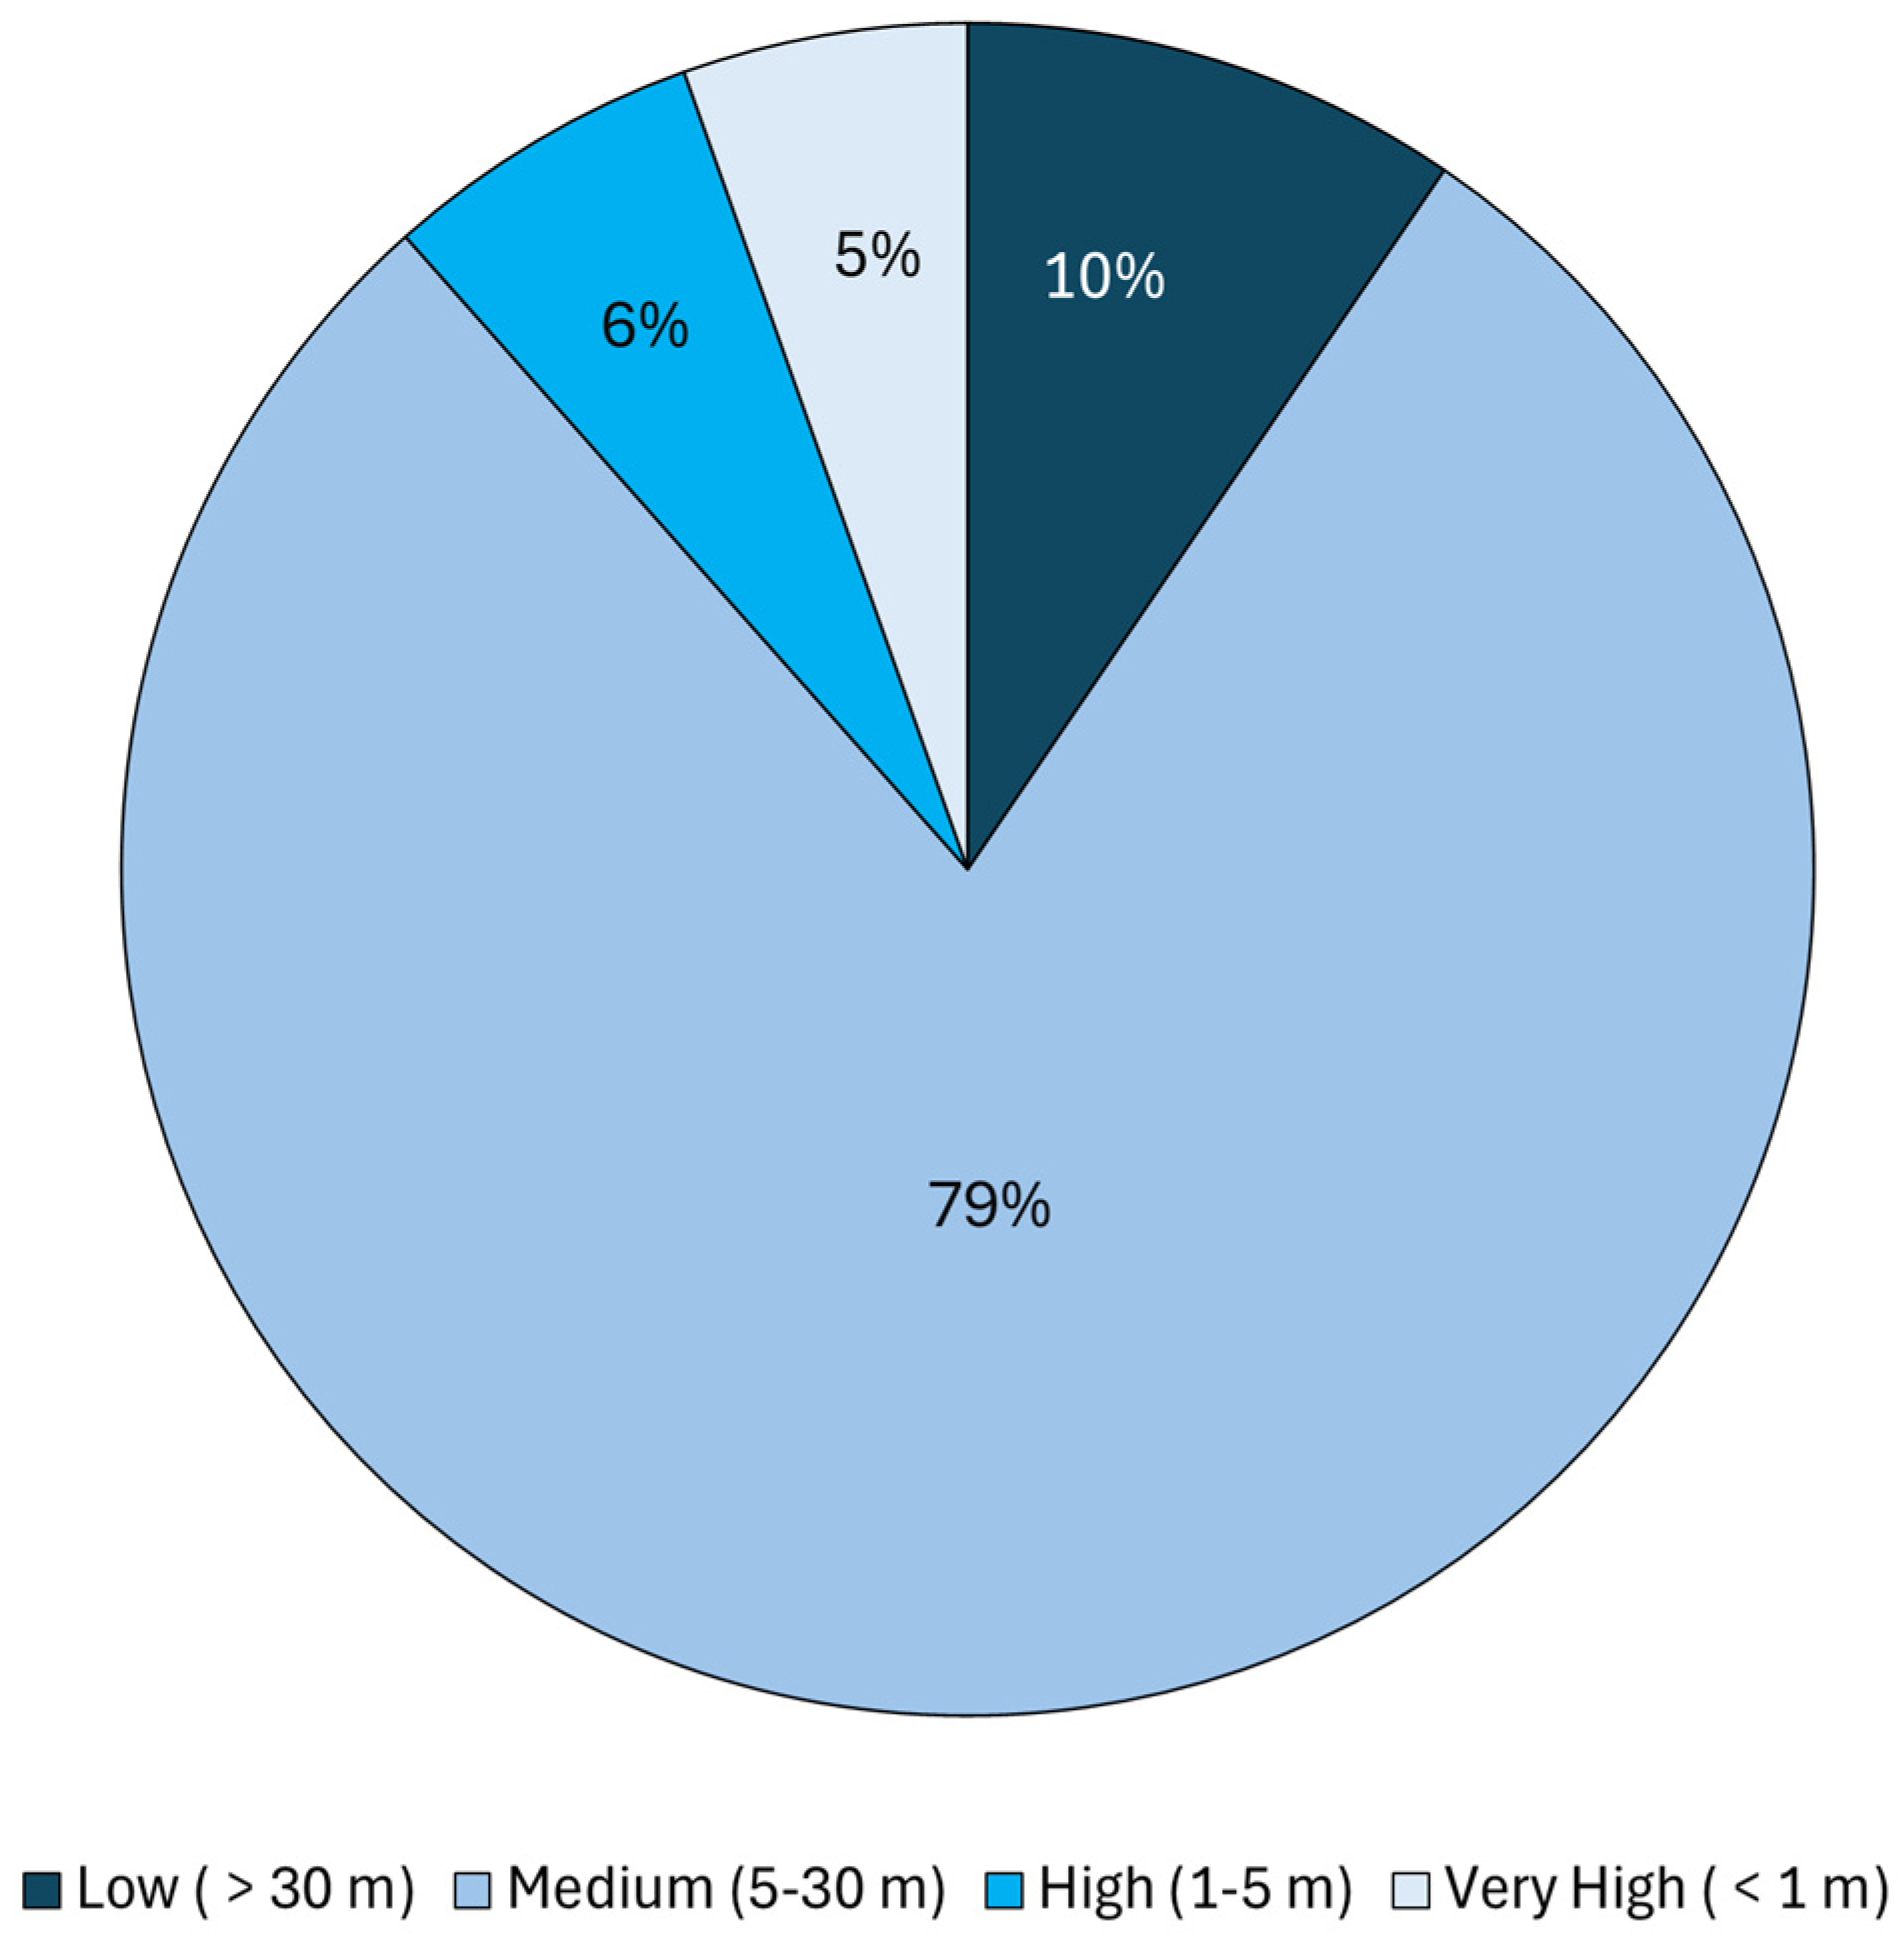
The distribution of optical satellite system usage in the reviewed literature (Figure 5) indicates a clear preference for medium–high-spatial-resolution (5–30 m) sensors, with the Landsat program dominating the dataset, appearing in 68 studies [58,59,60]. This is likely due to the long-term temporal coverage and free accessibility of this data source. Data from the Moderate Resolution Imaging Spectroradiometer (MODIS) instruments onboard the Terra and Aqua satellites are used in 21 studies [45,61,62] despite their low spatial resolution (>30 m), likely due to their utility for large-scale environmental monitoring and vegetation analysis, and frequent revisit intervals. Sentinel-2 appears in eight studies [63,64,65], consistent with the broader preference for freely available, medium-resolution multispectral datasets.
The less frequent use of the Indian Remote Sensing Advanced Wide Field Sensor (IRS AWiFS) [66] and RapidEye [67], each appearing in four studies, suggests targeted applications; Sentinel-1 [68], also appearing in four studies, reflects the targeted use of Synthetic Aperture Radar (SAR) data, particularly disturbance monitoring in cloud-affected areas in tropical regions. In terms of spatial resolution, AWiFS is typically classified as low-resolution, whereas RapidEye and Sentinel-1 fall within the medium-resolution range, depending on acquisition mode. High-resolution (1–5 m) commercial sensors, including PlanetScope [69] and WorldView-2 [70], as well as the medium-resolution IRS LISS-III [71] and the very-high-resolution (<1 m) GeoEye-1 [57] each appear in three studies, reflecting their use in detailed disturbance-related vegetation dynamics mapping.
A range of other sensors each appear in two studies, including the medium-resolution ASTER [33], IRS LISS-I [72], the very-high-resolution Ikonos [73], and the low-resolution SPOT-VGT [41] and VIIRS [74]. A broader set of less frequently used satellites appear in single studies, comprising medium-resolution sensors ALOS (AVNIR-2 [75], PALSAR [76]), NigeriaSat-2 [77] and UK-DMC-2 [77], high-resolution Pleiades [73], SPOT imagery from 2009 and 2012 (SPOT-4/5) [33], SPOT-7 [78], very-high-resolution QuickBird [79], WorldView-1 [79], and WorldView-3 [80], and low-resolution GOES [32], METEOSAT [32], NOAA AVHRR [32], TET-1 (Freebird) [58], PROBA-V [81], and Sentinel-5P [82], each being mentioned in a single study.

3.1.4. Auxiliary Sources of Information

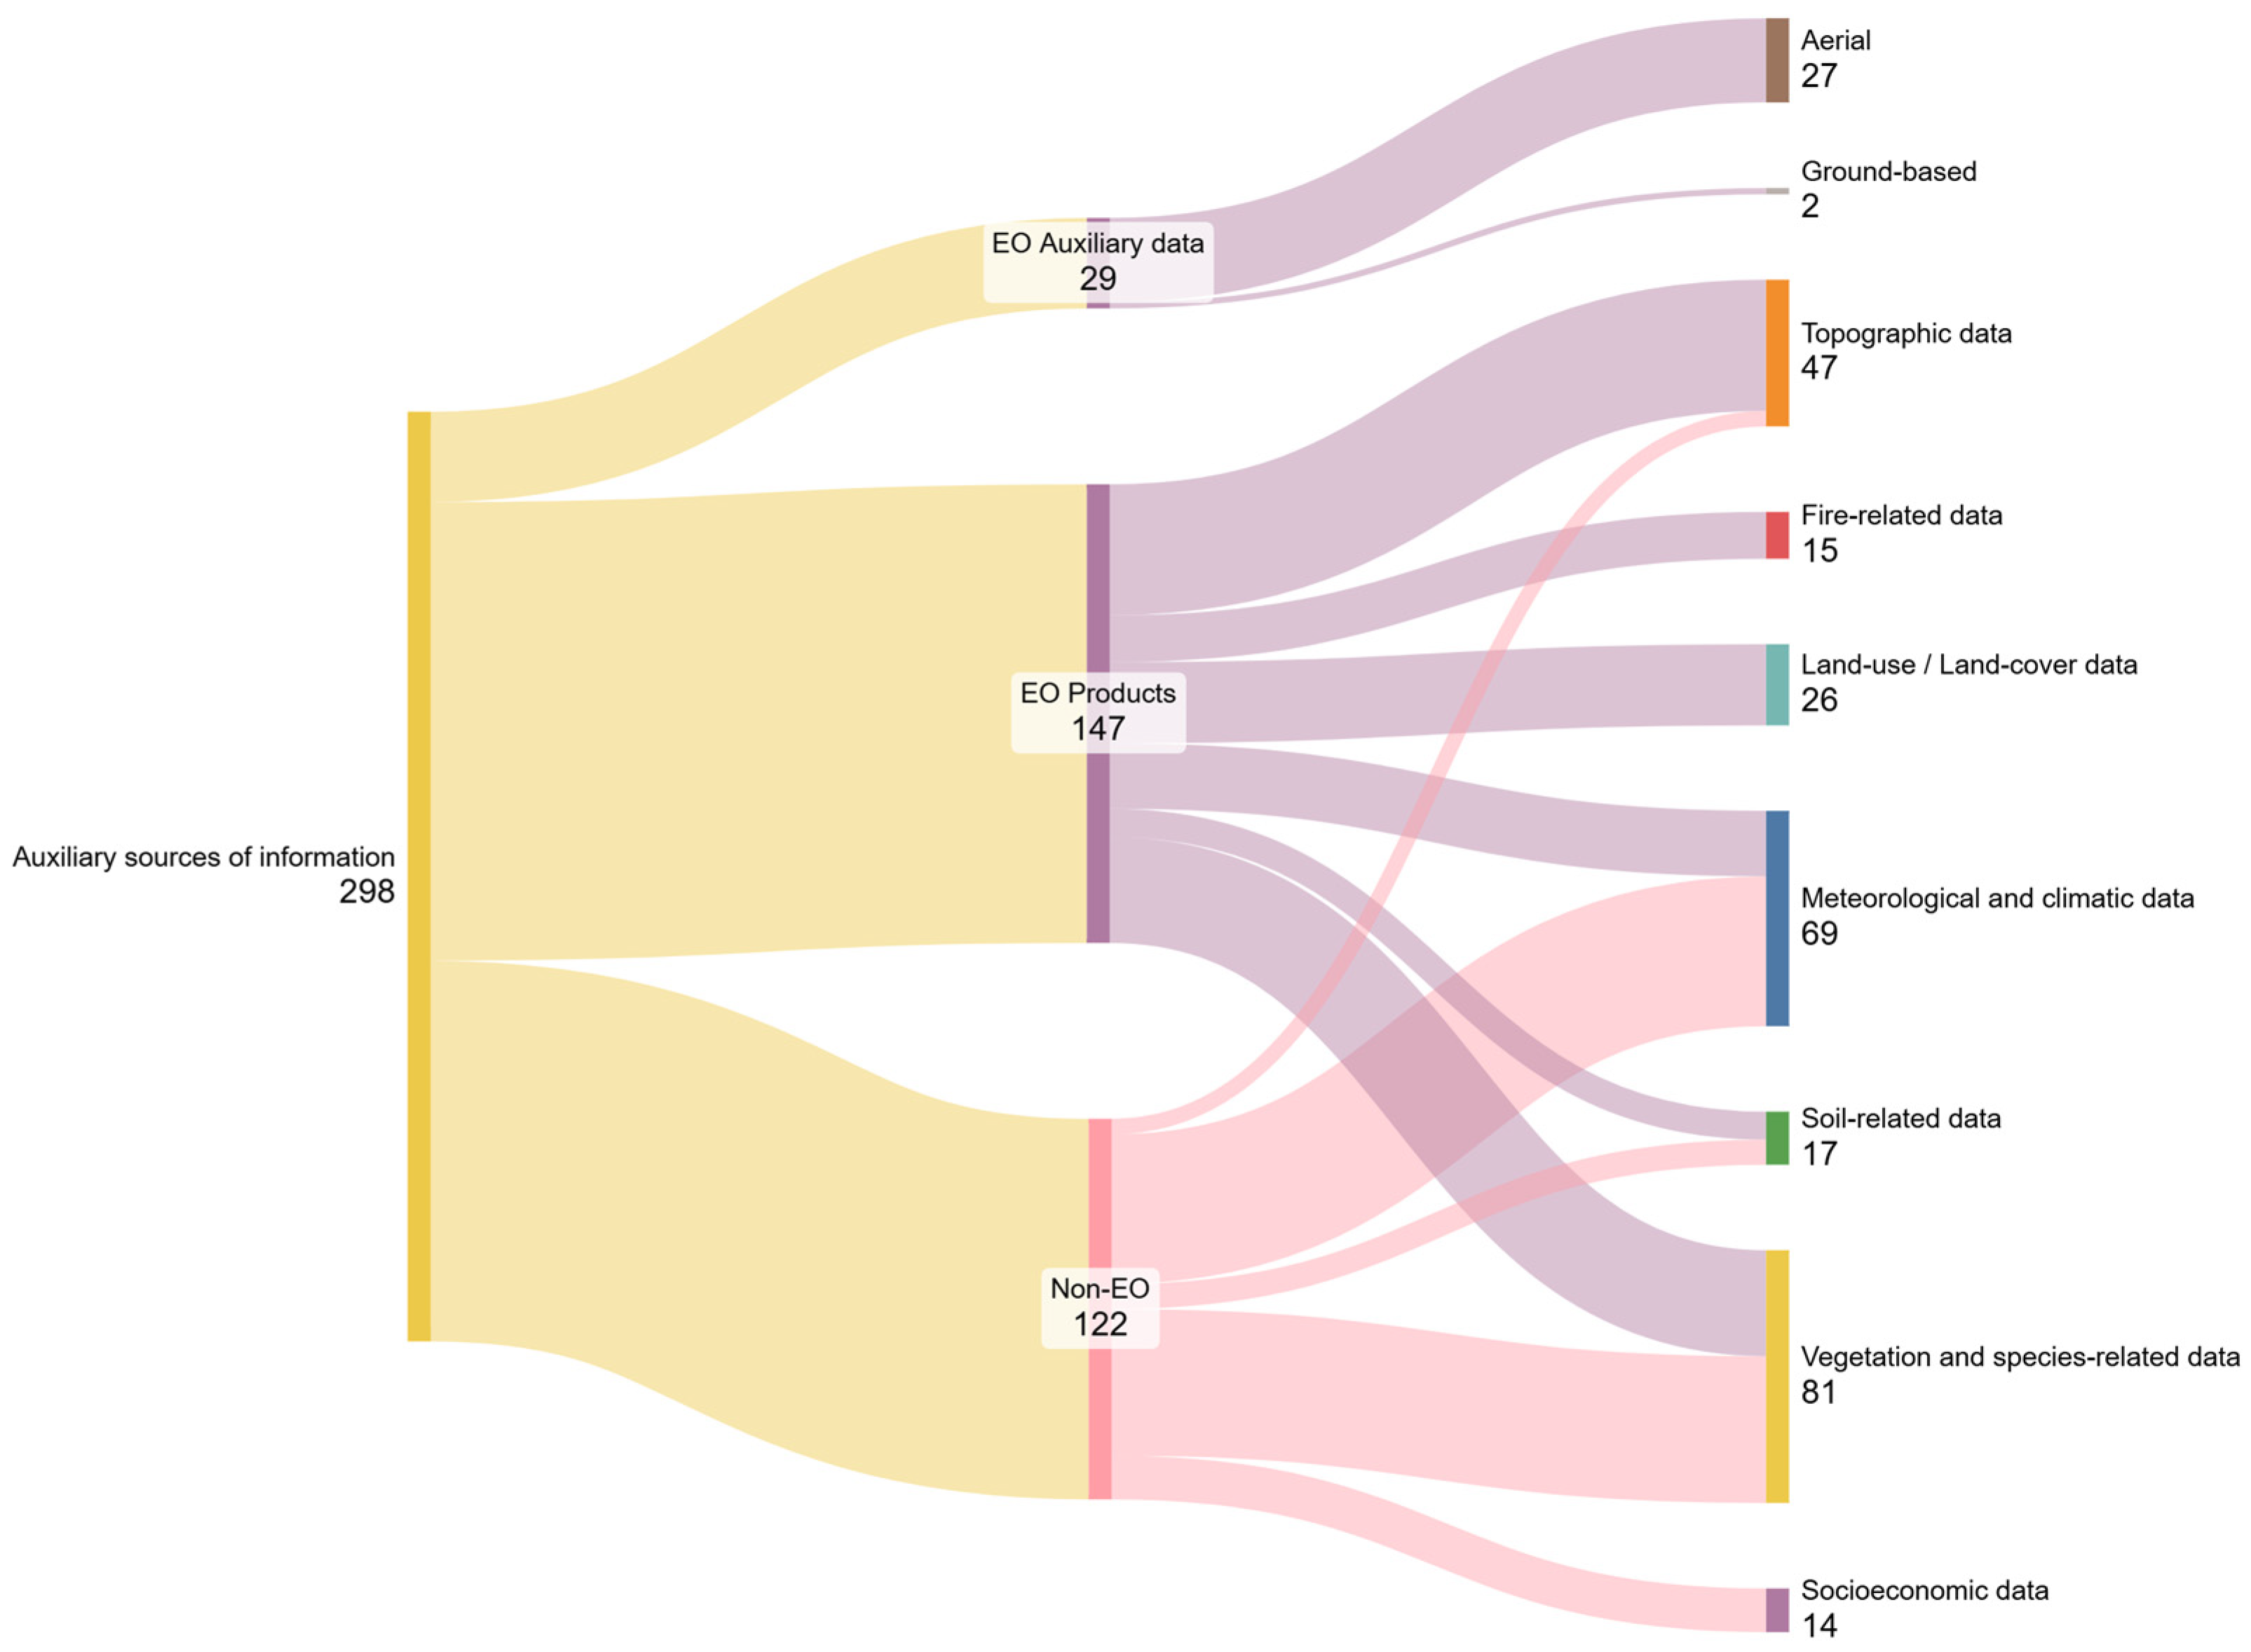
Datasets used for auxiliary purposes, such as pre-processing or validation, were categorized separately as “auxiliary sources of information”. These include reference datasets for validation and ancillary variables used in pre-processing or as model inputs, depending on the methodological design of each study. They are organized in three main groups: non-satellite EO data (aerial and ground-based), EO products (such as satellite-derived maps, climatic data, topographic data derived from EO data), and non-EO data (such as in situ field observations and socioeconomic data). Across the reviewed literature, a total of 298 references to auxiliary datasets were identified, distributed among the three major groups: non-satellite EO data (29 references), EO products (147 references), and non-EO data (122 references). These values represent the cumulative frequency of references across all studies rather than the number of unique datasets. Each instance in which a specific data source was reported was counted individually. This approach reflects the relative importance and recurrency of different data types, offering a clearer indication of how the auxiliary datasets are integrated into vegetation dynamics and post-disturbance monitoring studies. In Figure 6, a Sankey diagram visualizes the distribution of references across groups and their respective subgroups.
Aerial and ground-based EO datasets are particularly valuable for detecting subtle or early-stage disturbance signals that broader-scale satellite imagery may fail to capture. Aerial data include historical airphotos from national mapping campaigns [37,83,84], imagery acquired using Unmanned Aerial Vehicles (UAVs) equipped with optical sensors [54,85,86], and data derived from specialized airborne platforms such as the NEON Airborne Observation Platform (AOP) and airborne Light Detection and Ranging (lidar)-based instruments [76,85,87]. Ground-based EO data include terrestrial laser-scanning systems [86] and time-series imagery from phenological camera networks such as PhenoCam [64]. Together, these sources provide high-resolution structural and biophysical information for characterizing fine-scale vegetation properties, including canopy height, biomass, and vegetation heterogeneity.
EO-derived products serve a complementary analytical role in interpreting long-term vegetation health and disturbance dynamics. Climatic and meteorological variables, such as precipitation and temperature records [43,88], support the interpretation of phenology cycles, post-disturbance vegetation stress, and restoration-relevant conditions. Vegetation and species-related datasets, such as species distribution maps [65,70], habitat suitability layers [89,90], measures of biological richness [52], and forest-specific products such as cover, type, structure, volume, crown and height estimates [34,36,66,91,92,93], are used to support claims on species-specific sensitivities to different disturbance types.
Topography-related EO products include elevation models such as digital elevation models (DEMs), digital terrain models (DTMs), and digital surface models (DSMs) [67,79,94,95], along with derivatives such as slope and aspect [32,43,91,95]. Such data have been combined with optical and SAR EO missions, including MODIS, Landsat, Sentinel-1, and Sentinel-2 [68], to characterize land surface structure, vegetation moisture conditions, and disturbance dynamics across a range of atmospheric conditions. Soil-related data, including hydrological and soil indicators such as total water storage [43] and peat depth [58], are used to explain spatial patterns in disturbance intensity and subsequent recovery. Land use and land cover products (e.g., CORINE [96,97,98], MapBiomas [35], REDD+ [99]) are commonly employed to distinguish natural from human-modified land use. Fire-related datasets are used primarily for quantifying burn severity and assessing post-fire recovery.
Non-EO data complement EO-based analyses in disturbance-related vegetation dynamics studies by providing direct insight into local ecological conditions and supporting the validation of disturbance and recovery assessments. Meteorological records—mainly precipitation and temperature data—aid in understanding vegetation responses associated with short- and long-term climatic variability [32,41]. Non-EO soil-related data include soil samples and field measurements (such as electrical resistivity tomography (ERT) [98]), while vegetation and species-related datasets typically encompass species identification surveys and plot-level measurements of various ecosystem parameters [33,60,100], openly accessible forest inventory data and species conservation status data [37,59]. Another non-EO source would be socioeconomic data, based on sources such as local interviews and population records [39,49,51], which can be used to quantify the human impact on vegetation dynamics. Collectively, these datasets provide essential reference information for both the development of analytical models and the validation of EO-derived disturbance and recovery assessments in protected area monitoring.

3.1.5. Spectral Indices

A variety of spectral indices were identified in the reviewed literature (Table A1). They are mainly used for monitoring vegetation greenness and productivity, moisture- and water stress-related impacts, and fire impacts. The Normalized Difference Vegetation Index (NDVI) is the most frequently used, appearing in 28 studies across all disturbance types [38,65,101]. Its effectiveness in quantifying vegetation health, combined with its role as a reference metric for validating or comparing other spectral indices, makes it suitable for a wide range of vegetation dynamics applications, including restoration monitoring, where it is widely applied to track greenness decline or progressive vegetation recovery. The Normalized Burn Ratio (NBR) and its derivatives (dNBR, RBR) follow in frequency, appearing in 17 studies, reflecting their primary application in burn severity mapping and post-fire recovery monitoring [44,96,102]. The Normalized Difference Moisture Index (NDMI) is used across six studies, spanning different disturbance types, demonstrating its relevance in moisture-related vegetation monitoring, especially under drought conditions. The Normalized Difference Water Index (NDWI) appears in four studies, primarily related to human-impact and drought monitoring. Reflectance in the visible range is closely associated with chlorophyll absorption and photosynthetic activity, whereas near-infrared reflectance relates to leaf structure and canopy density, and shortwave infrared reflectance is strongly influenced by vegetation moisture content [103].

3.1.6. Validation Approaches

A distinct pattern emerges in the choice of validation datasets, with visual interpretation of high-resolution imagery remaining the most common approach across the reviewed studies [44,47,95,104]. Field-based observations, which provide direct measurements of vegetation condition, structure, and composition [37,84,85,100], are also frequently employed for validation.
On the contrary, readily available third-party products, such as Monitoring Trends in Burn Severity (MTBS), Brazilian deforestation map (PRODES), Copernicus Emergency Mapping Service (CEMS), MODIS Land Surface Temperature (MODIS LST), or National Ecological Observatory Network of the United States (NEON) products, are used less commonly [35,56,82,86,105]. Their use is most common in fire-, drought-, and deforestation-focused research, where global and regional products can potentially provide standardized reference information over extended areas. UAV-derived datasets are appearing within more recent studies as high-resolution validation sources [63,86,106], suggesting a growing preference for finer-scale validation datasets. Most studies rely heavily on widely accessible high-resolution imagery (typically Google Earth basemaps) or custom field datasets [47,59,77,83,93,98,107,108]. At the same time, readily available datasets remain underutilized.

3.2. Trends in Disturbances

Understanding how disturbances interact is essential for interpreting ecosystem dynamics in protected areas, as several studies demonstrate that one disturbance can trigger, intensify, or condition the effects of another. Across the reviewed literature, multiple studies explicitly analyze such disturbance interactions, revealing patterns that extend beyond single-driver impacts.
The most frequently documented interaction involves post-fire geomorphological processes, where wildfire-driven vegetation loss increases susceptibility to erosion, landslides, and soil displacement [22,41,64,109]. A second group of studies highlights post-fire biological responses, including insect outbreaks and invasive-species expansion, facilitated by canopy damage, reduced competition, or weakened host trees [12,26,35,43,52,57,97]. Interactions between drought and fire are also common, with drought intensifying fire severity, altering fuel conditions, or shaping post-fire recovery trajectories [11,38,46,51,80]. In human-affected landscapes, deforestation, logging, agricultural expansion, and infrastructure development frequently co-occur with secondary disturbances such as erosion, flooding, or increased fire susceptibility [18,23,26,30,53,56,58]. Meteorological drivers, including windthrow, snow dynamics, and extreme rainfall, are shown to compound biological or structural disturbances, for example by enabling bark-beetle outbreaks or modifying vegetation phenology and regeneration patterns [28,31,51,67,89,94].
Together, these studies underscore the importance of incorporating multi-disturbance interactions into protected area monitoring frameworks, as ecosystems often respond to disturbance sequences rather than isolated events. Trends were further examined across disturbance-level contexts.

3.2.1. Wildfires

Wildfire emerges as a recurring theme in 26 studies with study areas distributed globally. The most affected ecosystems include woodland and forest, and grassland [35,110]. Overall, wildfire-related studies can be broadly grouped into applications for burned area mapping, fire severity assessment, and post-fire recovery and vegetation regrowth monitoring.
The input data used are predominantly optical satellite data, with Landsat and Sentinel-2 collections being the most common. These datasets are frequently complemented by thermal measurements [35,82,111]. Temporal approaches include both bi-temporal change detection (pre- and post-fire comparison) and multi-temporal time-series analysis, depending on the study objectives [35,44,96,112]. Methodologically, studies adopt a range of approaches including time-series segmentation algorithms, supervised classification methods, object-based approaches, and deep learning frameworks [35,112]. Across these studies, spectral indices are consistently applied to assess burn severity, with a preference for NBR and its derivatives (dNBR, RBR) [44,96]. A smaller subset of studies incorporates custom resilience or vulnerability metrics, designed to quantify ecosystem response to fire disturbance [37]. Validation typically relies, among others, on a combination of field measurements [60], fire damage records by environmental agencies [35,111], and readily available high-resolution EO products [50,104]. A synthesis of the primary sensors, variables, analytical methods, and validation strategies identified across wildfire-related studies is presented in Table 3.

3.2.2. Droughts

Drought is analyzed across multiple protected areas worldwide and it is frequently examined in relation to other co-occurring disturbances [95,113]. The most affected ecosystems include woodland and forest, grassland, heathland and shrub, wetlands, and cropland. Drought monitoring studies rely predominantly on multi-annual time-series data. Commonly applied drought indicators include vegetation stress indices and precipitation or temperature anomalies [43,101,113].
Input data typically consist of long-term satellite imagery time-series for vegetation and climate variables, complemented by higher-resolution multispectral imagery when fine-scale vegetation dynamics are required. Gridded climate datasets and precipitation time-series, along with local meteorological station records, are incorporated, to capture climatic and meteorological drivers of vegetation stress [43,114]. Methodologically, drought studies employ time-series reconstruction approaches, temporal mixture modeling techniques, and modified vegetation indices designed to enhance sensitivity to moisture deficits [64,115]. Validation approaches can include rain gauges and ground water measurements [43], in situ biomass observations [100,113], lidar and orthophoto data [64], and correlation analyses with climatic datasets [43]. A synthesis of the primary sensors, variables, analytical methods, and validation strategies identified across drought-related studies is presented in Table 4.

3.2.3. Meteorological-Related Disturbances

Meteorological disturbances are minimally represented in the reviewed literature. Meteorological-related disturbances encompass wind-, snow-, and precipitation-related events, even though precipitation is more commonly studied as a driver for other disturbances [116], and wind is mentioned partly in erosion studies as a disturbance driver [38]. This category does not include drought as a meteorological disturbance, as it represents a slow-onset process, whereas the disturbances considered here are rapid-onset phenomena. Study areas span across Europe, USA, and China. The most affected ecosystem types include woodland and forest, sparsely vegetated land, grassland, and wetlands, predominantly within mountainous reserves [41,97]. Studies typically rely on multi-annual optical satellite imagery time-series, along with intra-annual observations to capture vegetation response to seasonal snow and precipitation dynamics, commonly using spectral indices such as the Normalized Difference Snow Index (NDSI) for snow patterns and NDVI for phenology and canopy gap mapping [117,118]. Optical satellite data is primarily used, typically for snow cover, vegetation condition and phenology detection, while SAR data is used for detecting structural changes associated with meteorologically driven disturbances. Gridded meteorological datasets and local meteorological station records are also employed, to analyze precipitation and snowmelt patterns and their effect on vegetation dynamics. Analytical approaches include spectral-index-based detection, principal component analysis (PCA), and regression-based phenology modeling [109,119]. Validation primarily relies on meteorological station records, airphotos, and field observations of snow depth and vegetation phenophases. A synthesis of the primary sensors, variables, analytical methods, and validation strategies identified across meteorological-related studies is presented in Table 5.

3.2.4. Biological Invasions

For the purposes of this review, insect outbreaks and invasive vegetation species have been combined into a single category of biological invasions, as their impacts on vegetation dynamics produce comparable effects, disturbing the health, structure and phenological cycles of vegetation [120,121]. These disturbances are documented globally and are often studied alongside recovery or habitat suitability modeling. The most affected ecosystem types are woodland and forest, and grassland, with urban forests also represented.
Studies on biological invasions employ a multi-scale monitoring approach, where the research objective dictates the required spatial resolution. Multi-annual time-series from medium-resolution multispectral sensors are typically used to track long-term invasion dynamics and landscape-level spread, whereas high-resolution satellite imagery or UAV/aerial data are integrated for intra-annual, fine-scale assessments such as individual tree crown detection and health mapping. Lower-resolution vegetation-monitoring products are utilized as well, to characterize ecosystem responses and recovery patterns following invasion events.
Methodologically, biological-invasion studies employ a diverse set of approaches, including supervised classification methods, species distribution modeling, instance-segmentation techniques, object-based image analysis pipelines, and optimal-control frameworks for management applications [70,90,94]. In addition, species presence data are employed in spectral mixture modeling approaches and suitability models [59,67]. Validation typically relies on in situ field measurements of biophysical parameters and vegetation structural traits [89,94]. A synthesis of the primary sensors, variables, analytical methods, and validation strategies identified across biological invasion-related studies is presented in Table 6.

3.2.5. Land Erosion and Landslides

Erosion- and landslide-related reviewed studies are mostly situated in boreal ecosystems, with these disturbances often examined alongside deforestation- or drought-related factors [122,123]. The most affected ecosystem types include woodland and forest, cropland, and grassland, with mountainous and watershed reserves being the primary settings. Study periods are typically multi-annual, with a small number of single-event and/or uni-temporal analyses. Commonly employed variables include vegetation condition spectral indices, terrain metrics and vegetation structural parameters [38,57,65,124].
Optical multispectral imagery is commonly used, primarily for erosion mapping, complemented by SAR and lidar data for landslide detection and characterization [125]. Climatic datasets and products are used to characterize erosivity drivers [65,124]. Validation approaches typically rely on field measurements and visual interpretation of high-resolution imagery [126]. A synthesis of the primary sensors, variables, analytical methods, and validation strategies identified across erosion and landslide-related studies is presented in Table 7.

3.2.6. Human Activity-Related Disturbances

Human-related disturbances are frequently examined in relation to deforestation [51,99,104,107,127]. Such disturbances are expressed through urban expansion, road construction, mining, tourism development and agriculture practices [86,106,127,128]. Human-related disturbances are studied across different geographic contexts with a notable concentration of studies in India, Nigeria, Cambodia, Indonesia, and China. The affected ecosystems include woodland and forest converted to cropland or urban land, and grassland or wetlands modified by infrastructure development (i.e., dams, tourism) [58,127]. Study periods typically rely on long-term change detection frameworks and multi-annual optical imagery time-series, with both bi-temporal and multi-temporal analyses applied, depending on the disturbance type and modeling objectives [98,127]. Input data primarily consist of medium-resolution multispectral imagery, while high-resolution satellite imagery is used for more precise mapping of human-induced landscape changes. Radar observations and lidar-derived elevation models are also incorporated for detecting changes in urban environment. Methodologically, studies employ hybrid visual and supervised classifications, object-based image analysis pipelines, and morphological spatial pattern analysis [63,98,127,129]. Validation approaches include field surveys, aerial imagery, and officially recognized authoritative/institutional datasets [63,98,129]. A synthesis of the primary sensors, variables, analytical methods, and validation strategies identified across human activity-related studies is presented in Table 8.

3.2.7. Deforestation

Across the reviewed studies, deforestation emerges predominantly as a human-driven disturbance outcome rather than a primary disturbance agent on its own. Within the 41 studies mentioning deforestation, 16 do not mention any other disturbance as they monitor deforestation alone. Such studies treat deforestation as a disturbance, focusing on mapping forest loss or directly monitoring clearing events [106,130]. Some key examples of deforestation agents in the collected literature are: agricultural expansion [47,93,104,128], illegal logging [66,77,129], settlement encroachment [48,107,131], and governance or policy failures [49,70,73]. Beyond human-induced deforestation, wildfire, erosion, and meteorological events are also recognized as important triggers of forest loss [42,44,81,86,108,124,132]. A synthesis of the primary sensors, variables, analytical methods, and validation strategies identified across deforestation-related studies is presented in Table 9.

4. Discussion

4.1. Findings and General Trends

The current remote sensing methodological advancements align with growing political and ecological demands for robust disturbance monitoring, as reflected in frameworks such as the EU Nature Restoration Regulation [133], the UN Sustainable Development Goals (such as SDG 13, 15) [2] and the Kunming–Montreal Global Biodiversity Framework [134]. These initiatives require transparent, repeatable, and spatially explicit monitoring of disturbance and recovery in protected areas. Operational EO programs such as NASA and Copernicus already provide ready-to-use data and tools that can support such monitoring [135,136,137,138], but their systematic integration into research and operational workflows is still emerging.
The global distribution of disturbance-related studies is uneven, with India, China, and the USA representing the most frequent study areas, while many countries in the Global South remain underrepresented. This pattern highlights the global relevance of forest-related disturbance research but also shows that scientific attention is set on a limited number of countries. It likely indicates the combined influence of research capacity, data availability, and the presence of large and/or highly threatened protected areas. Several other countries across Africa, Europe, Asia, North America, and South America appear in two to four studies, indicating that disturbance research spans all major world regions. Additionally, the presence of multi-country [86] and regional studies [56] suggests that some research approaches go beyond national boundaries. At the same time, the pronounced underrepresentation of the Global South is driven by deep asymmetric barriers, including critical research funding gaps, localized lack of high-performance processing hardware, cloud-cover data acquisition bottlenecks for passive optical sensors, and discrepancies in legislative funding structures for proactive protected area management [139,140]. Similarly, the strong focus on “woodland and forest”, with far fewer studies on other ecosystem types, suggests that remote sensing research over protected areas is largely forest-oriented [141]. The single study representing urban ecosystems suggests that remote sensing applications concerning protected areas and disturbances are predominantly implemented in natural or semi-natural ecosystems, as would be expected.
Across the reviewed studies, disturbance detection clearly dominates as the prevailing research theme, with limited attention given to explaining drivers, characterizing post-disturbance dynamics or modeling long-term ecosystem responses. This imbalance is reflected in the methodological distribution results, where disturbance modeling (n = 34) and recovery modeling (n = 23) appear far less frequently than detection-based approaches. This likely stems from the technical requirement for additional ecological data, more complex time-series analysis, and advanced computational frameworks these approaches demand. Consequently, a significant gap remains in predictive modeling and recovery research. Recovery-focused research is particularly limited as well, with only a small subset of studies examining post-disturbance vegetation recovery as a complex, multifaceted process. This reveals that while disturbance events can be detected and mapped in protected areas with adequate reliability, the capacity to understand and predict recovery patterns in order to support adaptive management and restoration planning remains limited [142].
Earlier studies (published between 2015 and 2020) rely predominantly on traditional statistical approaches such as regression-based trend analyses and maximum likelihood classifications. As the review period progresses toward 2025, more advanced analytical frameworks become increasingly common. Shallow ML methods are the primary approach in publications post-2020, with RF and SVMs being the standard tools for disturbance detection and attribution. Deep learning approaches are exclusively found in studies published after 2023, reflecting their recent adoption, likely due to the higher computational and large-scale data training dataset demands. Temporal analysis follows a similar trajectory: Time-series approaches appear at a highly increased rate after 2020, whereas bi-temporal analyses remain consistently used throughout the entire reviewed period, likely due to their relative simplicity and lower data requirements. Uni-temporal analysis appears only as a methodological outlier, employed in studies focused on structural mapping or method comparison, rather than disturbance-related vegetation dynamics.
Traditional statistical models (e.g., ordinary least squares, Mann–Kendall trend tests) offer low computational demands and strong mathematical transparency, making them highly effective for linear, multi-decadal baseline trend detection in stable forest environments [37,43]. Yet, their severe limitations in capturing non-linear ecological threshold collapses or interacting multi-sensor variables became apparent as monitoring demands expanded into highly fragmented/dynamic shrublands and croplands. This structural gap has likely driven the post-2020 acceleration towards shallow ML architectures (most notably Random Forest (RF) and Support Vector Machines (SVMs)). These shallow ML methods are remarkably adapted for complex non-linear classification and multi-modal data integration (optical combined with SAR), and work efficiently with relatively small training samples [45,47]. Their primary bottlenecks rest on their heavy dependence on manual, handcrafted feature engineering and a notable degradation in spatial contextual accuracy across expansive geographic regions. To overcome this, the period post-2023 signifies the popularization of deep learning (DL) systems, predominantly utilizing Convolutional Neural Networks (CNNs) and customized U-Net architectures [55,56]. DL architectures possess the distinct advantage of end-to-end automated feature extraction, capturing dense spatial and spatial–temporal structural dependencies across high-resolution matrices. They are uniquely suited for abrupt, irregular disturbance types such as sudden windthrows or storm boundaries. Nonetheless, their established integration within protected areas remains limited, relying on massive, accurately annotated ground-truth datasets, high computational overhead, and a general lack of interpretive physical transparency (“black box” limitations).
Regarding satellite imagery, openly accessible and temporally continuous datasets are preferred, with Landsat and MODIS dominating across the reviewed literature. High-resolution commercial satellite platforms are used selectively in site-specific studies. This pattern highlights the field’s reliance on long-term optical imagery for disturbance and recovery detection and modeling, while sensors offering structural and biophysical capabilities beyond those of broadband optical imagery, such as lidar, SAR, and hyperspectral systems, remain underused. The integration of multi-sensor data, combining optical imagery with structural data from spaceborne lidar systems such as GEDI, and radar-data from ESA’s BIOMASS mission, along with hyperspectral data from missions such as the Italian Space Agency’s PRISMA satellite, is expected to be a key methodological direction in the near future. Integrating diverse sensor datasets can provide essential information about ecological structural characteristics, forest density, biomass, and ecosystem responses to disturbances [143], strengthening ecological management and supporting more informed decision-making.
Optical, SAR, and LiDAR-enabled methods each capture different parts of how landscapes change. For fires, optical sensors are preferred for assessing immediate post-fire effects, such as canopy loss using spectral indices (e.g., dNBR) [37,44,96]. SARs are valuable in dense forest ecosystems (e.g., tropical regions). Moreover, LiDAR provides 3D structural measurements, being appropriate for biomass loss and recovery assessments [35,50,60,104,111]. For biological invasions, early (and often subtle) stress signals are identified most clearly in optical red-edge and SWIR bands, which are sensitive to moisture changes in vegetation. As invasions progress, SAR becomes more useful since it responds strongly to structural damage detection, such as defoliation and branch loss [70,89,90,94]. For drought monitoring, optical time-series are used to track patterns of canopy decline, while SAR can be applied to monitor canopy water content. LiDAR mainly captures the later, severe stages of drought, when trees begin to die back and their structure collapses [43,101,113,114].
In regard to disturbance types, vegetation dynamics monitoring related to wildfire disturbances benefits from a well-established methodological framework for burned area mapping, severity assessment, and recovery monitoring—a framework that is largely absent in other disturbance types. Drought studies typically rely on climate-related indices (VHI, SPI/SPEI, NDVI anomalies) and long-term time-series, as well as SAR-based products. Analyses are often limited to correlation approaches between remote sensing and meteorological variables, with fewer studies employing advanced modeling frameworks. Meteorological disturbances (wind, snow, precipitation) form a small but distinct group, mostly documented in mountainous protected areas. Biological-invasion studies commonly employ more advanced analysis methods, while erosion and landslides rely heavily on data related to terrain morphology. Human-related disturbances (with urban expansion, agriculture, logging, tourism, and mining being the most common) are typically studied in large-scale study areas and often co-occur with deforestation. A key conceptual insight is the overwhelming framing of deforestation as an outcome of other disturbances, especially of human-related ones (such as agricultural expansion, illegal logging, settlement expansion, and governance failures), rather than as a disturbance type in itself. In the broader literature, deforestation is typically conceptualized as a consequence of disturbance processes rather than a disturbance agent per se [50,95]. Only a small subset adopts a different framing, treating deforestation as a disturbance agent.
Observed patterns of disturbances within protected areas have been linked to broader socioeconomic processes and policy reforms [144]. In this sense, remote sensing does not merely document change and disturbances. It provides a quantitative basis for the evaluation of how policy decisions translate into ecological outcomes spatially and protected area management and conservation.

4.2. Emerging Remote Sensing Technologies and Analytical Frameworks for Vegetation Dynamics Monitoring

Building on the foundation of temporal processing advancements and multi-modal data use, the transition toward spatiotemporal data cubes and cloud-based processing platforms (e.g., Google Earth Engine, openEO) is expected to further enhance disturbance monitoring frameworks. Spatiotemporal data cubes, which organize EO data into consistent multi-dimensional structures, enable efficient long-term analysis of vegetation dynamics [145]. In parallel, cloud-based processing platforms facilitate scalable processing of large EO datasets, improving reproducibility and reducing computational constraints in global-scale monitoring applications [146]. These infrastructures enable the scalable organization of Earth Observation (EO) data into consistent multi-dimensional structures, facilitating the application of advanced time-series processing methods (e.g., BFAST, LandTrendr, CCDC) to detect subtle, long-term vegetation trajectories that were previously computationally restraining [147,148].
The growing use of Google Earth Engine (GEE) in disturbance-related remote sensing reflects how dense satellite time-series now enable advanced pre-processing workflows, such as cloud-free mosaics, median and seasonal composites, and harmonized multi-sensor archives, that help overcome persistent radiometric inconsistencies. Several of the reviewed studies demonstrate this shift, with almost a quarter (25 studies) of the reviewed literature mentioning GEE being employed for either pre-processing or processing purposes. For example, in post-earthquake vegetation recovery, GEE is used to assemble multi-year Landsat NDVI composites, allowing consistent tracking of regrowth despite strong temporal and sensor-related radiometric variation [34]. In erosion modeling, GEE’s cloud-computing environment can be used to generate stable reflectance layers and RUSLE inputs from heterogeneous datasets, illustrating how composite-based pre-processing supports spatiotemporal soil-erosion assessments [65]. Wildfire-related land cover classification uses medium-resolution (e.g., Sentinel-2) composites within GEE to harmonize imagery for RF and SVM classifiers, improving post-fire change detection [46]. It can also be utilized in long-term vegetation productivity analyses, to derive smoothed NDVI and productivity time-series [81], and leverage the multi-decadal Landsat archive to reconstruct vegetation transitions through temporal composites [117].
A key emerging frontier is the development of foundation models, which are large-scale AI models, pre-trained on diverse planetary-scale datasets, and can be fine-tuned to predict ecosystem changes with high adaptability across diverse ecosystems [149]. Moving beyond traditional statistical methods, shallow ML algorithms and other AI technologies, these models can process large volumes of complex data and predict future ecosystem changes or restoration indicators, enabling proactive responses to emerging ecological challenges [150]. For instance, Convolutional Neural Networks (CNNs) are designed to train on the spatial features that best describe the target class or variable [151], while Recurrent Neural Networks (RNNs), such as Long Short-Term Memory (LSTM), are applied to capture dense temporal dependencies in time-series monitoring [152,153]. These end-to-end learning pipelines reduce reliance on handcrafted features and enhance classification accuracy in complex vegetation dynamics. Such workflows minimize errors and temporal lags in the analytical framework, enabling a more comprehensive, consistent monitoring of vegetation dynamics over protected terrestrial ecosystems.
Earth Intelligence (EI) is the next stage in the monitoring process. It is also known as Environmental Intelligence, and is defined as the integration of Earth and social science knowledge to guide decisions, build capacity, and empower society to address environmental, societal, and economic challenges [154,155]. Transforming raw EO data and co-produced knowledge from local communities into actionable insights and operational tools through AI allows policymakers to test strategies prior to implementation. Fundamentally, EI establishes an integrated, inclusive, and insight-driven ecosystem that accelerates the comprehension and anticipation of environmental dynamics, thereby supporting the sustainable management of planetary change [156].

4.3. Lack of Standards in Data Use and Validation

Auxiliary datasets have been widely used as reference data for validation in vegetation dynamics research. Meteorological records, digital terrain models, UAV imagery, and in situ measurements aid in validation of satellite EO data. The vast majority of studies report some type of formal validation of their remote sensing processing methods, with a small minority—primarily studies that emphasize descriptive environmental change or conceptual analysis [87,109]—omitting validation entirely. However, the validation approaches vary substantially in terms of consistency and standardization. Most studies rely on visual interpretation of high-resolution imagery or small-scale field campaigns, which both limit transferability. While field campaigns provide valuable and reliable information on local vegetation conditions, they are typically limited to a spatial and temporal extent, lacking the standardization and accessibility of globally available reference products. A considerable number of publications implement formal accuracy assessments, including train–validation–test splits [55,56,130]. Overall, the dominance of visual interpretation of high-resolution imagery and the continued use of field-based validation suggest that validation is widely implemented, even if it is methodologically diverse.
Readily available reference products from institutional sources such as the EU’s Copernicus Emergency Mapping Service [138] are used in only a small number of the reviewed studies, despite offering standardized, accessible, and methodologically consistent validation sources. Even though they could enhance comparability and reproducibility across studies, they remain underutilized. Their underutilization constrains cross-study comparability and hinders the development of harmonized and standard disturbance metrics. Furthermore, the reviewed literature reveals a widespread absence of internal sensitivity analysis, where the potential errors and uncertainties inherent in the chosen validation datasets themselves are highlighted. Overall, validation is widely acknowledged in vegetation dynamics studies. At the same time, recent studies increasingly emphasize how the integration of reliable field observations can substantially strengthen modeling accuracy, although collecting such data on a large scale remains particularly demanding [157,158]. No single high-resolution reference product or methodological framework is universally adopted, with studies instead selecting approaches typically adapted to the specific methodological approach employed.
To bridge this gap and provide subsequent research with an operable, standardized validation scheme, we propose a tiered hierarchical validation framework:
Tier 1: Multi-Scale Geometric Alignment:
Future workflows should explicitly define the geographic scaling factor when pairing point-based field data or sub-meter UAV imagery with medium-resolution pixels (e.g., Sentinel, Landsat) to quantify sub-pixel heterogeneity and address any spatial mismatching errors [159].
Tier 2: Cross-Source Cross-Validation:
Whenever regional datasets like CEMS or MTBS are leveraged, they must be statistically cross-referenced against a stratified random sample of high-resolution aerial imagery (e.g., Google Earth Engine assets) to generate a localized confusion matrix and calculate dynamic confidence intervals rather than relying on a single static accuracy metric [160].
Tier 3: Standardized Uncertainty Reporting:
Every accuracy assessment must explicitly report three core metrics alongside traditional Overall Accuracy (OA)—User’s and Producer’s accuracies adjusted for area proportions—and an explicit spatial autocorrelation metric (such as Moran’s I) of the model residuals to identify regional validation biases, following internationally recognized good practice protocols for remote sensing error matrices [161,162].
Although EO data can still provide a reflection of field-measured diversity, even when the pixel size is larger than individual organisms or ecosystem characteristics [163], the literature emphasizes the limitations of remote sensing in capturing fine-scale ecological complexity, understory diversity, and qualitative differences in species composition [164]. Another recurring issue that is identified in the literature is the limited alignment between EO-based studies and standardized ecosystem typologies or ecosystem service nomenclature. Many studies employ generalized ecosystem categories, deviating from consistent nomenclature such as MAES levels, CORINE Land Cover classes, etc. This lack of standardization could be explained by the relatively recent formalization of ecosystem typologies within the SEEA EA framework, and the adoption of the IUCN Global Ecosystem Typology in 2022 and the EU Ecosystem Accounting Typology draft in 2021 [165]. These standards are increasingly employed, and therefore, future studies are expected to present greater consistency and comparability with one another, improving research evaluation across scales and regions.

4.4. Limitations of the Study

This systematic review was conducted using a structured PRISMA-aligned protocol, while applying the PSALSAR framework, yet several limitations should be acknowledged when interpreting the findings. For instance, the search strategy relied exclusively on one search engine, the Scopus database. Although it is comprehensive, it may not list all relevant studies, particularly government documents or grey literature commonly produced by conservation agencies. Consecutively, restricting the search to English-language-only publications may have excluded valuable studies conducted in non-English-speaking countries, thus potentially introducing a bias on the geographic distribution of the reviewed literature. This possibility of database bias may underrepresent research from regions with limited publication in international journals.
The search stage may have introduced numerous biases during the collection of the studies for reviewing. The temporal filter limiting publications to post-2015 ensures the inclusion of contemporary remote sensing approaches, though it excludes earlier foundational work that could provide essential historical context for disturbance monitoring in protected areas. Additionally, the strict inclusion criteria (requiring explicit specification of both disturbance type and protected area site) strengthened the precision of the review but inadvertently excludes broader disturbance-related vegetation dynamics studies. This may have biased the dataset towards studies with standardized and well-established reporting practices.
Although the data extraction followed a predefined protocol, the classification of ecosystem types, disturbance categories, and methodological approaches inevitably involved interpretive judgment. Variability in terminology and the absence of standardized nomenclature across studies may have resulted in classification inconsistencies. As far as methodology assessment is concerned, the heterogeneity of remote sensing methods, sensors, spatial and temporal resolutions, and analytical techniques applied across collected publications restricts the direct comparison of results across the reviewed studies. Despite these limitations, this review provides a comprehensive synthesis of the current remote sensing landscape in protected areas, offering a foundational framework upon which future systematic reviews and standardized monitoring protocols can be developed.

5. Conclusions

This review reaffirms that remote sensing has become indispensable to understanding disturbance-related vegetation dynamics in protected areas, yet important research gaps remain. Research activity is geographically and ecologically uneven, with a strong focus on a group of countries and on forest ecosystems, leaving many regions and non-forest protected ecosystems underrepresented. Disturbance detection dominates across the reviewed literature, while recovery processes and predictive modeling are less frequently studied, despite their importance for restoration and long-term ecosystem management.
Methodologically, the research field is transitioning from traditional statistical and bi-temporal approaches towards more advanced time-series analyses and ML methods, particularly in studies published after 2020. Multi-sensor integration, combining optical, radar-based, and lidar data, offers clear advantages and should be further expanded to visualize both structural and temporal complexity. However, a constraint hindering this progress is inconsistent validation practices. The broader adoption of standardized frameworks and open reference datasets is lacking, yet essential for improving reproducibility and comparability across studies.
Finally, this review suggests that disturbance monitoring must transition from simple change detection to more robust, process-based frameworks and further supports the claim that disturbance monitoring must align more closely with emerging policy frameworks and operational platforms, which are increasingly central to vegetation dynamics and restoration initiatives. By integrating the identification of specific disturbance agents directly into monitoring workflows, remote sensing assessments can provide more precise data for land management and ecological restoration within protected areas. The establishment of an integrated, multi-source framework that unites ecological and socioeconomic components within a remote sensing-enabled framework is necessary to facilitate long-term, sustainable biodiversity conservation, from knowledge production to operational implementation.

Supplementary Materials

The following supporting information can be downloaded at https://www.mdpi.com/article/10.3390/f17070853/s1. Table S1: PRISMA checklist. Table S2: Review protocol and classification framework.

Author Contributions

Conceptualization, G.M. and I.P.K.; methodology, I.M. (Ifigeneia Morfopoulou), G.M. and I.P.K.; formal analysis, I.M. (Ifigeneia Morfopoulou); data curation, I.M. (Ifigeneia Morfopoulou); writing—original draft preparation, I.M. (Ifigeneia Morfopoulou); writing—review and editing, G.M., I.M. (Ifigeneia Morfopoulou), I.P.K. and I.M. (Ioannis Mitsopoulos); visualization, I.M. (Ifigeneia Morfopoulou); supervision, G.M. All authors have read and agreed to the published version of the manuscript.

Funding

This research received no external funding.

Data Availability Statement

The dataset is available on request from the authors.

Acknowledgments

The authors have reviewed and edited the output and take full responsibility for the content of this publication.

Conflicts of Interest

The authors declare no conflicts of interest.

Abbreviations

The following abbreviations are used in this manuscript:
AIArtificial Intelligence
ALOSAdvanced Land Observing Satellite
ALSAirborne Laser Scanner
ANOVAAnalysis of Variance
ASTERAdvanced Spaceborne Thermal Emission and Reflection Radiometer
AVNIR-2Advanced Visible and Near-Infrared Radiometer-2
BFASTBreaks For Additive Season and Trend
CAPCommon Agricultural Policy
CCDCContinuous Change Detection and Classification
CEMSCopernicus Emergency Mapping Service
CHIRPSClimate Hazards Group InfraRed Precipitation with Station
CNNConvolutional Neural Network
COLDContinuous monitoring of Land Disturbance
CORINECoordination of Information on the Environment
DEMDigital Elevation Model
DLDeep Learning
dNBRDifferenced Normalized Burn Ratio
DSMDigital Surface Model
DTMDigital Terrain Model
EFFISEuropean Forest Fire Information System
EIEarth Intelligence
EOEarth Observation
EOFEmpirical Orthogonal Function
ERA5European Centre for Medium-Range weather forecasts, Reanalysis 5th version
ERTElectrical Resistivity Tomography
EUEuropean Union
EVIEnhanced Vegetation Index
FIFraction vegetation cover Index
FMIForest Moisture Index
GCVIGreen Chlorophyll Vegetation Index
GEDIGlobal Ecosystem Dynamics Investigation
GNDVIGreen Normalized Difference Vegetation Index
GOESGeostationary Operational Environmental Satellite
GVMIGlobal Vegetation Moisture Index
IPCCIntergovernmental Panel on Climate Change
IRSIndian Remote Sensing Satellite
IRS-LISSIndian Remote Sensing Satellite, Linear Imaging Self-Scanning Sensor
IUCNInternational Union for Conservation of Nature
LAILeaf Area Index
LSTLand Surface Temperature
LSTMLong Short-Term Memory
LSWILand Surface Water Index
LULCLand Use Land Cover
MAESMapping and Assessment of Ecosystems and their Services
MESMAMultiple Endmember Spectral Mixture Analysis
MLMachine Learning
MLCMaximum Likelihood Classification
MNDWIModified Normalized Difference Water Index
MODISModerate Resolution Imaging Spectroradiometer
MSIMoisture Stress Index
MSPAMorphological Spatial Pattern Analysis
MTBSMonitoring Trends in Burn Severity
NASANational Aeronautics and Space Administration of the USA
NBRNormalized Burn Ratio
NBRT1Normalized Burn Ratio Thermal 1
NDMINormalized Difference Moisture Index
NDSINormalized Difference Snow Index
NDVINormalized Difference Vegetation Index
NDWINormalized Difference Water Index
NEONNational Ecological Observatory Network
NEON AOPNational Ecological Observatory Network, Airborne Observation Platform
NIRNear-Infrared
NOAA AVHRRNational Oceanic and Atmospheric Administration of the USA,
Advanced Very High Resolution Radiometer
OBIAObject-Based Image Analysis
PAProtected Area
PADDDProtected Area Downgrading, Downsizing or Degazettement
PALSARPhased Array L-band Synthetic Aperture Radar
PCAPrincipal Component Analysis
PDEPartial Differential Equation
PRISMAPreferred Reporting Items for Systematic Reviews and Meta-Analyses
PROBA-VProject for On-Board Autonomy-Vegetation
PRODESPrograma de Cálculo do Desflorestamento da Amazônia
(Amazon Deforestation Calculation Program)
RBRRelativized Burn Ratio
RdNBRRelative differenced Normalized Burn Ratio
REDD+Reducing Emissions from Deforestation and Forest Degradation
(plus conservation, sustainable management, and carbon-stock enhancement)
RFRandom Forest
RGBRed–Green–Blue
RNNRecurrent Neural Network
SARSynthetic Aperture Radar
SAVISoil-Adjusted Vegetation Index
SDGSustainable Development Goal
SEEA-EASystem of Environmental-Economic Accounting–Ecosystem Accounting
SIWSIShortwave Infrared Water Stress Index
SMASpectral Mixture Analysis
SPEIStandardized Precipitation Evapotranspiration Index
SPIStandardized Precipitation Index
SPOTSatellite Pour l’Observation de la Terre (Satellite for Earth Observation)
SRSimple Ratio
SRTMShuttle Radar Topography Mission
ST-HANTSSpatioTemporal-Harmonic Analysis of Time Series
STRISmithsonian Tropical Research Institute
SVISpectral Vegetation Index
SVMSupport Vector Machine
SWIRShortwave Infrared
TCITemperature Condition Index
TITLE-ABS-KEYTitle–Abstract–Keywords
TSDITemperature and Soil Drought Index
TVDITemperature Vegetation Dryness Index
TVITransformed Vegetation Index
UAVUnmanned Aerial Vehicles
UK-DMC-2United Kingdom Disaster Monitoring Constellation-2
UNUnited Nations
USAUnited States of America
USGS 3DEPUnited States Geological Survey, 3D Elevation Program
V2FIREVegetation & Fire Information Retrieval Engine
VCIVegetation Condition Index
VDIVegetation Drought Index
VGGVisual Geometry Group
VHIVegetation Health Index
VHIrVegetation Health Index Revised
VIIRSVisible Infrared Imaging Radiometer Suite
VRAFVegetation Resilience After Fire
VSDIVegetation Supply Drought Index
wNDIIWeighted Normalized Difference Infrared Index
WRIWater Ratio Index

Appendix A

Table A1. Spectral vegetation indices identified in the reviewed literature, including abbreviations, formulas, associated disturbance themes, and representative references.
Index—Abv.FormulaEmployment in
Disturbances
Reference
Normalized Difference
Vegetation Index—NDVI
N D V I = N I R + R E D ( N I R R E D ) Wildfires, droughts,
meteorological-related, biological invasions,
erosion and landslides, human-related,
deforestation
[44]
Change in NDVI—ΔNDVI Δ N D V I = N D V I 2 N D V I 1 Wildfire,
erosion and landslides
[81]
Green NDVI—GNDVI G N D V I = N I R G r e e n ( N I R + G r e e n ) Deforestation[73]
Enhanced Vegetation
Index—EVI
E V I = 2.5 × N I R R E D ( N I R + 6 × R E D 7.5 × B L U E + 1 ) Wildfire[105]
Soil-Adjusted Vegetation
Index—SAVI
S A V I = 1.5 × N I R R E D ( N I R + R e d + 0.5 ) Drought,
meteorological-related
[38]
Simple Ratio—SR S R = N I R R E D Meteorological-related, biological invasions[118]
Transformed Vegetation
Index—TVI
T V I = N D V I + 0.5 Meteorological-related, biological invasions[118]
Spectral Vegetation
Index—SVI
S V I = N I R ( R E D + S W I R ) Wildfire, drought,
erosion and landslides
[166]
Fractional Vegetation Cover Index—Fraction Index (FI) F I = ( N D V I N D V I m i n ) ( N D V I m a x N D V I m i n ) Human-related,
deforestation
[132]
Green Chlorophyll
Vegetation Index—GCVI
G C V I = ( N I R / G r e e n ) 1 Human-related[129]
Leaf Area Index—LAI L A I = a × N D V I + b ( s e n s o r s p e c i f i c ) Human-related[129]
Normalized Difference Moisture Index—NDMI N D M I = ( N I R S W I R 1 ) ( N I R + S W I R 1 ) Wildfire, drought,
meteorological-related, biological invasions,
erosion and landslides
[125]
Moisture Stress Index—MSI M S I = S W I R 1 N I R Drought,
biological invasions
[114]
Global Vegetation Moisture Index—GVMI M S I = ( N I R + 0.1 ( S W I R 1 + 0.02 ) ( N I R + 0.1 + S W I R 1 + 0.02 ) Wildfire[111]
Forest Moisture Index—FMI F M I = N I R S W I R Meteorological-related, biological invasions[118]
Shortwave Infrared Water Stress Index—SIWSI S I W S I = ( S W I R N I R ) ( S W I R + N I R ) Wildfire[111]
Vegetation Health
Index—VHI
VCIi = ( N D V I i N D V I m i n ) ( N D V I m a x N D V I m i n )
LST = ( L S T d a y L S T n i g h t ) 2
TCI = ( L S T m a x L S T i ) ( L S T m a x L S T m i n )
VHI = a1 × VCI + a2 × ΔTCIi
Wildfire, drought[101]
Vegetation Health
Index (Revised)—VHIr
V H I r = 1 3 × V C I + 1 3 × T C I + 1 3 × D C I Wildfire, drought[113]
Vegetation Drought
Index—VDI
WCIi = ( N D W I i N D W I m i n ) ( N D W I m a x N D W I m i n )
ΔLST = LSTday − LSTnight
ΔTCiI = ( Δ L S T m a x Δ L S T i ) ( Δ L S T m a x Δ L S T m i n )
VDI = a1 × WCIi + a2 × ΔTCIi
Drought[101]
Vegetation Supply Drought Index—VSDI V S D I = ( R E D B L U E ) ( R E D + B L U E ) Drought[101]
Temperature Vegetation Dryness Index—TVDI T V D I = ( L S T L S T m i n ) ( L S T m a x L S T m i n ) Drought[101]
Temperature and Soil Drought Index—TSDIf(LST, NDVI, Soil Moisture)Drought[101]
Normalized
Burn Ratio—NBR
N B R = ( N I R S W I R 2 ) ( N I R + S W I R 2 ) Wildfire, drought[82]
Differenced NBR—dNBR d N B R = N B R p r e f i r e N B R p o s t f i r e Wildfire, human-related[110]
Relative
Differenced NBR—RdNBR
R d N B R = d N B R ( N B R p r e f i r e ) 0.5 Wildfire, human-related[83]
Relativized
Burn Ratio—RBR
R B R = d N B R ( N B R p r e f i r e + 1.001 ) Wildfire, human-related[96]
NBR Thermal 1—NBRT1 N B R T 1 = ( N I R S W I R 2 × T I R ) ( N I R + S W I R 2 × T I R ) Wildfire[102]
Normalized Difference
Water Index—NDWI
N D W I = ( N I R + S W I R ) ( N I R S W I R )
N D W I = ( G R E E N + N I R ) ( G R E E N N I R )
Drought, deforestation, human-related[75,101]
Modified NDWI—MNDWI M N D W I = ( G R E E N S W I R 1 ) ( G R E E N + S W I R 1 ) Drought, deforestation[73]
Land Surface
Water Index—LSWI
L S W I = ( N I R S W I R 1 ) ( N I R + S W I R 1 ) Wildfire, drought[105]
Water Ratio Index—WRI W R I = ( G R E E N + R E D ) ( N I R + S W I R ) Drought[88]
Weighted
Normalized Difference
Infrared Index—wNDII
w N D I I = ( N I R w × S W I R ) ( N I R + w × S W I R ) Meteorological-related, biological invasions[116]
Normalized Difference Snow Index—NDSI N D S I = ( G R E E N S W I R ) ( G R E E N + S W I R ) Meteorological-related[109]
Figure A1. This concentric ring chart illustrates the main methodological approaches identified in the reviewed studies. The outermost ring (blue) represents the distribution of processing algorithm types, the middle ring (orange) illustrates the temporal analysis approaches applied, and the innermost ring (green) depicts the unit of spatial analysis used. Each study was assigned to one primary category within each methodological dimension, allowing the results to be expressed as percentages of the total number of reviewed publications.
Forests 17 00853 g0a1

References

  1. Cole, L.E.S.; Bhagwat, S.A.; Willis, K.J. Recovery and Resilience of Tropical Forests after Disturbance. Nat. Commun. 2014, 5, 3906. [Google Scholar] [CrossRef] [Scilit]
  2. United Nations. Transforming Our World: The 2030 Agenda for Sustainable Development. Available online: https://sdgs.un.org/sites/default/files/publications/21252030%20Agenda%20for%20Sustainable%20Development%20web.pdf (accessed on 30 October 2025).
  3. European Commission. EU Biodiversity Strategy for 2030; European Commission: Brussels, Belgium, 2020. [Google Scholar]
  4. U.S. Securities and Exchange Commission. SEC Adopts Rules to Enhance and Standardize Climate-Related Disclosures for Investors. Available online: https://www.sec.gov/newsroom/press-releases/2024-31 (accessed on 30 October 2025).
  5. United Nations Environment Programme. African Green Stimulus Programme; United Nations Environment Programme: Nairobi, Kenya, 2020; Available online: https://wedocs.unep.org/xmlui/handle/20.500.11822/34409 (accessed on 30 October 2025).
  6. Ministry of Economy, Trade and Industry, Government of Japan. Green Growth Strategy Through Achieving Carbon Neutrality in 2050. Available online: https://www.meti.go.jp/english/policy/energy_environment/global_warming/ggs2050/index.html (accessed on 30 October 2025).
  7. Department of Climate Change, Energy, the Environment and Water, Australian Government. Australia’s Strategy for Nature 2024–2030; Department of Climate Change, Energy, the Environment and Water, Australian Government: Canberra, Australia, 2025.
  8. European Environment Agency. Designated Terrestrial Protected Areas in Europe. Available online: https://www.eea.europa.eu/en/analysis/indicators/terrestrial-protected-areas-in-europe (accessed on 2 April 2026).
  9. Geldmann, J.; Manica, A.; Burgess, N.D.; Coad, L.; Balmford, A. A Global-Level Assessment of the Effectiveness of Protected Areas at Resisting Anthropogenic Pressures. Proc. Natl. Acad. Sci. USA 2019, 116, 23209–23215. [Google Scholar] [CrossRef] [Scilit] [PubMed]
  10. Cook, C.N.; Valkan, R.S.; Mascia, M.B.; McGeoch, M.A. Quantifying the extent of protected-area downgrading, downsizing, and degazettement in Australia. Conserv. Biol. 2017, 31, 1039–1052. [Google Scholar] [CrossRef] [Scilit] [PubMed]
  11. Qin, S.; Golden Kroner, R.E.; Cook, C.; Tesfaw, A.T.; Braybrook, R.; Rodriguez, C.M.; Poelking, C.; Mascia, M.B. Protected Area Downgrading, Downsizing, and Degazettement as a Threat to Iconic Protected Areas. Conserv. Biol. 2019, 33, 1275–1285. [Google Scholar] [CrossRef] [Scilit] [PubMed]
  12. United Nations Environment Programme. Ecosystem Restoration for People, Nature and Climate: Becoming #GenerationRestoration; United Nations Environment Program: Nairobi, Kenya, 2021. [Google Scholar]
  13. Kwok, R. Ecology’s Remote-Sensing Revolution. Nature 2018, 556, 137–138. [Google Scholar] [CrossRef] [Scilit] [PubMed]
  14. Runting, R.K.; Phinn, S.; Xie, Z.; Venter, O.; Watson, J.E.M. Opportunities for Big Data in Conservation and Sustainability. Nat. Commun. 2020, 11, 2003. [Google Scholar] [CrossRef] [Scilit] [PubMed]
  15. de Almeida Pereira, G.H.; Fusioka, A.M.; Nassu, B.T.; Minetto, R. Active Fire Detection in Landsat-8 Imagery: A Large-Scale Dataset and a Deep-Learning Study. ISPRS J. Photogramm. Remote Sens. 2021, 178, 171–186. [Google Scholar] [CrossRef] [Scilit]
  16. Kim, J.; Popescu, S.C.; Lopez, R.R.; Wu, X.B.; Silvy, N.J. Vegetation Mapping of No Name Key, Florida Using Lidar and Multispectral Remote Sensing. Int. J. Remote Sens. 2020, 41, 9469–9506. [Google Scholar] [CrossRef] [Scilit]
  17. Mücher, C.A.; Hennekens, S.M.; Bunce, R.G.H.; Schaminée, J.H.J.; Schaepman, M.E. Modelling the Spatial Distribution of Natura 2000 Habitats across Europe. Landsc. Urban Plan. 2009, 92, 148–159. [Google Scholar] [CrossRef] [Scilit]
  18. Han, W.; Zheng, J.; Guan, J.; Liu, Y.; Liu, L.; Han, C.; Li, H.; Li, C.; Mao, X.; Tien, R. Assessment of Vegetation Drought Loss and Recovery in Central Asia Considering a Comprehensive Vegetation Index. Remote Sens. 2024, 16, 4189. [Google Scholar] [CrossRef] [Scilit]
  19. Bushra, N.; Rohli, R.V.; Lam, N.S.N.; Zou, L.; Mostafiz, R.B.; Mihunov, V. The Relationship between the Normalized Difference Vegetation Index and Drought Indices in the South Central United States. Nat. Hazards 2019, 96, 791–808. [Google Scholar] [CrossRef] [Scilit]
  20. Maillard, O.; Ribeiro, N.; Armstrong, A.; Ribeiro-Barros, A.I.; Andrew, S.M.; Amissah, L.; Shirvani, Z.; Muledi, J.; Abdi, O.; Azurduy, H.; et al. Seasonal Spatial-Temporal Trends of Vegetation Recovery in Burned Areas across Africa. PLoS ONE 2025, 20, e0316472. [Google Scholar] [CrossRef] [Scilit] [PubMed]
  21. Puletti, N.; Mattioli, W.; Bussotti, F.; Pollastrini, M. Monitoring the Effects of Extreme Drought Events on Forest Health by Sentinel-2 Imagery. J. Appl. Remote Sens. 2019, 13, 020501. [Google Scholar] [CrossRef] [Scilit]
  22. Sáenz, C.; Cicuéndez, V.; García, G.; Madruga, D.; Recuero, L.; Bermejo-Saiz, A.; Litago, J.; de la Calle, I.; Palacios-Orueta, A. New Insights on the Information Content of the Normalized Difference Vegetation Index Sentinel-2 Time Series for Assessing Vegetation Dynamics. Remote Sens. 2024, 16, 2980. [Google Scholar] [CrossRef] [Scilit]
  23. Borowiec, M.L.; Dikow, R.B.; Frandsen, P.B.; McKeeken, A.; Valentini, G.; White, A.E. Deep Learning as a Tool for Ecology and Evolution. Methods Ecol. Evol. 2022, 13, 1640–1660. [Google Scholar] [CrossRef] [Scilit]
  24. Yuan, Q.; Shen, H.; Li, T.; Li, Z.; Li, S.; Jiang, Y.; Xu, H.; Tan, W.; Yang, Q.; Wang, J.; et al. Deep Learning in Environmental Remote Sensing: Achievements and Challenges. Remote Sens. Environ. 2020, 241, 111716. [Google Scholar] [CrossRef] [Scilit]
  25. Emily Jones, M. LibGuides: Systematic Reviews: Step 1: Complete Pre-Review Tasks. Available online: https://guides.lib.unc.edu/systematic-reviews/pre-review (accessed on 19 January 2026).
  26. Mengist, W.; Soromessa, T.; Legese, G. Method for Conducting Systematic Literature Review and Meta-Analysis for Environmental Science Research. MethodsX 2020, 7, 100777. [Google Scholar] [CrossRef] [Scilit] [PubMed]
  27. United Nations Office for Disaster Risk Reduction Drought. Available online: https://www.undrr.org/understanding-disaster-risk/terminology/hips/mh0401 (accessed on 20 April 2026).
  28. Masson-Delmotte, V.; Zhai, P.; Pirani, A.; Connors, S.L.; Péan, C.; Berger, S.; Caud, N.; Chen, Y.; Goldfarb, L.; Gomis, M.I.; et al. (Eds.) IPCC AR6 Working Group 1: Summary for Policymakers. In Climate Change 2021: The Physical Science Basis. Contribution of Working Group I to the Sixth Assessment Report of the Intergovernmental Panel on Climate Change; Cambridge University Press: Cambridge, UK, 2021; Available online: https://www.ipcc.ch/report/ar6/wg1/chapter/summary-for-policymakers/ (accessed on 20 April 2026).
  29. FAO. Terms and Definitions, Forest Resources Assessment 2025. Available online: https://openknowledge.fao.org/server/api/core/bitstreams/a6e225da-4a31-4e06-818d-ca3aeadfd635/content (accessed on 5 February 2026).
  30. Maes, J.; Fabrega, N.; Zulian, G.; Barbosa, A.L.; Vizcaino, P.; Ivits, E.; Polce, C.; Vandecasteele, I.; Rivero, I.; Guerra, C.; et al. Mapping and Assessment of Ecosystems and Their Services: Trends in Ecosystems and Ecosystem Services in the European Union Between 2000 and 2010; Publications Office of the European Union: Luxembourg, 2015. [Google Scholar]
  31. Putzenlechner, B.; Koal, P.; Kappas, M.; Löw, M.; Mundhenk, P.; Tischer, A.; Wernicke, J.; Koukal, T. Towards Precision Forestry: Drought Response from Remote Sensing-Based Disturbance Monitoring and Fine-Scale Soil Information in Central Europe. Sci. Total Environ. 2023, 880, 163114. [Google Scholar] [CrossRef] [Scilit] [PubMed]
  32. Rubí, J.N.S.; Gondim, P.R.L. A Performance Comparison of Machine Learning Models for Wildfire Occurrence Risk Prediction in the Brazilian Federal District Region. Environ. Syst. Decis. 2024, 44, 351–368. [Google Scholar] [CrossRef] [Scilit]
  33. Honey-Rosés, J.; Maurer, M.; Ramírez, M.I.; Corbera, E. Quantifying Active and Passive Restoration in Central Mexico from 1986–2012: Assessing the Evidence of a Forest Transition. Restor. Ecol. 2018, 26, 1180–1189. [Google Scholar] [CrossRef] [Scilit]
  34. Pandey, H.P.; Gnyawali, K.; Dahal, K.; Pokhrel, N.P.; Maraseni, T.N. Vegetation Loss and Recovery Analysis from the 2015 Gorkha Earthquake (7.8 Mw) Triggered Landslides. Land Use Policy 2022, 119, 106185. [Google Scholar] [CrossRef] [Scilit]
  35. Da Costa, D.C.; Batista, L.V.; Da Silva, R.M.; Santos, C.A.G. Real-Time Active Fire Detection in the Pantanal Biome, Brazil, Using Convolutional Neural Networks. Fire Technol. 2025, 61, 3219–3240. [Google Scholar] [CrossRef] [Scilit]
  36. Mishkin, M.; Navarrete Pacheco, J.A. Rapid Assessment Remote Sensing of Forest Cover Change to Inform Forest Management: Case of the Monarch Reserve. Ecol. Indic. 2022, 137, 108729. [Google Scholar] [CrossRef] [Scilit]
  37. Peña-Molina, E.; Moya, D.; Marino, E.; Tomé, J.L.; Fajardo-Cantos, Á.; González-Romero, J.; Lucas-Borja, M.E.; De Las Heras, J. Fire Vulnerability, Resilience, and Recovery Rates of Mediterranean Pine Forests Using a 33-Year Time Series of Satellite Imagery. Remote Sens. 2024, 16, 1718. [Google Scholar] [CrossRef] [Scilit]
  38. Khatteli, A.; Tlili, A.; Chaieb, M.; Ouessar, M. Effects of Wind Erosion Control Measures on Vegetation Dynamics and Soil-Surface Materials through Field Observations and Vegetation Indices in Arid Areas, Southeastern Tunisia. Sustainability 2023, 15, 14256. [Google Scholar] [CrossRef] [Scilit]
  39. Kumi, S.; Nsiah, P.K.; Ahiabu, H.K.; Ofosu-bamfo, B.; Asigbaase, M.; Anning, A.K.; Amponsah, G. Forest Landscape Restoration-Induced Changes in Land Cover and Woody Plant Community Structure in a Degraded Forest Reserve in Ghana. Trees For. People 2024, 16, 100578. [Google Scholar] [CrossRef] [Scilit]
  40. Sutomo; Van Etten, E.J.B. Fire Impacts and Dynamics of Seasonally Dry Tropical Forest of East Java, Indonesia. Forests 2023, 14, 106. [Google Scholar] [CrossRef] [Scilit]
  41. Li, H.; Jiang, J.; Chen, B.; Li, Y.; Xu, Y.; Shen, W. Pattern of NDVI-Based Vegetation Greening along an Altitudinal Gradient in the Eastern Himalayas and Its Response to Global Warming. Environ. Monit. Assess. 2016, 188, 186. [Google Scholar] [CrossRef] [Scilit] [PubMed]
  42. Xia, N.; Tang, Y.; Tang, M.; Quan, W.; Xu, Z.; Zhang, B.; Xiao, Y.; Ma, Y. Monitoring and Evaluation of Vegetation Restoration in the Ebinur Lake Wetland National Nature Reserve under Lockdown Protection. Front. Plant Sci. 2024, 15, 1332788. [Google Scholar] [CrossRef] [Scilit] [PubMed]
  43. Ait Dhmane, L.; Saidi, M.E.; Moustadraf, J.; Rafik, A.; Hadri, A. Spatiotemporal Characterization and Hydrological Impact of Drought Patterns in Northwestern Morocco. Front. Water 2024, 6, 1463748. [Google Scholar] [CrossRef] [Scilit]
  44. Wu, Q.; Lee, C.K.F.; Wang, J.A.; Zhao, Y.; Song, G.; Maeda, E.E.; Su, Y.; Huete, A.; Hughes, A.C.; Wu, J. Improved Assessment of Post-Fire Recovery Trajectory of Forests in Amazon’s Protected Areas. Remote Sens. Environ. 2025, 326, 114802. [Google Scholar] [CrossRef] [Scilit]
  45. Janssen, T.A.J.; Ametsitsi, G.K.D.; Collins, M.; Adu-Bredu, S.; Oliveras, I.; Mitchard, E.T.A.; Veenendaal, E.M. Extending the Baseline of Tropical Dry Forest Loss in Ghana (1984–2015) Reveals Drivers of Major Deforestation inside a Protected Area. Biol. Conserv. 2018, 218, 163–172. [Google Scholar] [CrossRef] [Scilit]
  46. Tan, Y.-C.; Duarte, L.; Teodoro, A.C. Comparative Study of Random Forest and Support Vector Machine for Land Cover Classification and Post-Wildfire Change Detection. Land 2024, 13, 1878. [Google Scholar] [CrossRef] [Scilit]
  47. Naing Tun, Z.; Dargusch, P.; McMoran, D.; McAlpine, C.; Hill, G. Patterns and Drivers of Deforestation and Forest Degradation in Myanmar. Sustainability 2021, 13, 7539. [Google Scholar] [CrossRef] [Scilit]
  48. Opedes, H.; Mücher, S.; Baartman, J.E.M.; Nedala, S.; Mugagga, F. Land Cover Change Detection and Subsistence Farming Dynamics in the Fringes of Mount Elgon National Park, Uganda from 1978–2020. Remote Sens. 2022, 14, 2423. [Google Scholar] [CrossRef] [Scilit]
  49. Kusimi, J.M. Characterizing Land Disturbance in Atewa Range Forest Reserve and Buffer Zone. Land Use Policy 2015, 49, 471–482. [Google Scholar] [CrossRef] [Scilit]
  50. Shah, R.K.; Shah, R.K. Forest Cover Change Detection Using Remote Sensing and GIS in Dibru-Saikhowa National Park, Assam: A Spatio-Temporal Study. Proc. Natl. Acad. Sci. India Sect. B Biol. Sci. 2023, 93, 559–564. [Google Scholar] [CrossRef] [Scilit]
  51. Adhikari, S.; Southworth, J.; Nagendra, H. Understanding Forest Loss and Recovery: A Spatiotemporal Analysis of Land Change in and Around Bannerghatta National Park, India. J. Land Use Sci. 2015, 10, 402–424. [Google Scholar] [CrossRef] [Scilit]
  52. Gupta, S.; Roy, A.; Bhavsar, D.; Kala, R.; Singh, S.; Kumar, A.S. Forest Fire Burnt Area Assessment in the Biodiversity Rich Regions Using Geospatial Technology: Uttarakhand Forest Fire Event 2016. J. Indian Soc. Remote Sens. 2018, 46, 945–955. [Google Scholar] [CrossRef] [Scilit]
  53. Manaswini, G.; Sudhakar Reddy, C. Geospatial Monitoring and Prioritization of Forest Fire Incidences in Andhra Pradesh, India. Environ. Monit. Assess. 2015, 187, 616. [Google Scholar] [CrossRef] [Scilit] [PubMed]
  54. Sagang, L.B.T.; Ploton, P.; Viennois, G.; Féret, J.-B.; Sonké, B.; Couteron, P.; Barbier, N. Monitoring Vegetation Dynamics with Open Earth Observation Tools: The Case of Fire-Modulated Savanna to Forest Transitions in Central Africa. ISPRS J. Photogramm. Remote Sens. 2022, 188, 142–156. [Google Scholar] [CrossRef] [Scilit]
  55. Huang, B.; Yi, X.; Mo, L.; Wang, G.; Wu, P. CCE-UNet: Forest and Water Body Coverage Detection Method Based on Deep Learning: A Case Study in Australia’s Nattai National Forest. Forests 2024, 15, 2050. [Google Scholar] [CrossRef] [Scilit]
  56. McCallum, I.; Walker, J.; Fritz, S.; Grau, M.; Hannan, C.; Hsieh, I.-S.; Lape, D.; Mahone, J.; McLester, C.; Mellgren, S.; et al. Crowd-Driven Deep Learning Tracks Amazon Deforestation. Remote Sens. 2023, 15, 5204. [Google Scholar] [CrossRef] [Scilit]
  57. Van Coillie, F.; Delaplace, K.; Gabriels, D.; De Smet, K.; Ouessar, M.; Belgacem, A.O.; Taamallah, H.; De Wulf, R. Monotemporal Assessment of the Population Structure of Acacia tortilis (Forssk.) Hayne ssp. raddiana (Savi) Brenan in Bou Hedma National Park, Tunisia: A Terrestrial and Remote Sensing Approach. J. Arid Environ. 2016, 129, 80–92. [Google Scholar] [CrossRef] [Scilit]
  58. Atwood, E.C.; Englhart, S.; Lorenz, E.; Halle, W.; Wiedemann, W.; Siegert, F. Detection and Characterization of Low Temperature Peat Fires during the 2015 Fire Catastrophe in Indonesia Using a New High-Sensitivity Fire Monitoring Satellite Sensor (FireBird). PLoS ONE 2016, 11, e0159410. [Google Scholar] [CrossRef] [Scilit] [PubMed]
  59. Dai, J.; Roberts, D.A.; Stow, D.A.; An, L.; Hall, S.J.; Yabiku, S.T.; Kyriakidis, P.C. Mapping Understory Invasive Plant Species with Field and Remotely Sensed Data in Chitwan, Nepal. Remote Sens. Environ. 2020, 250, 112037. [Google Scholar] [CrossRef] [Scilit]
  60. Saulino, L.; Rita, A.; Migliozzi, A.; Maffei, C.; Allevato, E.; Garonna, A.P.; Saracino, A. Detecting Burn Severity across Mediterranean Forest Types by Coupling Medium-Spatial Resolution Satellite Imagery and Field Data. Remote Sens. 2020, 12, 741. [Google Scholar] [CrossRef] [Scilit]
  61. Spasojevic, M.J.; Bahlai, C.A.; Bradley, B.A.; Butterfield, B.J.; Tuanmu, M.; Sistla, S.; Wiederholt, R.; Suding, K.N. Scaling up the Diversity–Resilience Relationship with Trait Databases and Remote Sensing Data: The Recovery of Productivity after Wildfire. Glob. Change Biol. 2016, 22, 1421–1432. [Google Scholar] [CrossRef] [Scilit] [PubMed]
  62. Xu, C.; Qu, J.J.; Hao, X.; Zhu, Z.; Gutenberg, L. Surface Soil Temperature Seasonal Variation Estimation in a Forested Area Using Combined Satellite Observations and In-Situ Measurements. Int. J. Appl. Earth Obs. Geoinf. 2020, 91, 102156. [Google Scholar] [CrossRef] [Scilit]
  63. Hasan, M.E.; Zhang, L.; Mahmood, R.; Guo, H.; Li, G. Modeling of Forest Ecosystem Degradation Due to Anthropogenic Stress: The Case of Rohingya Influx into the Cox’s Bazar–Teknaf Peninsula of Bangladesh. Environments 2021, 8, 121. [Google Scholar] [CrossRef] [Scilit]
  64. Sousa, D.; Davis, F.W. Scalable Mapping and Monitoring of Mediterranean-Climate Oak Landscapes with Temporal Mixture Models. Remote Sens. Environ. 2020, 247, 111937. [Google Scholar] [CrossRef] [Scilit]
  65. Stefanidis, S.; Alexandridis, V.; Ghosal, K. Assessment of Water-Induced Soil Erosion as a Threat to Natura 2000 Protected Areas in Crete Island, Greece. Sustainability 2022, 14, 2738. [Google Scholar] [CrossRef] [Scilit]
  66. Reddy, C.S.; Saranya, K.R.L.; Jha, C.S.; Dadhwal, V.K.; Murthy, Y.V.N.K. Earth Observation Data for Habitat Monitoring in Protected Areas of India. Remote Sens. Appl. Soc. Environ. 2017, 8, 114–125. [Google Scholar] [CrossRef] [Scilit]
  67. Latifi, H.; Dahms, T.; Beudert, B.; Heurich, M.; Kübert, C.; Dech, S. Synthetic RapidEye Data Used for the Detection of Area-Based Spruce Tree Mortality Induced by Bark Beetles. GIScience Remote Sens. 2018, 55, 839–859. [Google Scholar] [CrossRef] [Scilit]
  68. Linlin, W.; Mingchang, W.; Jiatao, D.; Jingzheng, Z.; Fengyan, W. Monitoring of Larch Caterpillar (Dendrolimus superans) Infestation Dynamics Using Time-Series Sentinel Images in Changbai Mountains National Nature Reserve, Northeast China. Chin. Geogr. Sci. 2025, 35, 737–754. [Google Scholar] [CrossRef] [Scilit]
  69. López, J.; Qian, Y.; Murillo-Sandoval, P.J.; Clerici, N.; Eklundh, L. Landscape Connectivity Loss after the De-Escalation of Armed Conflict in the Colombian Amazon (2011–2021). Glob. Ecol. Conserv. 2024, 54, e03094. [Google Scholar] [CrossRef] [Scilit]
  70. Baker, C.M.; Blonda, P.; Casella, F.; Diele, F.; Marangi, C.; Martiradonna, A.; Montomoli, F.; Pepper, N.; Tamborrino, C.; Tarantino, C. Using Remote Sensing Data within an Optimal Spatiotemporal Model for Invasive Plant Management: The Case of Ailanthus Altissima in the Alta Murgia National Park. Sci. Rep. 2023, 13, 14587. [Google Scholar] [CrossRef] [Scilit] [PubMed]
  71. Dutta, K.; Reddy, C.S. Geospatial Analysis of Reed Bamboo (Ochlandra travancorica) Invasion in Western Ghats, India. J. Indian Soc. Remote Sens. 2016, 44, 699–711. [Google Scholar] [CrossRef] [Scilit]
  72. Satish, K.V.; Reddy, C.S. Long Term Monitoring of Forest Fires in Silent Valley National Park, Western Ghats, India Using Remote Sensing Data. J. Indian Soc. Remote Sens. 2016, 44, 207–215. [Google Scholar] [CrossRef] [Scilit]
  73. Morin, N.; Masse, A.; Sannier, C.; Siklar, M.; Kiesslich, N.; Sayadyan, H.; Faucqueur, L.; Seewald, M. Development and Application of Earth Observation Based Machine Learning Methods for Characterizing Forest and Land Cover Change in Dilijan National Park of Armenia between 1991 and 2019. Remote Sens. 2021, 13, 2942. [Google Scholar] [CrossRef] [Scilit]
  74. Smith, I.; Velasquez, E.; Pickering, C. Quantifying Potential Effect of 2019 Fires on National Parks and Vegetation in South-East Queensland. Ecol. Manag. Restor. 2021, 22, 160–170. [Google Scholar] [CrossRef] [Scilit]
  75. Handayani, H.H.; Murayama, Y.; Ranagalage, M.; Liu, F.; Dissanayake, D. Geospatial Analysis of Horizontal and Vertical Urban Expansion Using Multi-Spatial Resolution Data: A Case Study of Surabaya, Indonesia. Remote Sens. 2018, 10, 1599. [Google Scholar] [CrossRef] [Scilit]
  76. Singh, M.; Evans, D.; Chevance, J.; Tan, B.S.; Wiggins, N.; Kong, L.; Sakhoeun, S. Evaluating the Ability of Community-protected Forests in Cambodia to Prevent Deforestation and Degradation Using Temporal Remote Sensing Data. Ecol. Evol. 2018, 8, 10175–10191. [Google Scholar] [CrossRef] [Scilit] [PubMed]
  77. Onojeghuo, A.; Onojeghuo, A. Protected Area Monitoring in the Niger Delta Using Multi-Temporal Remote Sensing. Environments 2015, 2, 500–520. [Google Scholar] [CrossRef] [Scilit]
  78. Khemiri, L.; Sammali, H.; Katlane, R.; Khelil, M.; Ghanmi, M. Multi-Temporal and Multi-Sensor Approach for Land Use Mapping: Application to Irrigated Crops in the Lower Mejerda Valley (Northeast Tunisia). Euro-Mediterr. J. Environ. Integr. 2025, 10, 765–777. [Google Scholar] [CrossRef] [Scilit]
  79. Freeman, J.; Edwards, A.; Russell-Smith, J. Fire-Driven Decline of Endemic Allosyncarpia Monsoon Rainforests in Northern Australia. Forests 2017, 8, 481. [Google Scholar] [CrossRef] [Scilit]
  80. Prior, L.D.; Whiteside, T.G.; Williamson, G.J.; Bartolo, R.E.; Bowman, D.M.J.S. Multi-decadal Stability of Woody Cover in a Mesic Eucalypt Savanna in the Australian Monsoon Tropics. Austral Ecol. 2020, 45, 621–635. [Google Scholar] [CrossRef] [Scilit]
  81. Baldo, M.; Buldrini, F.; Chiarucci, A.; Rocchini, D.; Zannini, P.; Ayushi, K.; Ayyappan, N. Remote Sensing Analysis on Primary Productivity and Forest Cover Dynamics: A Western Ghats India Case Study. Ecol. Inform. 2023, 73, 101922. [Google Scholar] [CrossRef] [Scilit]
  82. Yilgan, F.; Miháliková, M.; Kara, R.S.; Ustuner, M. Analysis of the Forest Fire in the ‘Bohemian Switzerland’ National Park Using Landsat-8 and Sentinel-5P in Google Earth Engine. Nat. Hazards 2025, 121, 6133–6154. [Google Scholar] [CrossRef] [Scilit]
  83. Zhao, F.; Meng, R.; Huang, C.; Zhao, M.; Zhao, F.; Gong, P.; Yu, L.; Zhu, Z. Long-Term Post-Disturbance Forest Recovery in the Greater Yellowstone Ecosystem Analyzed Using Landsat Time Series Stack. Remote Sens. 2016, 8, 898. [Google Scholar] [CrossRef] [Scilit]
  84. Blanco-Sacristán, J.; Guirado, E.; Molina-Pardo, J.L.; Cabello, J.; Giménez-Luque, E.; Alcaraz-Segura, D. Remote Sensing-Based Monitoring of Postfire Recovery of Persistent Shrubs: The Case of Juniperus Communis in Sierra Nevada (Spain). Fire 2022, 6, 4. [Google Scholar] [CrossRef] [Scilit]
  85. Aspinall, J.; Chasmer, L.; Coburn, C.A.; Hopkinson, C. Post-Fire Vegetation Regeneration During Abnormally Dry Years Following Severe Montane Fire: Southern Alberta, Canada. For. Ecol. Manag. 2025, 587, 122750. [Google Scholar] [CrossRef] [Scilit]
  86. Welsink, A.-J.; Dupuis, C.; Cue La Rosa, L.; Weghorst, M.; Van Der Zee, J.; Van Der Woude, S.; Peña-Claros, M.; Herold, M.; Fesenmyer, K.; Reiche, J. Monitoring Fine-Scale Natural and Logging-Related Tropical Forest Degradation Using Sentinel-1. Remote Sens. Environ. 2025, 328, 114878. [Google Scholar] [CrossRef] [Scilit]
  87. Hankin, L.E.; Crumrine, S.A.; Anderson, C.T. Impacts of Mega Drought in Fire-Prone Montane Forests and Implications for Forest Management. For. Ecol. Manag. 2024, 564, 122010. [Google Scholar] [CrossRef] [Scilit]
  88. Chiloane, C.; Dube, T.; Shoko, C. Monitoring and Assessment of the Seasonal and Inter-Annual Pan Inundation Dynamics in the Kgalagadi Transfrontier Park, Southern Africa. Phys. Chem. Earth Parts A/B/C 2020, 118–119, 102905. [Google Scholar] [CrossRef] [Scilit]
  89. Makobe, B.; Mhangara, P.; Gidey, E.; Kganyago, M. Monitoring the Invasion of Campuloclinium macrocephalum (Less) DC Plants Using a Novel MaxEnt and Machine Learning Ensemble in the Cradle Nature Reserve, South Africa. Environ. Syst. Res. 2024, 13, 24. [Google Scholar] [CrossRef] [Scilit]
  90. Sittaro, F.; Hutengs, C.; Vohland, M. Which Factors Determine the Invasion of Plant Species? Machine Learning Based Habitat Modelling Integrating Environmental Factors and Climate Scenarios. Int. J. Appl. Earth Obs. Geoinf. 2023, 116, 103158. [Google Scholar] [CrossRef] [Scilit]
  91. Huettermann, S.; Jones, S.; Soto-Berelov, M.; Hislop, S. Exploring the Influence of Forest Tenure and Protection Status on Post-Fire Recovery in Southeast Australia. Forests 2023, 14, 1098. [Google Scholar] [CrossRef] [Scilit]
  92. Martin, M.; Cerrejón, C.; Valeria, O. Complementary Airborne LiDAR and Satellite Indices Are Reliable Predictors of Disturbance-Induced Structural Diversity in Mixed Old-Growth Forest Landscapes. Remote Sens. Environ. 2021, 267, 112746. [Google Scholar] [CrossRef] [Scilit]
  93. Reddy, C.S.; Manaswini, G.; Satish, K.V.; Singh, S.; Jha, C.S.; Dadhwal, V.K. Conservation Priorities of Forest Ecosystems: Evaluation of Deforestation and Degradation Hotspots Using Geospatial Techniques. Ecol. Eng. 2016, 91, 333–342. [Google Scholar] [CrossRef] [Scilit]
  94. Carnegie, A.J.; Eslick, H.; Barber, P.; Nagel, M.; Stone, C. Airborne Multispectral Imagery and Deep Learning for Biosecurity Surveillance of Invasive Forest Pests in Urban Landscapes. Urban For. Urban Green. 2023, 81, 127859. [Google Scholar] [CrossRef] [Scilit]
  95. Hong, F.; Hedges, S.B.; Yang, Z.; Suh, J.W.; Qiu, S.; Timyan, J.; Zhu, Z. Decoding Primary Forest Changes in Haiti and the Dominican Republic Using Landsat Time Series. Remote Sens. Environ. 2025, 318, 114590. [Google Scholar] [CrossRef] [Scilit]
  96. Dosiou, A.; Athinelis, I.; Katris, E.; Vassalou, M.; Kyrkos, A.; Krassakis, P.; Parcharidis, I. Employing Copernicus Land Service and Sentinel-2 Satellite Mission Data to Assess the Spatial Dynamics and Distribution of the Extreme Forest Fires of 2023 in Greece. Fire 2024, 7, 20. [Google Scholar] [CrossRef] [Scilit]
  97. Falťan, V.; Petrovič, F.; Gábor, M.; Šagát, V.; Hruška, M. Mountain Landscape Dynamics after Large Wind and Bark Beetle Disasters and Subsequent Logging—Case Studies from the Carpathians. Remote Sens. 2021, 13, 3873. [Google Scholar] [CrossRef] [Scilit]
  98. Imbrenda, V.; Coluzzi, R.; Lanfredi, M.; Loperte, A.; Satriani, A.; Simoniello, T. Analysis of Landscape Evolution in a Vulnerable Coastal Area under Natural and Human Pressure. Geomat. Nat. Hazards Risk 2018, 9, 1249–1279. [Google Scholar] [CrossRef] [Scilit]
  99. Phiri, D.; Morgenroth, J.; Xu, C. Long-Term Land Cover Change in Zambia: An Assessment of Driving Factors. Sci. Total Environ. 2019, 697, 134206. [Google Scholar] [CrossRef] [Scilit] [PubMed]
  100. Savinelli, B.; Panigada, C.; Tagliabue, G.; Vignali, L.; Gentili, R.; Fassnacht, F.E.; Padoa-Schioppa, E.; Rossini, M. Monitoring Functional Traits of Complex Temperate Forests Using Sentinel-2 Data during a Severe Drought Period. Sci. Total Environ. 2024, 957, 177428. [Google Scholar] [CrossRef] [Scilit] [PubMed]
  101. Omidvar, K.; Nabavizadeh, M.; Rousta, I.; Olafsson, H. Remote Sensing-Based Drought Monitoring in Iran’s Sistan and Balouchestan Province. Atmosphere 2024, 15, 1211. [Google Scholar] [CrossRef] [Scilit]
  102. Vargas-Cuentas, N.I.; Roman-Gonzalez, A. Satellite-Based Damage Assessment Following a Wildfire Event in Cordillera de Sama Bolivia. Int. J. Eng. Trends Technol. 2023, 71, 281–295. [Google Scholar] [CrossRef] [Scilit]
  103. Richards, J.A. Remote Sensing Digital Image Analysis; Springer International Publishing: Cham, Switzerland, 2022. [Google Scholar]
  104. Parida, B.R.; Kanu, B.; Dwivedi, C.S. Deciphering Forest Cover Losses and Recovery (1990–2022) Using Satellite Data in Behali Reserve Forest of Northeastern Himalaya. Remote Sens. Earth Syst. Sci. 2024, 7, 1–14. [Google Scholar] [CrossRef] [Scilit]
  105. Li, X.; Zhang, H.; Yang, G.; Ding, Y.; Zhao, J. Post-Fire Vegetation Succession and Surface Energy Fluxes Derived from Remote Sensing. Remote Sens. 2018, 10, 1000. [Google Scholar] [CrossRef] [Scilit]
  106. Williams, J. UAV Survey Mapping of Illegal Deforestation in Madagascar. Plants People Planet 2024, 6, 1413–1424. [Google Scholar] [CrossRef] [Scilit]
  107. Meli Fokeng, R.; Gadinga Forje, W.; Meli Meli, V.; Nyuyki Bodzemo, B. Multi-Temporal Forest Cover Change Detection in the Metchie-Ngoum Protection Forest Reserve, West Region of Cameroon. Egypt. J. Remote Sens. Space Sci. 2020, 23, 113–124. [Google Scholar] [CrossRef] [Scilit]
  108. Shchur, A.; Bragina, E.; Sieber, A.; Pidgeon, A.M.; Radeloff, V.C. Monitoring Selective Logging with Landsat Satellite Imagery Reveals That Protected Forests in Western Siberia Experience Greater Harvest than Non-Protected Forests. Envir. Conserv. 2017, 44, 191–199. [Google Scholar] [CrossRef] [Scilit]
  109. Poussin, C.; Guigoz, Y.; Palazzi, E.; Terzago, S.; Chatenoux, B.; Giuliani, G. Snow Cover Evolution in the Gran Paradiso National Park, Italian Alps, Using the Earth Observation Data Cube. Data 2019, 4, 138. [Google Scholar] [CrossRef] [Scilit]
  110. Bahramvash Shams, S.; Boehnert, J.; Wilhelmi, O. Assessing the Impact of Conservation Practices on Post-Wildfire Recovery of Evergreen and Conifer Forests Using Remote Sensing Data. Fire 2025, 8, 92. [Google Scholar] [CrossRef] [Scilit]
  111. Mofokeng, O.D.; Adelabu, S.A.; Durowoju, O.S.; Adagbasa, E.A. Grass Curing-Driven Fire Danger Index in a Protected Mountainous Grassland Using Fused MODIS and Sentinel-2. Int. J. Remote Sens. 2024, 45, 5359–5384. [Google Scholar] [CrossRef] [Scilit]
  112. Karandikar, A.M.; Agrawal, A.J.; Welekar, R.R. Decadal Forest Cover Change Analysis of the Tropical Forest of Tadoba-Andhari, India. Signal Image Video Process. 2024, 18, 1705–1714. [Google Scholar] [CrossRef] [Scilit]
  113. Yu, X.; Guo, X. Inter-Annual Drought Monitoring in Northern Mixed Grasslands by a Revised Vegetation Health Index from Historical Landsat Imagery. J. Arid Environ. 2023, 213, 104964. [Google Scholar] [CrossRef] [Scilit]
  114. Miletić, B.R.; Matović, B.; Orlović, S.; Gutalj, M.; Đorem, T.; Marinković, G.; Simović, S.; Dugalić, M.; Stojanović, D.B. Quantifying Forest Cover Loss as a Response to Drought and Dieback of Norway Spruce and Evaluating Sensitivity of Various Vegetation Indices Using Remote Sensing. Forests 2024, 15, 662, Correction in Forests 2024, 15, 815. https://doi.org/10.3390/f15050815. [Google Scholar] [CrossRef] [Scilit]
  115. Li, S.; Xu, L.; Chen, J.; Jiang, Y.; Sun, S.; Yu, S.; Tan, Z.; Li, X. Monitoring Vegetation Dynamics (2010–2020) in Shengnongjia Forestry District with Cloud-Removed MODIS NDVI Series by a Spatio-Temporal Reconstruction Method. Egypt. J. Remote Sens. Space Sci. 2023, 26, 527–543. [Google Scholar] [CrossRef] [Scilit]
  116. Chen, L.; Sofia, G.; Qiu, J.; Wang, J.; Tarolli, P. Grassland Ecosystems Resilience to Drought: The Role of Surface Water Ponds. Land Degrad. Dev. 2023, 34, 1960–1972. [Google Scholar] [CrossRef] [Scilit]
  117. Han, L.; Ding, J.; Zhang, J.; Chen, P.; Wang, J.; Wang, Y.; Wang, J.; Ge, X.; Zhang, Z. Precipitation Events Determine the Spatiotemporal Distribution of Playa Surface Salinity in Arid Regions: Evidence from Satellite Data Fused via the Enhanced Spatial and Temporal Adaptive Reflectance Fusion Model. CATENA 2021, 206, 105546. [Google Scholar] [CrossRef] [Scilit]
  118. Hladky, R.; Lastovicka, J.; Holman, L.; Stych, P. Evaluation of the Influence of Disturbances on Forest Vegetation Using Landsat Time Series; a Case Study of the Low Tatras National Park. Eur. J. Remote Sens. 2020, 53, 40–66. [Google Scholar] [CrossRef] [Scilit]
  119. O’Leary, D.S.; Kellermann, J.L.; Wayne, C. Snowmelt Timing, Phenology, and Growing Season Length in Conifer Forests of Crater Lake National Park, USA. Int. J. Biometeorol. 2018, 62, 273–285. [Google Scholar] [CrossRef] [Scilit] [PubMed]
  120. Kautz, M.; Feurer, J.; Adler, P. Early Detection of Bark Beetle (Ips typographus) Infestations by Remote Sensing—A Critical Review of Recent Research. For. Ecol. Manag. 2024, 556, 121595. [Google Scholar] [CrossRef] [Scilit]
  121. Dalponte, M.; Solano-Correa, Y.T.; Frizzera, L.; Gianelle, D. Mapping a European Spruce Bark Beetle Outbreak Using Sentinel-2 Remote Sensing Data. Remote Sens. 2022, 14, 3135. [Google Scholar] [CrossRef] [Scilit]
  122. Pacheco Quevedo, R.; Velastegui-Montoya, A.; Montalván-Burbano, N.; Morante-Carballo, F.; Korup, O.; Daleles Rennó, C. Land Use and Land Cover as a Conditioning Factor in Landslide Susceptibility: A Literature Review. Landslides 2023, 20, 967–982. [Google Scholar] [CrossRef] [Scilit]
  123. Zhao, C.; Lu, Z. Remote Sensing of Landslides—A Review. Remote Sens. 2018, 10, 279. [Google Scholar] [CrossRef] [Scilit]
  124. Rajaonarivelo, F.; Williams, R.A. Remote Sensing-Based Land Suitability Analysis for Forest Restoration in Madagascar. Forests 2022, 13, 1727. [Google Scholar] [CrossRef] [Scilit]
  125. Swarada, B.; Pasha, S.V.; Manohara, T.N.; Suresh, H.S.; Dadhwal, V.K. Assessing Landslide-Driven Deforestation and Its Ecological Impact in the Western Ghats: A Multi-Source Data Approach. J. Indian Soc. Remote Sens. 2024, 52, 1517–1531. [Google Scholar] [CrossRef] [Scilit]
  126. Saravanan, S.; Jennifer, J.J.; Singh, L.; Thiyagarajan, S.; Sankaralingam, S. Impact of Land-Use Change on Soil Erosion in the Coonoor Watershed, Nilgiris Mountain Range, Tamil Nadu, India. Arab J. Geosci. 2021, 14, 407. [Google Scholar] [CrossRef] [Scilit]
  127. Lou, H.; Scovronick, N.; Yang, S.; Ren, X.; Shi, L.; Fu, Y.; Cai, M.; Luo, Y. A Balance Exists between Vegetation Recovery and Human Development over the Past 30 Years in the Guizhou Plateau, China. Ecol. Indic. 2021, 133, 108357. [Google Scholar] [CrossRef] [Scilit]
  128. Ashiagbor, G.; Abubakar, S.K.; Inusah, S.S.; Adjapong, A.O.; Osei, G.N.; Laari, P.B. Analysis of the Impact of Agriculture and Logging on Forest Habitat Structure in the Ankasa and Bia Conservation Area of Ghana. Ecol. Evol. 2024, 14, e70712. [Google Scholar] [CrossRef] [Scilit] [PubMed]
  129. Fabolude, G.O.; David, O.A.; Akanmu, A.O.; Nakalembe, C.; Komolafe, R.J.; Akomolafe, G.F. Impacts of Anthropogenic Disturbance on Forest Vegetation Cover, Health, and Diversity within Doma Forest Reserve, Nigeria. Environ. Monit. Assess. 2023, 195, 1270. [Google Scholar] [CrossRef] [Scilit] [PubMed]
  130. Rodrigues, J.; Dias, M.A.; Negri, R.; Hussain, S.M.; Casaca, W. A Robust Dual-Mode Machine Learning Framework for Classifying Deforestation Patterns in Amazon Native Lands. Land 2024, 13, 1427. [Google Scholar] [CrossRef] [Scilit]
  131. Kouassi, C.J.A.; Khan, D.; Achille, L.S.; Omifolaji, J.K.; Espoire, M.M.R.B.; Zhang, K.B.; Yang, X.H.; Horning, N. Conflict-induced deforestation detection in African Côte d’Ivoire using Landsat images and Random Forest algorithm: A case in Mount Peko National Park. Appl. Ecol. Environ. Res. 2022, 20, 2035–2058. [Google Scholar] [CrossRef] [Scilit]
  132. Tritsch, I.; Sist, P.; Narvaes, I.; Mazzei, L.; Blanc, L.; Bourgoin, C.; Cornu, G.; Gond, V. Multiple Patterns of Forest Disturbance and Logging Shape Forest Landscapes in Paragominas, Brazil. Forests 2016, 7, 315. [Google Scholar] [CrossRef] [Scilit]
  133. European Union. Regulation (EU) 2024/1991 of the European Parliament and of the Council of 24 June 2024 on Nature Restoration and Amending Regulation (EU) 2022/869 (Text with EEA Relevance); Official Journal of the European Union: Brussels, Belgium, 2024. [Google Scholar]
  134. Hughes, A.C.; Grumbine, R.E. The Kunming-Montreal Global Biodiversity Framework: What It Does and Does Not Do, and How to Improve It. Front. Environ. Sci. 2023, 11, 1281536. [Google Scholar] [CrossRef] [Scilit]
  135. NASA. Disasters Practitioner Resources, NASA Applied Sciences. Available online: https://appliedsciences.nasa.gov/what-we-do/disasters/practitioner-resources (accessed on 16 February 2026).
  136. NASA—FIRMS NASA-FIRMS. Available online: https://firms.modaps.eosdis.nasa.gov/map/ (accessed on 10 October 2024).
  137. EFFIS. The Emergency Management Service—Mapping. Available online: https://forest-fire.emergency.copernicus.eu/ (accessed on 10 October 2024).
  138. European Union. Copernicus Emergency Mapping Services. Available online: http://emergency.copernicus.eu/ (accessed on 16 February 2026).
  139. Schneider, F.; Patel, Z.; Paulavets, K.; Buser, T.; Kado, J.; Burkhart, S. Fostering Transdisciplinary Research for Sustainability in the Global South: Pathways to Impact for Funding Programmes. Humanit. Soc. Sci. Commun. 2023, 10, 620. [Google Scholar] [CrossRef] [Scilit]
  140. Rucavado Rojas, D.; Postigo, J.C. The Cycle of Underrepresentation: Structural and Institutional Factors Limiting the Representation of Global South Authors and Knowledge in the IPCC. Clim. Change 2025, 178, 19. [Google Scholar] [CrossRef] [Scilit]
  141. Wang, Y.; Lu, Z.; Sheng, Y.; Zhou, Y. Remote Sensing Applications in Monitoring of Protected Areas. Remote Sens. 2020, 12, 1370. [Google Scholar] [CrossRef] [Scilit]
  142. Akhyar, A.; Asyraf Zulkifley, M.; Lee, J.; Song, T.; Han, J.; Cho, C.; Hyun, S.; Son, Y.; Hong, B.-W. Deep Artificial Intelligence Applications for Natural Disaster Management Systems: A Methodological Review. Ecol. Indic. 2024, 163, 112067. [Google Scholar] [CrossRef] [Scilit]
  143. Adjovu, G.E.; Stephen, H.; James, D.; Ahmad, S. Overview of the Application of Remote Sensing in Effective Monitoring of Water Quality Parameters. Remote Sens. 2023, 15, 1938. [Google Scholar] [CrossRef] [Scilit]
  144. Mallinis, G.; Emmanoloudis, D.; Giannakopoulos, V.; Maris, F.; Koutsias, N. Mapping and Interpreting Historical Land Cover/Land Use Changes in a Natura 2000 Site Using Earth Observational Data: The Case of Nestos Delta, Greece. Appl. Geogr. 2011, 31, 312–320. [Google Scholar] [CrossRef] [Scilit]
  145. Mahecha, M.D.; Gans, F.; Brandt, G.; Christiansen, R.; Cornell, S.E.; Fomferra, N.; Kraemer, G.; Peters, J.; Bodesheim, P.; Camps-Valls, G.; et al. Earth System Data Cubes Unravel Global Multivariate Dynamics. Earth Syst. Dyn. 2020, 11, 201–234. [Google Scholar] [CrossRef] [Scilit]
  146. Xu, C.; Du, X.; Fan, X.; Giuliani, G.; Hu, Z.; Wang, W.; Liu, J.; Wang, T.; Yan, Z.; Zhu, J.; et al. Cloud-Based Storage and Computing for Remote Sensing Big Data: A Technical Review. Int. J. Digit. Earth 2022, 15, 1417–1445. [Google Scholar] [CrossRef] [Scilit]
  147. Pasquarella, V.J.; Arévalo, P.; Bratley, K.H.; Bullock, E.L.; Gorelick, N.; Yang, Z.; Kennedy, R.E. Demystifying LandTrendr and CCDC Temporal Segmentation. Int. J. Appl. Earth Obs. Geoinf. 2022, 110, 102806. [Google Scholar] [CrossRef] [Scilit]
  148. Zhang, W.; Tian, Y.; Su, X.; Wu, D. A Machine Learning and Remote Sensing Approach for Accurate Forest Sub-Compartment Level Vegetation Cover Change Monitoring. Front. Plant Sci. 2026, 17. [Google Scholar] [CrossRef] [Scilit] [PubMed]
  149. Xiao, A.; Xuan, W.; Wang, J.; Huang, J.; Tao, D.; Lu, S.; Yokoya, N. Foundation Models for Remote Sensing and Earth Observation: A Survey. IEEE Geosci. Remote Sens. Mag. 2025, 13, 297–324. [Google Scholar] [CrossRef] [Scilit]
  150. Hong, D.; Li, C.; Li, X.; Camps-Valls, G.; Chanussot, J. Foundation Models in Remote Sensing: Evolving from Unimodality to Multimodality. IEEE Geosci. Remote Sens. Mag. 2026, 14, 10–35. [Google Scholar] [CrossRef] [Scilit]
  151. Diakogiannis, F.I.; Waldner, F.; Caccetta, P.; Wu, C. ResUNet-a: A Deep Learning Framework for Semantic Segmentation of Remotely Sensed Data. ISPRS J. Photogramm. Remote Sens. 2020, 162, 94–114. [Google Scholar] [CrossRef] [Scilit]
  152. Sun, S.; Mu, L.; Wang, L.; Liu, P. L-UNet: An LSTM Network for Remote Sensing Image Change Detection. IEEE Geosci. Remote Sens. Lett. 2022, 19, 8004505. [Google Scholar] [CrossRef] [Scilit]
  153. Zhu, Q.; Zhang, G.; Wang, X.; Huang, J. LSTMConvSR: Joint Long–Short-Range Modeling via LSTM-First–CNN-Next Architecture for Remote Sensing Image Super-Resolution. Remote Sens. 2025, 17, 2745. [Google Scholar] [CrossRef] [Scilit]
  154. Dowell, M. GEO Post-2025 Strategy: “Earth Intelligence”. 2023. Available online: https://egw2023.eurac.edu/presentation/04_Mark_Dowell.pdf (accessed on 16 February 2026).
  155. European Commission. Earth Intelligence, Coherent Policies Through Earth Observation Intelligence, Joint Research Centre. Available online: https://joint-research-centre.ec.europa.eu/scientific-portfolios/earth-intelligence_en (accessed on 16 February 2026).
  156. Group on Earth Observations (GEO). Earth Intelligence for All: GEO Post-2025 Strategy; Group on Earth Observations: Geneva, Switzerland, 2023; Available online: https://earthobservations.org/storage/documents/Key-Documents/GEO%20Post%202025%20Strategy%20Full%20Document.pdf (accessed on 16 February 2026).
  157. Wu, X.; Xiao, Q.; Wen, J.; You, D.; Hueni, A. Advances in Quantitative Remote Sensing Product Validation: Overview and Current Status. Earth-Sci. Rev. 2019, 196, 102875. [Google Scholar] [CrossRef] [Scilit]
  158. Wang, X.; Ou, T.; Zhang, W.; Ran, Y. An Overview of Vegetation Dynamics Revealed by Remote Sensing and Its Feedback to Regional and Global Climate. Remote Sens. 2022, 14, 5275. [Google Scholar] [CrossRef] [Scilit]
  159. Morales-Barquero, L.; Lyons, M.B.; Phinn, S.R.; Roelfsema, C.M. Trends in Remote Sensing Accuracy Assessment Approaches in the Context of Natural Resources. Remote Sens. 2019, 11, 2305. [Google Scholar] [CrossRef] [Scilit]
  160. Fonte, C.C.; See, L.; Laso-Bayas, J.C.; Lesiv, M.; Fritz, S. Assessing the accuracy of land use land cover (LULC) maps using class proportions in the reference data. ISPRS Ann. Photogramm. Remote Sens. Spat. Inf. Sci. 2020, V-3–2020, 669–674. [Google Scholar] [CrossRef] [Scilit]
  161. Olofsson, P.; Foody, G.M.; Herold, M.; Stehman, S.V.; Woodcock, C.E.; Wulder, M.A. Good Practices for Estimating Area and Assessing Accuracy of Land Change. Remote Sens. Environ. 2014, 148, 42–57. [Google Scholar] [CrossRef] [Scilit]
  162. Stehman, S.V.; Foody, G.M. Key Issues in Rigorous Accuracy Assessment of Land Cover Products. Remote Sens. Environ. 2019, 231, 111199. [Google Scholar] [CrossRef] [Scilit]
  163. Wang, R.; Gamon, J.A. Remote Sensing of Terrestrial Plant Biodiversity. Remote Sens. Environ. 2019, 231, 111218. [Google Scholar] [CrossRef] [Scilit]
  164. Rautiainen, M.; Lukeš, P. Spectral Contribution of Understory to Forest Reflectance in a Boreal Site: An Analysis of EO-1 Hyperion Data. Remote Sens. Environ. 2015, 171, 98–104. [Google Scholar] [CrossRef] [Scilit]
  165. Kokkoris, I.P.; Smets, B.; Hein, L.; Mallinis, G.; Buchhorn, M.; Balbi, S.; Černecký, J.; Paganini, M.; Dimopoulos, P. The Role of Earth Observation in Ecosystem Accounting: A Review of Advances, Challenges and Future Directions. Ecosyst. Serv. 2024, 70, 101659. [Google Scholar] [CrossRef] [Scilit]
  166. Singh, S.S.; Jeganathan, C. Quantifying Forest Resilience Post Forest Fire Disturbances Using Time-Series Satellite Data. Environ. Monit. Assess. 2024, 196, 26. [Google Scholar] [CrossRef] [Scilit] [PubMed]
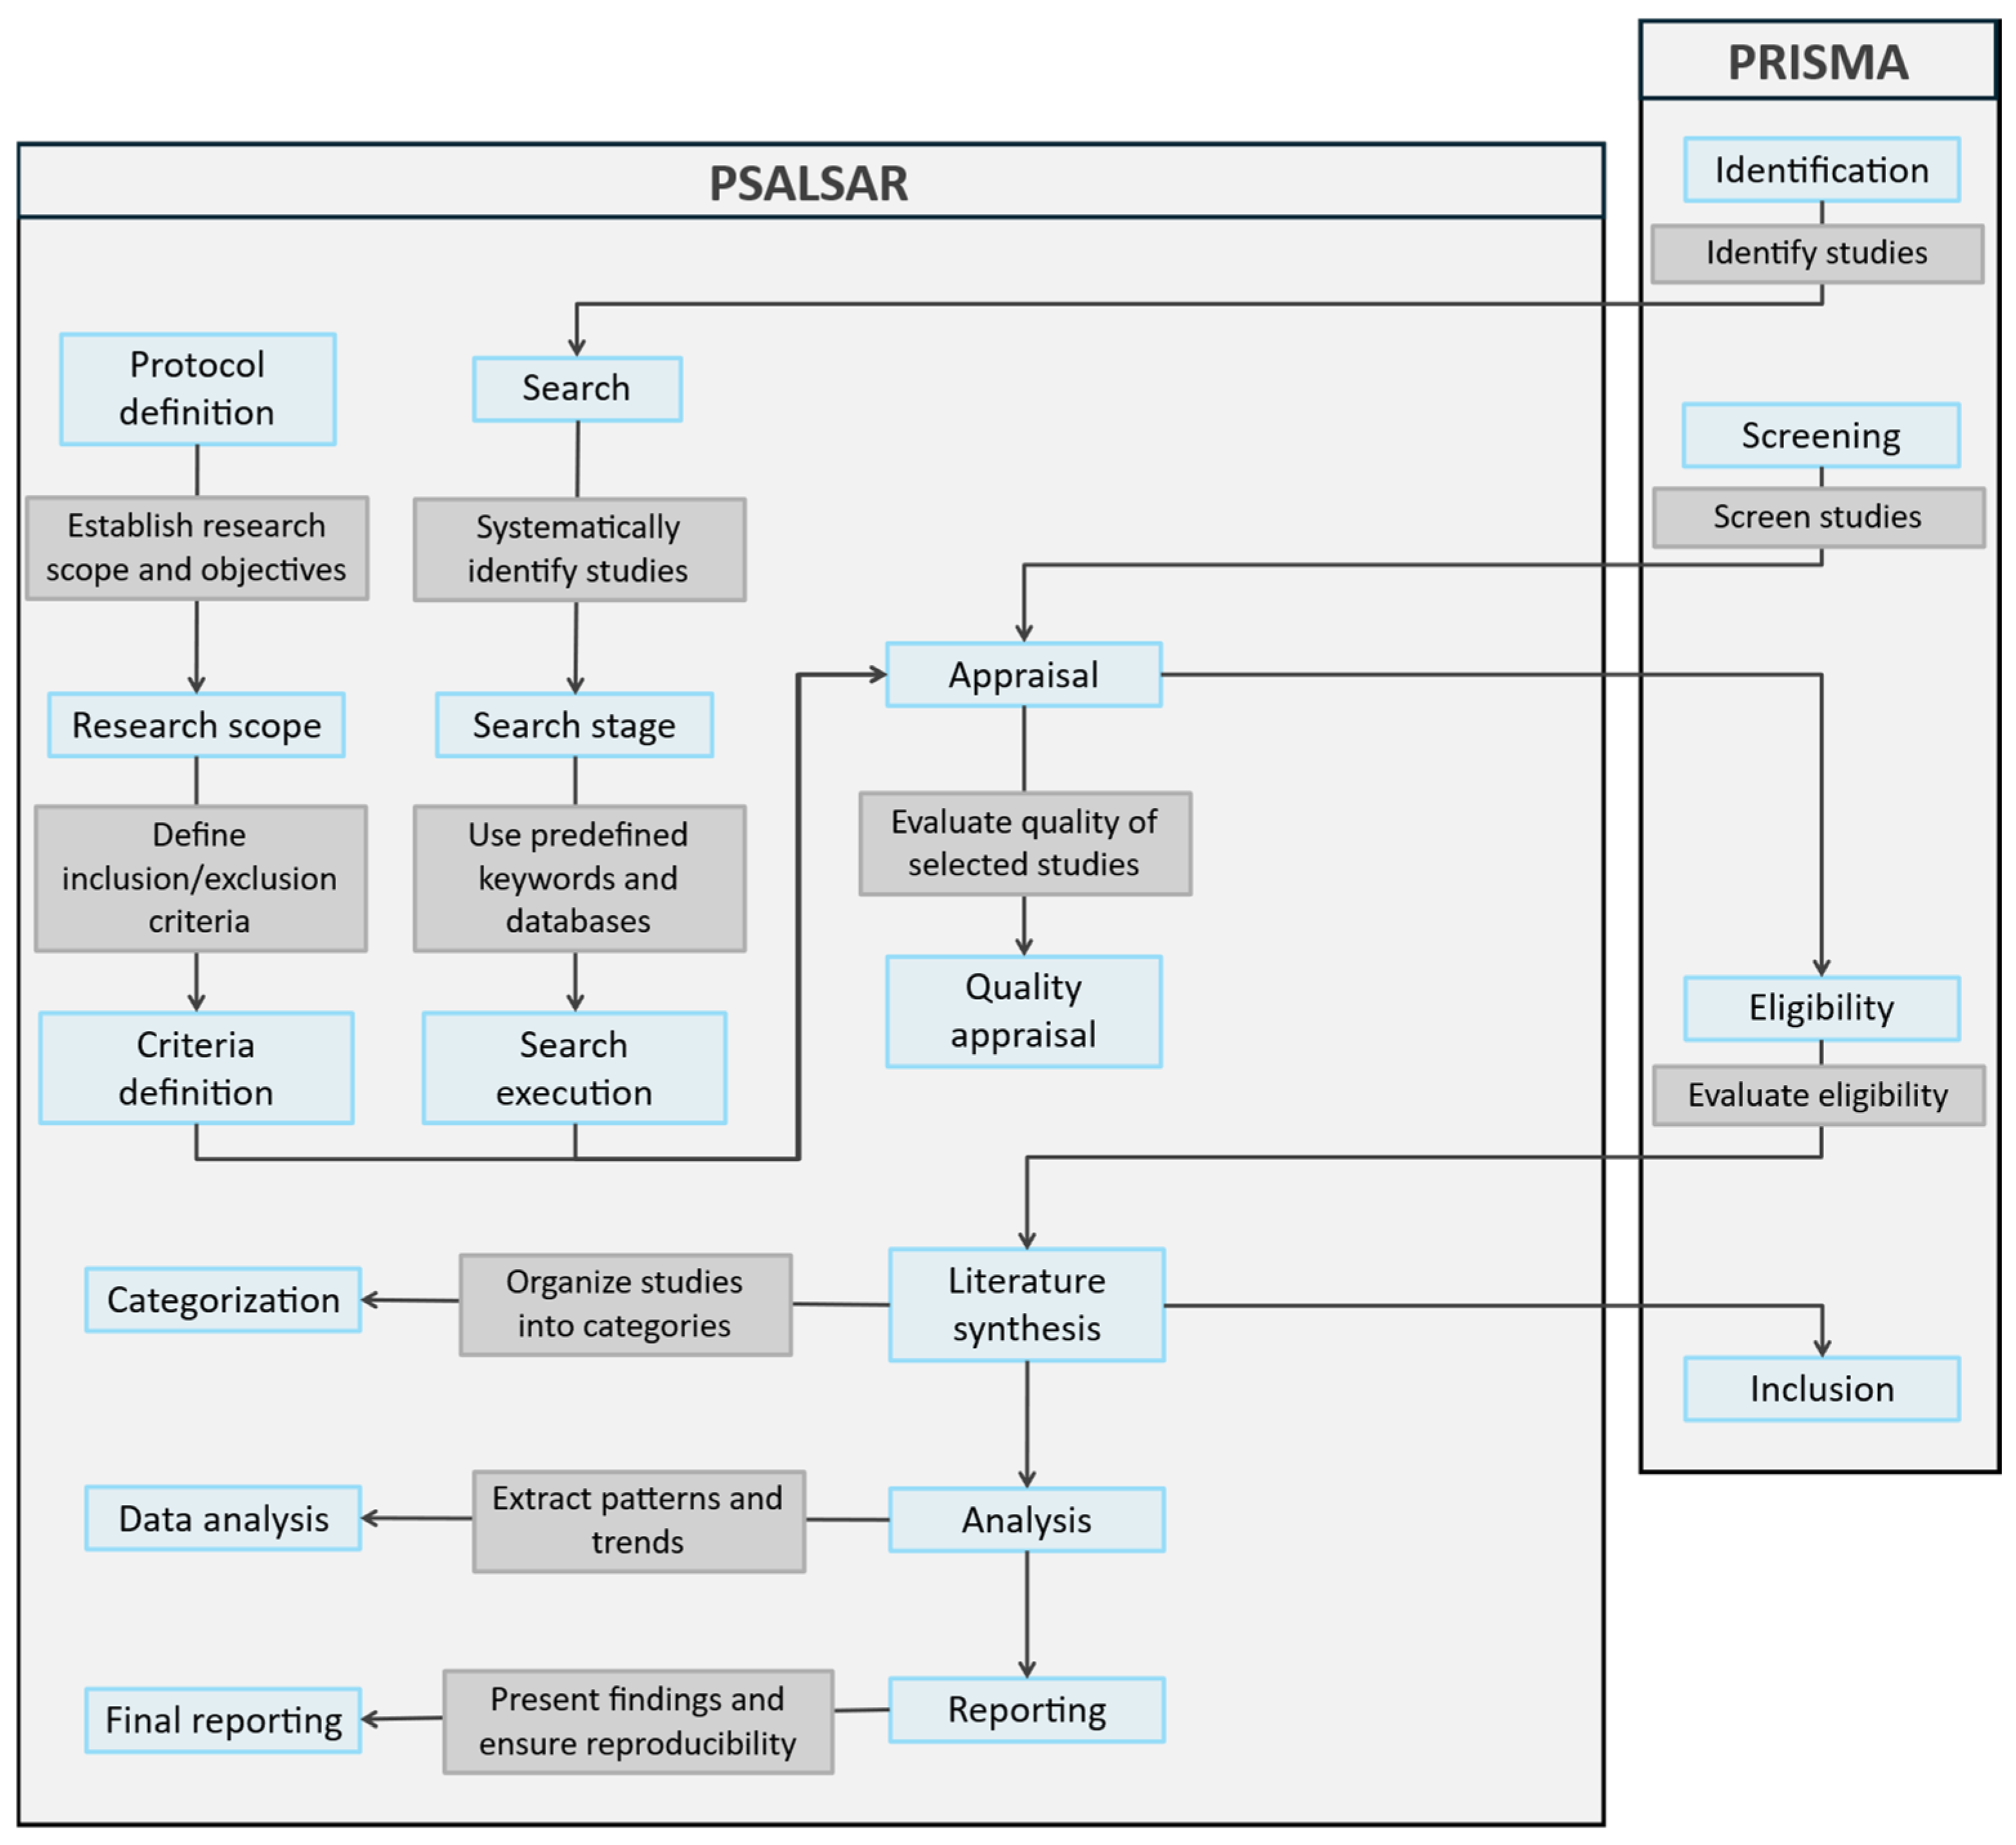
Figure 1. Integrated workflow of this systematic review, combining PRISMA and PSALSAR methodological frameworks. The diagram summarizes how PRISMA Identification aligns with the PSALSAR Search stage, how Screening and Search lead to the Appraisal stage, and how Appraisal leads into PRISMA Eligibility. Eligibility transitions into the PSALSAR Literature synthesis stage, from which the subsequent steps of PRISMA Inclusion, as well as PSALSAR Categorization, Data analysis, and Final reporting, are derived. This workflow provides a structured and transparent representation of the full review process, ensuring methodological consistency, reproducibility, and clarity in the organization and synthesis of the reviewed literature.
Forests 17 00853 g001
Figure 2. Selection process of reviewed articles using the PRISMA (Preferred Reporting Items for Systematic Reviews and Meta-Analyses) framework.
Forests 17 00853 g002
Figure 3. Distribution of the study areas in the reviewed literature. Legend colors indicate how many studies including protected areas are identified for that country.
Forests 17 00853 g003
Figure 4. Frequency in number of publications of ecosystem types studied in the reviewed literature. The categories used are in accordance with MAES Level 2 typology. No limitations were placed on the number of categories assigned in a single study. Each bar represents the frequency of occurrence of each ecosystem type across the reviewed literature.
Forests 17 00853 g004
Figure 5. Number of sensor applications in the reviewed studies, grouped into four spatial-resolution classes—low (>30 m), medium (5–30 m), high (1–5 m), and very high (<1 m)—with recorded counts of 14, 116, 9, and 8, respectively. Medium-resolution sensors are by far the most frequently employed, reflecting the dominance of freely accessible satellite systems such as Landsat and Sentinel across the reviewed literature.
Forests 17 00853 g005
Figure 6. Distribution of EO and non-EO auxiliary datasets used in disturbance-related vegetation dynamics studies. Several categories (topographic data, vegetation and species-related data, meteorological and climatic data, and soil-related data) include both EO and non-EO products, differing primarily by their data source and acquisition method. For vegetation and species-related data, EO products commonly include satellite-derived vegetation maps, while non-EO sources rely on field-based sample measurements. In terms of meteorological and climatic datasets, precipitation and temperature records are the dominant variables, with both available as either satellite-derived EO products or records from ground-based meteorological stations. Soil-related data appear less frequently and primarily capture soil moisture and land surface properties, sourced either from satellite-derived products, or from conventional ground-based surveys.
Forests 17 00853 g006
Table 1. Frequency of vegetation dynamics studied in the collected literature.
Vegetation DynamicsFrequency of Dynamics Type (No. of Publications)Reference
Disturbance detection98[35]
Recovery detection45[36]
Disturbance modeling34[32]
Recovery modeling23[37]
Table 2. Algorithms identified as processing methods in the collected literature, classified as processing type, temporal analysis type, and spatial analysis type.
Processing
Algorithm Type
(%)Temporal
Analysis Type
(%)Unit of
Spatial Analysis
(%)
Traditional statistical60.0Bi-temporal48.6Pixel-based66.7
Shallow
machine learning
33.3Time-series49.5Object-based33.3
Deep
machine learning
6.7Other
(uni-temporal/atypical)
1.9
Table 3. Key methodological approaches in RS-enabled wildfire-related studies.
Information TypeDescription/ItemsReferences
SensorsLandsat; Sentinel-2; MODIS LST;
VIIRS active fire
[35,82,111]
Variables &
indices
NBR, dNBR, RBR; NDVI; NDMI;
custom: VRAF, V2FIRE
[37,44,96]
MethodsLandTrendr; COLD; RF; SVM; OBIA;
DL algorithms
[35,112]
ValidationField plots; burn perimeters;
active fire products;
high-resolution basemaps
[35,50,60,104,111]
Table 4. Key methodological approaches in RS-enabled drought-related studies.
Information TypeDescription/ItemsReferences
SensorsMODIS; Landsat; Sentinel-2; ERA5; CHIRPS; meteorological stations[43,101,113,114]
Variables &
indices
NDVI anomalies; VHI/VHIr; SPI/SPEI; TVDI/TSDI; LST; NDWI; LSWI[43,101,113]
MethodsST-HANTS; EOF; SMA; modified VHIr[64,115]
ValidationRain gauges;
ground water measurements;
biomass observations; lidar; orthophotos
[43,64,100,113]
Table 5. Key methodological approaches in RS-enabled meteorological-related studies.
Information TypeDescription/ItemsReferences
SensorsLandsat; MODIS; Sentinel-1; ERA5; CHIRPS; station climate data[41,97,116]
Variables &
indices
NDSI; NDVI (phenology, canopy gaps)[117,118]
MethodsSpectral indices; PCA;
regression-based analysis
[116,119]
ValidationMeteorological station records;
airphotos; field snow depth;
phenology observations
[41,97,109,116,117,118,119]
Table 6. Key methodological approaches in RS-enabled biological-invasion-related studies.
Information TypeDescription/ItemsReferences
SensorsLandsat; Sentinel-2; RapidEye; WorldView; UAV; MODIS[70,90,94]
Variables &
indices
NDVI decline; red-edge indices[70,89,90,94]
MethodsRF; SVM; MaxEnt; CNN segmentation; OBIA; PDE-based control[70,90,94]
ValidationField biophysical measurements;
vegetation structural-trait measurements
[89,94]
Table 7. Key methodological approaches in RS-enabled land erosion- and landslide-related studies.
Information TypeDescription/ItemsReferences
SensorsLandsat; Sentinel-2; Sentinel-1;
GEDI lidar; ERA5-Land
[38,57,65,124,125]
Variables &
indices
Vegetation indices; elevation; slope;
aspect; canopy height/cover;
forest density
[38,57,65,124]
MethodsLandslide susceptibility mapping[65,124]
ValidationField observations;
high- and very-high-resolution
reference imagery
[126]
Table 8. Key methodological approaches in RS-enabled human activity-related studies.
Information TypeDescription/ItemsReferences
SensorsLandsat; WorldView; RapidEye;
PlanetScope; ALOS; lidar DSM/DTM
[58,63,86,98,106,127,128,129]
Variables &
indices
Land cover metrics;
structural terrain parameters;
vegetation structural parameters
[51,99,104,107,127]
MethodsHybrid classification; OBIA; MSPA;
logistic regression; U-Net
[63,98,127,129]
ValidationField surveys; interviews; airphotos;
authoritative datasets
[63,98,129]
Table 9. Key methodological approaches in RS-enabled deforestation-related studies.
Information TypeDescription/ItemsReferences
SensorsLandsat; Sentinel-2;
high-resolution imagery
[47,49,66,70,73,77,93,104,128,129]
Variables &
indices
Forest loss metrics;
clearing indicators
[106,130]
MethodsForest loss mapping;
clearing event detection
[106,130]
ValidationReference forest loss datasets;
high-resolution
reference imagery
[42,44,66,77,81,86,106,108,124,129,130,132]
Disclaimer/Publisher’s Note: The statements, opinions and data contained in all publications are solely those of the individual author(s) and contributor(s) and not of MDPI and/or the editor(s). MDPI and/or the editor(s) disclaim responsibility for any injury to people or property resulting from any ideas, methods, instructions or products referred to in the content.