Article

Pyrolysis Oil-Based Polyurethane Foams as a Middle Layer of the Composite Plywood Sandwich Panels for Sustainable Construction

1
InnoRenew CoE, Andrej Marušič Institute, University of Primorska, Muzejski trg 2, SI-6000 Koper, Slovenia
2
AEP Polymers S.r.l., 34149 Basovizza, Italy
3
BTG Biomass Technology Group, Josink Esweg 34, 7545 PN Enschede, The Netherlands
4
Faculty of Mathematics, Natural Sciences and Information Technologies, University of Primorska, Glagoljaška 8, SI-6000 Koper, Slovenia
*
Author to whom correspondence should be addressed.
Forests 2026, 17(7), 824; https://doi.org/10.3390/f17070824
Submission received: 25 May 2026 / Revised: 7 July 2026 / Accepted: 9 July 2026 / Published: 13 July 2026
(This article belongs to the Special Issue Performance Testing of Wood and Wood-Based Materials)

Abstract

The construction sector’s substantial contribution to global energy consumption and CO2 emissions motivates the development of bio-based alternatives to fossil-derived rigid polyurethane (PUR) foam cores in structural sandwich panels. This study presents a comprehensive comparison of plywood sandwich panels manufactured with a rigid PUR foam containing a fast pyrolysis bio-oil (FPBO)-derived sugar polyol diluted with triethyl phosphate and panels of identical topology produced with a commercial reference PUR foam. In the bio-based formulation, a fraction of the sorbitol-based polyether polyol was replaced with the FPBO-derived sugar polyol. Both systems were characterized at the foam and panel levels for cellular microstructure, skeletal and envelope density, thermogravimetric stability, flammability, color, thermal conductivity and heat capacity, internal bond strength, compressive properties, and normal-incidence sound absorption and transmission loss. The newly developed foam exhibited similar skeletal density and porosity to the reference, comparable thermogravimetric stability with a slightly higher char residue, and lower thermal conductivity across the tested temperature range. Mechanical properties, including compressive strength, compressive modulus, and internal bond strength, showed minor reduction but remained within a comparable range. A distinct color change was observed, attributable to the presence of chromophoric constituents of the FPBO fraction. Overall, the results indicate that partial substitution of the fossil polyol with an FPBO-derived sugar polyol is technically feasible, yielding materials with comparable thermal, mechanical, or acoustic performance. No consistent performance advantage of either system was observed across the evaluated properties. The results support the potential of pyrolysis-derived bio-polyols for use in sustainable structural insulation products.

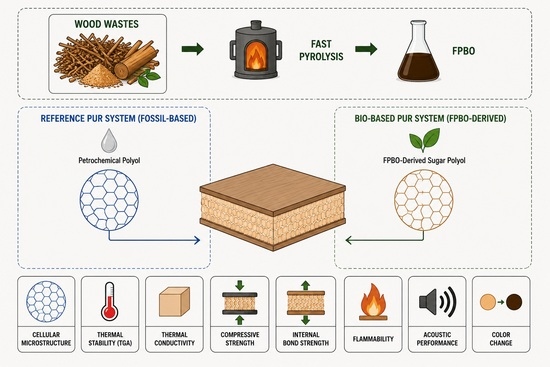
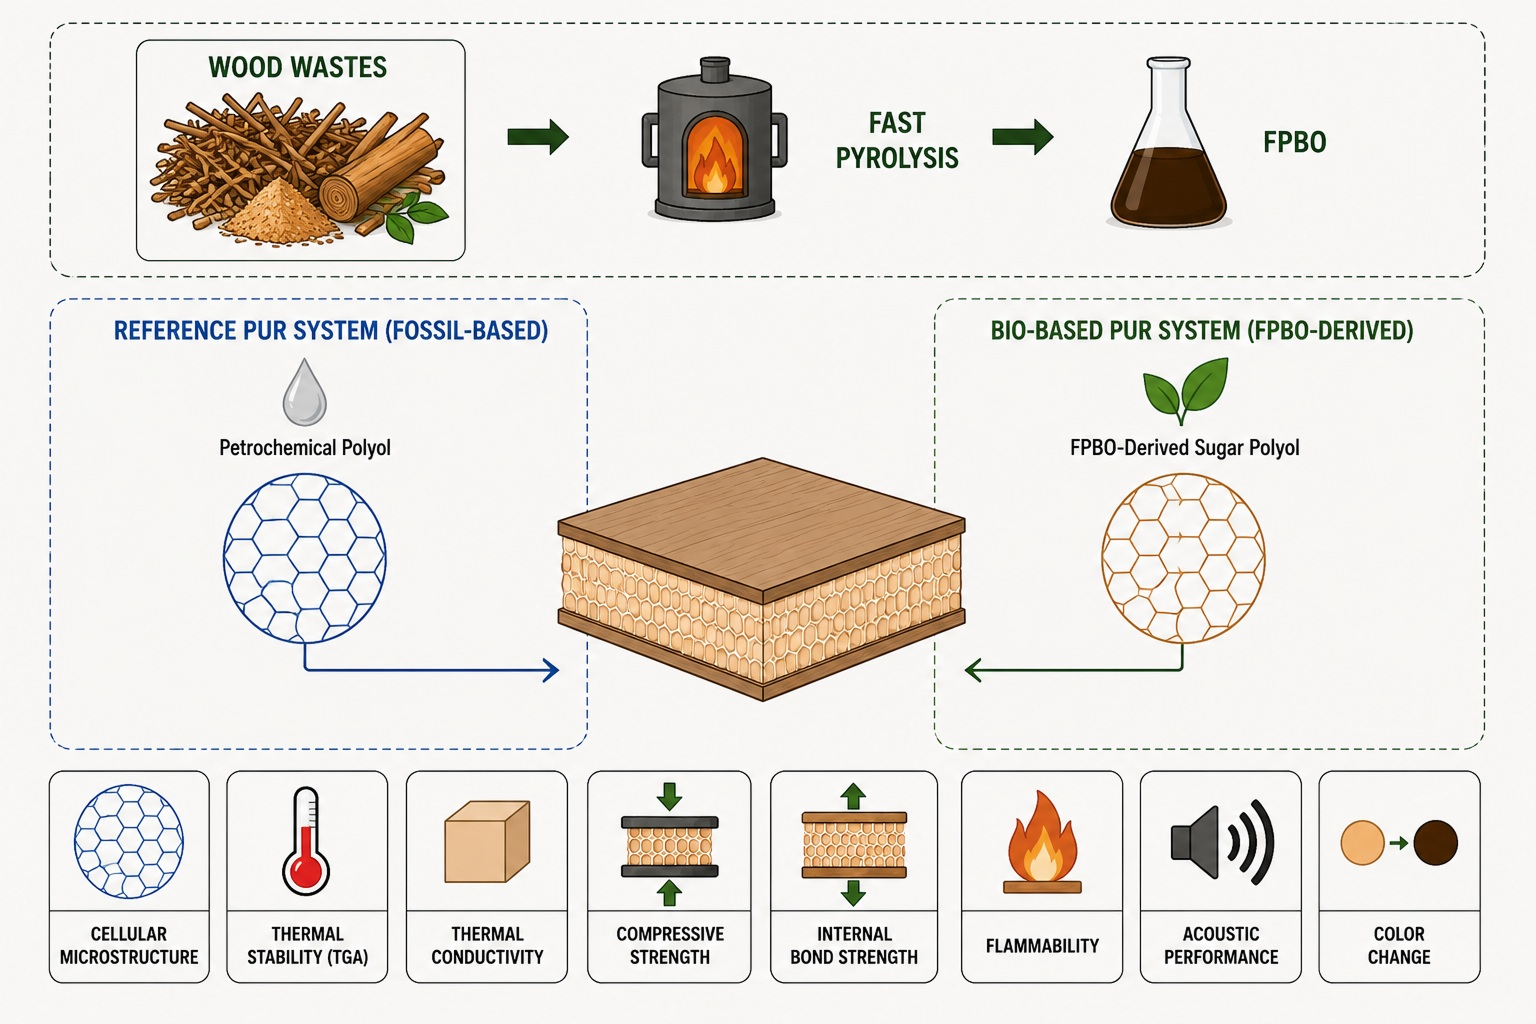
Graphical Abstract

1. Introduction

The construction sector accounts for approximately 36% of global energy consumption and a comparable share of CO2 emissions, which has made the development of bio-based and low-carbon building materials a central research priority in both academic and industrial contexts [1,2]. Wood-based sandwich panels, consisting of stiff face sheets bonded to a lightweight core layer, are well-established structural elements, combining favorable strength-to-weight ratios, thermal insulation performance, and suitability for prefabricated construction [3]. Plywood, valued for its dimensional stability, moisture resistance, and bond quality, is among the most widely used facing materials for such systems [4].
Rigid polyurethane (PUR) foam is the dominant core material in high-performance sandwich panels, offering low thermal conductivity, good compressive strength, and strong interfacial adhesion to wood-based substrates [5,6,7]. However, conventional rigid PUR foams are synthesized entirely from petrochemical polyols and isocyanates, both derived from fossil resources. This dependence conflicts with the growing emphasis on circular bioeconomy principles in the construction sector and creates environmental pressure to develop renewable alternatives [8]. Considerable research effort has therefore been directed toward replacing petroleum-based polyols, partially or fully, with bio-derived alternatives. Feedstocks investigated to date include vegetable oils such as soybean, castor, olive, palm, rapeseed, linseed, tung, and palm oil, used cooking oil, tall oil fatty acids, lignocellulosic liquefaction products, and pyrolytic lignin fractions [9,10]. Bio-based rigid PUR formulations derived from tall oil fatty acids have demonstrated thermal conductivity and compressive strength equivalent to petroleum-based reference foams across a wide density range, indicating that bio-based substitution need not compromise structural performance [11].
Fast pyrolysis of lignocellulosic biomass, including wood residues, offers a particularly scalable route for producing a hydroxyl-rich liquid intermediate known as pyrolysis oil or bio-oil [12]. The organic fraction of pyrolysis oil is rich in phenols, furans, aldehydes, and carbohydrate-derived compounds bearing free hydroxyl groups, making it chemically suitable as a partial polyol substitute in PUR foam formulations. Schulzke et al. showed that substituting up to 80% of the conventional polyol with dried pyrolysis condensates from straw yielded rigid PUR foams with a thermal conductivity of 0.0283 W/m/K, which is 8% lower than the commercial reference foam (0.0308 W/m/K), while compressive strength exceeded the required 150 kPa threshold [7]. More recently, fractionation of pyrolytic lignin has enabled the production of structurally defined polyol substitutes with the resulting rigid PUR foams exhibiting reduced cell size and improved mechanical properties relative to petroleum-based reference formulations [13].
Despite these advances at the foam material level, the translation of pyrolysis-oil-based PUR formulations into finished composite building products has not been reported in the literature. Specifically, no study has evaluated such foams as structural core layers within plywood-faced sandwich panels, benchmarked against a commercial PUR foam system, and characterized across the full range of properties relevant to construction applications. These system-level properties cannot be reliably inferred from foam coupon data alone. The closest comparable study by Lodron et al. investigated bio-based castor oil PUR foam in sandwich panels but used glass-fiber composite face sheets rather than plywood, limiting its relevance to wood-based panel applications [14]. Bio-based foam core formulations are largely absent from research on wood-based sandwich panel systems [3,15].
The pyrolysis-oil-based PUR foam evaluated in this study was developed within the framework of the EU-funded NewWave project, a collaborative research and innovation initiative conducted with industry partners, aimed at advancing the use of bio-based materials in the construction sector. The present study reports the first feasibility assessment of plywood sandwich panels incorporating pyrolysis PUR as the core layer, referred to here as NewWave foam (NW Foam), compared against panels manufactured using a commercial fossil-based PUR foam system (REF Foam). It was hypothesized that sandwich panels incorporating a pyrolysis-oil-based PUR foam core would exhibit performance characteristics within the range of those obtained with a commercial PUR foam system. The objective was to establish an initial performance benchmark for this material system and assess its technical potential for further development. Accordingly, the panels were characterized in terms of cellular microstructure, density, thermogravimetric stability, fire resistance, thermal conductivity, internal bond strength, compressive properties, and acoustic behavior.

2. Materials and Methods

2.1. Foam Preparation

The polyurethane foams were manufactured using a propoxylated sorbitol-based polyether polyol PCI Polyol SB440 (hydroxyl number of 440 mg KOH/g, functionality of 4.6, produced by InterPur Chemicals, Barcelona, Spain and distributed by C.P. Chemicals, Milano, Italy), heavy polyols from the pyrolytic sugars fraction derived from fast pyrolysis bio-oil BTG_NW_SPOH (2565) (hydroxyl value of 471 mg KOH/g, functionality range 3.3–3.8, produced by BTG Biomass Technology Group BV from The Netherlands within the NewWave project) [16], catalysts Polycat 5 and Polycat 8 (produced by Evonik Industries AG, Essen, Germany and distributed by Safic-Alcan, Lainate, Italy), flame retardant Tris(2-chloro-1-methylethyl)phosphate (TCPP, distributed by C.P. Chemicals Italy), triethyl phosphate (TEP, distributed by C.P. Chemicals, Italy), silicone surfactant TEGOSTAB B84205 (produced by Evonik Industries AG, Germany and distributed by Safic-Alcan, Italy), deionized water as chemical blowing agent and physical blowing agent cyclopentane (acquired from Merck KGaA, Darmstadt, Germany), and isocyanate Desmodur® 44V20L (produced by Covestro, Leverkusen, Germany and distributed by C.P. Chemicals, Italy).
Formulations of the REF and NW foams are summarized in Table 1. Polymeric MDI (pMDI) was used as the isocyanate component with an index of 105 for both foams. The amounts of additives (blowing agents, catalysts, and flame retardants) were fixed, with the only difference being the partial substitution of the reference polyol. The manufacture of polyurethane foams and determination of the respective density, string time, and tack-free time were performed according to the Standard Practice for Polyurethane Raw Materials: Polyurethane Foam Cup Test D7487 [17]. The reported foam density represents the average of 10 measurements performed on replicate specimens. The foams were hand-mixed in disposable paper cups using an overhead stirrer (Heidolph Hei-TORQUE 400, Schwabach, Germany). The polyol was pre-mixed along with the additives at 600 rpm for 1 min. All the components were kept at the same temperature and weighed in the same order. Subsequently, the required amount of isocyanate, plus a slight excess to account for the transfer loss, was weighed in a separate cup. The isocyanate was then added to the polyol pre-mix, and the mixture was mixed at 2000 rpm for 7 s.

2.2. Composite Panels Production

Plywood panels (520 × 520 × 10 mm3; width × height × thickness, respectively) made from poplar wood veneers were used as the sandwich panel cover layers. The composite was produced from veneer bonded with a custom bio-based resin that was developed and provided by Foresa Technologies within the framework of the NewWave project.
The composite sandwich panels were produced using a pour-in-place type approach by pouring the hand-mixed polyurethane formulation directly between two plywood layers, encapsulated in a closed mold. The customized mold was made with 2 cm thick plywood boards composed of a box with an internal volume of 520 × 520 × 50 mm3. The surfaces of the two plywood panels, used as external layers of the sandwich composite that comes in direct contact with the foam, were manually sanded with P120 grit sandpaper to increase adhesion and remove any surface contamination. Prior to making the sandwich panels, the internal cavity of the mold was coated with a release agent and the bottom was lined with parchment paper to facilitate the removal of the cured panels. The first plywood layer was placed on the bottom of the mold, and the polyurethane foam formulation was poured directly on top. After the foam started expanding, the second plywood layer was placed on the top and the mold was sealed with a lid using built-in bolts and screws. The foam was left to cure for at least 3 h in the closed mold before removal.

2.3. Foams Characterization

The following subsections refer to the measurements performed on the foam core of the sandwich panels without the external plywood cover layers.

2.3.1. Compressive Strength of Rigid PUR Foams

Compressive strength of the rigid PUR foams was determined in both parallel and perpendicular to the foam growth direction, according to standard ASTM D 1621—Standard test method for compressive properties of rigid cellular plastics [18], using the universal testing machine (AGS-X Series Shimadzu, Shimadzu Corporation, Kyoto, Japan) equipped with a 5 kN load cell. For each direction, 4 cubic replica specimens of 50 × 50 × 50 mm3 dimensions were tested. Sample dimensions were measured using a caliper. The compressive strength was calculated from the stress corresponding to 10% specimen deformation.

2.3.2. UL 94 Vertical Flammability Test

The flame resistance properties of the rigid PUR foam were determined according to the UL 94 Vertical Flammability Test procedure. The rigid PUR foam was cut into 125 × 13 × 13 mm3 bars, and for each formulation, a total of 11 replica specimens were used for the test. The specimens were positioned vertically and clamped at the top. The gas flow of a Bunsen burner was adjusted to yield a 20 mm high blue flame. The flame, positioned at an angle of 45°, was used to ignite the specimen from below, held for 10 s, and then removed. The time that it takes for the specimen to self-extinguish from the moment the flame is removed was recorded using a stopwatch.

2.3.3. Dimensional Stability

The dimensional stability of rigid PUR foams was determined according to ASTM D 2126—Standard Test Method for Response of Rigid Cellular Plastics to Thermal and Humid Aging [19], albeit with a deviation in specimen size. Instead of the recommended sample size of 100 mm × 100 mm by thickness supplied, cubic specimens of 50 mm × 50 mm × 50 mm were used in this research. Two cubic replica specimens were tested for each formulation. The specimens were conditioned in a climate chamber (Binder Model ED23, Binder GmbH, Tuttlingen, Germany) at a temperature of 100 °C for 24 h. Sample dimensions were measured with a caliper.

2.3.4. FTIR Analysis

PUR foams were analyzed using Fourier transform infrared spectroscopy by Attenuated Total Reflectance (FTIR-ATR). A JASCO FT/IR-4600 Spectrometer (JASCO Corporation, Hachioji, Tokyo, Japan) was employed for the spectroscopic analysis, recording 32 scans in the range of 4000–800 cm−1 using a resolution of 4.0 cm−1, and performing a background correction before each measurement. The analysis was conducted on thin strips of cut PUR foam.

2.3.5. Colorimetry

Colorimetric measurements were performed using a Spectromaster 565–45 (Erichsen GmbH, Hemer, Germany). The instrument was calibrated prior to use with a standard white and black reference tile. Measurements were conducted under illuminant D65 with a 10° standard observer. Color values (L*, a*, b*) were recorded in the CIE Lab color space. For each sample, five measurements were taken at different positions and averaged. The measurements were performed according to the manufacturer’s recommended procedure for opaque materials.

2.3.6. Gas Pycnometery

Skeletal density measurements were performed using a gas pycnometer (AccuPyc II 1345, Micromeritics Instrument Corporation, Norcross, GA, USA) using helium as the displacement gas. Foam samples (without plywood) measuring 25 × 25 × 35 mm were analyzed in a 35 cm3 reference measurement chamber. Each measurement consisted of 10 initial purge cycles followed by 10 analysis cycles. The equilibration time was set to 300 s, and measurements were conducted at a pressure of 6 psig. All measurements were performed in duplicate. The total pore volume was subsequently calculated based on the measured skeletal density and envelope density. The envelope density was obtained from the sample volume, determined using caliper measurements, and the sample mass, measured with an analytical balance (Kern & Sohn GmbH, Balingen, Germany).

2.3.7. Thermogravimetric Analysis

Thermogravimetric analysis (TGA) was performed using the TGA 5500 (TA Instruments, New Castle, DE, USA). Foam samples were analyzed in their original form (not pulverized). Samples were heated from room temperature to 600 °C at a heating rate of 10 °C·min−1 in a nitrogen atmosphere. Measurements were carried out using platinum pans. Each sample was analyzed in triplicate.

2.3.8. Life Cycle Assessment

The LCA was performed within the framework of the NewWave project and included the production of the bio-polyols used in this study. The assessment followed ISO 14040/14044 standards and applied the Environmental Footprint 3.1 (adapted) methodology, encompassing sixteen impact categories [20]. A cradle-to-gate boundary was adopted, with functional units defined at the product level for each manufacturing line. Environmental burdens were allocated across co-produced streams using mass, energy, or economic value criteria depending on process configuration. Primary data were drawn from the project deliverable [21], while background processes were modeled using recognized databases and SimaPro version 10.4 (SimaPro B.V., Amersfoort, The Netherlands).

2.4. Sandwich Panels Characterization

The following subsections refer to measurements of the whole sandwich panels composed of foam as the core material and plywood sheets as external cover layers.

2.4.1. Microscopy

Microscopic analysis was performed on the Keyence VHX-600 (Keyence Corporation, Osaka, Japan) digital microscope. Samples were prepared by cutting approximately 1 mm-thick sections of the foam using a razor blade from defect-free regions. Observations were carried out in transmitted light mode. Images were acquired at 100× magnification. To capture the entire cross-sectional area of the samples, multiple images (2 × 21 fields) were recorded and automatically stitched using the instrument software to obtain full-height cross-sectional images.
For the determination of cell-wall thickness, mean cell diameter, and cell-population (nucleation) density, separate specimens were prepared by sectioning the foam perpendicular to the rise direction using a microtome equipped with a razor blade to obtain 100 µm-thick slices. Prior to image analysis, the measurement scale was calibrated using the calibration bar. The same sections were used for all morphological measurements. For cell-wall thickness, images were acquired at 150× magnification, and measurements were performed using the Keyence VHX analysis software (VHX-6000950F version 3.0). Three images were analyzed for each formulation, and 45 individual cell-wall thickness measurements were performed per image, resulting in a total of 135 measurements per formulation.
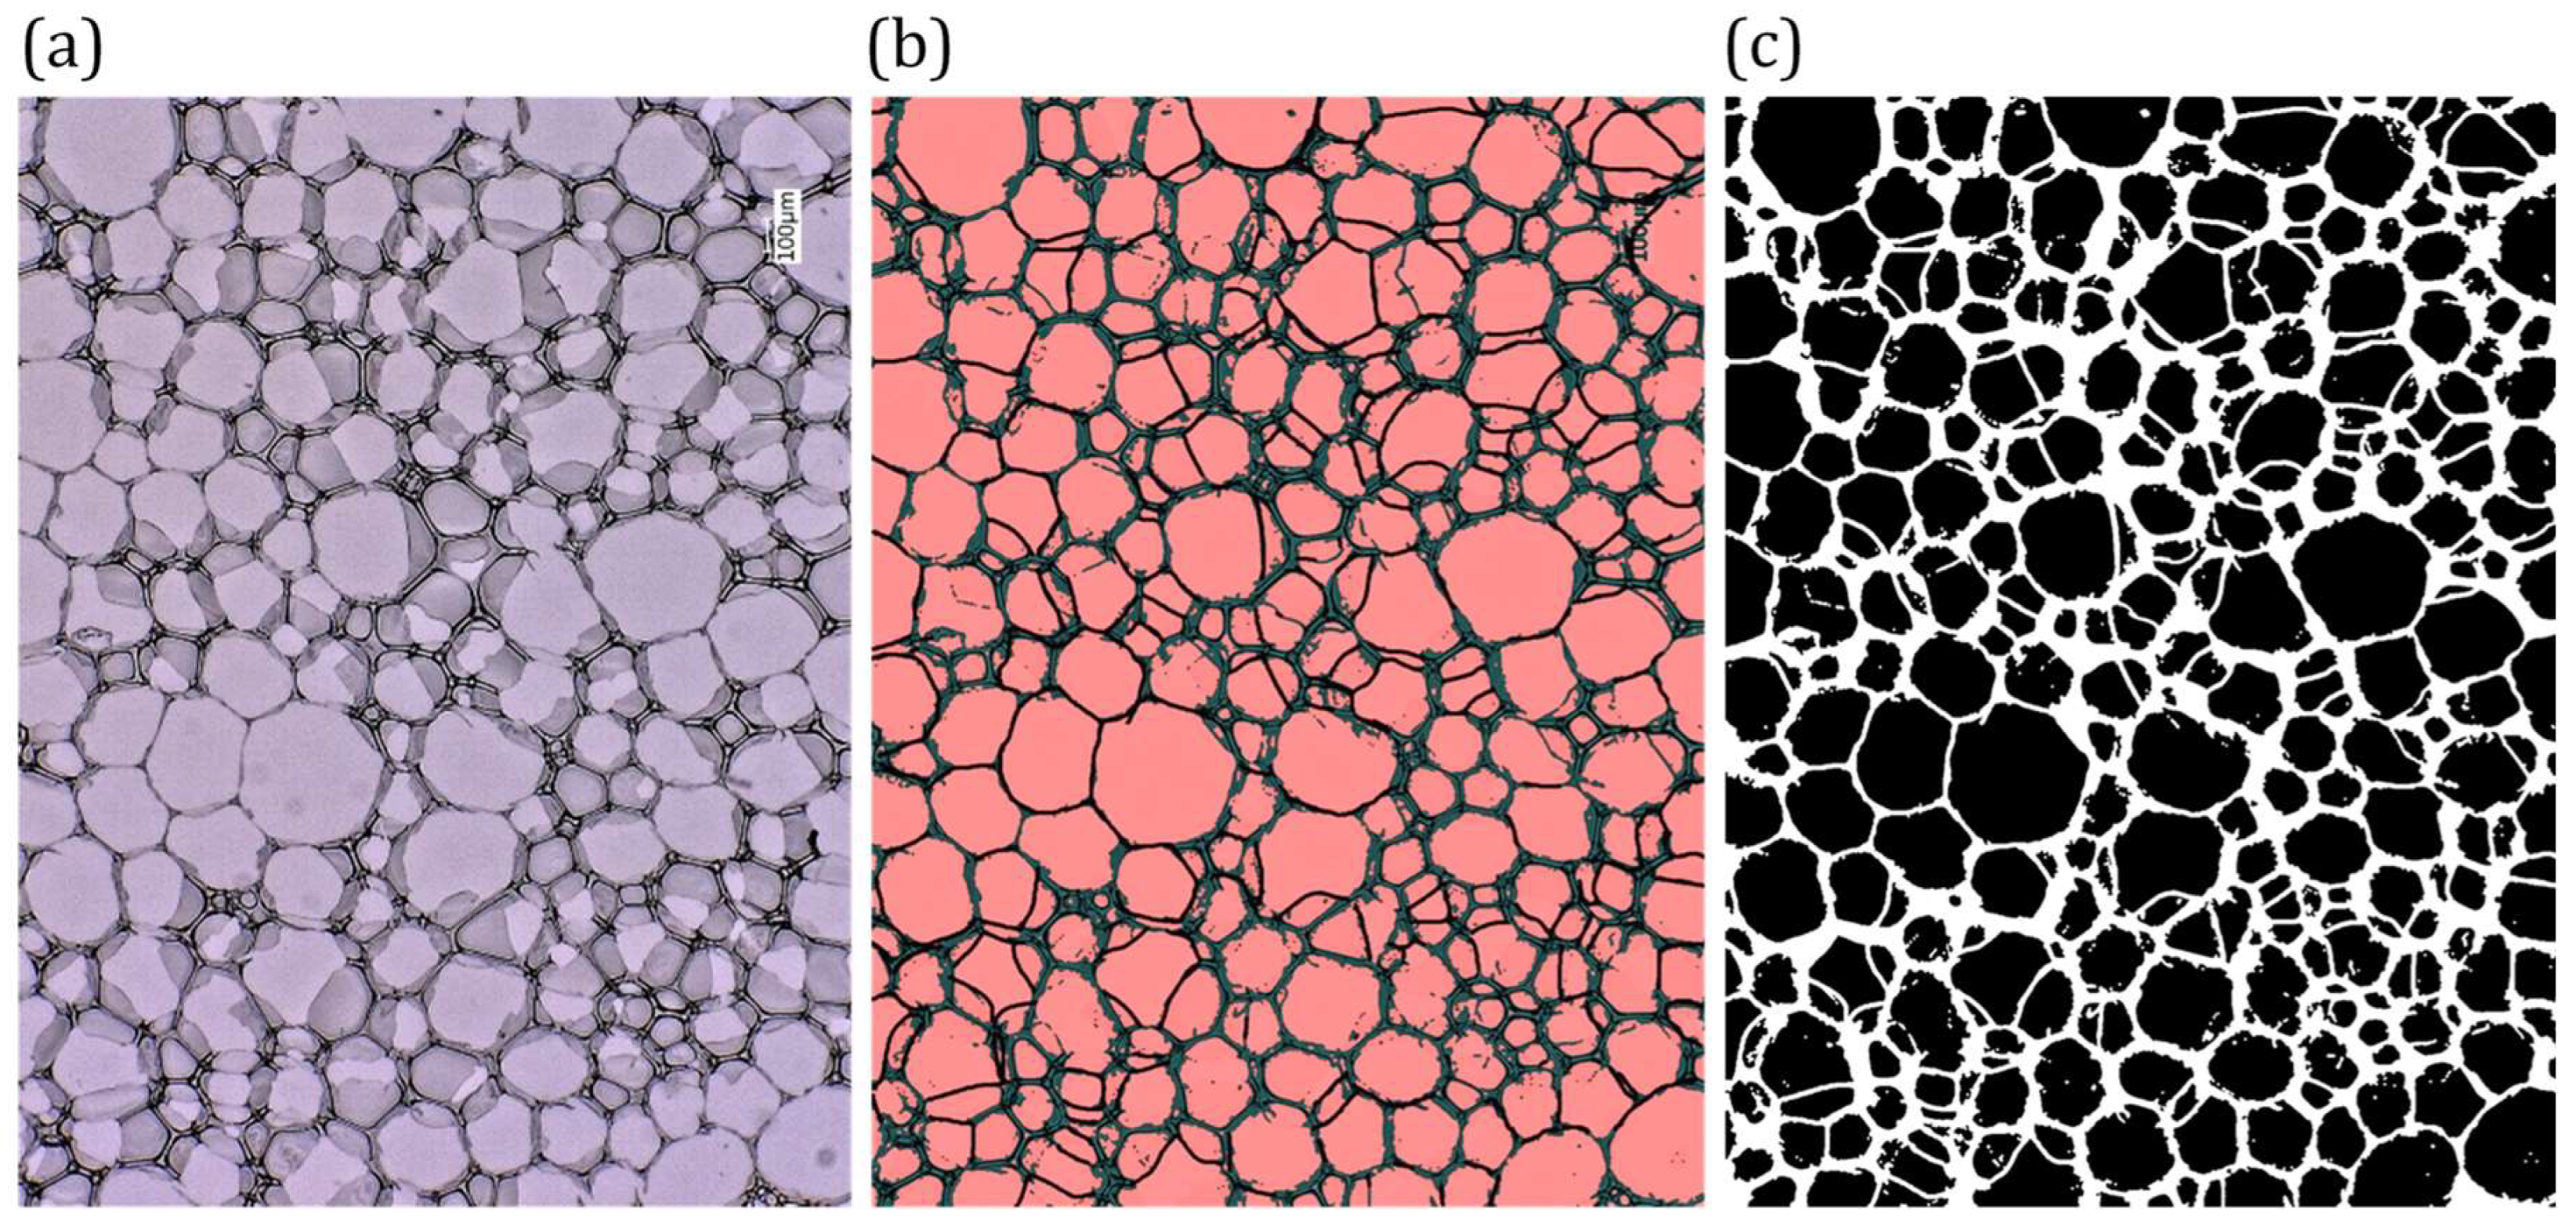
Mean cell diameter and cell areal density were determined from five sections acquired at 100× magnification. Cell segmentation and annotation were performed using a custom image analysis program developed in LabVIEW (National Instruments, Austin, TX, USA). The protocol for image processing is presented in Figure 1.

2.4.2. Thermal Properties

The thermal conductivity (λ, W·m−1·K−1) and volumetric heat capacity (Cp, J·m−3·K−1) of the sandwich panels were determined using a heat flow meter (FOX 314, TA Instruments, New Castle, DE, USA) in accordance with ISO 8301 [22]. Thermal measurements were conducted on one specimen of each sandwich panel type. The measurements of thermal conductivity and volumetric heat capacity were performed separately. Prior to testing, all samples were conditioned at 20 °C and 60% relative humidity. The mass-specific heat capacity was calculated by dividing the measured volumetric heat capacity by the material density.

2.4.3. Internal Bond Strength

The internal bond strength (IB, N/mm2) of the sandwich panels was tested according to EN 319 [23]. The procedure was adapted to account for the sandwich-panel construction, which differs from the homogeneous wood-based panels that EN 319 was originally developed for, and to ensure uniform tensile loading perpendicular to the panel plane. As the same testing configuration was applied to all specimens, the modification was not expected to affect the comparative evaluation of the investigated formulations. Panels consisted of 10 mm poplar plywood facings bonded with a 30 mm PUR foam core layer. Two panels were produced for both foam formulations. Six test specimens measuring 50 × 50 mm, were cut from each panel, resulting in twelve replicas for each tested foam. To ensure uniaxial tensile loading perpendicular to the panel plane, auxiliary plywood blocks (70 × 50 mm) were bonded to both faces of each specimen with a commercial PUR adhesive. Tensile load was applied at a constant crosshead displacement rate of 2 mm/min on the universal testing machine (Zwick/Roell, Ulm, Germany) until failure. The value of IB was calculated as a ratio of the maximum failure load to the bonded cross-sectional area.

2.4.4. Compression Strength

The compressive properties of the sandwich panel specimens were evaluated on the universal testing machine (Zwick/Roell, Ulm, Germany). Five specimens of each sandwich panel type were tested. A preload of 50 N was applied before each test to ensure full contact between the specimen and the compression platens. Compression was then applied at a constant crosshead displacement rate of 5 mm/min until a compressive strain of 30% was reached. Compressive strength was defined as the stress noticed at 20% of strain. Young’s modulus in compression was determined from the linear-elastic portion of the stress–strain curve, bounded by the load range of 100 to 300 N.

2.4.5. Sound Transmission Loss and Sound Absorption

Normal-incidence sound transmission loss and sound absorption coefficient were measured using an impedance tube system (Type 4206-T, Brüel & Kjær, Nærum, Denmark). The system comprises interchangeable metal tubes of 100 mm internal diameter, a broadband loudspeaker, and standardized specimen holders. Signal acquisition was performed with four ¼-inch condenser microphones (Type 4187, Brüel & Kjær, Nærum, Denmark), a LAN-Xi data acquisition module (Type 3060-A-042), and a power amplifier (Type 2735, Brüel & Kjær, Nærum, Denmark). All data acquisition and post-processing were carried out in the PULSE LabShop software, version 29.1 (Brüel & Kjær, Nærum, Denmark). One specimen of each sandwich panel type was tested.
Sound transmission loss measurements were performed using a broadband random signal and two termination conditions at the end of the impedance tube. A full absorbent termination was assured by using a 100 mm diameter rigid melamine foam layer. Sound pressure was measured using four microphones, with two positioned upstream of the specimens and two downstream. The measurement of the empty tube (without a sample) was considered as the reference. It was followed by the same measurement protocol, but with the tested foam sample installed inside the tube. The transmission loss TLn was defined as 0 dB for the empty tube in the frequency range above 125 Hz. Based on the measured pressure signals, the sound pressure and particle velocity fields on both sides of the specimen were determined, allowing calculation of the transfer matrix coefficients according to ASTM E2611-17 [24]. The transfer-matrix method was applied to resolve incident, reflected, and transmitted wave components. Sound absorption measurements followed ISO 10534-2 and ASTM E1050-12 [25,26]. The absorption coefficient (α) was derived from the measured transfer function between two microphones.

2.4.6. Statistical Analysis and Data Interpretation

Statistical analyses were performed on Microsoft Excel (Microsoft Corporation, Redmond, WA, USA). Differences between the REF and NW panels were evaluated using Welch’s two-tailed t-test. Due to the exploratory and preliminary nature of this study, the number of replicates was relatively low. Consequently, the statistical power of the analyses was limited. The t-test was applied to selected properties, including CIELAB color coordinates, cell wall thickness measurement, gas pycnometry measurements, internal bond strength, compressive strength and modulus of elasticity, to provide a preliminary assessment of the differences between the panel types. For the remaining properties, the results are presented primarily in a qualitative or descriptive manner and are not sufficient to support robust statistical conclusions. The study was designed as a preliminary feasibility investigation; therefore, the results are intended primarily to identify trends and assess technical viability rather than to establish definitive performance relationships.

3. Results

3.1. PUR Foams Characterization

3.1.1. FTIR Characterization

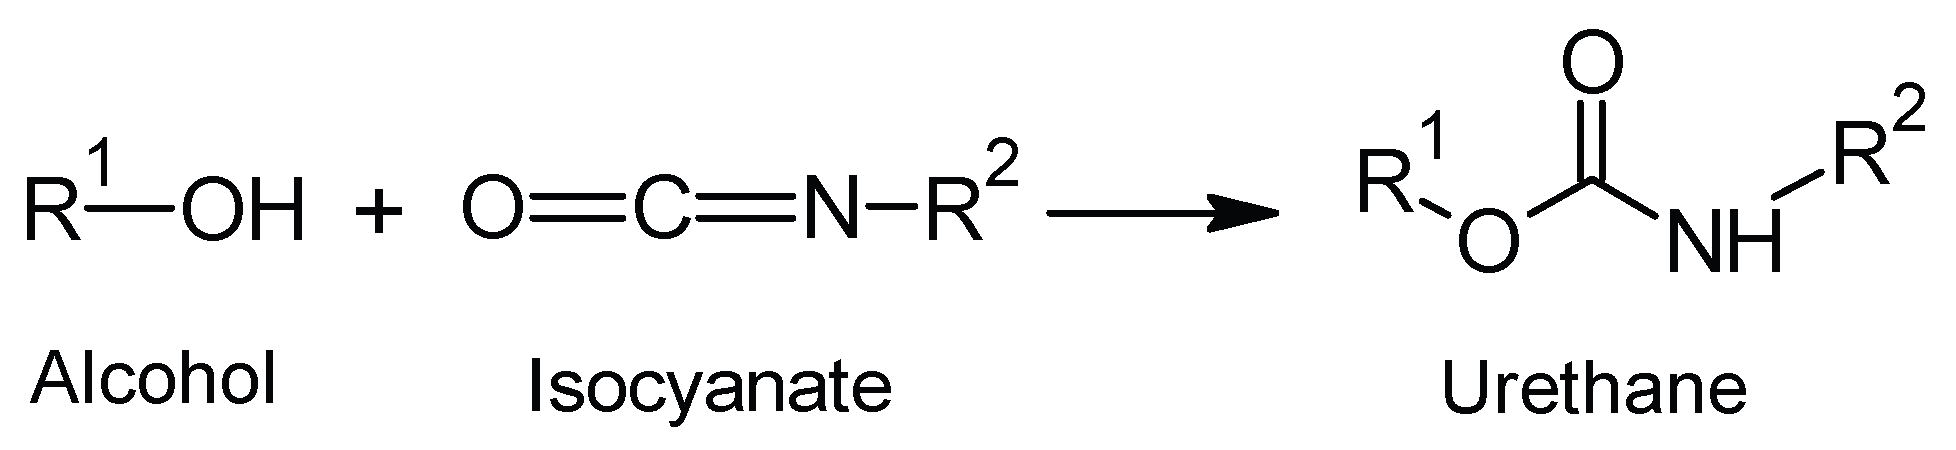
To verify the consumption of polyol and isocyanate components and the formation of urethane linkages, FTIR characterization was performed on formulated foam specimens. Two main chemical reactions take place during polyurethane foam preparation. The first one is the reaction between a hydrogen active compound, in this case the hydroxyl groups of the polyol component and the isocyanate, shown in Figure 2, which leads to the formation of urethane linkages that provide the backbone of the polymeric structure.
The reaction proceeds as an addition of the nucleophilic oxygen atom of the hydroxyl group on the electrophilic carbon of the carbon–nitrogen double bond of the isocyanate [27].
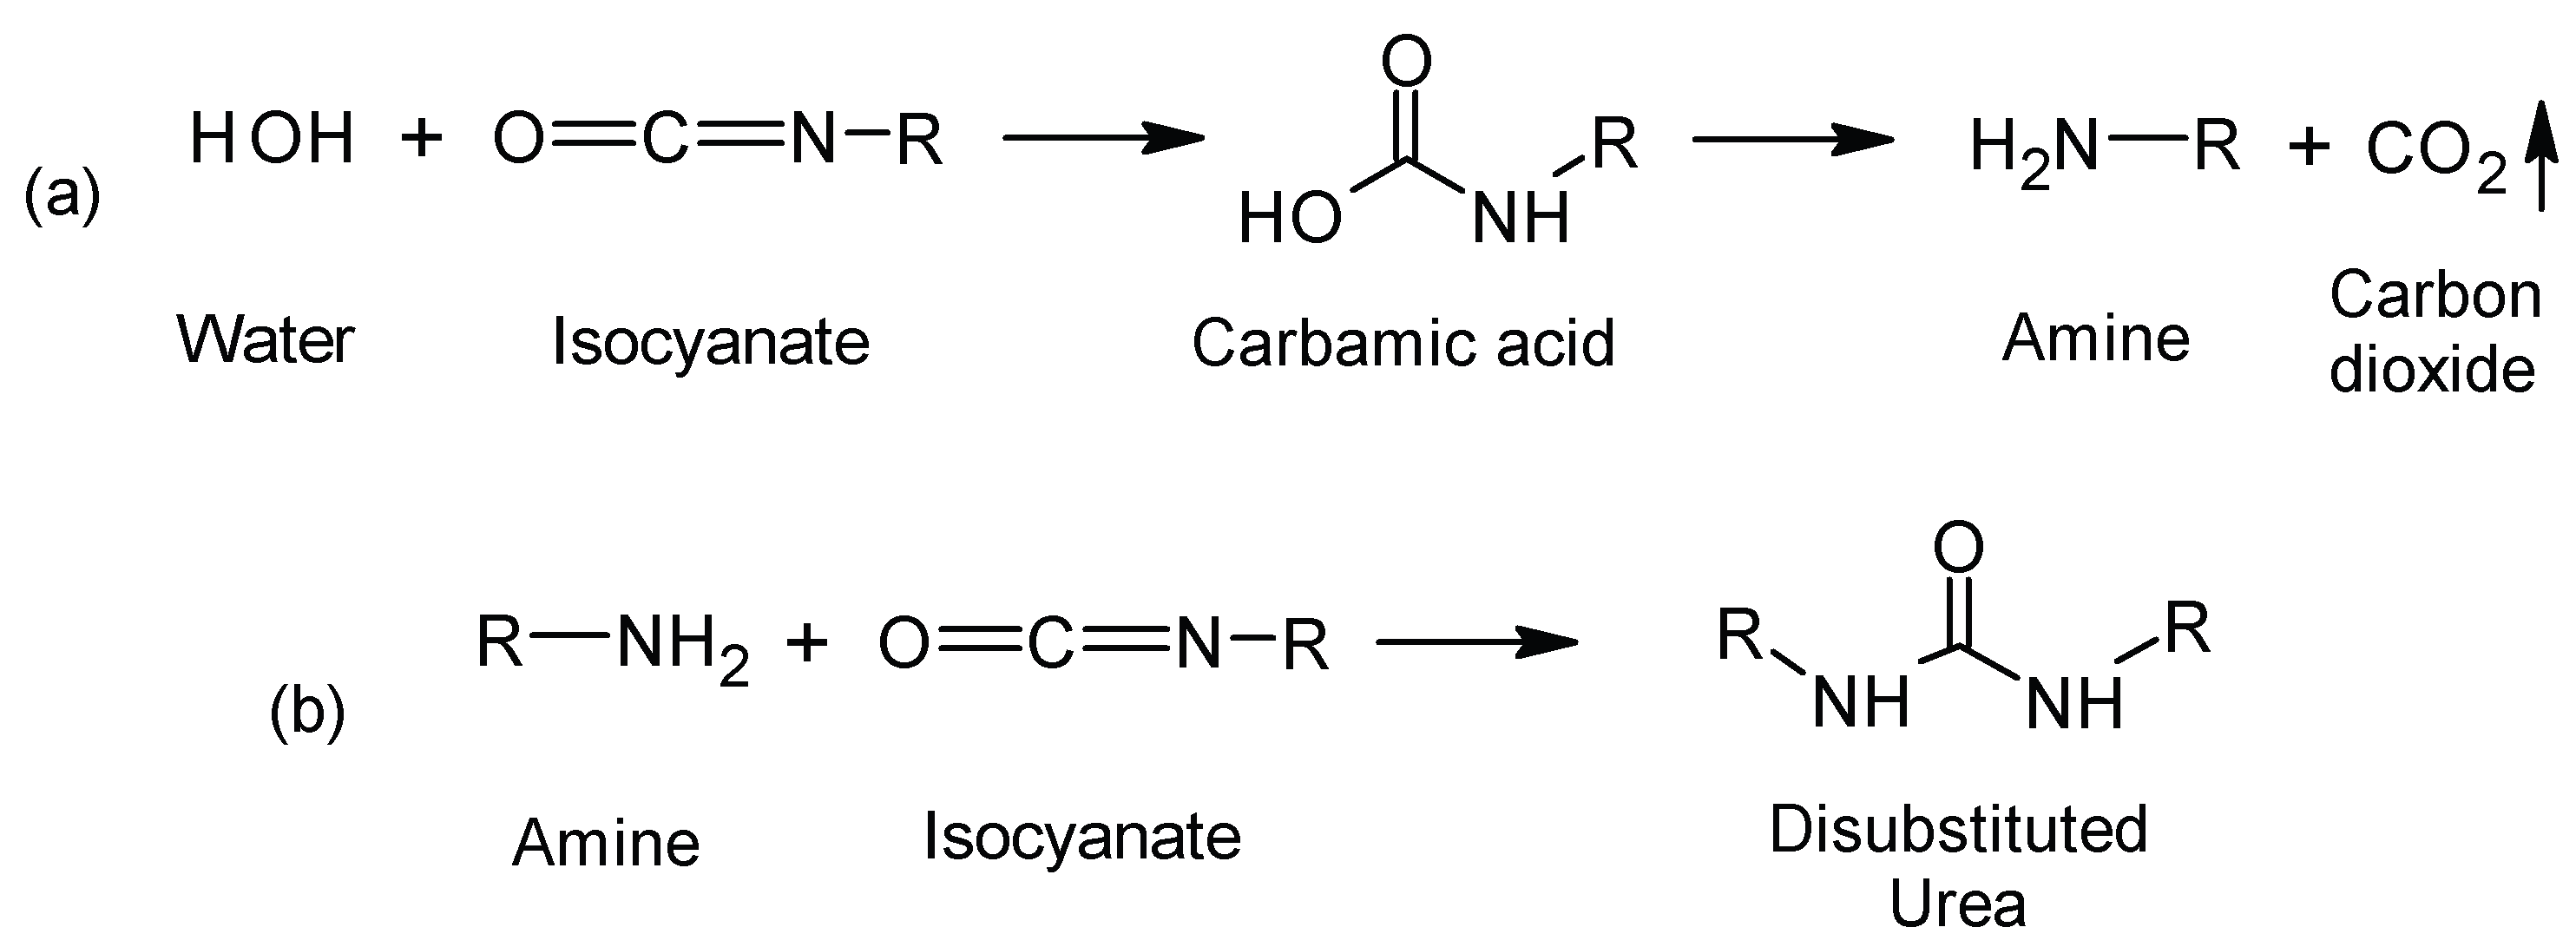
The second reaction is the one that takes place between water molecules and the isocyanate, which yields an unstable carbamic acid species that decomposes into an amine compound and gaseous carbon dioxide, accompanied by the release of heat [28,29]. The latter serves as the gas source that generates the cellular structure of the polyurethane foam. The amine generated by this reaction further reacts with other isocyanate molecules, leading to the formation of disubstituted urea linkages [29]. The two reactions are schematized in Figure 3.
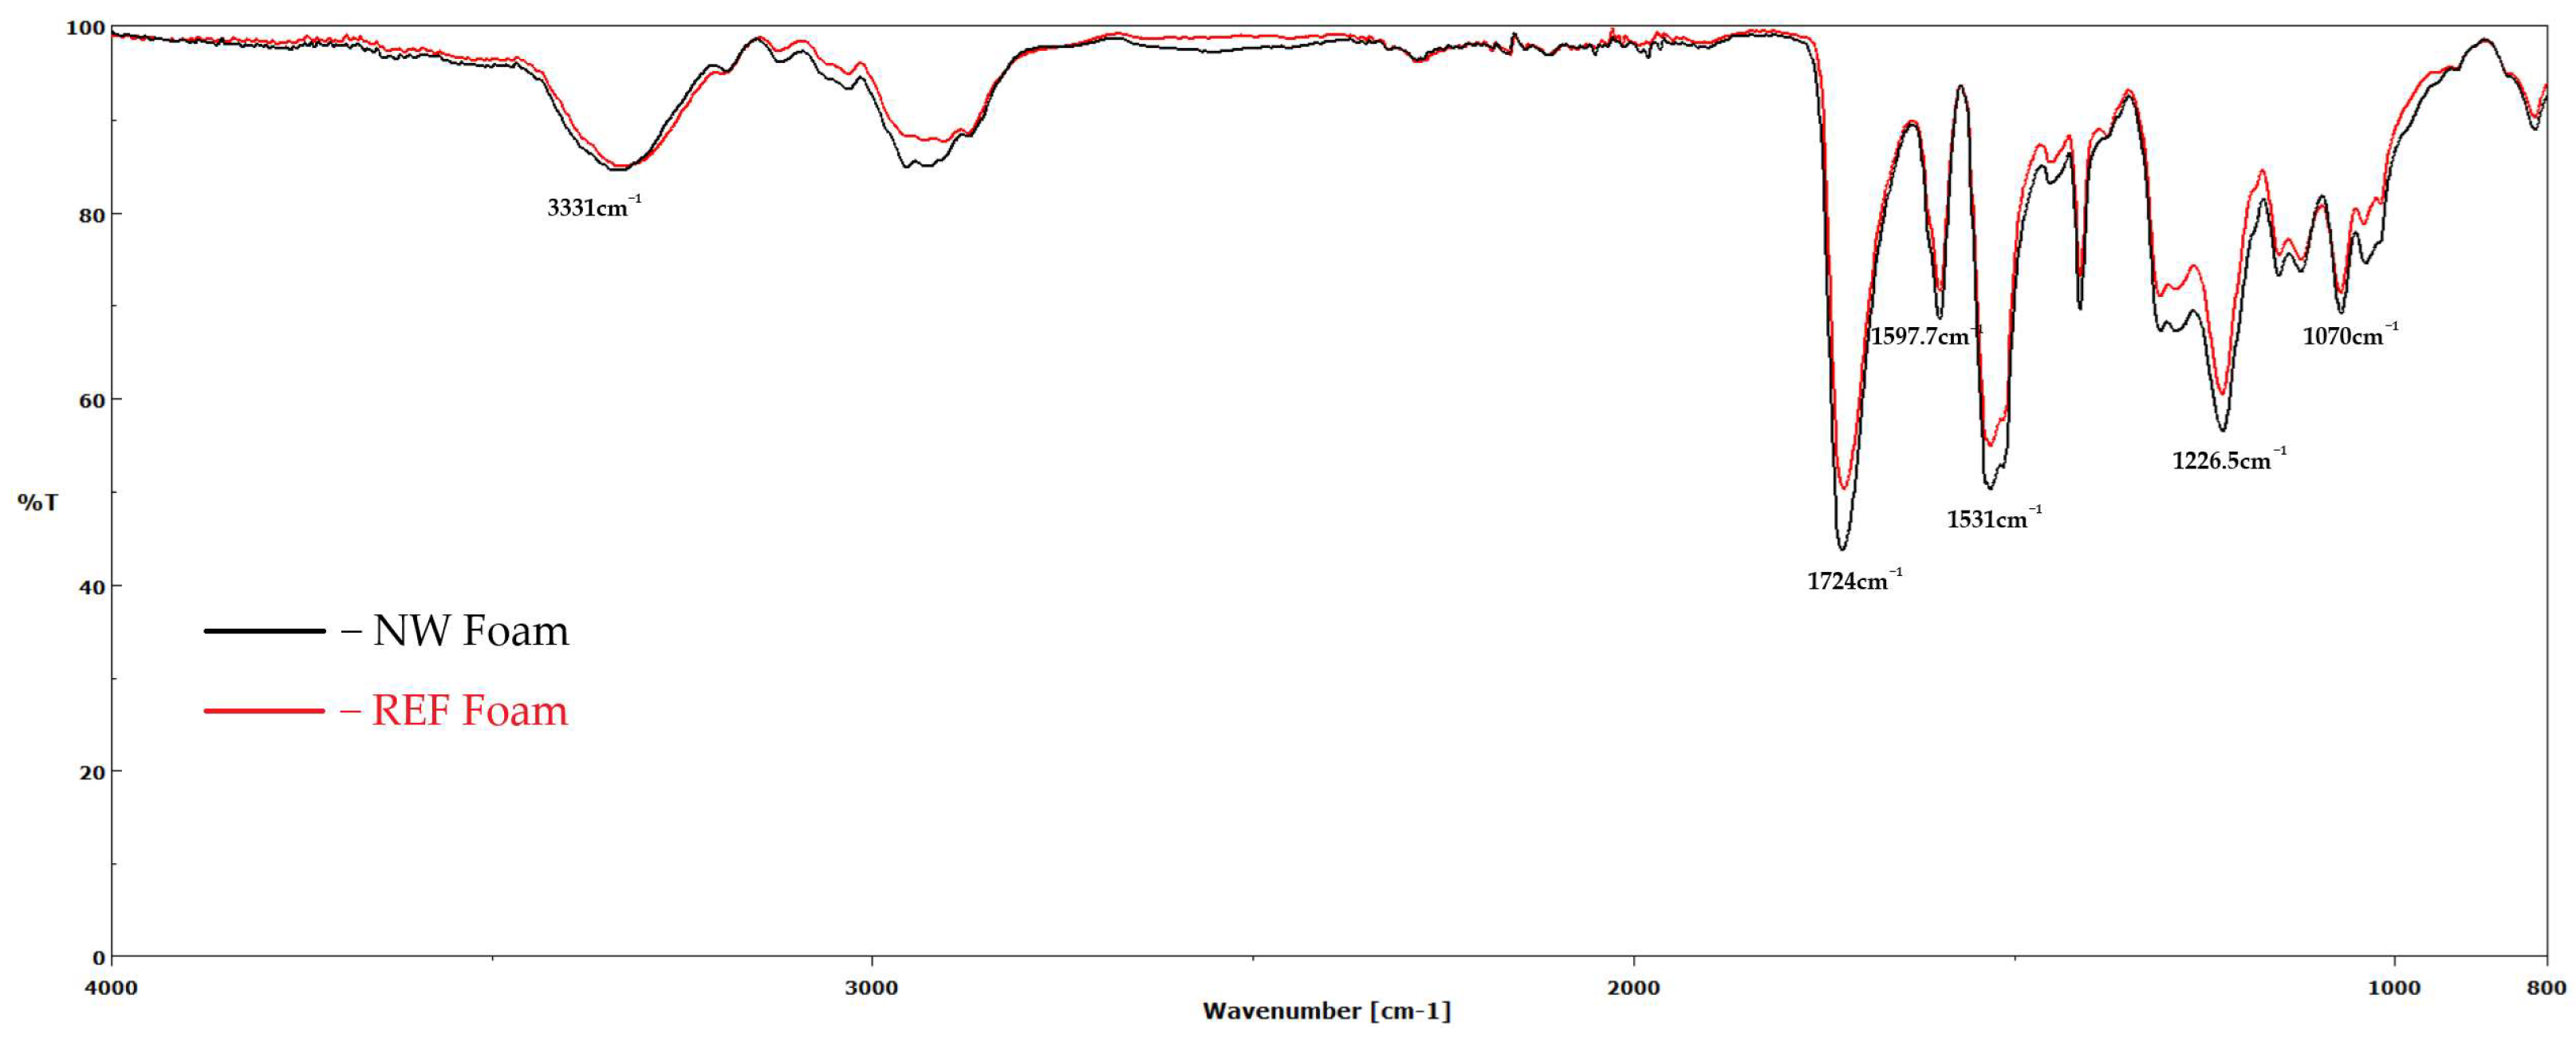
The FTIR spectra of the REF and NW foams are shown in Figure 4. The medium intensity, slightly broad peak at approximately 3331 cm−1 can be assigned as the N-H stretching of the secondary amine of the urethane group [30]. At 1724–1726 cm−1, there is a sharp, intense peak that can be assigned to the stretching of the urethane carbonyl group. Since no polyester-type polyols were used in the formulation, this band proves the formation of the urethane linkage, corroborated by the absence of any residual intense peaks at around 2270 cm−1, which is typically associated with the free isocyanate group. The sharp band at 1597 cm−1 can be attributed to the C-C stretching of the aromatic ring relative to the isocyanate [31]. The intense peak at 1531 cm−1 is typically associated with the C-N stretching of the carbamate group, with overlapping contributions from the N-H bending vibration [32]. The peak at 1226 cm−1 can be attributed to the asymmetric stretching of the C-O-C ether linkage of the carbamate group, while the peak associated with the symmetric stretching of the same can be identified at lower wavenumbers, in this case at approximately 1070 cm−1 [32,33].

3.1.2. Density, Reactivity, Mechanical, and Flame Resistance Properties of PUR Foams

The FPBO-derived polyol BTG_NW_SPOH (2565) is a solid foam at room temperature; therefore, a diluent is required to bring its viscosity to a serviceable level. For this purpose, triethyl phosphate (TEP), a commonly employed diluent and fire-retardant additive, was used at a 70/30 w/w% polyol/diluent blend ratio. The results of the comparative evaluation are reported in Table 2. In terms of reactivity, the NW foam presents a slightly faster string time of 91 s, compared to the 103 s of the reference. The same was not observed for the tack-free time, which is 19 secs longer for the NW foam. The free-rise density of the bio-based foam is slightly lower than the reference, 32.3 kg/m3 compared to 35.7 kg/m3.
The NW foam exhibits inferior mechanical properties compared to the reference, as the compressive strength measured both parallel and perpendicular to the foam growth direction was lower than that of the reference foam.
The dimensional stability of NW foam is lower than that of the REF but still within the acceptable range for rigid PUR foams, typically defined as <3% volume variation. Noticeable improvements related to the flame resistance of the bio-based foam were observed, where an average afterflame time of 7.8 s was measured, in contrast to the 13.7 s measured for the reference foam.

3.1.3. Colorimetry

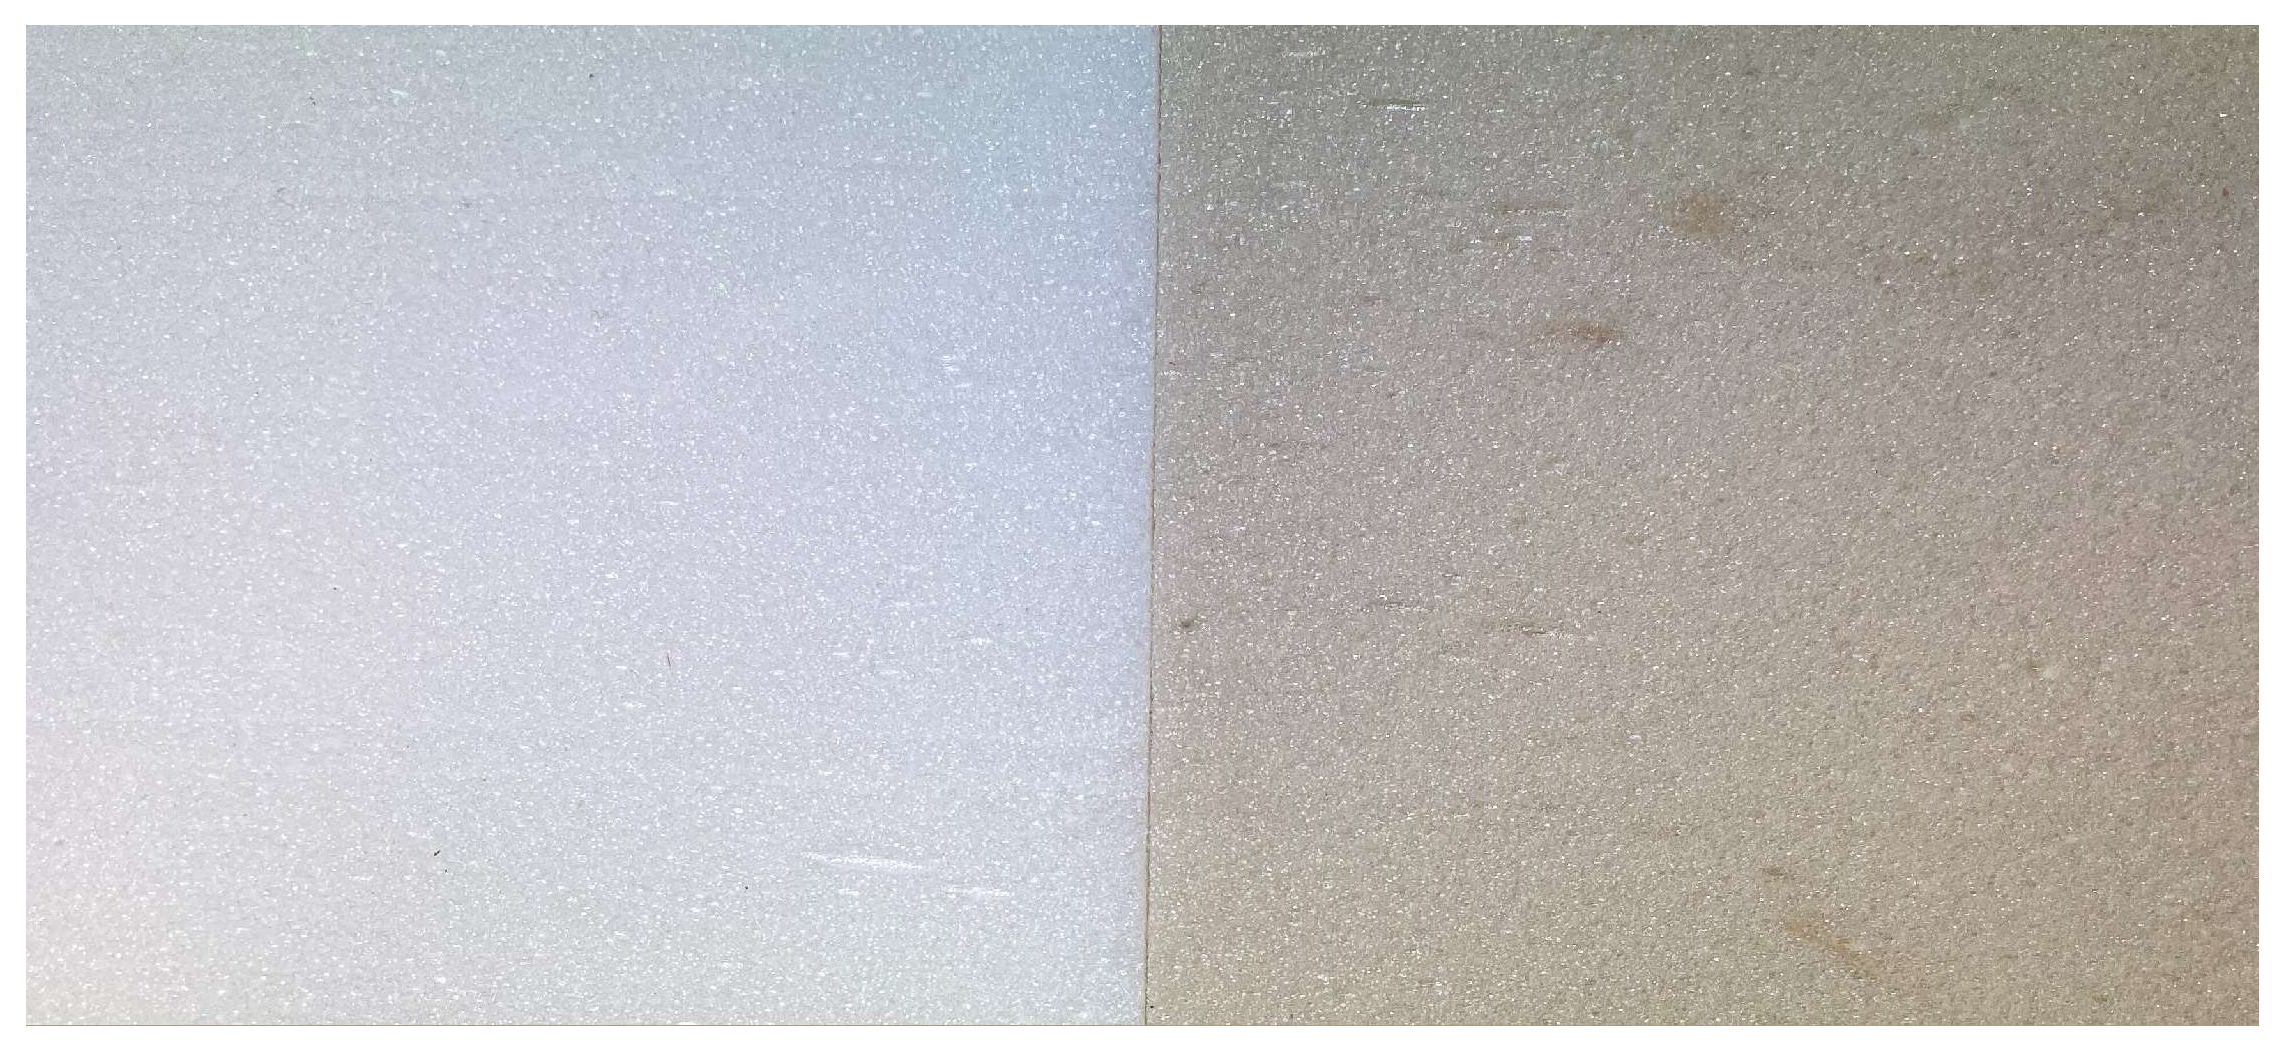
The colorimetric results for the NW and REF foam specimens are summarized in Table 3. Both foams differ visually in a manner immediately apparent to the naked eye, which is reflected in CIE Lab color coordinates (Figure 5).
The NW Foam exhibited a lower lightness value (L* = 80.30) compared to the REF Foam (L* = 85.87), indicating a darker overall appearance. The most pronounced difference was observed in the b* coordinate, where the NW foam showed a higher value (b* = 15.68 vs. 8.83 for REF), reflecting a substantially stronger yellow–brown hue. The a* coordinate shifted from negative in REF (a* = −0.92, indicating a faint green tint) to positive in NW (a* = 1.47), suggesting a subtle reddish shift as a result of incorporating the pyrolysis oil. Significant differences between the samples were observed for all CIELAB color coordinates (L*, a*, and b*) (Welch’s two-sample t-test, n = 5, two-tailed, α = 0.05, p < 0.001).
The total color difference, calculated as the Euclidean distance in CIE Lab space, was ΔE* = 9.14. This value exceeds the threshold of ΔE* = 5 conventionally used to classify color differences as perceptually noticeable, confirming that the two foams are chromatically distinct and that the difference is immediately obvious upon visual inspection.

3.1.4. Microscopy

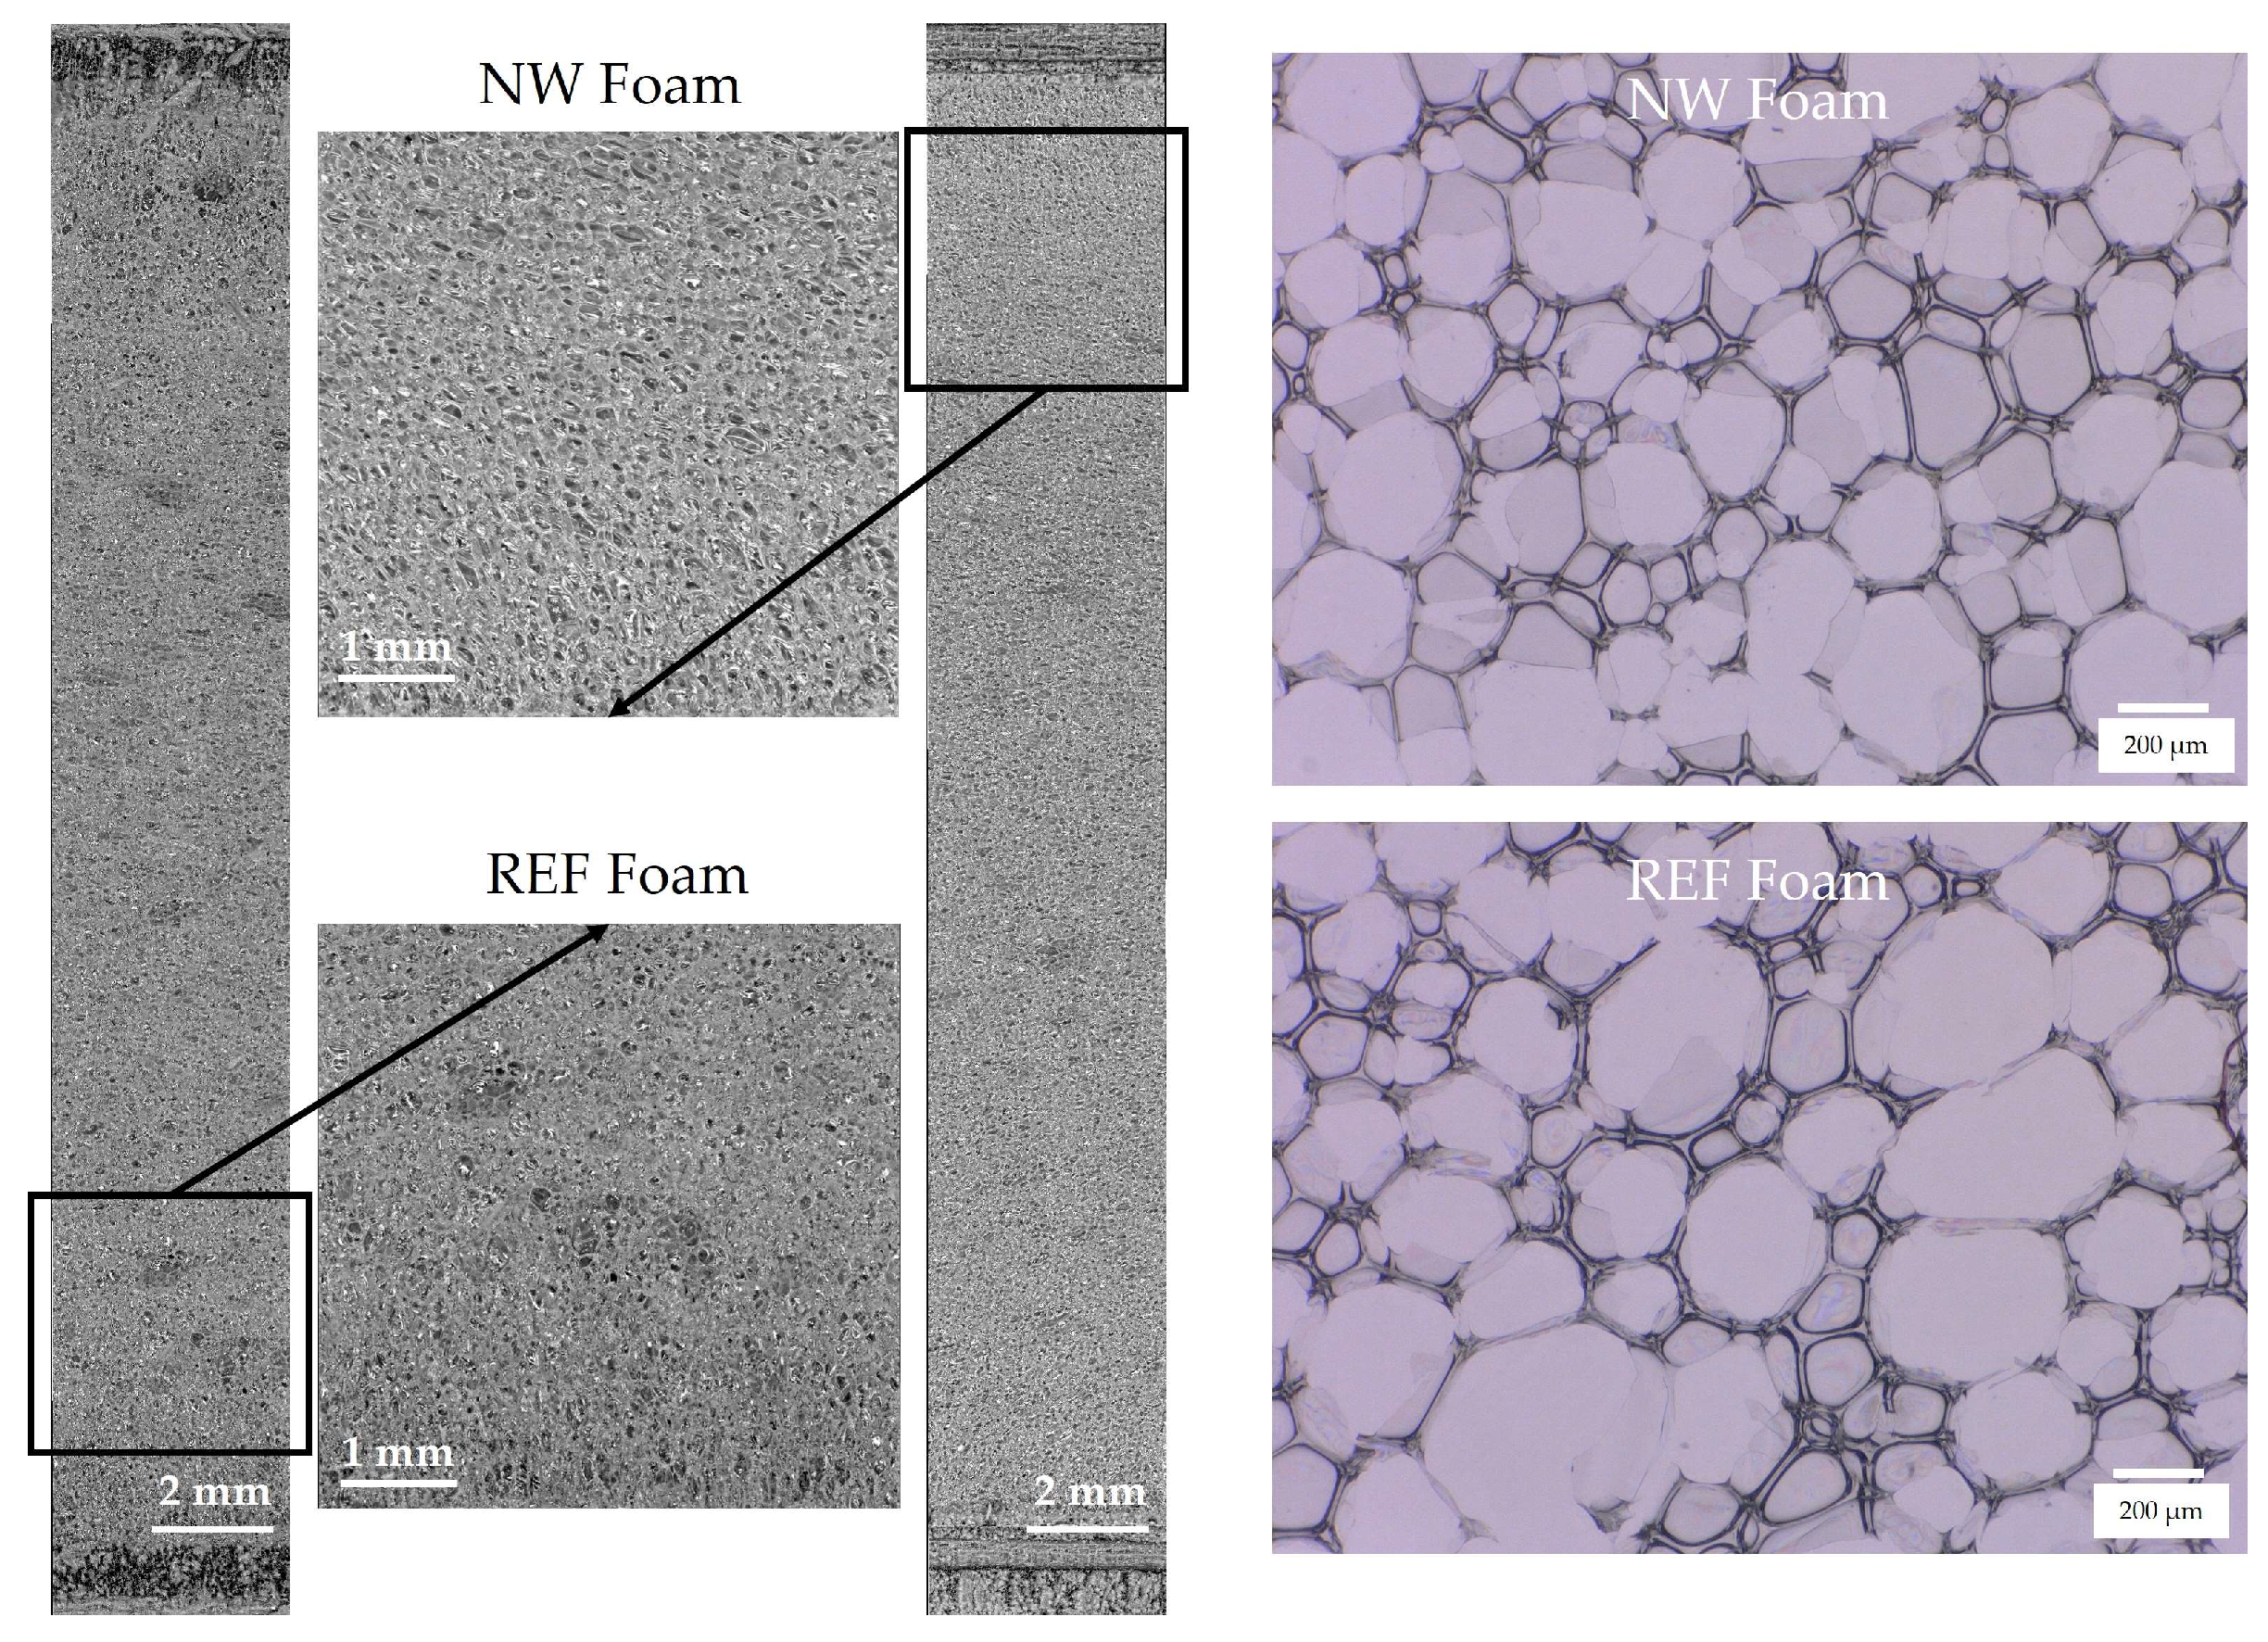
The microstructural analysis of PUR foams revealed a predominantly closed-cell structure in both samples. The REF foam exhibited a more heterogeneous structure, with irregularly shaped and partially collapsed cells, as well as a broader cell size distribution. In contrast, the NW foam showed a more uniform and elongated cell structure (Figure 6).
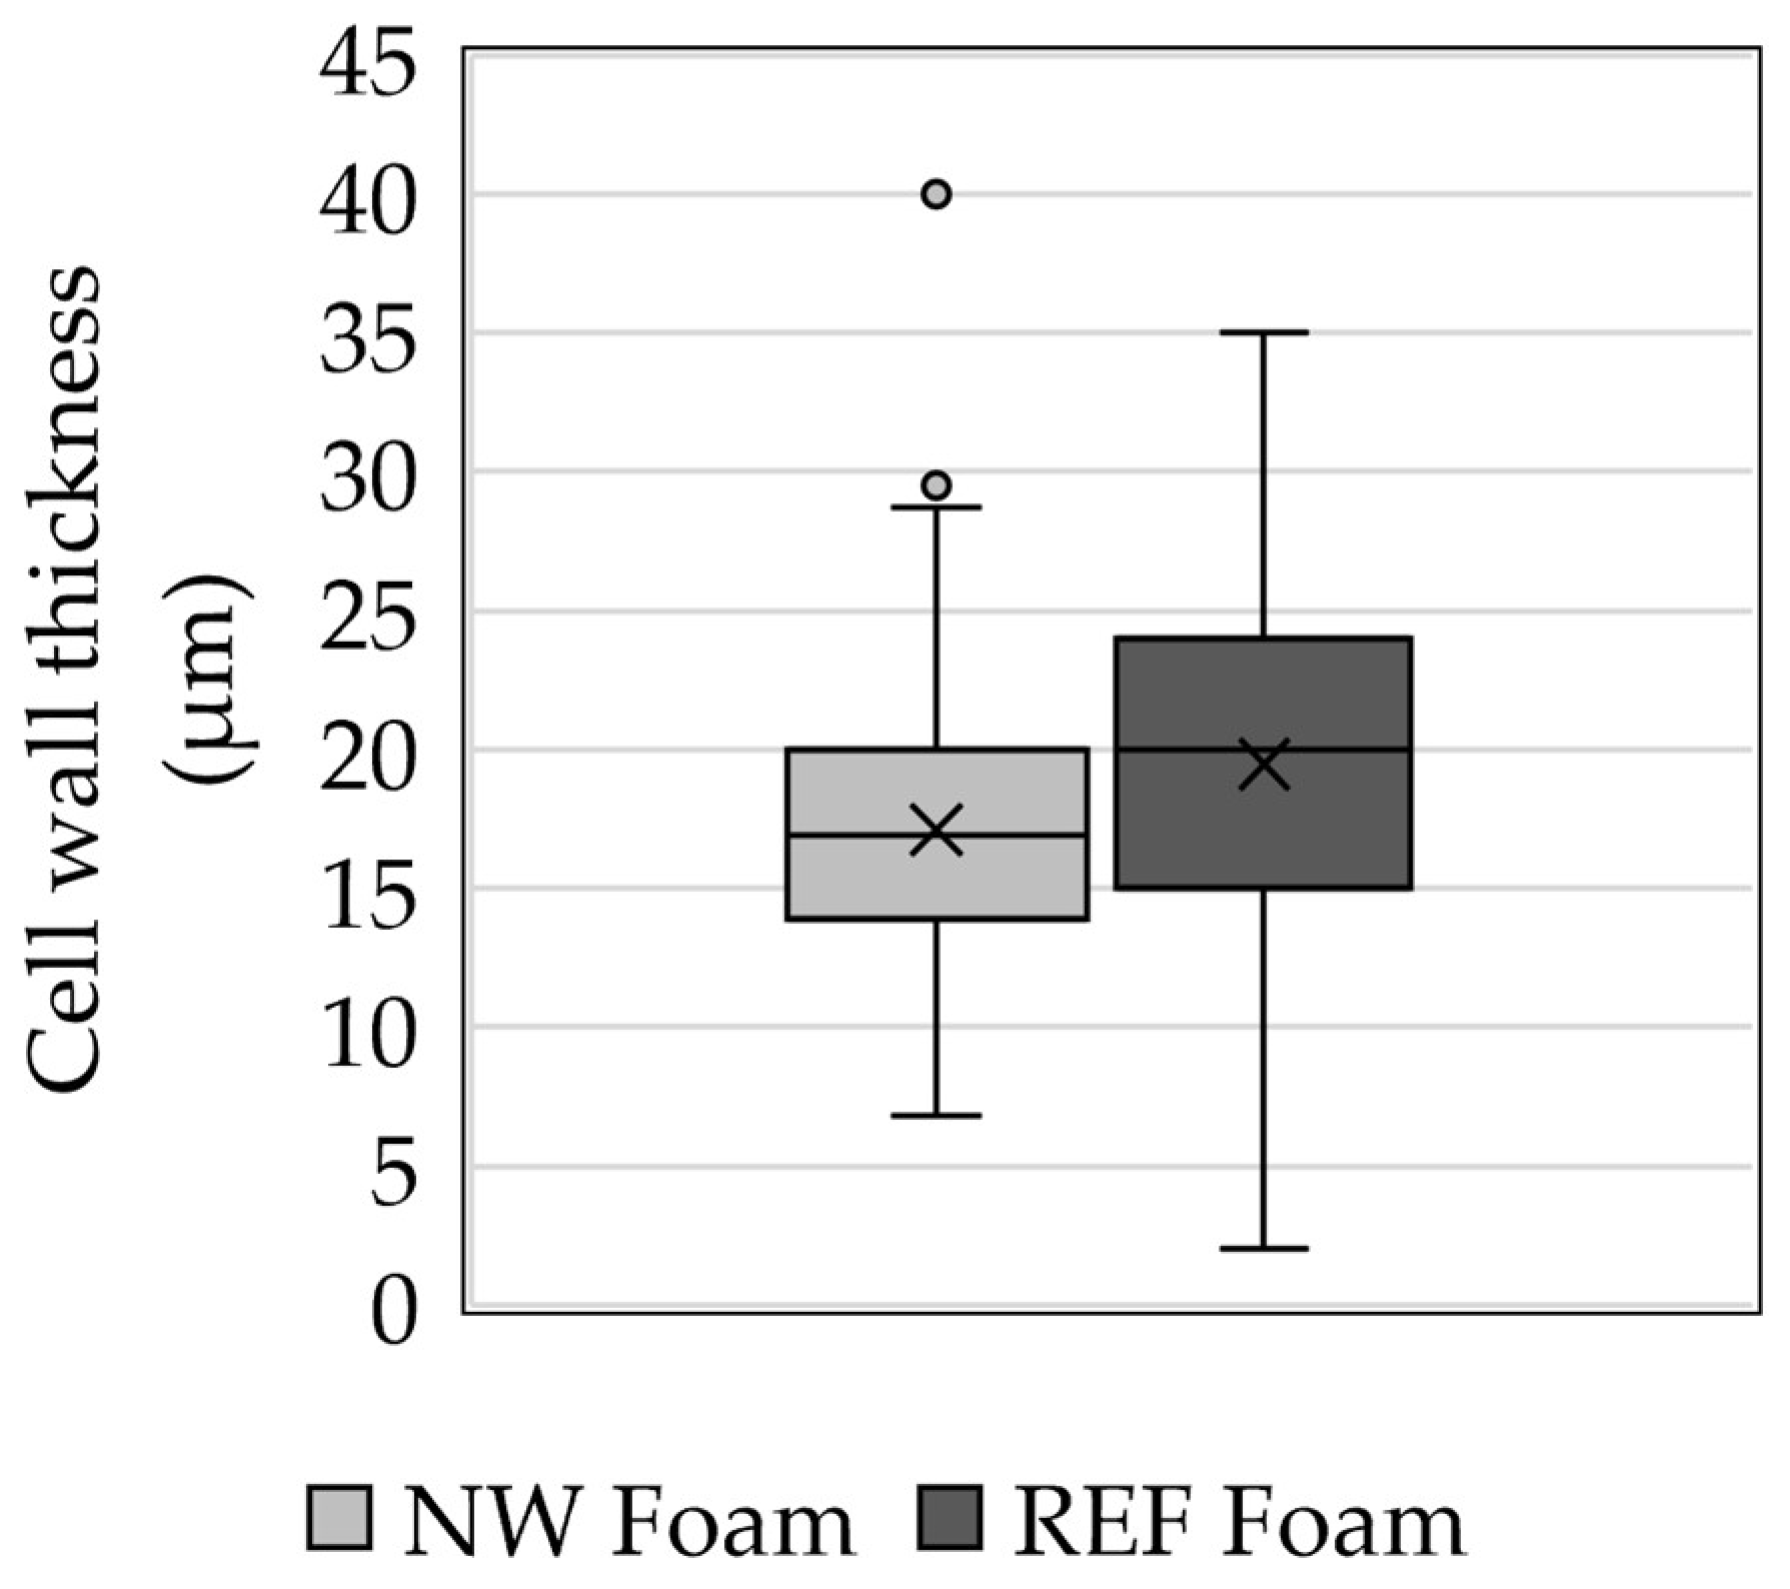
The thinner cell walls appeared to be in the NW foam. The mean cell-wall thickness was 17.11 µm (SD = 5.45) for the NW foam and 19.46 µm (SD = 6.38) for the REF foam (Figure 7). Significant differences between the samples were observed (Welch’s two-sample t-test, based on 135 cell-wall measurements per group, two-tailed, α = 0.05, p < 0.001). Furthermore, the NW foam exhibited a higher areal cell density than the REF foam, with 28.9 cells/mm2 compared with 21.9 cells/mm2.
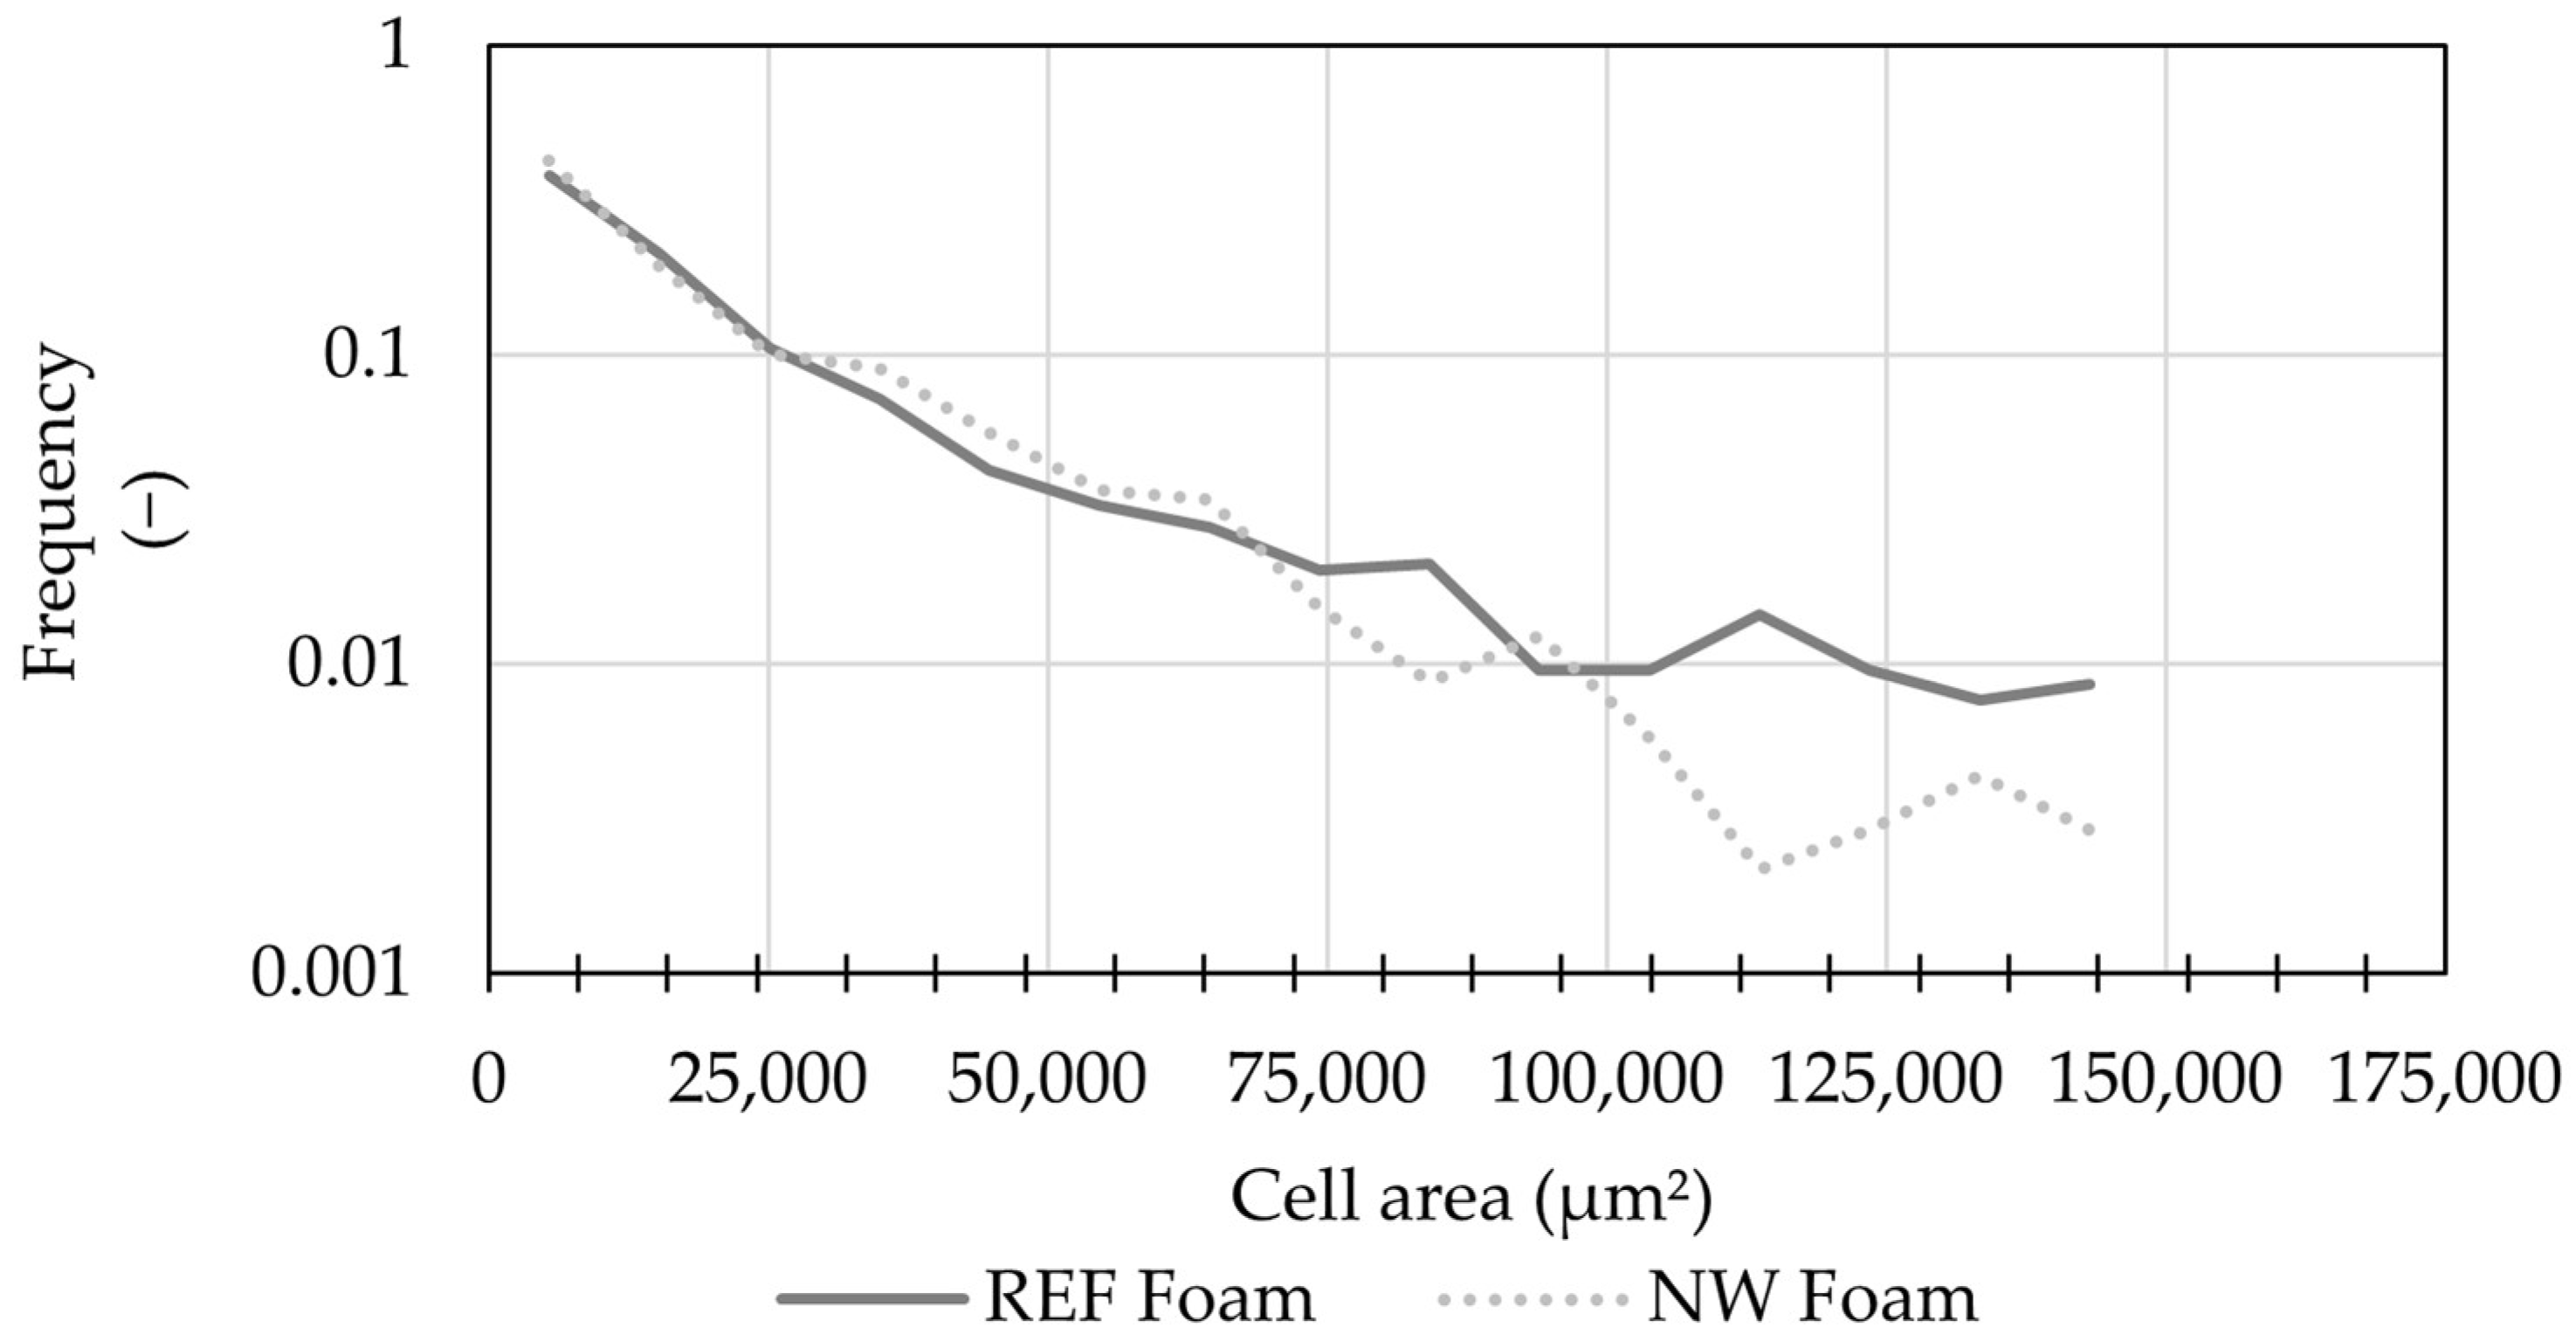
The cell area distribution is presented in Figure 8. Both foams exhibited a similar distribution of small cells, whereas larger cells were more frequently observed in the REF foam, indicating a broader cell-size distribution.

3.1.5. Gas Pycnometry

Table 4 presents the gas pycnometer measurements for the REF and NW foams, including envelope density, skeletal density, and total pore volume. The REF foam exhibited an envelope density of 0.0336 g/cm3 and a skeletal density of 0.0410 g/cm3, whereas the NW foam showed slightly lower values of 0.0335 g/cm3 and 0.0405 g/cm3, respectively. The total pore volume was also marginally lower in the NW foam (5.1680 cm3/g) compared to the REF foam (5.1860 cm3/g). The standard deviations reported in parentheses indicate low variability among measurements, suggesting good reproducibility and consistency of the foam structures. Moreover, the calculated ratio of open and closed cells is similar, reaching ~17% and ~82%, respectively, in both formulations.

3.1.6. Thermogravimetric Analysis

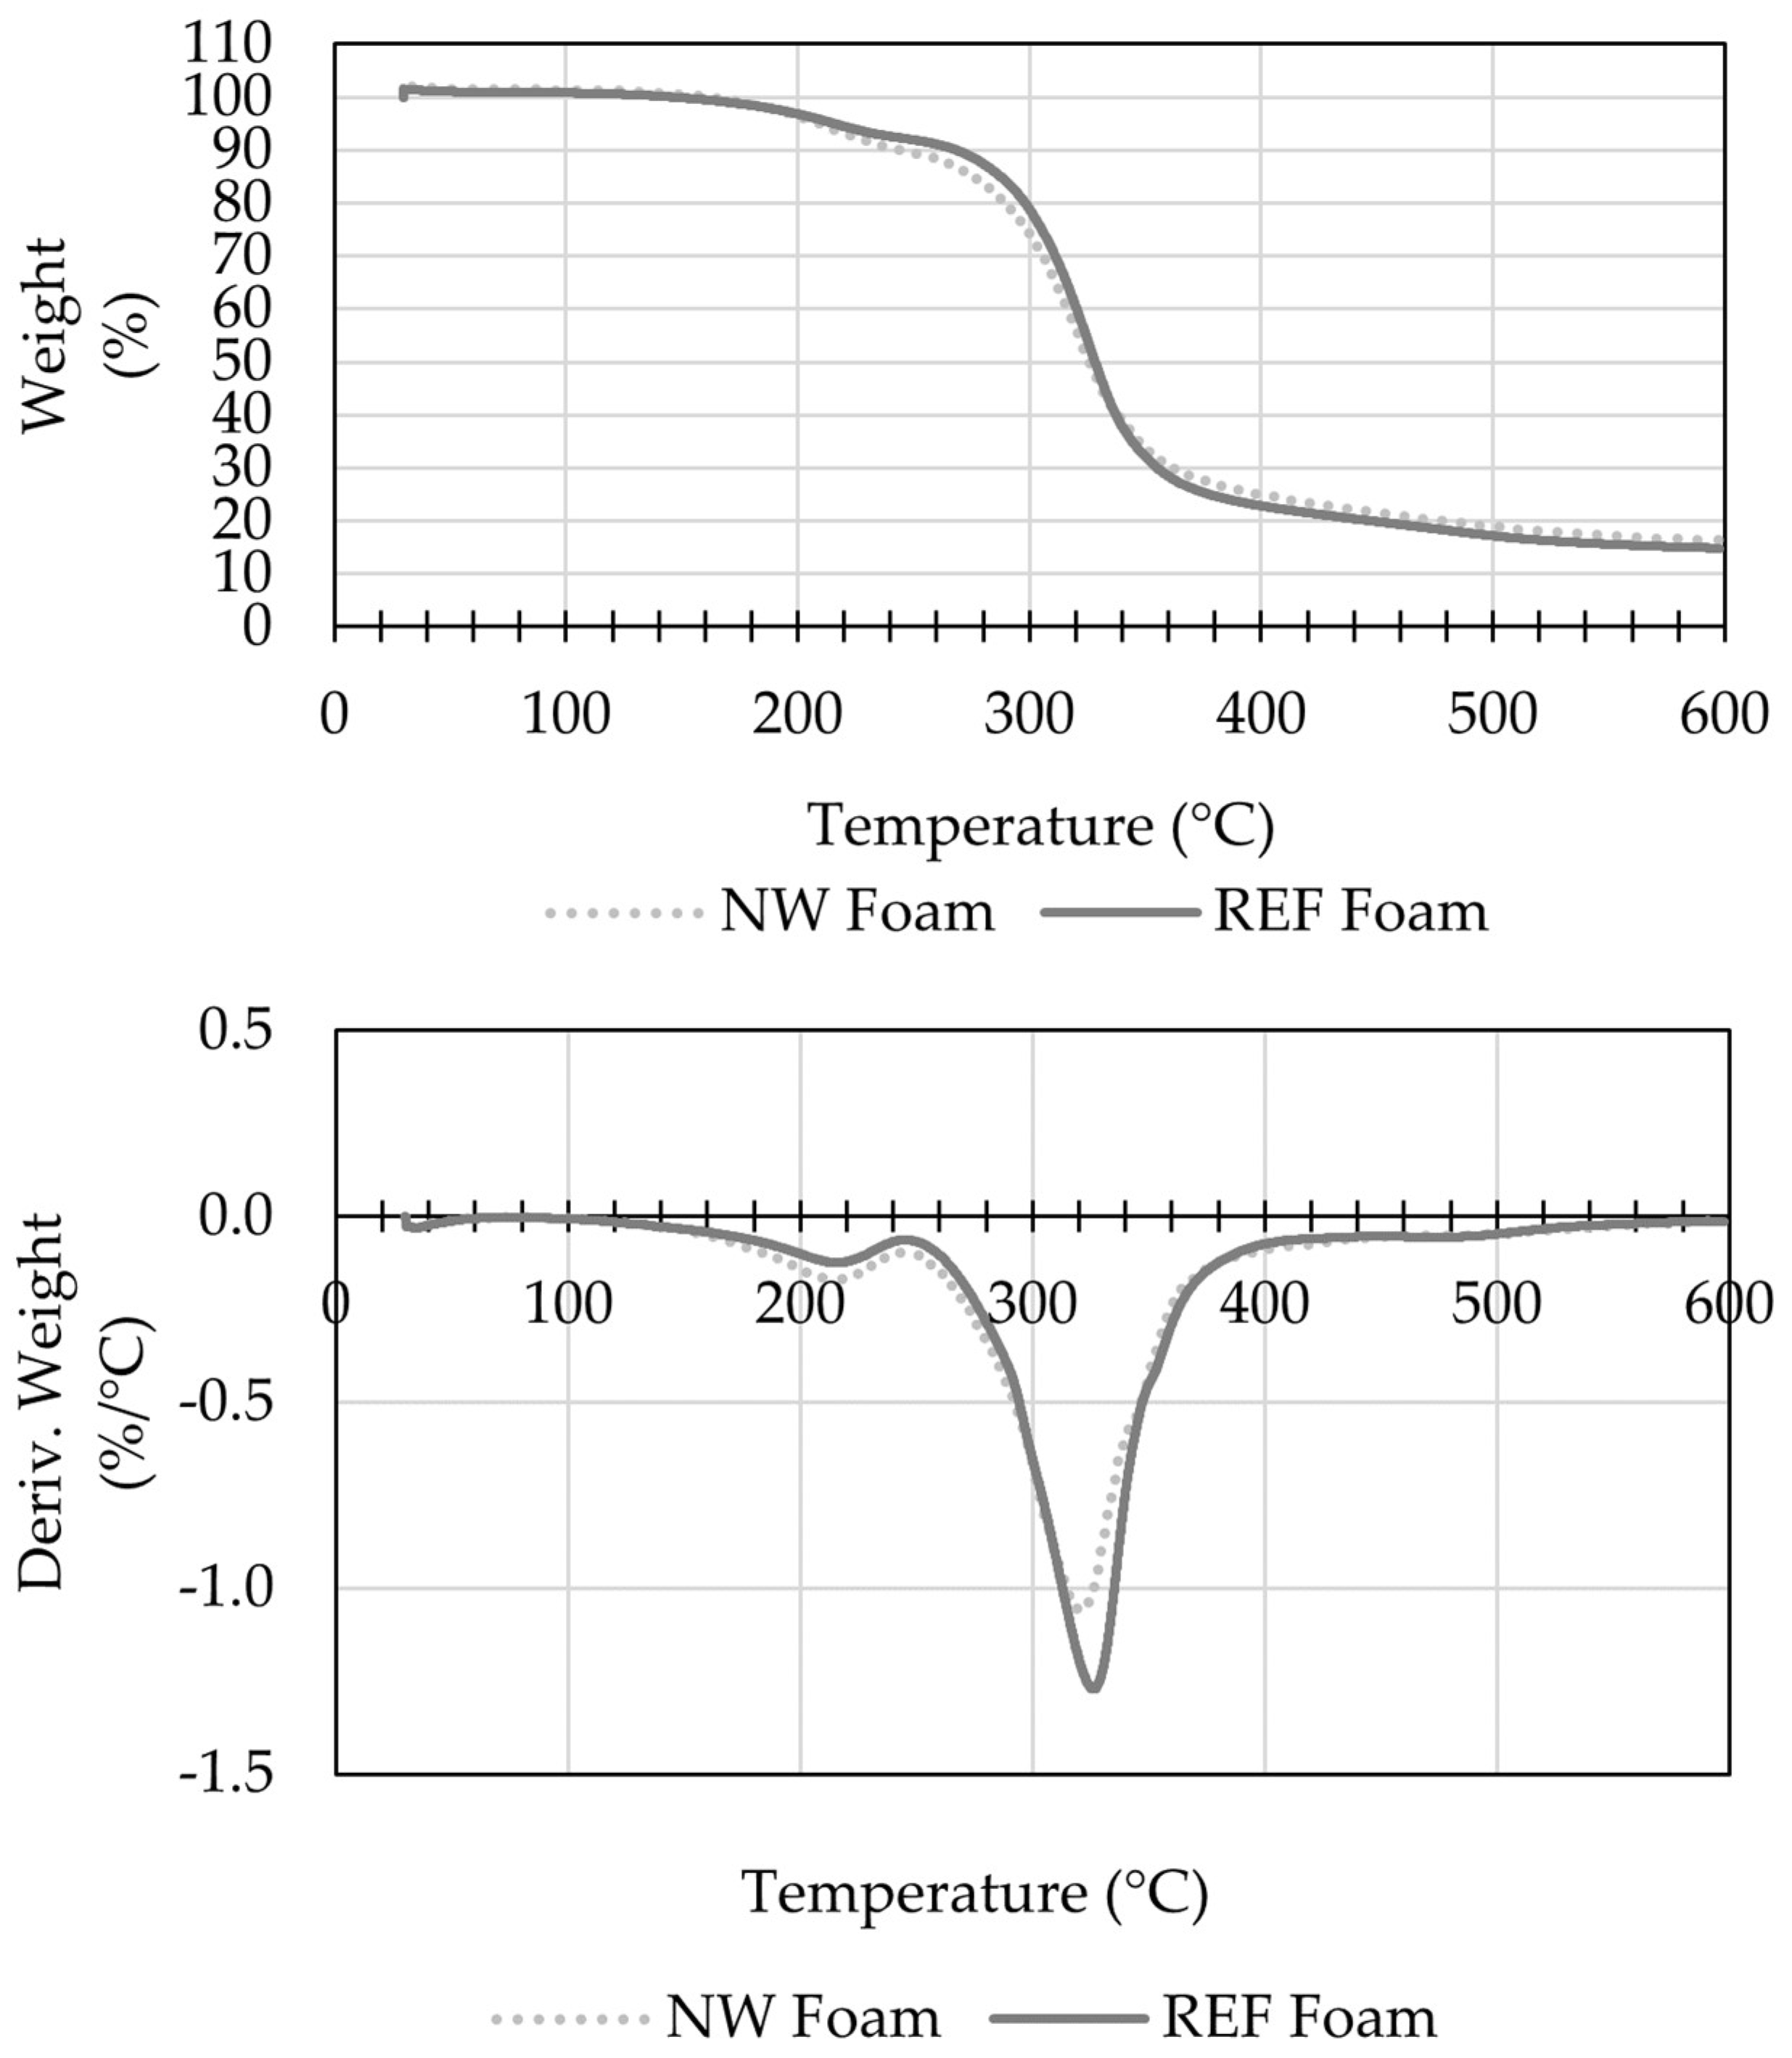
The TGA curves for the REF and NW foams under a nitrogen atmosphere are shown in Figure 9. Both foams exhibited a two-stage decomposition profile characteristic of rigid PUR materials: an initial stage in the range of approximately 220 °C corresponding to urethane bond cleavage and hard-segment degradation, followed by polyol soft-segment decomposition. The REF foam showed a maximum decomposition rate of −1.3%/°C at around 327 °C, with a residual mass of 14.9% at 600 °C. The NW foam exhibited slightly higher thermal stability, with a maximum decomposition rate of −1.11%/°C at around 316 °C, and a char residue of 16.3% at 600 °C.

3.1.7. Life Cycle Assessment

The assessment covered the production of the bio-polyols used in this study under a cradle-to-gate system boundary, as detailed in the associated project deliverable [20]. With respect to the climate change impact category (expressed as CO2 equivalents), the NW bio-polyols achieve an 87% reduction compared to conventional petroleum-based polyether polyols. This result refers specifically to the polyol production stage and does not represent a full life cycle assessment of the final polyurethane foam systems.

3.2. Sandwich Panel Characterization

3.2.1. Thermal Properties

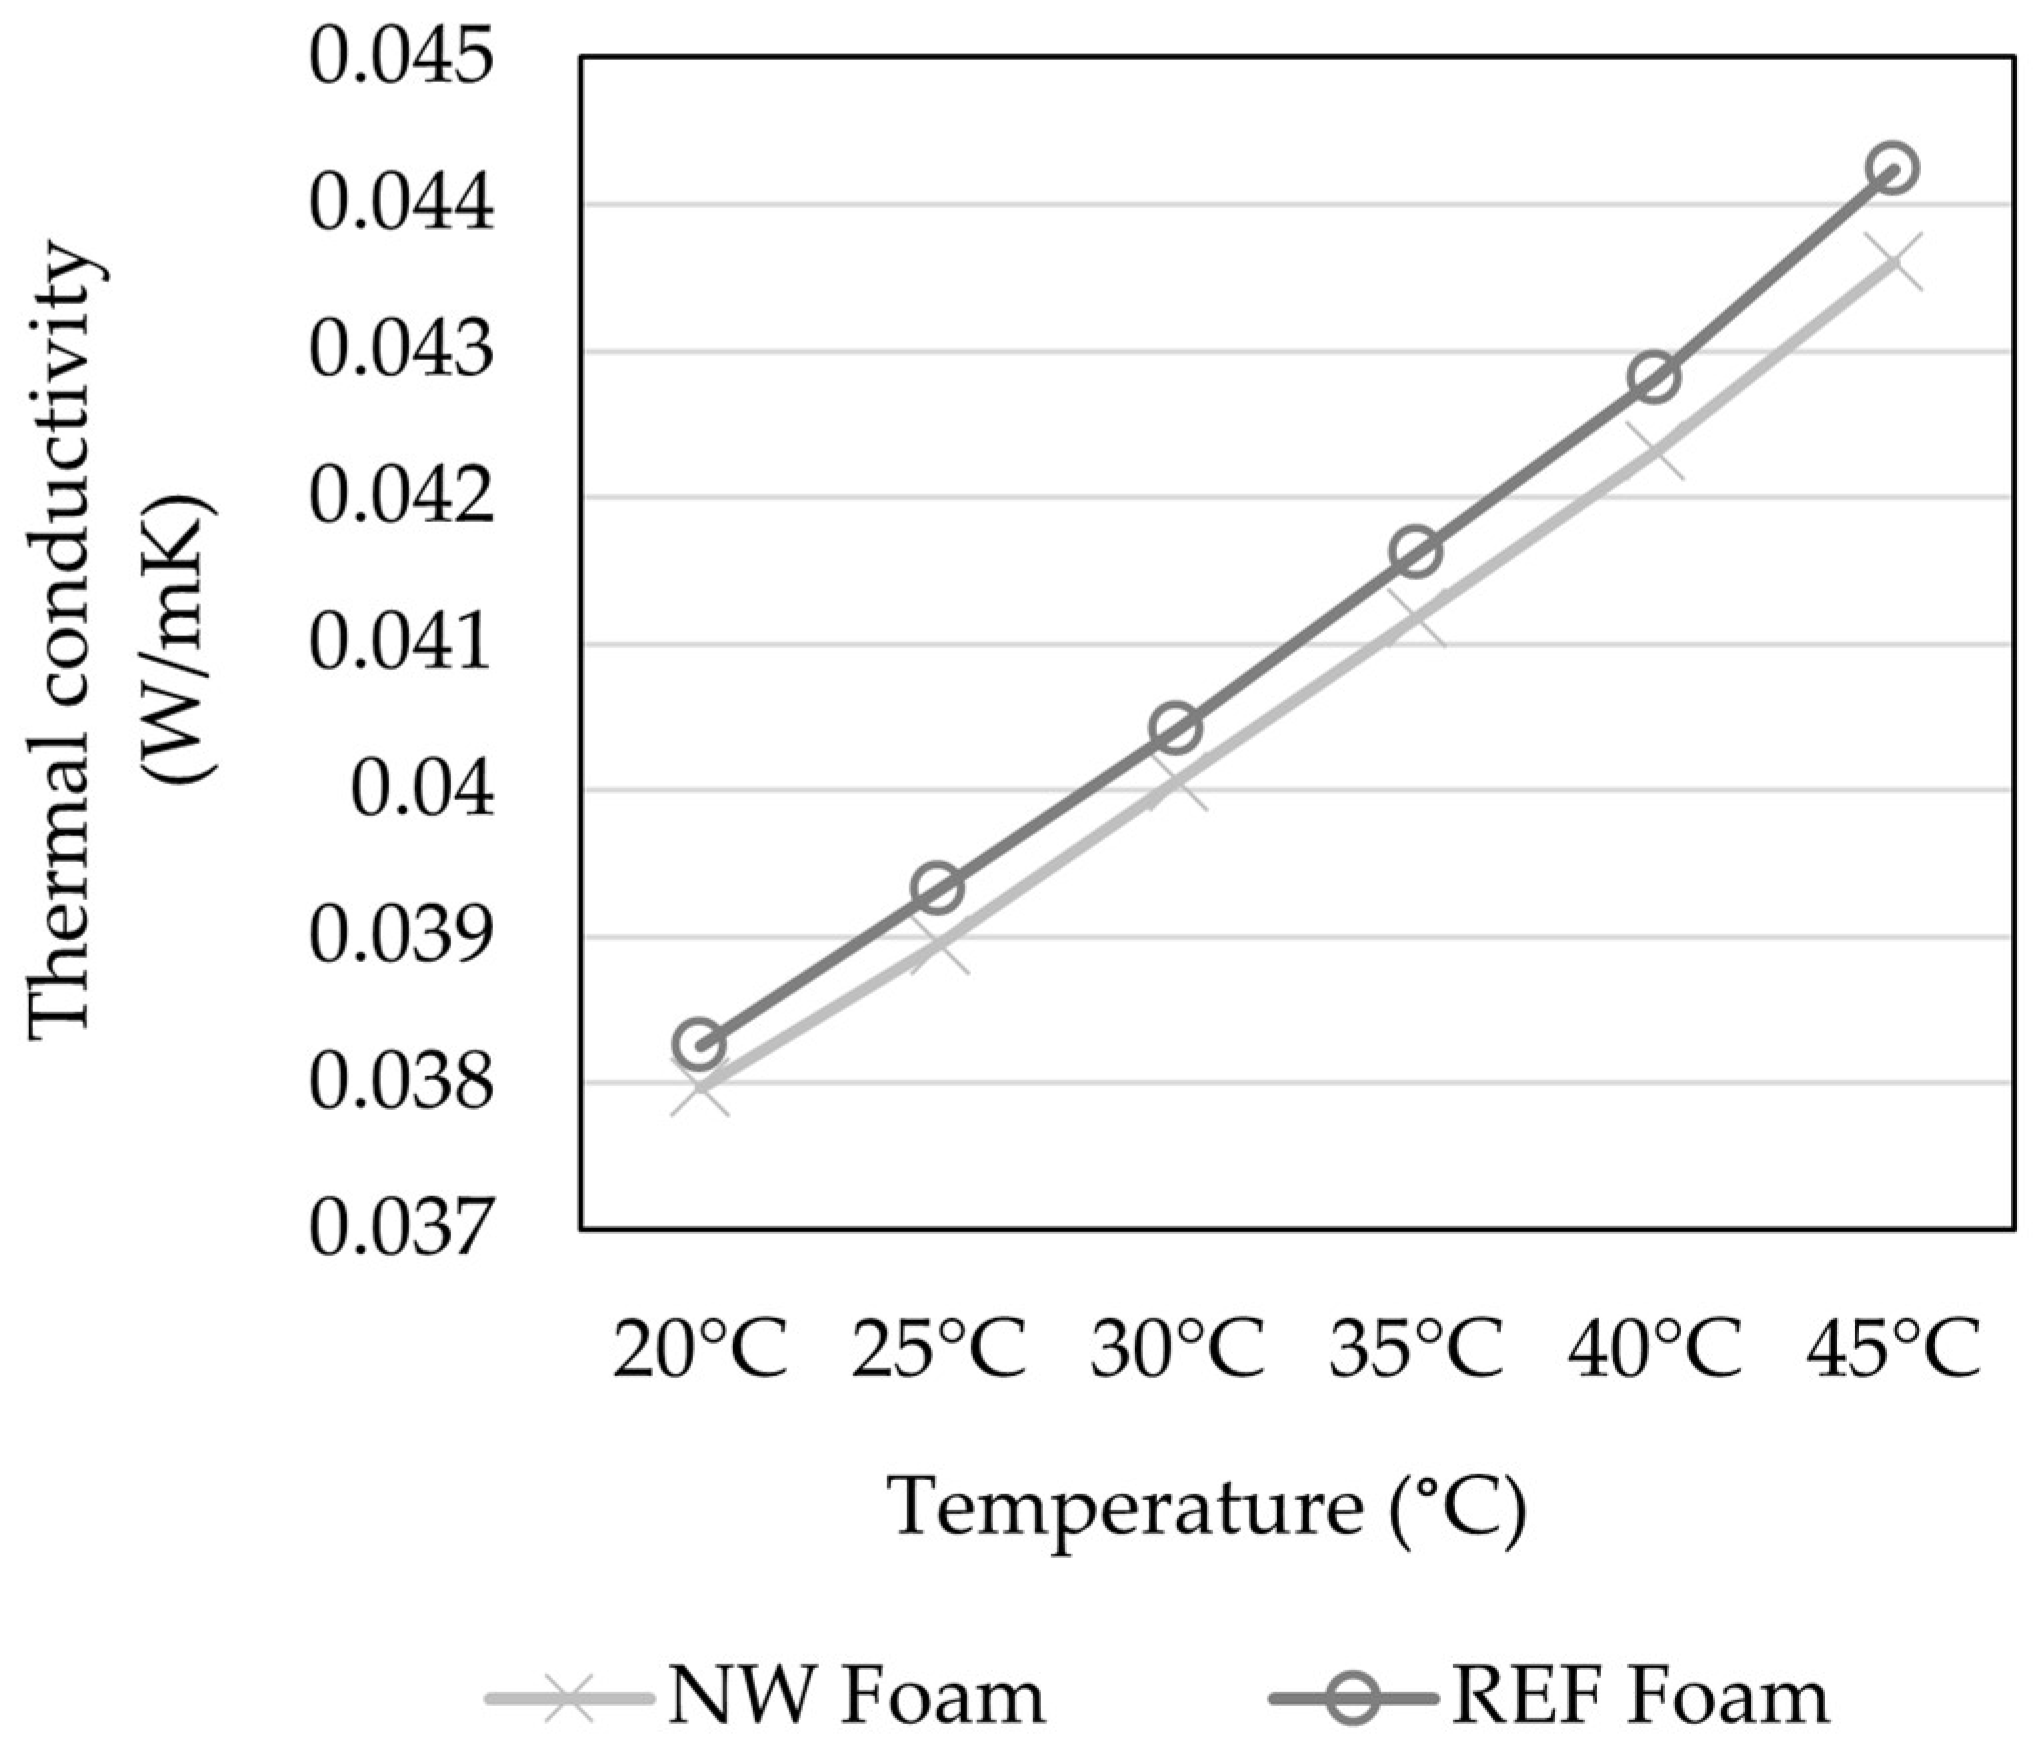
The thermal conductivity of both NW and REF foams increased progressively with temperature from 20 °C to 45 °C (Figure 10). Across the entire temperature range, the REF foam exhibited slightly higher thermal conductivity values compared to the NW foam. At 20 °C, both foams exhibited similar values ~0.038 W/m·K, while at 45 °C, both values increased to 0.043 W/m·K for NW foam and 0.044 W/m·K for REF foam. The increase was gradual and nearly linear for both samples.
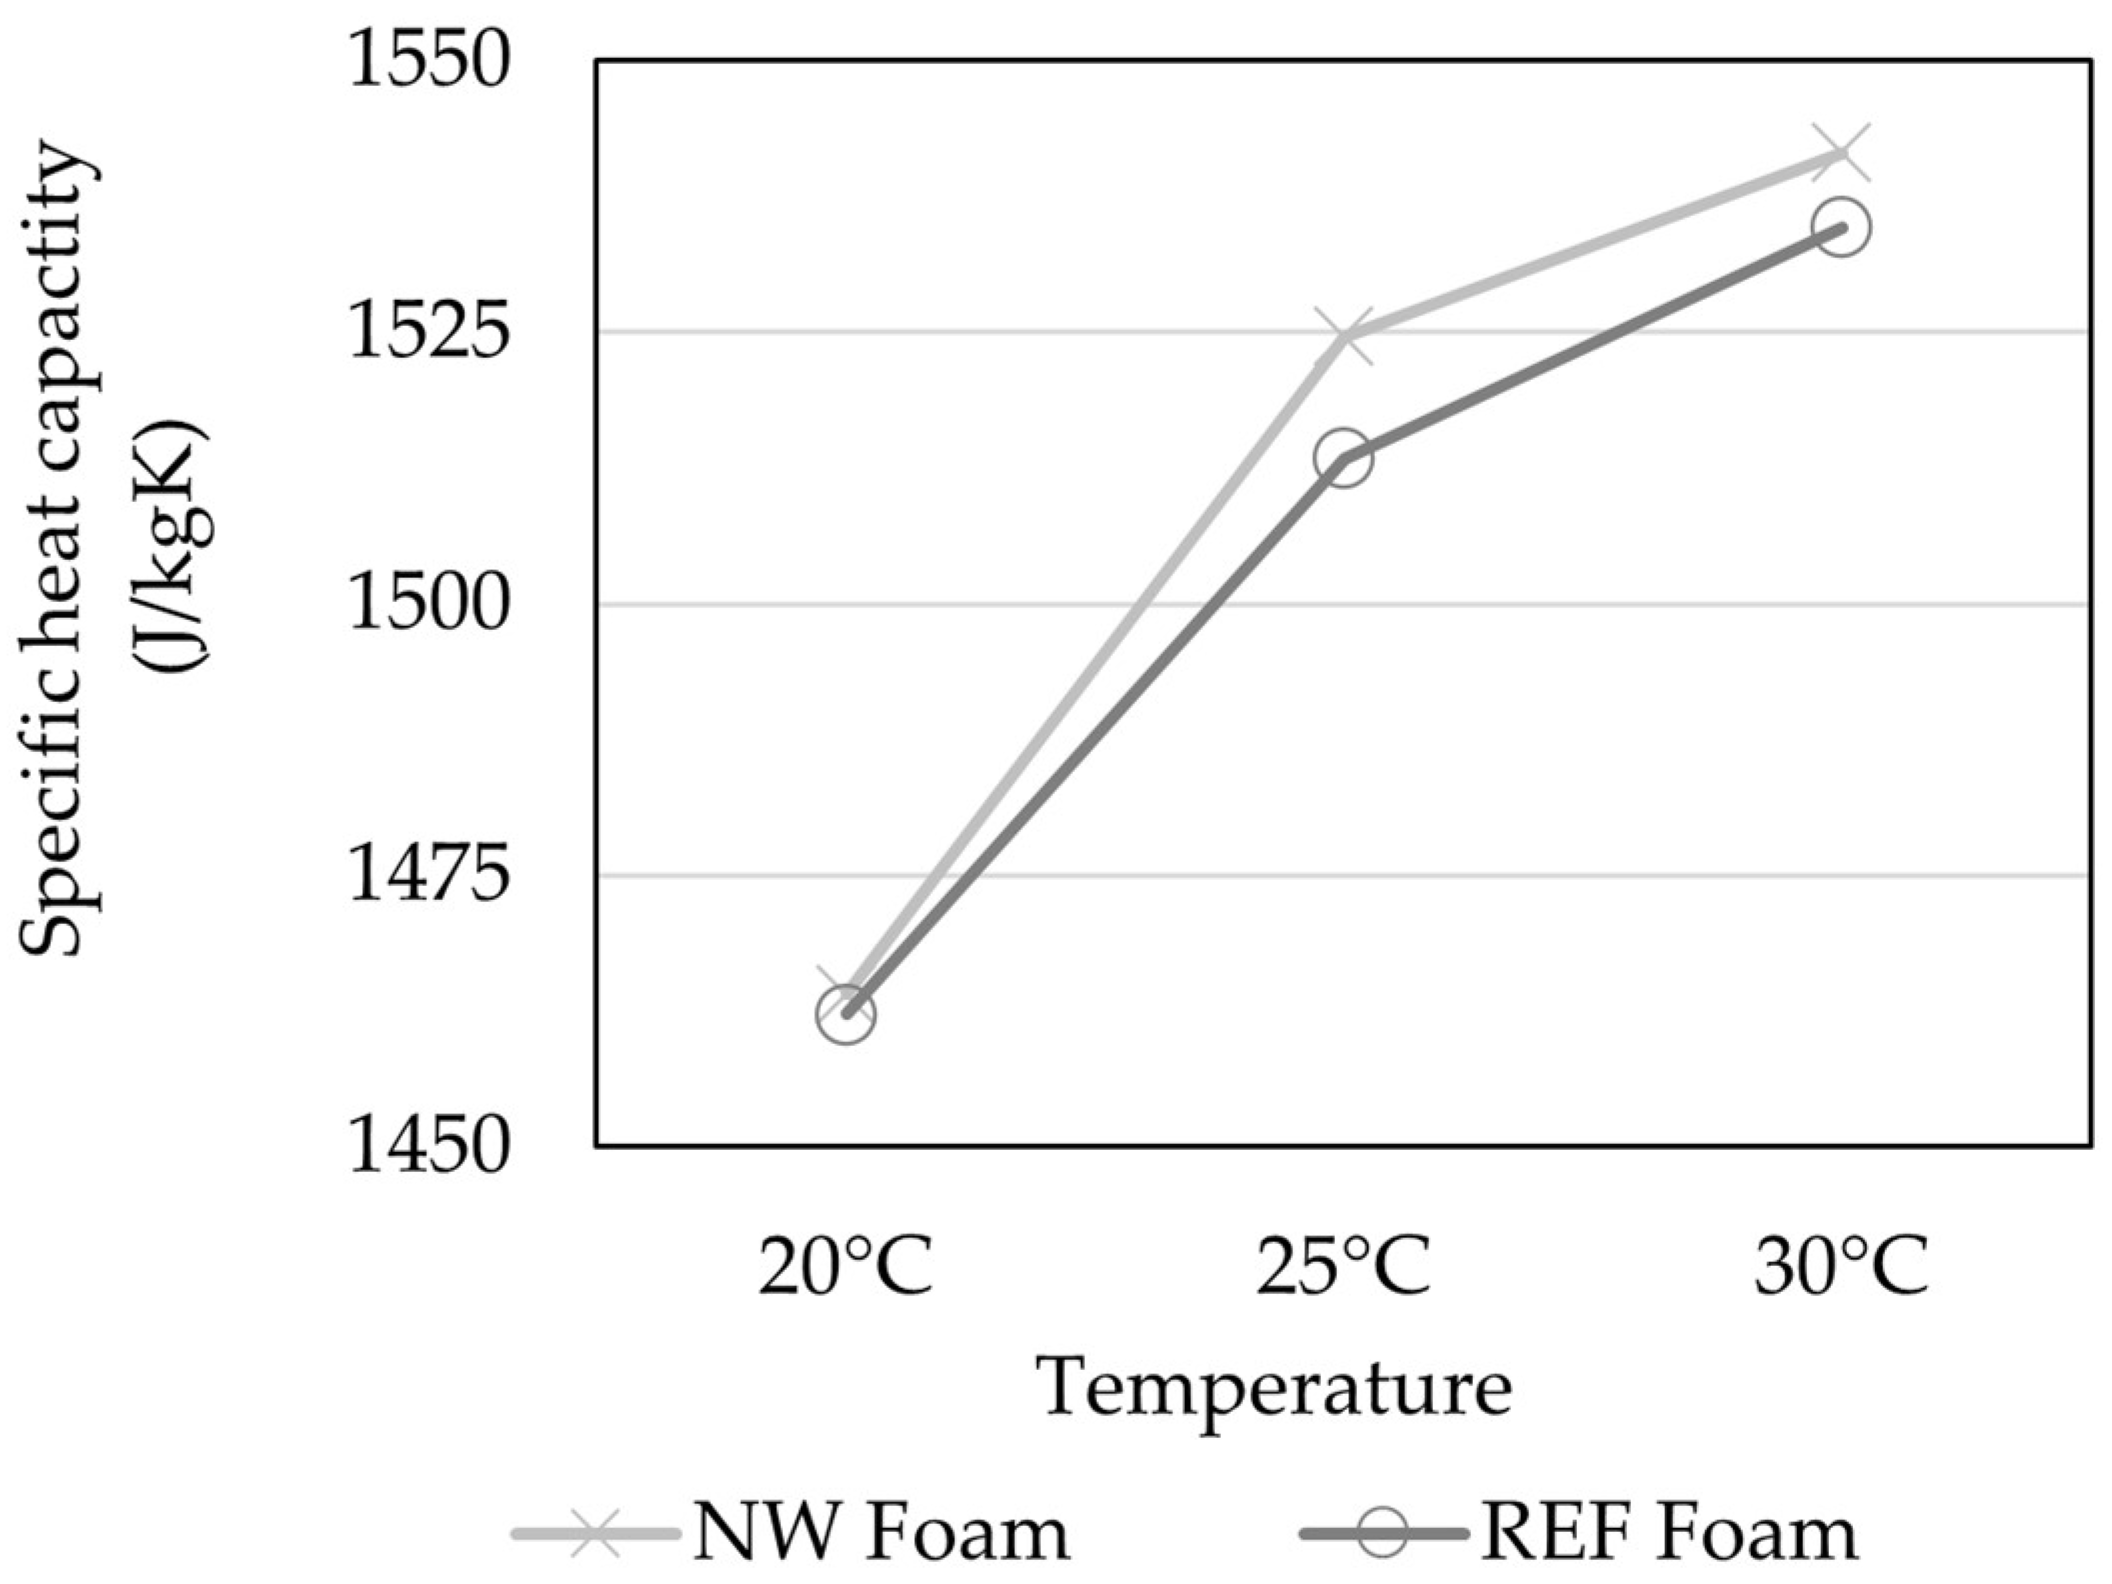
The specific heat capacity of both NW and REF foams increased with temperature over the investigated range from 20 °C to 30 °C (Figure 11). At 20 °C, both foams exhibited similar values of ~1460 J/kg·K. With increasing temperature, the specific heat capacity increased gradually for both materials, reaching 1515 J/kg·K at 25 °C and 1535 at 30 °C. The NW foam revealed slightly higher values than the REF foam, although the difference between the two foam formulations remained minor across all temperatures. However, both the thermal conductivity and specific heat capacity measurements were performed only on a single specimen per formulation. Therefore, the observed differences should be interpreted as indicative trends rather than statistically validated differences, and no general conclusions regarding differences between the two formulations can be drawn.

3.2.2. Internal Bond Strength

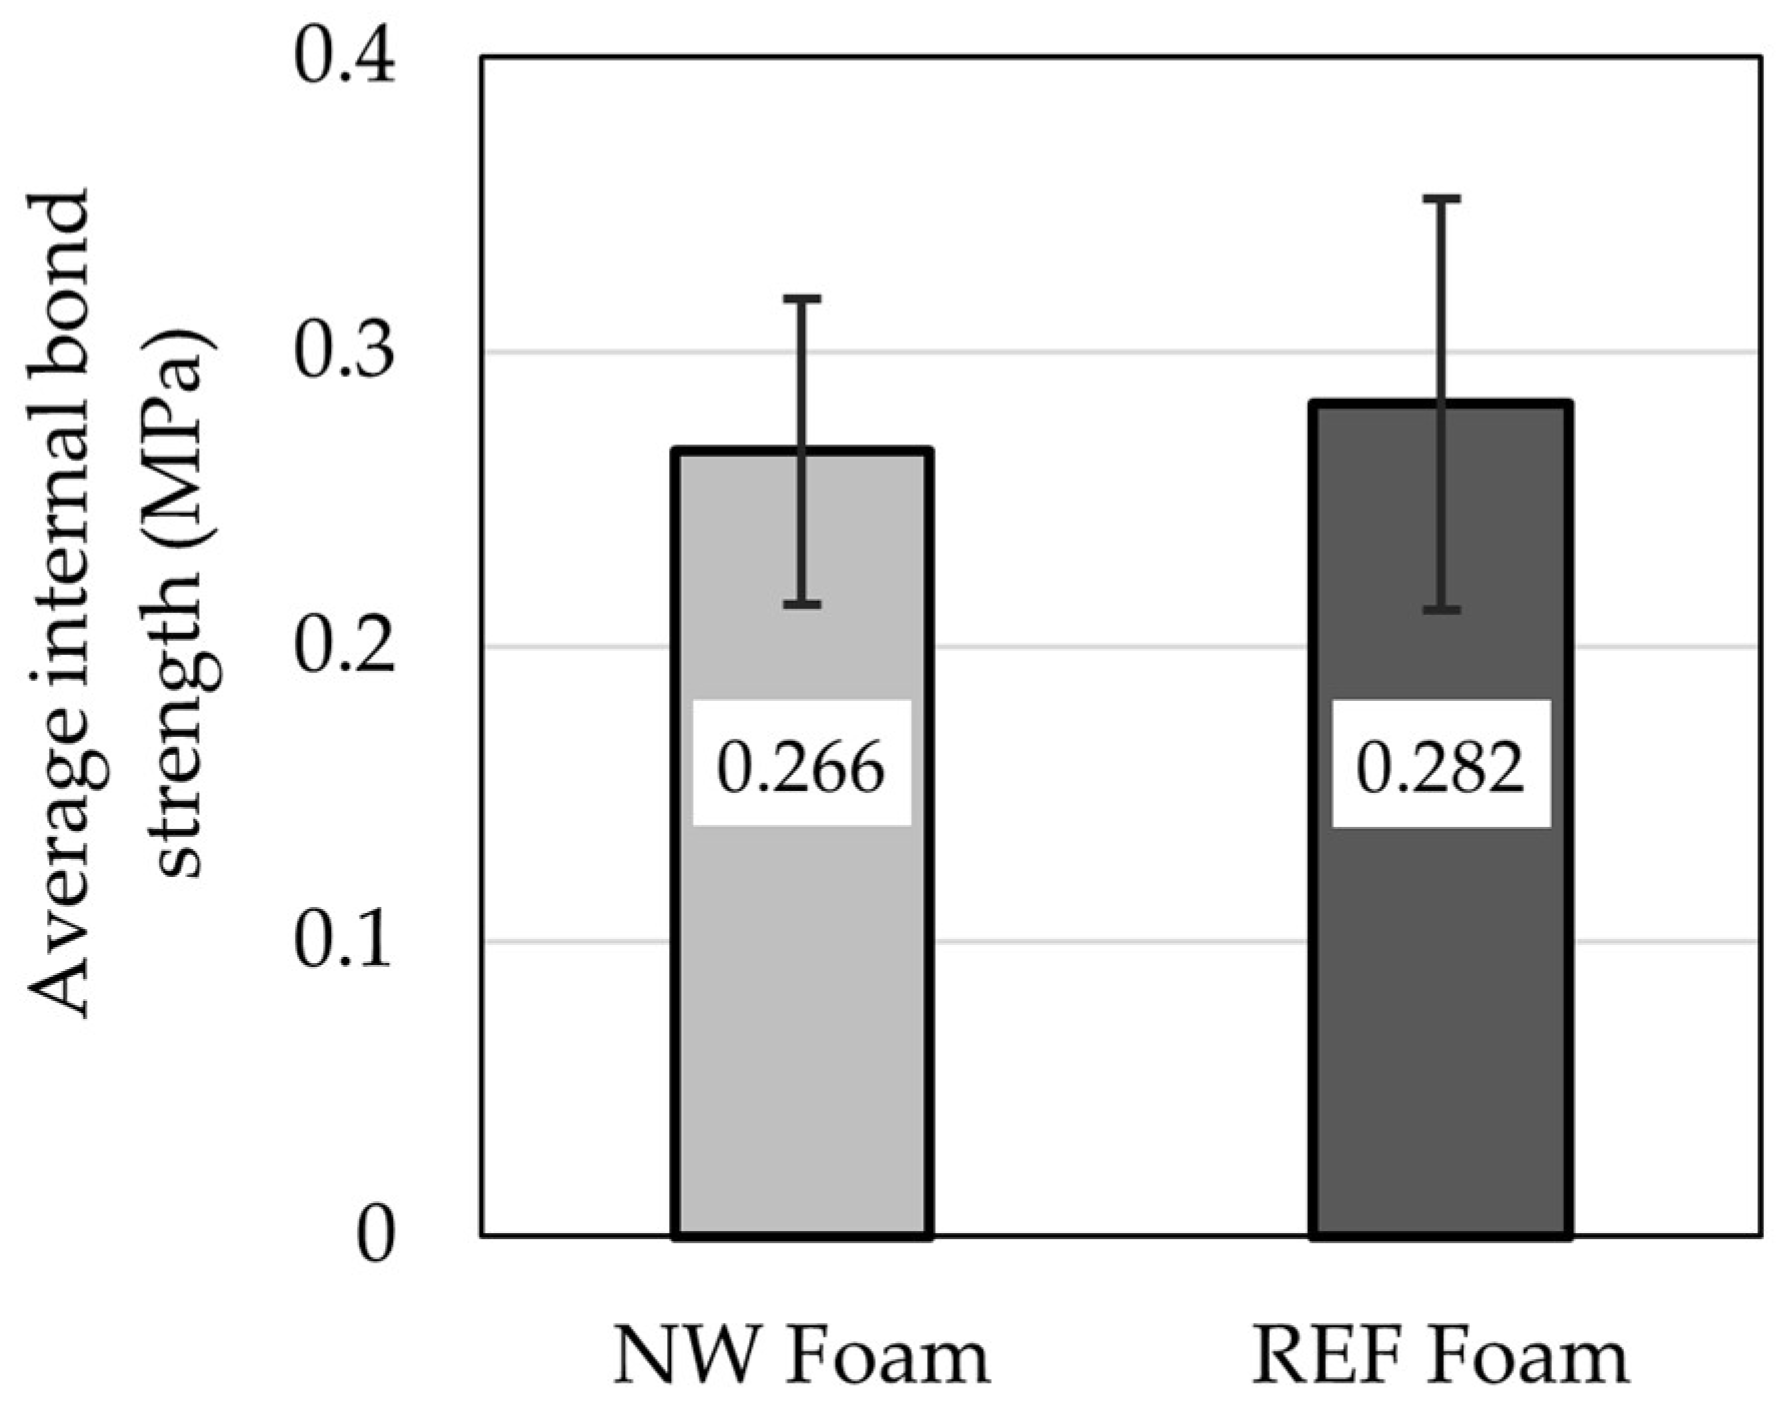
The internal bond strength results for the sandwich panels are presented in Figure 12. The mean IB strength of the REF foam was 0.28 MPa (SD = 0.070), while the NW panels yielded a mean of 0.266 MPa (SD = 0.052). No significant difference in internal bond strength was observed between the REF and NW panels (Welch’s two-tailed t-test, n = 6, α = 0.05, p = 0.360). Failure occurred predominantly within the foam core for both formulations, indicating that core cohesion was the limiting factor. Density variation between specimens, inherent to the pour-in-place panel manufacturing process, is a contributing factor, since IB in cellular core sandwich panels scales with core density and is sensitive to local density gradients.

3.2.3. Compression Strength

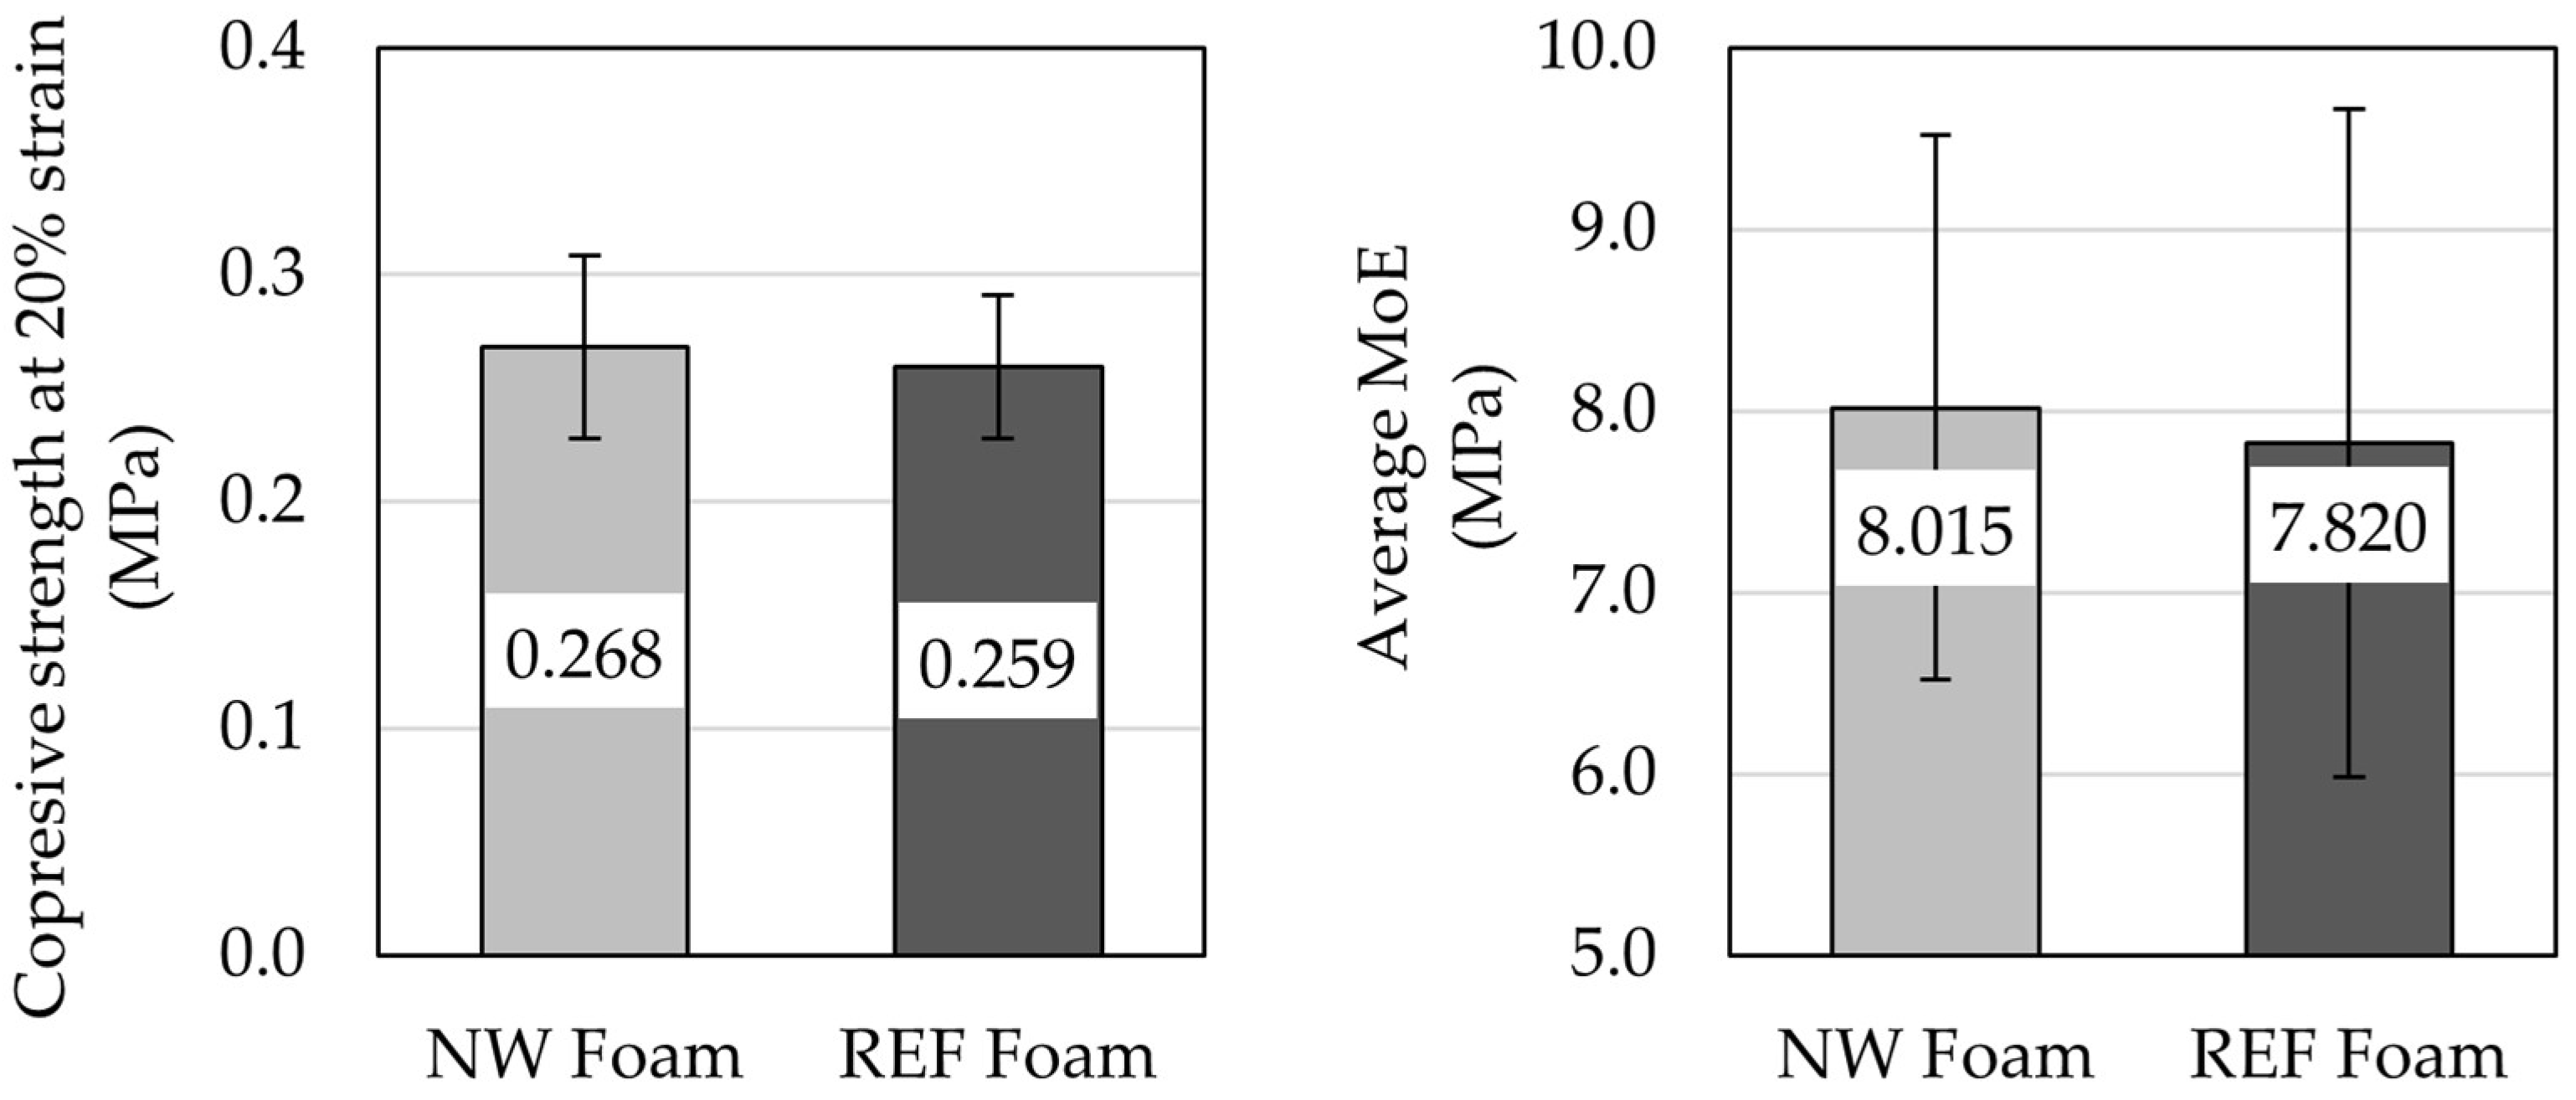
The compressive properties of the sandwich panels are presented in Figure 13. The NW foam exhibited a compressive modulus of elasticity (MoE) of 8.02 MPa (SD = 1.84) and a compressive strength of 0.29 MPa at 20% strain (SD = 0.04). The REF foam yielded a MoE of 7.82 MPa (SD = 1.5) and a compressive strength of 0.26 MPa at 20% strain (SD = 0.03). Both parameters remained comparable between tested formulations, indicating that the partial replacement of the reference polyol with the pyrolysis-oil-derived component did not substantially compromise the compressive load-bearing capacity of the sandwich panel. The NW panels retained slightly higher stiffness and strength than the REF panels, but no significant differences were observed between the REF and NW sandwich panels in either compressive strength (p = 0.180) or modulus of elasticity (MoE; p = 0.992) (Welch’s two-tailed t-test, n = 5).

3.2.4. Sound Transmission Loss and Sound Absorption

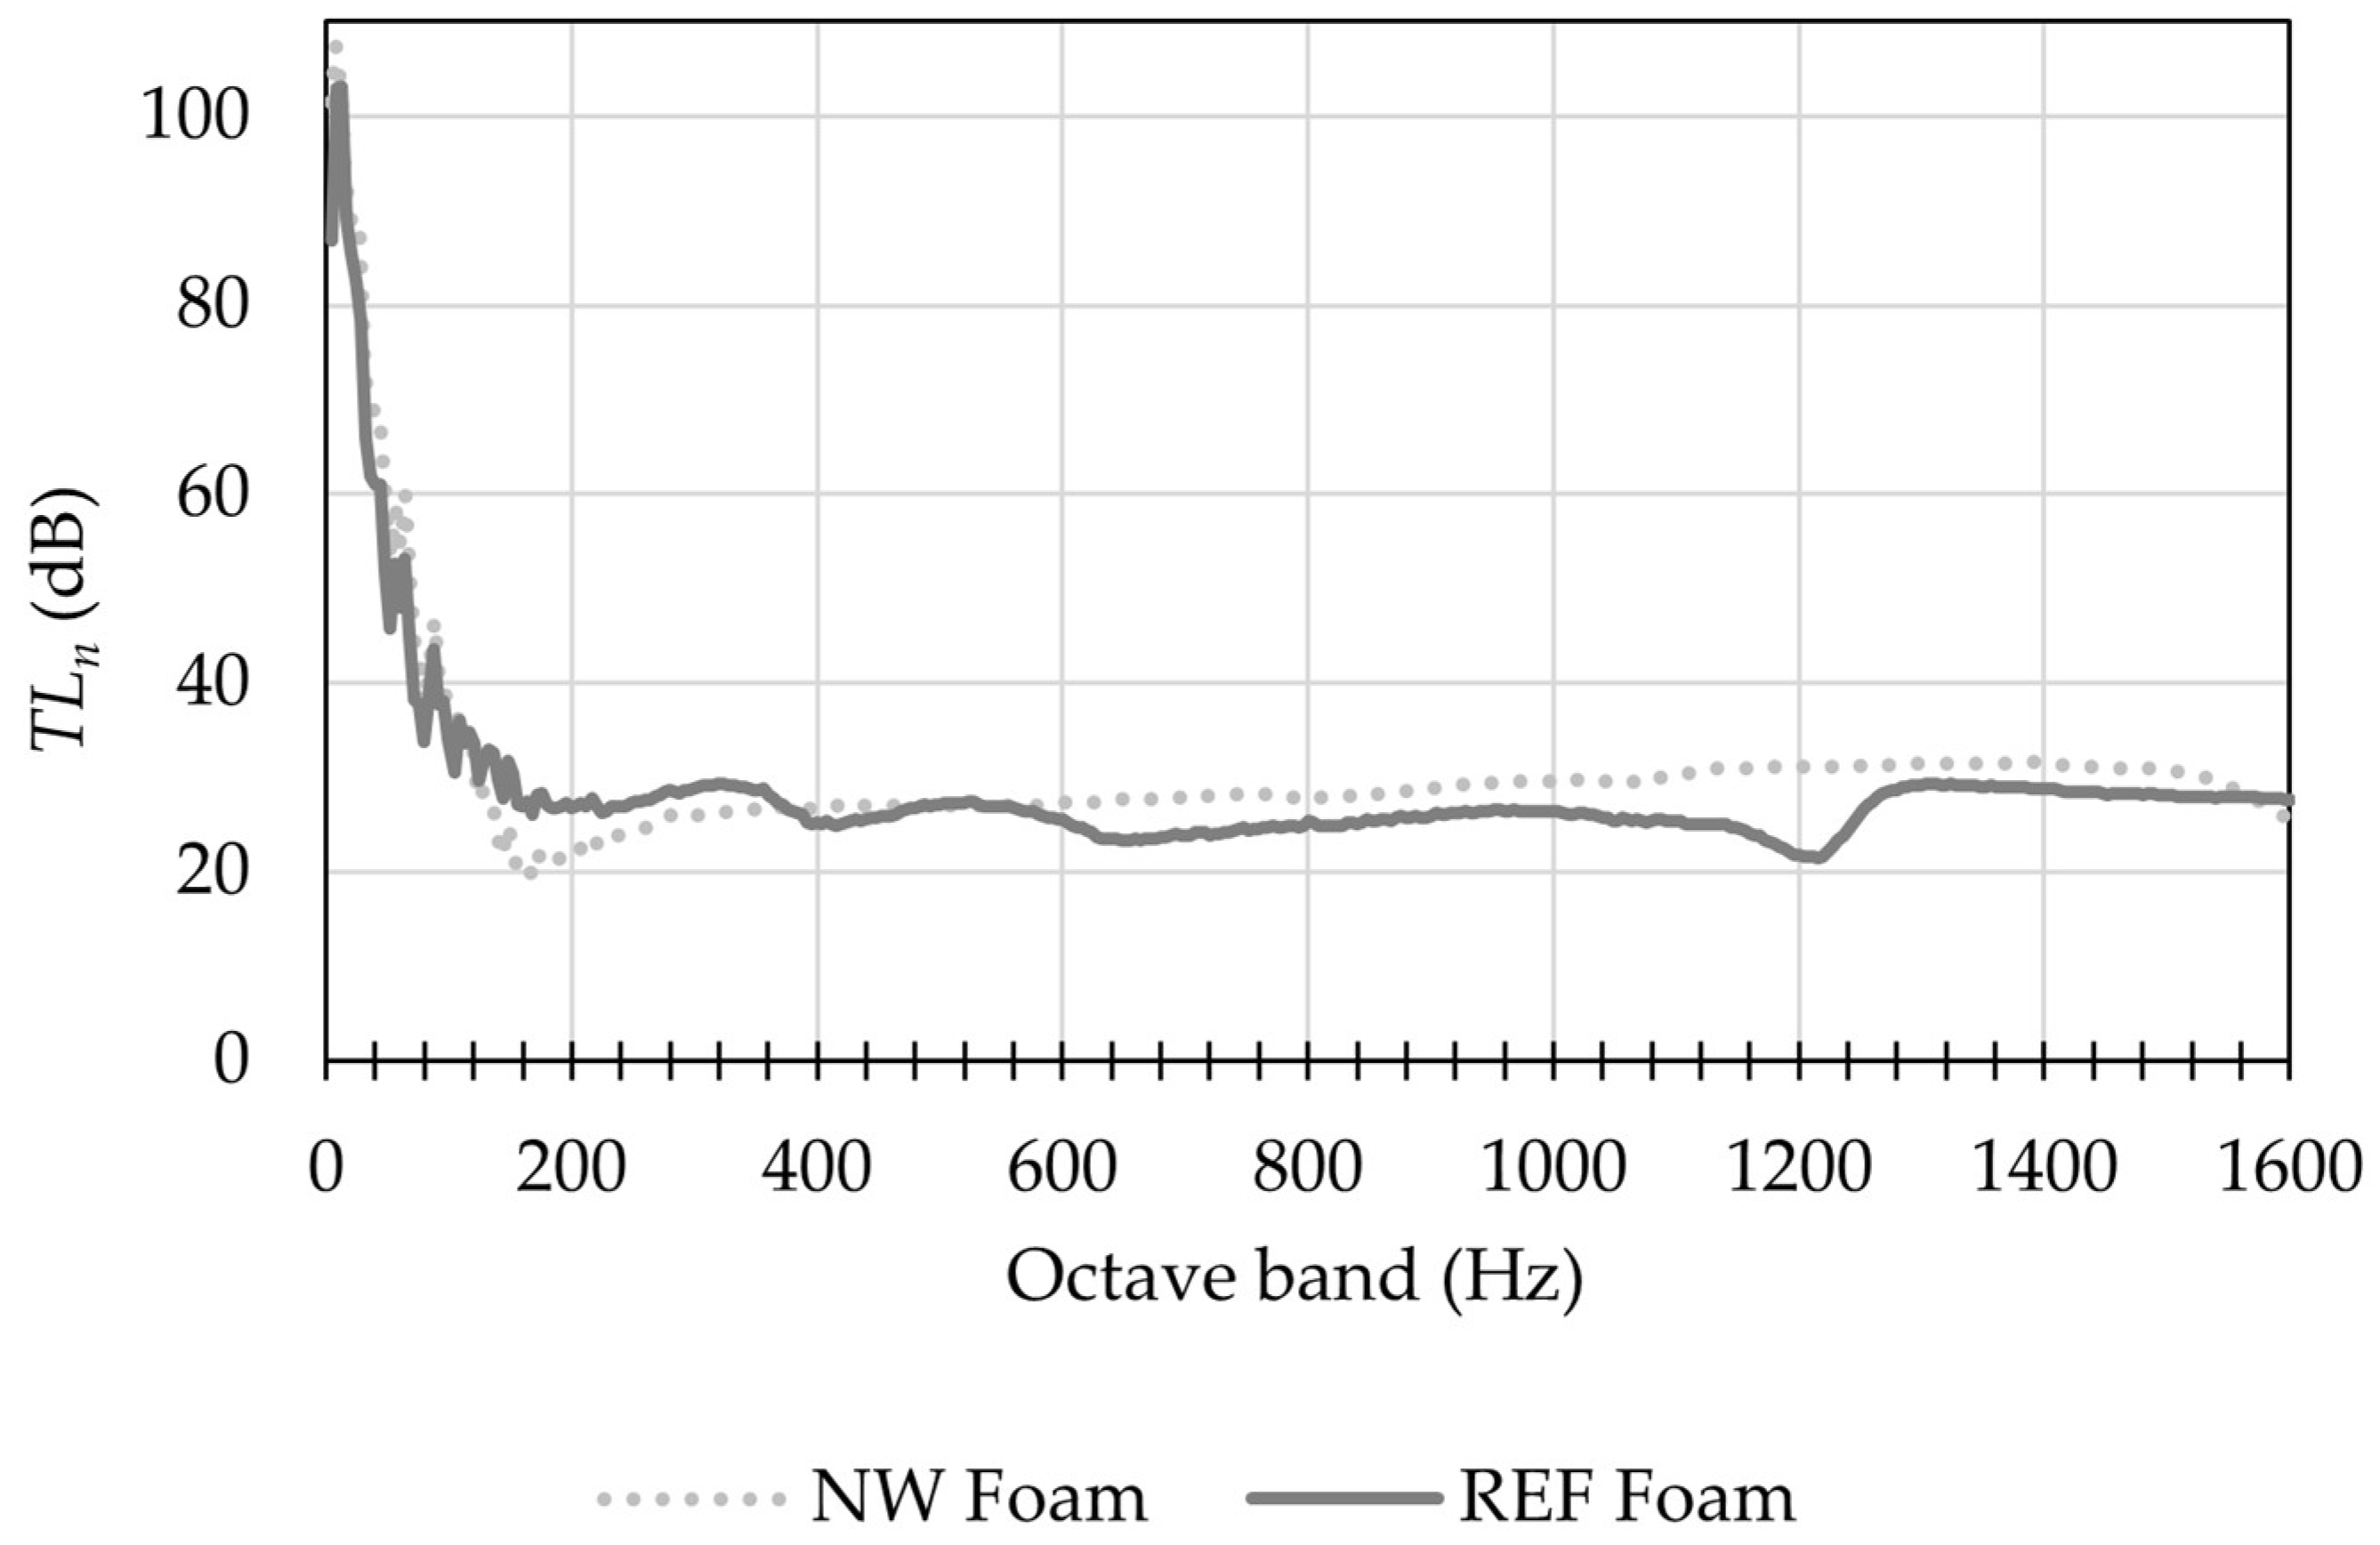
The sound transmission loss (TLn) spectra of the REF and NW sandwich panels in the frequency range from 16 to 1600 Hz are presented in Figure 14. Both sandwich structures exhibited frequency-dependent acoustic insulation behavior characteristic of lightweight composite panels with polyurethane foam cores. At low frequencies (<100 Hz), high TLn values were observed, followed by a rapid decrease with increasing frequency. Above 150 Hz, the transmission loss stabilized within the range of approximately 20 to 32 dB for both panel types.
At higher frequencies, both panels exhibited similar overall TLn levels across most of the investigated spectral range. A localized reduction in TLn to approximately 22 dB was observed in the REF panel around 1200 Hz, whereas no such reduction was detected in the NW panel. However, given that acoustic measurements were performed only on a single specimen per formulation, such localized features may reflect specimen-specific variability rather than systematic material-related differences. Therefore, no statistically supported differences in acoustic performance between REF and NW panels can be inferred from these results.
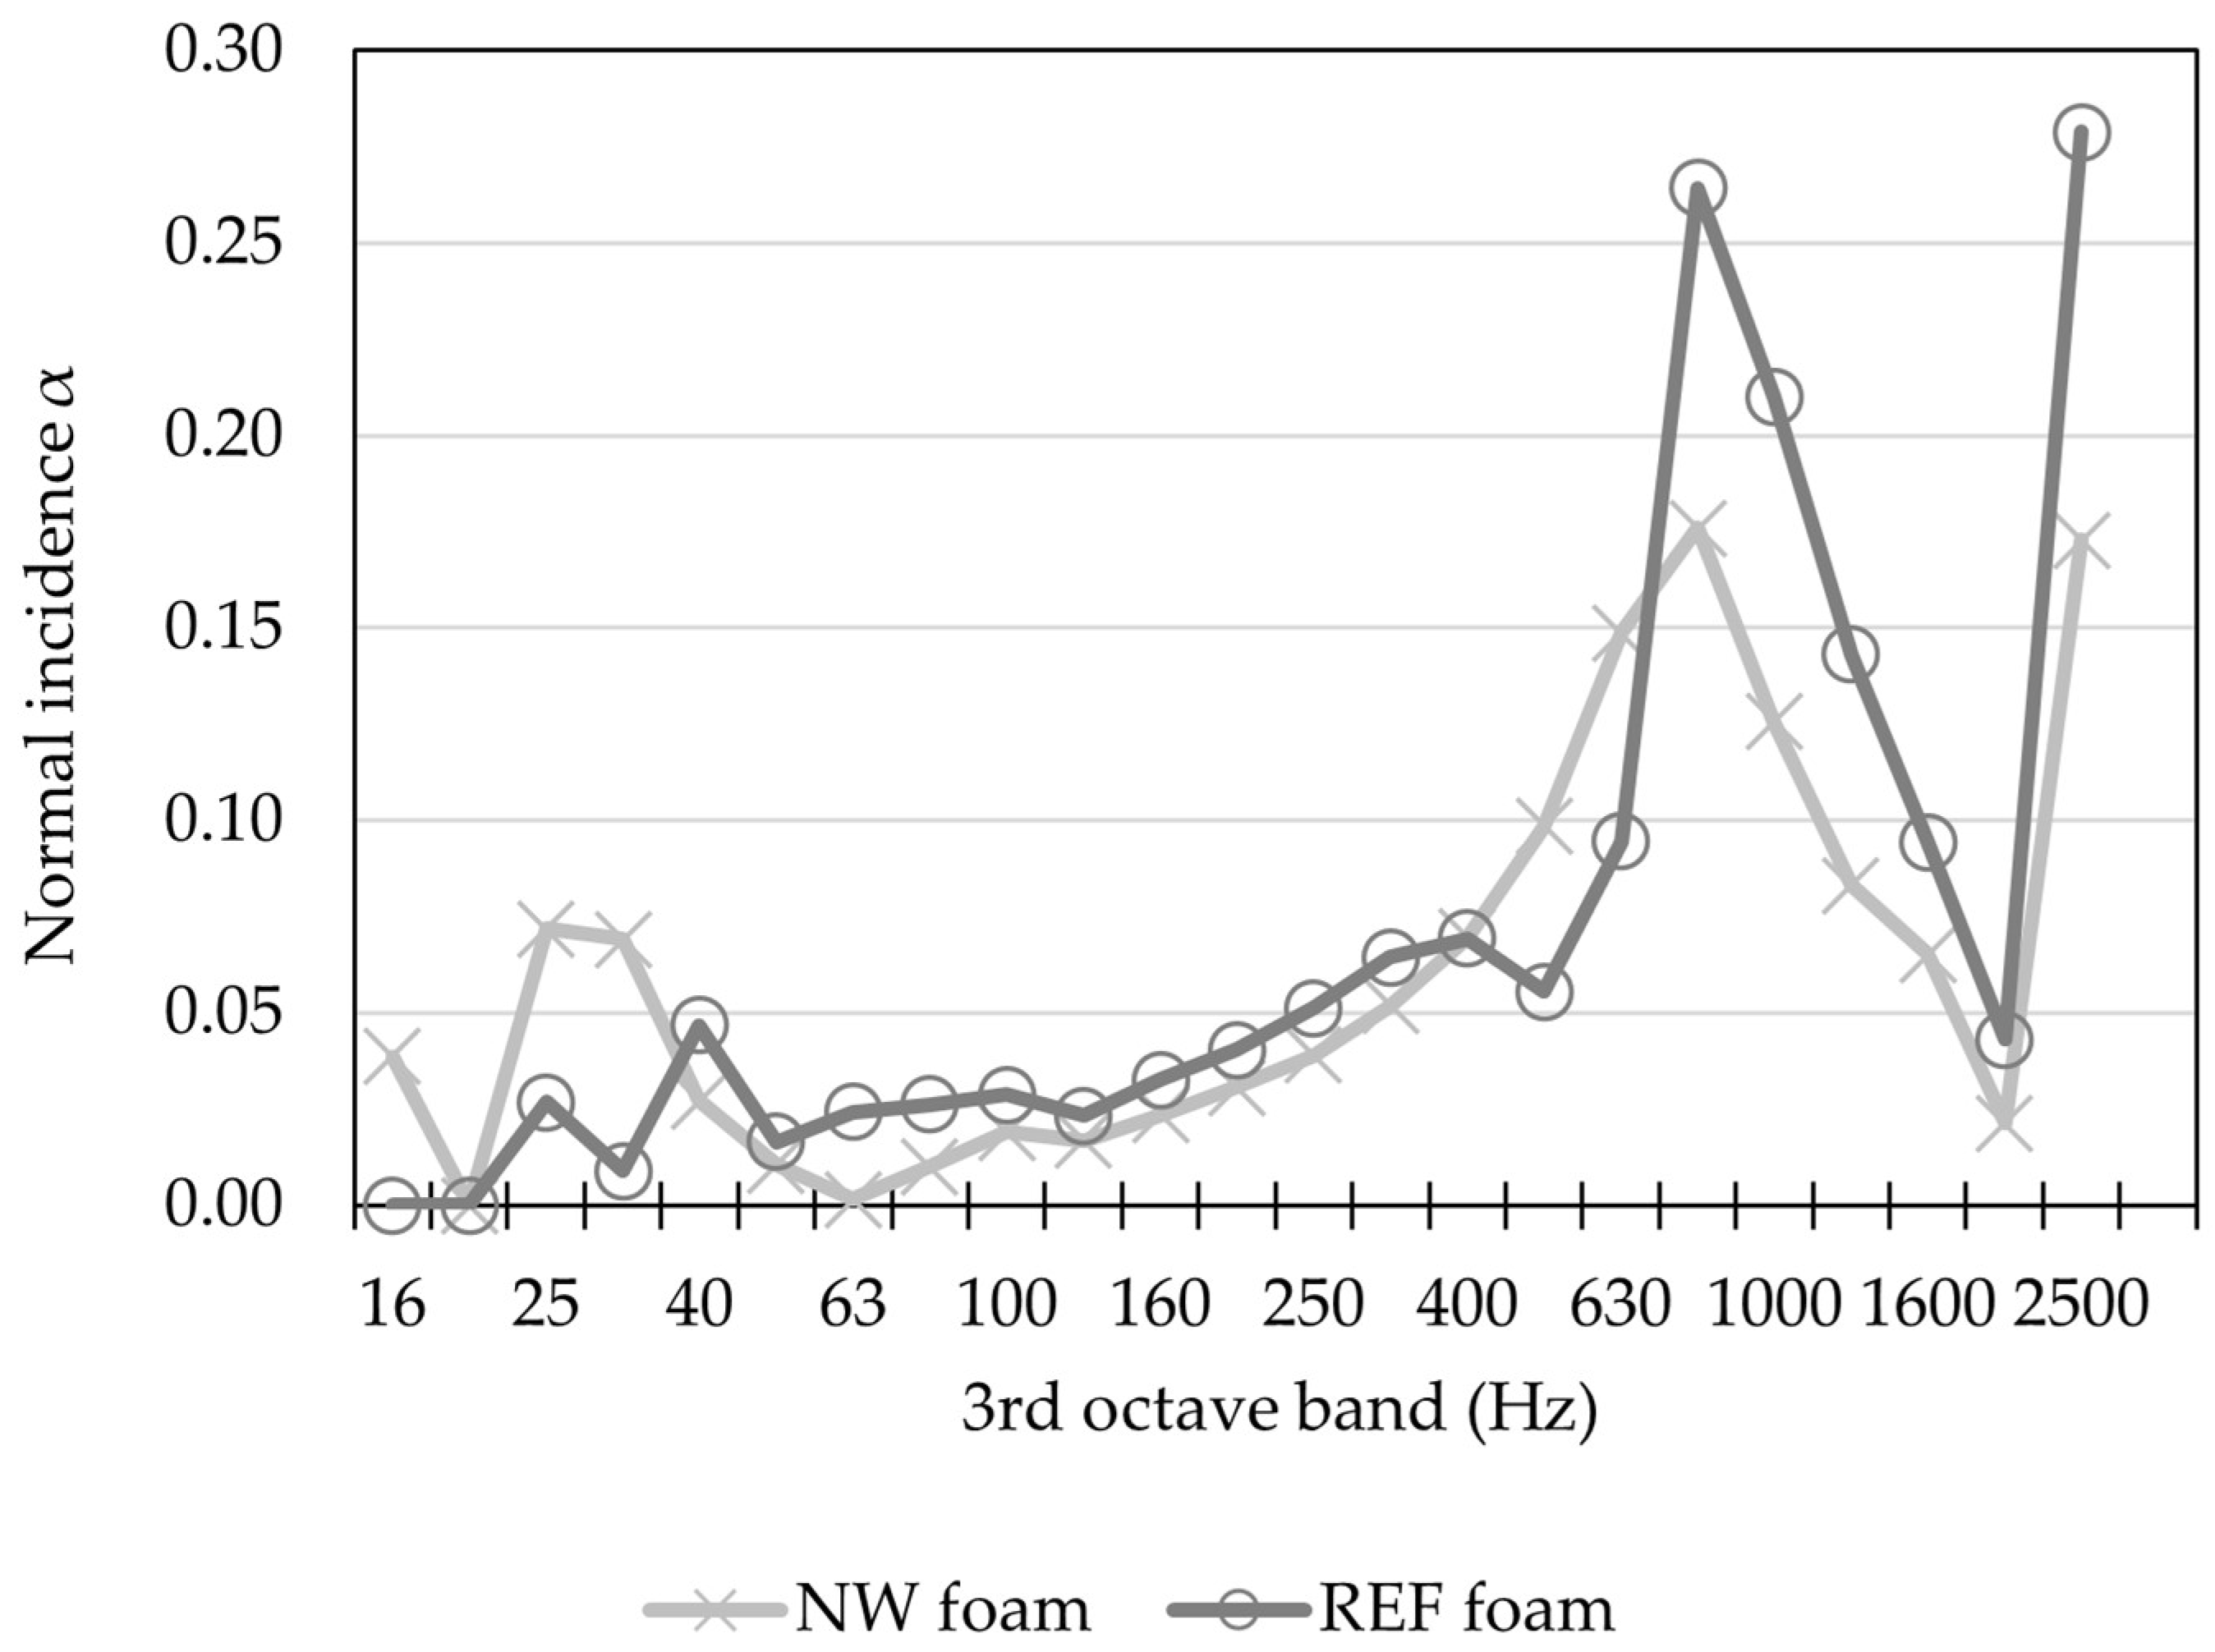
The normal-incidence sound absorption coefficients of the REF and NW sandwich panels across the measured frequency range (16 to 2500 Hz) are presented in Figure 15. Both panels exhibited low absorption coefficients at low frequencies (below 250 Hz). In the mid-frequency range, the two panels diverged in behavior. The NW foams showed progressively increasing absorption from 250 Hz, reaching a peak of 0.18 at 800 Hz. The REF panels, by contrast, exhibited a higher absorption peak at 800 Hz (0.26), declining to 0.04 at 2000 Hz, before falling off at higher frequencies. At the upper end of the measured range, both panels showed a secondary increase at 2500 Hz (NW foam: 0.17; REF foam: 0.28).
The Noise Reduction Coefficient (NRC) was calculated as the arithmetic mean of the absorption coefficients at 250, 500, 1000, and 2000 Hz. The NRC was 0.071 for the NW foam and 0.090 for the REF foam. Given that acoustic measurements were performed on single specimens per formulation, these differences should be interpreted as indicative trends rather than statistically validated performance differences, and no general ranking of acoustic absorption performance can be established between the two panels.
Table 5 summarizes the principal observations for the REF and NW formulations. Incorporating the FPBO-derived polyol/TEP blend resulted in both favorable and unfavorable changes, indicating that no formulation outperformed across all evaluated properties. While improvements were observed in flame resistance and thermal insulation performance, reductions were recorded for dimensional stability, foam compressive strength, internal bond strength, and sound absorption. Statistical analysis confirmed significant differences for the colorimetric parameters, whereas internal bond strength, panel compressive strength, and modulus of elasticity did not differ significantly between formulations. Despite these trade-offs, the results demonstrate the technical feasibility of partially replacing the conventional polyol with a pyrolysis-oil-derived alternative. Given the exploratory nature of the study and the limited statistical support available for several measurements, the observed trends should be interpreted as indicative rather than conclusive.

4. Discussion

The NW formulation differs from the REF only in the replacement of 20 wt% of the reference polyol blend with a 70/30 w/w mixture of the FPBO-derived polyol BTG_NW_SPORes (2565) and TEP. This corresponds to a direct substitution of 14 w/w% of the reference polyol with the bio-based polyol. Given the solid-state character of BTG_NW_SPORes (2565) at room temperature, dilution was necessary to achieve processable rheology. The substitution level was kept conservative due to the plasticizing effect of TEP, which adversely affects the foam properties. Additionally, higher substitution levels would have offset the hydroxyl-equivalents between the two formulations excessively, given the different OH values of the reference polyether (440 mg KOH/g) and the bio-based blend (328 mg KOH/g). TCPP, already used in the formulation as a flame-retardant additive, can also act as a diluent; however, TEP was preferred because of its lower viscosity (approximately 2 mPa·s at 25 °C, as opposed to 70 mPa·s at 25 °C for TCPP), making it more suited for this specific application. Considering the growing regulatory scrutiny regarding the use of halogenated flame retardants [34], the concentration of TCPP diluent was purposefully limited. Propylene carbonate was not considered for this application due to its lower dosing limits and elevated plasticizing effect. The choice of using a diluent that acts as a flame retardant serves a dual purpose, as enhancing the flame resistance properties of polyurethane-based structural materials is of particular interest.
The results from chemical, structural, thermal, mechanical, acoustic, and environmental analyses indicate that a partial substitution of the reference polyol with the FPBO-derived polyol/TEP blend does not fundamentally alter the mechanism of polyurethane foam formation, but instead introduces predictable, formulation-driven modifications across multiple property domains. The observed differences between NW and REF systems are therefore not independent effects but are primarily linked to changes in the chemical–physical properties of the polyol component (hydroxyl value, functionality), the presence of TEP, and the resulting adjustments in network structure and foam morphology. The dataset supports a coherent interpretation in which chemical substitution leads to measurable but non-disruptive changes in performance rather than isolated or conflicting trends across individual analyses.
The FTIR spectra of both foams exhibited the characteristic absorption bands of polyurethane materials, indicating that the FPBO-derived polyol was successfully incorporated into the polyurethane structure and did not compromise its formation. Minor differences in band shape and intensity, particularly in the N–H and carbonyl regions, suggest subtle variations in hydrogen bonding and segmental organization. These differences are consistent with the incorporation of the FPBO-derived polyol and may contribute to the observed changes in reactivity and network development. Furthermore, the absence of a distinct absorption band near 2270 cm−1 suggests that no substantial amount of unreacted isocyanate remained in either formulation. The FTIR spectra of REF and NW foams are highly similar, indicating that both systems undergo comparable urethane formation. Therefore, FTIR primarily serves to confirm the reaction completeness rather than to distinguish between the two formulations. Any differences between REF and NW foams are more clearly reflected in their reactivity and network development, as discussed below. The slightly faster string time observed for the NW foam can be attributed to the presence of primary hydroxyl groups in the FPBO-derived polyol, which are intrinsically more reactive toward isocyanates than the secondary hydroxyls dominant in propoxylated sorbitol-based reference polyether polyols [35]. The longer tack-free time reflects the lower overall network functionality of the NW blend. The bio-polyol’s lower functionality relative to the sorbitol-based reference polyether, further diluted by the chemically inert TEP, reduces the average crosslink density of the emerging network and delays the gel point [36,37]. These reactivity differences were manageable in the pour-in-place panel manufacturing process and did not compromise panel integrity.
The dimensional stability, albeit lower than the reference, is still within an acceptable range for rigid PUR foams. The lower hydroxyl value and functionality of the bio-polyol, together with the presence of TEP, may have contributed to the reduced dimensional stability observed for the NW foam [38]. Slight modifications to the formulation, which were outside the scope of this study, such as the selection of a different foam stabilizing agent or fine-tuning the concentration, could mitigate the observed difference. The determined improvement in flame resistance should be interpreted with caution, since the NW formulation contained an additional flame-retardant component (TEP) which was used as a diluent. It is plausible that aromatic structures originating from the pyrolysis-oil-derived polyol may have also contributed to the observed behavior [39]. However, the mechanisms responsible for improved flame performance were not investigated in the present study. In addition, the slightly higher char residue observed in the TGA analysis may be related to the presence of pyrolysis-oil-derived components. Similar behavior has been reported for aromatic-rich bio-based polyols, which can promote char formation during thermal degradation, thereby contributing to enhanced flame resistance [15]. Overall, the results indicate that partial substitution of the conventional polyol with the FPBO-derived polyol/TEP blend was technically feasible without major processing issues or loss of foam integrity.
The pronounced color difference observed in the NW foam can be directly associated with the incorporation of pyrolysis-oil-derived components into the polymer matrix. The increased CIE b* value and overall darker appearance suggest the presence of chromophoric structures such as conjugated phenolic species and carbonyl-containing degradation products, which are known to absorb in the visible region of the light spectrum and impart yellow–brown coloration [34,40]. The high ΔE* value (>9) confirms that these chemical contributions are not merely subtle modifications but result in a clearly distinguishable macroscopic visual alteration. From an application perspective, this strong chromatic deviation may be relevant depending on end-use requirements, particularly in applications where aesthetic consistency or color neutrality is critical.
In terms of morphology, both foams retained a predominantly closed-cell structure, indicating that the incorporation of pyrolysis-oil-based components did not disrupt the fundamental foaming mechanism [38,41]. The pycnometer results indicate that both foams possess very similar structural characteristics, as reflected by the close values of envelope density, skeletal density, and pore volume. The slightly lower envelope and skeletal densities observed for the NW foam may suggest a marginal reduction in solid framework compactness compared to the REF foam [42]. However, the differences are very small and may not represent substantial structural modifications. Similarly, the small decrease in total pore volume for the NW foam suggests that the introduction or modification associated with the NW sample had minimal influence on the porous architecture of the material. Since pore volume is directly related to cellular structure and foam expansion, the comparable values imply that both foams maintained nearly identical porosity characteristics [43]. The low standard deviation values demonstrate the reliability of the gas pycnometer measurements and indicate homogeneous foam formation across samples.
The slight variation in thermal conductivity with increasing temperature for both foams can be attributed to enhanced heat transfer through the polymer matrix and gas phase. To obtain suitable performance for insulation, the material used must therefore have high porosity, with closed cells capable of trapping gas of low thermal conductivity [36]. The NW foam showed lower measured thermal conductivity than the REF foam across the investigated temperature range. However, these measurements were performed on single specimens per formulation; therefore, the observed differences should be interpreted as indicative trends rather than statistically validated differences. In closed-cell PUR foams, thermal conductivity is governed by three parallel mechanisms: conduction through the solid polymer framework, conduction through the gas phase trapped within the cells, and radiative heat transfer across cell walls [44,45]. Since both foams have nearly identical bulk density and gas-phase composition (i.e., the blowing agent system was unchanged), the observed differences in thermal conductivity may be related to dissimilarities in cellular morphology observed by microscopy. Smaller cells reduce the mean free path for radiative heat transfer and increase the tortuosity of solid-phase conductive pathways, both of which lower effective thermal conductivity [46]. This interpretation is consistent with the findings of Schulzke et al. [7], who reported that pyrolysis-condensate-based rigid PUR foams achieved thermal conductivity 8% lower than the commercial reference (0.0283 vs. 0.0308 W/m/K). This improvement was attributed to changes in the cellular structure. The slightly higher specific heat capacity of the NW foam relative to the REF is a secondary consequence of the same structural refinement: a finer cellular architecture increases the interfacial area between the solid and gas phases per unit mass, modestly enhancing the effective thermal mass of the composite material. The specific heat capacity of both foams increased with temperature. The NW foam exhibited slightly higher values than the REF foam; however, given that single specimens were used for measurements, this difference should be considered indicative only. The origin of this variation remains unclear and may be related to microstructural differences between the foams. Both thermal conductivity and specific heat capacity increased with temperature, as expected for polymer–gas composite materials. Overall, the thermal behavior of the NW foam is comparable to the REF within the limits of the conducted measurements, and no statistically supported performance advantage can be established.
The cohesive failure mode during the internal bond strength analysis confirms that the foam-to-plywood bond through in situ foam expansion against the plywood surface was not the weak link, which is consistent with the known reactivity of isocyanate groups toward the hydroxyl-rich wood surface. The results support the mechanical viability of NW foam as a sandwich panel core. The modest reduction in cohesive strength may be related to formulation differences between the systems rather than any fundamental incompatibility of the pyrolysis-oil-derived component with the panel system.
The compressive strength of pure NW foam was lower than that of the REF foam. This reduction may be attributed to the plasticizing effect of TEP on the urethane polymer network, as well as to density differences between the tested foam samples. In contrast, the compressive strength of the sandwich panels showed slightly higher values for the NW system compared to the REF system. This difference may be attributed to the reinforcing effect of the plywood facings and the more effective load distribution within the sandwich structure. The variability observed in compressive strength results could also be related to density differences among specimens, which are inherent to pour-in-place foam processing and can influence local mechanical performance.
Overall, the results suggest that while the foam core properties are reduced in the NW formulation, the sandwich configuration compensates for this effect, resulting in comparable structural performance at the panel level. The literature on partially bio-based rigid PUR systems primarily addresses high-density foams without reinforcement and reports that moderate polyol substitution levels (15–30 wt%) can maintain overall compressive performance at the foam level [11]. This differs from the present study, where a reduction in compressive strength was observed in the foam phase.
The sound transmission loss for both panels shows high values and a subsequent mass-law decline typical of lightweight sandwich structures, where acoustic insulation is governed primarily by the areal mass of the panel rather than by core properties [47]. The minimum TLn observed in the 150 to 250 Hz range maybe a coincidence or may correspond to the resonance dip region commonly reported for sandwich panels, where flexural wave coupling reduces effective insulation [48]. Moreover, the sound absorption data revealed a similar performance trend between the two sandwich panels. Both systems exhibited low absorption coefficients below 250 Hz, consistent with behavior expected for low-density rigid PUR. In closed-cell sandwich structures, mid-frequency sound energy is dissipated primarily through viscous friction and thermal exchange between the oscillating gas phase and the solid cell walls [49,50]. In addition, structural vibrations of the panel system contribute to sound propagation. The NRC values reported for similar panels and foams are typically <0.25, and both sandwich panels investigated in this study fall within this range [51]. For applications such as building envelopes or structural insulations where thermal performance is the primary requirement and acoustic performance is secondary, the NW foam does not demonstrate a statistically significant disadvantage compared to the REF system. Therefore, within the limits of the conducted measurements, it may be considered functionally comparable to the REF system.
From a sustainability perspective, the investigated material system may also offer environmental benefits beyond the technical performance evaluated in this study. NW bio-polyols achieved a climate change impact of 0.38 kg CO2 eq/kg, an 87% reduction relative to petroleum-based polyether polyols, largely attributable to co-product credits generated during FPBO fractionation. It should be emphasized that this result refers exclusively to the polyol production stage and does not represent a full cradle-to-grave assessment of the final foam products. Considering that polyols typically contribute a substantial share of the total greenhouse gas emissions of polyurethane foams, this reduction is expected to translate into a significant decrease at the material level; however, a full system-level LCA would be required to quantify the overall impact. Literature-based estimates of bio-polyols derived from vegetable oils report GHG reductions of 13%–46% at the polyol component level compared to petrochemical counterparts, depending on feedstock and allocation choices [52].

5. Conclusions

This study provides a comprehensive, multi-property comparison of plywood sandwich panels which incorporate a pyrolysis-oil-based rigid PUR foam (NW) against panels of identical topology produced with a commercial fossil-derived reference foam (REF). The characterization was designed to study the performance of the NW foam across all aspects relevant to construction applications, including foam chemistry and reactivity, visual appearance, cellular microstructure, density and porosity, thermal insulation, mechanical integrity of the sandwich assembly, and acoustic behavior. The results indicate that a partial substitution of the reference polyether polyol with a bio-polyol blend derived from pyrolysis sugars is technically feasible, yielding materials with statistically comparable performance to that of the reference system within the limits of the measurements conducted. No consistent or statistically supported performance advantage was observed for either formulation across the evaluated properties. Although some property-specific differences were identified, these do not indicate a systematic improvement; rather they reflect formulation-dependent trade-offs within the NW system. The thermal results are based on limited replication and should therefore be interpreted with caution in the context of variability. Further work with larger sample sets and more comprehensive statistical validation is required to fully assess the robustness and application potential of these bio-based foam systems.

Author Contributions

Conceptualization, J.G., J.S. and A.S.; methodology, J.G. and J.S.; validation, J.G. and J.S.; formal analysis, J.G., J.S., D.C., H.H., E.A. and R.P.; investigation, J.G. and J.S.; data curation, J.G.; writing—original draft preparation, J.G., D.C. and A.S.; writing—review and editing, J.G., J.S. and A.S.; visualization, J.G.; supervision, A.M., B.v.d.B. and A.S.; project administration, B.v.d.B.; funding acquisition, A.M., B.v.d.B. and A.S. All authors have read and agreed to the published version of the manuscript.

Funding

Horizon Europe Program within the project NewWave under grant agreement No 101058369. A.S. acknowledges the support of the Slovenian Research and Innovation Agency (project N2-0380). J.S. acknowledges the support of the SUMOC project co-financed by National Center of Science (NCN) through grant 2024/55/I/HS4/01297, the Slovenian Research and Innovation Agency (ARIS) through grant N2-0434 and the Austrian Science Fund (FWF) through grant 10.55776/PIN4864224.

Data Availability Statement

Data are available upon request.

Acknowledgments

The authors gratefully acknowledge Foresa Technologies for providing the plywood panels used in this research and the support from the NewWave consortium partners.

Conflicts of Interest

Authors David Contus and Andrea Minigher were employed at the AEP Polymers S.r.l. Authors Hans Heeres and Bert van de Beld were employed by the company BTG Biomass Technology Group. The remaining authors declare that the research was conducted in the absence of any commercial or financial relationships that could be construed as a potential conflict of interest.

References

  1. Le, D.L.; Salomone, R.; Nguyen, Q.T. Circular bio-based building materials: A literature review of case studies and sustainability assessment methods. Build. Environ. 2023, 244, 110774. [Google Scholar] [CrossRef] [Scilit]
  2. Chen, L.; Huang, L.; Hua, J.; Chen, Z.; Wei, L.; Osman, A.I.; Fawzy, S.; Rooney, D.W.; Dong, L.; Yap, P.S. Green construction for low-carbon cities: A review. Environ. Chem. Lett. 2023, 21, 1627–1657. [Google Scholar] [CrossRef] [Scilit]
  3. Vladimirova, E.; Gong, M. Advancements and Applications of Wood-Based Sandwich Panels in Modern Construction. Buildings 2024, 14, 2359. [Google Scholar] [CrossRef] [Scilit]
  4. Gozdecki, C.; Kociszewski, M. The properties of sandwich panels made of standard wood-based panels. Ann. Wars. Univ. Life Sci.-SGGW For. Wood Technol. 2021, 114, 125–130. [Google Scholar] [CrossRef] [Scilit]
  5. Raji, A.M.; Hambali, H.; Khan, Z.I.; Mohamad, Z.B.; Azman, H.; Ogabi, R. Emerging trends in flame retardancy of rigid polyurethane foam and its composites: A review. J. Cell. Plast. 2022, 59, 65–122. [Google Scholar] [CrossRef] [Scilit]
  6. Wang, Z.; Wang, C.; Gao, Y.; Li, Z.; Shang, Y.; Li, H. Porous Thermal Insulation Polyurethane Foam Materials. Polymers 2023, 15, 3818. [Google Scholar] [CrossRef] [Scilit] [PubMed]
  7. Schulzke, T.; Iakovleva, A.; Cao, Q.; Conrad, S.; Zabelkin, S.; Grachev, A. Polyurethane foams produced from pyrolysis oil—Production and possible application. Biomass Bioenergy 2018, 115, 195–202. [Google Scholar] [CrossRef] [Scilit]
  8. Chiacchiarelli, L. Sustainable, Nanostructured, and Bio-based Polyurethanes for Energy-efficient Sandwich Structures Applied to the Construction Industry. In Biomass, Biopolymer-Based Materials, and Bioenergy; Woodhead Publishing: Duxford, UK, 2019. [Google Scholar] [CrossRef] [Scilit]
  9. Rossi, D.; Anguillesi, I.; Cappello, M.; Dell’Anna, M.M.; Seggiani, M. Novel synthesis of flexible polyurethane foams with high bio-based content derived from waste cooking oil. Sci. Rep. 2025, 16, 554. [Google Scholar] [CrossRef] [Scilit] [PubMed]
  10. Kurańska, M.; Polaczek, K.; Auguścik-Królikowska, M.; Prociak, A.; Ryszkowska, J. Open-cell rigid polyurethane bio-foams based on modified used cooking oil. Polymer 2020, 190, 122164. [Google Scholar] [CrossRef] [Scilit]
  11. Andersons, J.; Kirpluks, M.; Cabulis, P.; Kalnins, K.; Cabulis, U. Bio-based rigid high-density polyurethane foams as a structural thermal break material. Constr. Build. Mater. 2020, 260, 120471. [Google Scholar] [CrossRef] [Scilit]
  12. Sandak, A.; Poohphajai, F.; Selmanović, A.; Herrera-Diaz, R.; Grzybek, J.; Peeters, K.; Perumal, S.; Földvári-Nagy, E.; Han, L.; Acquah, R.; et al. Wood Modification Using Fast Pyrolysis Bio-Oil (FPBO): Formulation Development, Characterization, and Evaluation of Wood Performance. Forests 2026, 17, 709. [Google Scholar] [CrossRef] [Scilit]
  13. Garcia, G.E.; Potthast, A.; Sumerskii, I.; Antonino, L.D.; de Oliveira, M.M.; de Sousa, R.R.; Rosenau, T.; dos Santos, D.J. Pyrolytic lignin fractionation for rigid polyurethane foams: Relationship between the Pyrolysate’s chemical structure and foam properties. Sustain. Chem. Environ. 2024, 5, 100065. [Google Scholar] [CrossRef] [Scilit]
  14. Lodron, E.S.; Lacerda, A.S.; Soares, L.F.; Hernandez, A.I.C.; García, C.T.; Freire, R.T.S.; Panzera, T.H. Sustainable sandwich panels: Harnessing the power of castor oil polyurethane and foam. Acad. Mater. Sci. 2025, 2, 1–11. [Google Scholar] [CrossRef] [Scilit]
  15. Wei, P.; Chen, J.; Zhang, Y.; Pu, L. Wood-Based Sandwich Panels: A Review. Wood Res. 2021, 66, 875–890. [Google Scholar] [CrossRef] [Scilit]
  16. ETA Florence Renewable Energies. Production and Delivery of Polyols—NewWave Project; NewWave Project Consortium: Enschede, The Netherlands, 2025. [Google Scholar] [CrossRef]
  17. ASTM D7487-18; Standard Practice for Polyurethane Raw Materials: Polyurethane Foam Cup Test. ASTM International: West Conshohocken, PA, USA, 2024. [CrossRef] [Scilit]
  18. ASTM D1621-00; Test Method for Compressive Properties of Rigid Cellular Plastics. ASTM International: West Conshohocken, PA, USA, 2017.
  19. ASTM D2126-20; Test Method for Response of Rigid Cellular Plastics to Thermal and Humid Aging. ASTM International: West Conshohocken, PA, USA, 2025.
  20. Finkbeiner, M.; Inaba, A.; Tan, R.; Christiansen, K.; Klüppel, H.-J. The New International Standards for Life Cycle Assessment: ISO 14040 and ISO 14044. Int. J. Life Cycle Assess. 2006, 11, 80–85. [Google Scholar] [CrossRef] [Scilit]
  21. Ospina, S. D7.1—Preliminary LCA and LCC Report 2024; BTG Biomass Technology Group BV: Enschede, The Netherlands, 2024. [Google Scholar]
  22. ISO 8301:1991; Thermal Insulation—Determination of Steady-State Thermal Resistance and Related Properties—Heat Flow Meter Apparatus. International Organization for Standardization (ISO): Geneva, Switzerland, 1991.
  23. EN 319:1993; Particleboards and Fibreboards—Determination of Tensile Strength Perpendicular to the Plane of the Board. European Committee for Standardization (CEN): Brussels, Belgium, 1993.
  24. ASTM E2611-17; Test Method for Measurement of Normal Incidence Sound Transmission of Acoustical Materials Based on the Transfer Matrix Method. ASTM International: West Conshohocken, PA, USA, 2019.
  25. ISO 10534-2:2023; Acoustics—Determination of Acoustic Properties in Impedance Tubes Part 2: Two-Microphone Technique for Normal Sound Absorption Coefficient and Normal Surface Impedance. International Organization for Standardization (ISO): Geneva, Switzerland, 2023.
  26. ASTM E1050-12; Test Method for Impedance and Absorption of Acoustical Materials Using a Tube, Two Microphones and a Digital Frequency Analysis System. ASTM International: West Conshohocken, PA, USA, 2019.
  27. Ionescu, M. (Ed.) Chemistry and Technology of Polyols for Polyurethanes; Rapra Technology: Shrewsbury, UK, 2005. [Google Scholar]
  28. Sonnenschein, M.F. Polyurethanes: Science, Technology, Markets, and Trends, 1st ed.; Wiley: Hoboken, NJ, USA, 2014. [Google Scholar] [CrossRef] [Scilit]
  29. Lee, H.S.; Wang, Y.K.; Hsu, S.L. Spectroscopic analysis of phase separation behavior of model polyurethanes. Macromolecules 1987, 20, 2089–2095. [Google Scholar] [CrossRef] [Scilit]
  30. Stanzione, M.; Russo, V.; Oliviero, M.; Verdolotti, L.; Sorrentino, A.; Di Serio, M.; Tesser, R.; Iannace, S.; Lavorgna, M. Synthesis and characterization of sustainable polyurethane foams based on polyhydroxyls with different terminal groups. Polymer 2018, 149, 134–145. [Google Scholar] [CrossRef] [Scilit]
  31. Nishiyama, Y.; Kumagai, S.; Motokucho, S.; Kameda, T.; Saito, Y.; Watanabe, A.; Nakatani, H.; Yoshioka, T. Temperature-dependent pyrolysis behavior of polyurethane elastomers with different hard- and soft-segment compositions. J. Anal. Appl. Pyrolysis 2020, 145, 104754. [Google Scholar] [CrossRef] [Scilit]
  32. Wong, C.S.; Badri, K.H. Chemical Analyses of Palm Kernel Oil-Based Polyurethane Prepolymer. Mater. Sci. Appl. 2012, 3, 78–86. [Google Scholar] [CrossRef]
  33. European Chemicals Agency. Regulatory Strategy for Flame Retardants; European Chemicals Agency: Helsinki, Finland, 2023. [Google Scholar]
  34. Liaw, S.; Justo, O.R.; Perez, V.H.; Zhou, S.; Garcia-Perez, M. Ozonation of Pyrolytic Aqueous Phase: Changes in the Content of Phenolic Compounds and Color. Chem. Eng. Technol. 2016, 39, 1828–1834. [Google Scholar] [CrossRef] [Scilit]
  35. Nagy, L.; Vadkerti, B.; Lakatos, C.; Fehér, P.P.; Zsuga, M.; Kéki, S. Kinetically Equivalent Functionality and Reactivity of Commonly Used Biocompatible Polyurethane Crosslinking Agents. Int. J. Mol. Sci. 2021, 22, 4059. [Google Scholar] [CrossRef] [Scilit] [PubMed]
  36. Lim, H.; Kim, S.H.; Kim, B.K. Effects of the functionality of polyol in rigid polyurethane foams. J. Appl. Polym. Sci. 2008, 110, 49–54. [Google Scholar] [CrossRef] [Scilit]
  37. Kairytė, A.; Kremensas, A.; Balčiūnas, G.; Członka, S.; Strąkowska, A. Closed Cell Rigid Polyurethane Foams Based on Low Functionality Polyols: Research of Dimensional Stability and Standardised Performance Properties. Materials 2020, 13, 1438. [Google Scholar] [CrossRef] [Scilit] [PubMed]
  38. Zhang, Q.; Lin, X.; Chen, W.; Zhang, H.; Han, D. Modification of Rigid Polyurethane Foams with the Addition of Nano-SiO2 or Lignocellulosic Biomass. Polymers 2020, 12, 107. [Google Scholar] [CrossRef] [Scilit] [PubMed]
  39. Dominguez-Rosado, E.; Liggat, J.J.; Snape, C.E.; Eling, B.; Pichtel, J. Thermal degradation of urethane modified polyisocyanurate foams based on aliphatic and aromatic polyester polyol. Polym. Degrad. Stab. 2002, 78, 1–5. [Google Scholar] [CrossRef] [Scilit]
  40. Jurczyková, T.; Šárovec, O.; Kačík, F.; Hájková, K.; Jurczyk, T.; Hrčka, R. Chromophores’ Contribution to Color Changes of Thermally Modified Tropical Wood Species. Polymers 2023, 15, 4000. [Google Scholar] [CrossRef] [Scilit] [PubMed]
  41. Mirski, R.; Walkiewicz, J.; Dukarska, D.; Derkowski, A. Morphological Features of PUR-Wood Particle Composite Foams. Materials 2022, 15, 6741. [Google Scholar] [CrossRef] [Scilit] [PubMed]
  42. Zemła, M.; Kurańska, M.; Vevere, L.; Kirpluks, M.; Malewska, E.; Apostolou, M.S.; Prociak, A. Effect of Chemical Structure and Apparent Density of Rigid Polyurethane Foams on the Properties of Their Chemical Recycling Products. Materials 2024, 17, 6190. [Google Scholar] [CrossRef] [Scilit] [PubMed]
  43. Pang, Y.; Cao, Y.; Zheng, W.; Park, C.B. A comprehensive review of cell structure variation and general rules for polymer microcellular foams. Chem. Eng. J. 2022, 430, 132662. [Google Scholar] [CrossRef] [Scilit]
  44. Soloveva, O.V.; Solovev, S.A.; Vankov, Y.V.; Shakurova, R.Z. Experimental Studies of the Effective Thermal Conductivity of Polyurethane Foams with Different Morphologies. Processes 2022, 10, 2257. [Google Scholar] [CrossRef] [Scilit]
  45. Glicksman, L.R. Heat Transfer in Foams. In Low Density Cellular Plastics; Hilyard, N.C., Cunningham, A., Eds.; Springer: Dordrecht, The Netherlands, 1994; pp. 104–152. [Google Scholar] [CrossRef] [Scilit]
  46. Choe, H.; Choi, Y.; Kim, J.H. Threshold cell diameter for high thermal insulation of water-blown rigid polyurethane foams. J. Ind. Eng. Chem. 2019, 73, 344–350. [Google Scholar] [CrossRef] [Scilit]
  47. Zhang, H.; Chen, S.; Liu, Z.; Song, Y.; Xiao, Y. Light-weight large-scale tunable metamaterial panel for low-frequency sound insulation. Appl. Phys. Express 2020, 13, 067003. [Google Scholar] [CrossRef] [Scilit]
  48. Isaac, C.W.; Pawelczyk, M.; Wrona, S. Comparative Study of Sound Transmission Losses of Sandwich Composite Double Panel Walls. Appl. Sci. 2020, 10, 1543. [Google Scholar] [CrossRef] [Scilit]
  49. Ning, J.; Zhao, G.; He, X. Non-acoustical parameters and sound absorption characteristics of porous polyurethane foams. Phys. Fluids 2019, 31, 037106. [Google Scholar] [CrossRef] [Scilit]
  50. Merillas, B.; Villafañe, F.; Rodríguez-Pérez, M.Á. A New Methodology Based on Cell-Wall Hole Analysis for the Structure-Acoustic Absorption Correlation on Polyurethane Foams. Polymers 2022, 14, 1807. [Google Scholar] [CrossRef] [Scilit] [PubMed]
  51. Tiuc, A.-E.; Vermeşan, H.; Gabor, T.; Vasile, O. Improved Sound Absorption Properties of Polyurethane Foam Mixed with Textile Waste. Energy Procedia 2016, 85, 559–565. [Google Scholar] [CrossRef] [Scilit]
  52. Helling, R.K.; Russell, D.A. Use of life cycle assessment to characterize the environmental impacts of polyol production options. Green Chem. 2009, 11, 380–389. [Google Scholar] [CrossRef] [Scilit]
Figure 1. Protocol for foam image analysis used to determine pore morphology: (a) grey image of a thin foam section acquired by optical microscopy, (b) colour-enhanced image after semi-automatic edge detection and pore-wall identification, and (c) binary image showing pore contours used for particle measurements.
Forests 17 00824 g001
Figure 2. General scheme of the chemical reaction between an alcohol and isocyanate that leads to the formation of a urethane.
Forests 17 00824 g002
Figure 3. General scheme of the chemical reaction between (a) water and isocyanate, which leads to the formation of an amine and gaseous CO2, and (b) the subsequent reaction of the amine produced in step (a) with an isocyanate group that leads to the formation of a disubstituted urea linkage.
Forests 17 00824 g003
Figure 4. FTIR spectra of the REF and NW foams, with characteristic polyurethane absorption bands indicated.
Forests 17 00824 g004
Figure 5. Visual appearance of the polyurethane REF (left) and NW (right) foams showing evident differences in color.
Forests 17 00824 g005
Figure 6. Microscopic images of the NW and REF polyurethane (PUR) foams. Left: Full-height stitched cross-sectional images. Enlarged views of the selected regions are shown in the center to illustrate the overall cellular morphology. Right: Representative micrographs of 100 µm-thick sections acquired at 150× magnification, used for quantitative analysis. Scale bars: 2 mm (stitched images), 1 mm (enlarged views), and 200 µm (high-magnification images).
Forests 17 00824 g006
Figure 7. Distribution of cell-wall thickness for the NW and REF foams. The box represents the interquartile range, the horizontal line indicates the median, the × denotes the mean, whiskers extend to the non-outlier minimum and maximum values, and circles represent outliers.
Forests 17 00824 g007
Figure 8. Cumulative cell area distributions of the NW and REF foams obtained from automated image analysis of segmented microscopy images. The cumulative frequency is presented on a logarithmic scale.
Forests 17 00824 g008
Figure 9. Thermogravimetric analysis (TGA) curves (top), and derivative thermogravimetric (DTG) curves (bottom) of the REF and NW foams recorded in the temperature range of 30 to 600 °C.
Forests 17 00824 g009
Figure 10. Thermal conductivity of the sandwich panels as a function of temperature.
Forests 17 00824 g010
Figure 11. Specific heat capacity of the sandwich panels as a function of temperature.
Forests 17 00824 g011
Figure 12. Internal bond strength of the sandwich panels determined perpendicular to the panel surface. Note: Error bars (whiskers) represent the standard deviation of the measurements.
Forests 17 00824 g012
Figure 13. Compressive strength (left) and modulus of elasticity (MoE) (right) of the sandwich panels. Note: Error bars (whiskers) represent the standard deviation of the measurements.
Forests 17 00824 g013
Figure 14. Sound transmission loss (TLn) of the REF and NW sandwich panels as a function of frequency.
Forests 17 00824 g014
Figure 15. Sound absorption coefficient (α) of the sandwich panels measured in 1/3-octave bands.
Forests 17 00824 g015
Table 1. Components used in the preparation of polyurethane foams.
ComponentsREF Foam
(pbw)
NW Foam
(pbw)
PCI Polyol SB440 (OH 440)10080
BTG_NW_SPOH (2565)/TEP 70/30 (OH 328)020
Tris-chloropropyl phosphate (TCPP)2020
TEGOSTAB B-84205 (Silicone surfactant)22
Water (Physical blowing agent)3.53.5
Polycat 5 (Tertiary amine blowing catalyst)0.10.1
DMCHA (Polycat 8) (Tertiary amine gelling catalyst)11
Cyclopentane (Physical blowing agent)44
Table 2. Summary of the properties of rigid polyurethane foam. Values are reported as mean values; standard deviations are given in parentheses.
PropertyREF FoamNW Foam
Mixing time (s)77
String time (s)10391
Tack-free time (s)391410
Density (kg/m3)35.7
(0.8)
32.3
(0.7)
Compression strength //, kPa156.5
(7.7)
128.8
(9.8)
Compression strength ⟂, kPa184.9
(1.9)
159.7
(5.2)
Dimensional stability (%, 24 h at 100 °C)−0.7
(0.2)
−2.5
(0.5)
UL-94 Vertical afterflame (s)13.7
(2.3)
7.7
(2.3)
Table 3. Colorimetric parameters of the REF and NW foams in the CIELAB color space. Values are reported as mean values; standard deviations are given in parentheses.
ParameterREF FoamNW FoamDifference
e(Δ)
(Δ)2
CIE L*85.872
(0.103)
80.302
(0.178)
5.5731.02
CIE a*−0.918
(0.041)
1.474
(0.151)
−2.395.72
CIE b*8.832
(0.108)
15.676
(0.187)
−6.8446.84
ΔE9.14
Table 4. Gas pycnometry results, including density, total pore volume, and open- and closed-cell contents. Values are reported as mean values; standard deviations are given in parentheses.
SpecimensEnvelope
Density
Skeletal
Density
Total Pore
Volume
Open Cells ContentClosed Cells Content
g/cm3g/cm3cm3/g%%
REF foam0.0336
(0.003)
0.0410
(0.0006)
5.1860
(0.3632)
17.5382.47
NW foam0.0335
(0.0002)
0.0405
(0.0004)
5.1680
(0.2741)
17.3182.69
Table 5. Summary of the analyzed properties of the developed foams and sandwich panels containing pyrolysis oil compared with the reference product.
PropertyReference
(REF Foam)
NewWave
(NW Foam)
Comparative
Trend
Analyzed as foamFree-rise density (g/cm3)0.03360.0335Forests 17 00824 i001  b
Pores volume (cm3/g)5.18605.1680Forests 17 00824 i001  b
Compression strength //
at 10% strain (kPa)
156.5128.8Forests 17 00824 i002  b
Compression strength ⟂
at 10% strain (kPa)
184.9159.7Forests 17 00824 i002  b
Dimensional stability
(%, 24 h at 100 °C)
−0.7−2.5Forests 17 00824 i002  b
UL-94 Vertical Afterflame (s)13.77.7Forests 17 00824 i003  b
Analyzed as sandwich panelThermal conductivity
at 25 °C (W/m·K)
0.03930.0389Forests 17 00824 i003  b
Specific heat capacity
at 25 °C (J/kg·K)
1513.41524.6Forests 17 00824 i003  b
Internal bond (kPa)282266Forests 17 00824 i001  a
MoE compression (kPa)78208015Forests 17 00824 i001 a
Compressive strength
at 20% strain (kPa)
259268Forests 17 00824 i001  a
Sound absorption
Noise Reduction Coefficient (−)
0.0900.071Forests 17 00824 i002 b
a indicates parameters for which statistical analysis was performed. b indicates parameters not subjected to statistical analysis due to limited sample size.
Disclaimer/Publisher’s Note: The statements, opinions and data contained in all publications are solely those of the individual author(s) and contributor(s) and not of MDPI and/or the editor(s). MDPI and/or the editor(s) disclaim responsibility for any injury to people or property resulting from any ideas, methods, instructions or products referred to in the content.