Article

Residual Density Effects on Growth and Thinning Productivity in Naturally Regenerated Pinus densiflora Stands


1
Department of Forest Resources, Yeungnam University, Gyeongsan 38541, Republic of Korea
2
Division of Forest Fire, National Institute of Forest Science, Seoul 02455, Republic of Korea
3
Forest Technology and Management Research Center, National Institute of Forest Science, Pocheon 11186, Republic of Korea
*
Author to whom correspondence should be addressed.
Forests 2026, 17(5), 593; https://doi.org/10.3390/f17050593
Submission received: 14 April 2026 / Revised: 5 May 2026 / Accepted: 13 May 2026 / Published: 14 May 2026
(This article belongs to the Special Issue The Impact of Disturbances on Forest Restoration and Regeneration)

Abstract

Natural forest regeneration offers economic, ecological, and environmental advantages over artificial regeneration; however, its application is often constrained by uncertainties in stand development and management outcomes. Pre-commercial thinning (PCT), a key assisted natural regeneration practice, is widely used to regulate stand density and improve early stand development. Nevertheless, empirical evidence remains limited regarding how post-thinning residual density influences both tree growth and operational performance in high-density naturally regenerated Pinus densiflora stands. This study evaluated three residual density treatments (RD2000, RD3000, and RD5000) following PCT in naturally regenerated pine stands with an initial density of approximately 30,000 stems ha−1. Diameter at breast height, tree height, and crown area were monitored annually over three years, while thinning productivity and operational costs were quantified during treatment implementation. Residual density significantly affected both biological and operational outcomes. The intermediate residual density (RD3000) showed the most consistent growth responses, whereas the lowest residual density (RD2000) resulted in suppressed growth. The highest residual density (RD5000) achieved the highest productivity and lowest operational costs despite moderate growth performance. These results indicate a trade-off between growth performance and operational efficiency and suggest that an intermediate residual density may provide a balanced strategy for managing naturally regenerated pine stands.

1. Introduction

Natural forest regeneration (hereafter natural regeneration) refers to the re-establishment of forest stands through seedling recruitment or vegetative sprouting from residual trees, soil seed banks, or adjacent forests following canopy disturbance [1,2]. Post-disturbance natural regeneration can provide greater environmental benefits than planted forests, although economic productivity may be lower [3,4]. This approach has been widely applied and successfully implemented across diverse forest ecosystems worldwide, demonstrating its effectiveness as a cost-efficient and ecologically sustainable approach to forest restoration and management [5]. However, natural regeneration remains underutilized in practice because policy-makers and restoration practitioners frequently favor active restoration methods, partly due to uncertainty surrounding its spatial occurrence, temporal dynamics, and achievable extent [6]. In particular, the restoration community lacks effective tools to reliably predict where natural regeneration is most likely to occur, thereby limiting confidence among decision-makers in its capacity to deliver multiple benefits of native forest recovery [5,7]. More broadly, uncertainty about the outcomes of naturally regenerated stands, including how they develop and how they can be managed to meet operational and ecological objectives, remains a barrier to wider implementation of natural regeneration-based approaches.
In Republic of Korea (hereafter referred to as Korea), large-scale afforestation programs initiated in the 1970s successfully rehabilitated severely degraded mountainous landscapes, which now cover approximately 60% of the national territory [8]. Since then, reforestation efforts have continued at the national level, with annual planting areas typically exceeding 20,000 ha [9]. These artificial regeneration practices are primarily conducted through plantation using container-grown seedlings. However, these programs have relied predominantly on artificial regeneration and have required substantial public investment, exceeding 10 billion KRW annually (approximately 7.7 million USD) [10,11]. Although many forest stands established through these programs have reached ecological maturity, regeneration practices in Korea continue to depend largely on planting rather than leveraging natural regeneration processes. At the same time, the economic viability of planting-based forestry remains limited. Stumpage prices of major commercial species (approximately 4.5 million KRW ha−1; ~3460 USD ha−1) are substantially lower than reforestation costs (often >10 million KRW ha−1; ~7700 USD ha−1), creating a persistent financial gap between harvesting revenues and regeneration expenses [10]. Consequently, revenues from timber harvesting alone are insufficient to finance subsequent reforestation, making it difficult to sustain forest management cycles based solely on market returns. This structural imbalance between regeneration costs and harvesting revenues highlights the limitations of planting-based systems and underscores the need for more cost-effective regeneration strategies. Such approaches should reduce reliance on intensive planting while maintaining forest productivity and ecosystem service provision.
Pinus densiflora Siebold & Zucc. (hereafter referred to as P. densiflora) is one of the most important native conifer species in Korea and plays a key ecological and economic role in national forest landscapes [12]. The species exhibits high ecological adaptability, strong natural regeneration capacity, and wide distribution across diverse conditions [12,13,14]. Following disturbance, P. densiflora often regenerates abundantly due to high seed inflow and favorable establishment conditions, which can lead to dense regeneration cohorts [15]. Research on P. densiflora has primarily focused on growth responses, stand dynamics, and environmental controls such as climate, site conditions, and competition intensity [16]. These studies consistently demonstrated that stand density and thinning treatments significantly influence tree growth, biomass accumulation, and stand structure development [17]. Despite its ecological and economic importance, empirical evidence remains limited on how regulating residual density through pre-commercial thinning (PCT) influences early stand development and operational feasibility in naturally regenerated stands. Moreover, existing research has largely emphasized biological responses to thinning, while the operational dimensions of density regulation—such as productivity, cost efficiency, and field applicability—have received comparatively limited attention. The interaction between stand growth and operational efficiency under varying residual density conditions, therefore, remains insufficiently quantified, leaving a critical gap for management-oriented decision-making. These gaps highlight the suitability of P. densiflora as a model species for evaluating density regulation within assisted natural regeneration systems.
Assisted natural regeneration (ANR) is a managed form of natural regeneration in which targeted interventions are applied to enhance the success and rate of forest recovery [18]. Rather than replacing natural processes, ANR accelerates natural forest succession by removing barriers to regeneration, such as soil degradation, competition from weedy vegetation, and recurring disturbances [18,19]. By building on inherent regenerative capacity, ANR represents an alternative to conventional planting-based regeneration, particularly in contexts where high establishment costs constrain large-scale planting [5,6,18]. Beyond cost considerations, ANR emphasizes active but low-intensity management that guides regeneration processes, thereby improving early stand establishment, accelerating stand development, and promoting more desirable forest structure [18,20]. As a result, ANR can support ecosystem service provision while offering a practical regeneration strategy.
To address this gap, the objective of this study was to evaluate the effects of PCT intensity on early stand growth and operational performance in naturally regenerated P. densiflora stands. Specifically, we examined growth responses following density regulation that reduced an initial stand density of approximately 30,000 stems ha−1 to target residual densities of 2000, 3000, and 5000 stems ha−1. This study was designed to address the following research questions: (1) How does PCT intensity affect early stand growth in terms of diameter at breast height (DBH), tree height, and crown area? (2) How does residual density influence operational productivity and thinning costs? (3) What trade-offs exist between biological growth performance and operational efficiency across different residual density treatments? Operational productivity and thinning costs were quantified at the time of treatment, while aboveground growth responses were monitored annually over a three-year period following thinning to assess early stand development.

2. Materials and Methods

2.1. Study Area and Pre-Commercial Thinning Methods

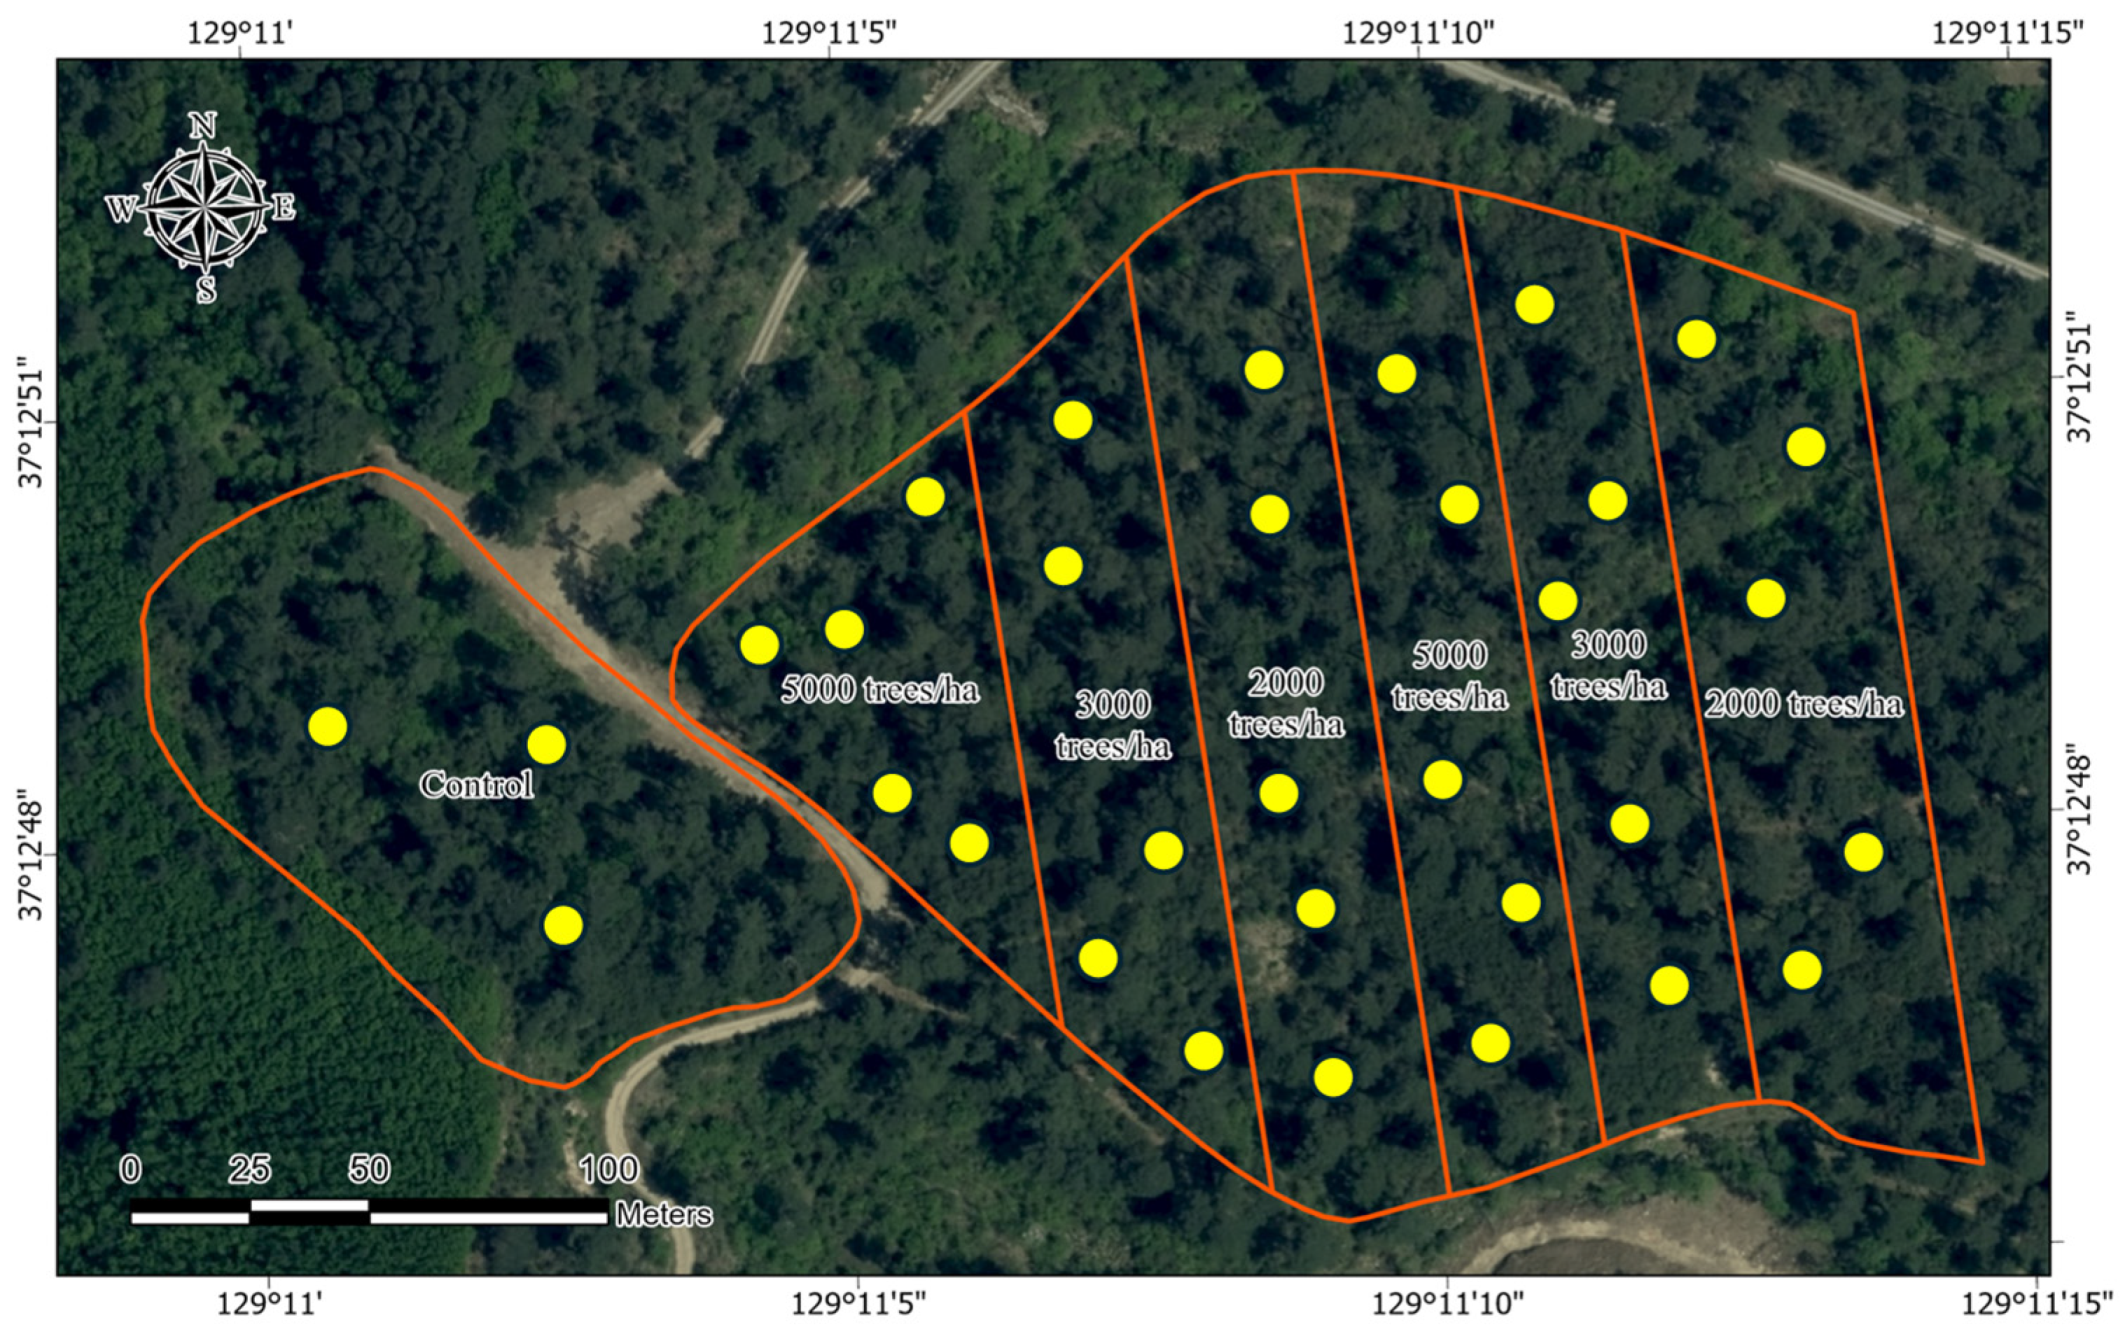
The study site was selected to evaluate the effects of PCT as an assisted natural regeneration practice in a naturally regenerated P. densiflora stand. The site is located in Samcheok-si, Gangwon Province, Korea (Figure 1), and covers a total area of 5.3 ha. The stand was established through natural regeneration following a uniform seed-tree harvesting operation conducted in 2012, in which 65 seed trees ha−1 were retained [21]. As a result, abundant natural regeneration occurred, and by 2021 the stand had developed into a densely stocked condition, with an estimated stem density of approximately 30,000 trees ha−1 (Table 1). To characterize stand structure, a total of 10 sample plots were established across the study area, and within each plot, measurements were collected using a 5 m × 5 m grid. At the time of treatment implementation, the seedlings exhibited a mean root collar diameter of 30.2 mm, a mean DBH of 19.0 mm, and a mean tree height of 255.1 cm. The site is situated at approximately 704 m above sea level, with an average slope of 30% and a northeast-facing aspect. The soil is classified as sandy loam. These site conditions provided a suitable setting to examine growth responses and management implications of PCT as an ANR-based stand management practice in densely stocked naturally regenerated stands.
The stand exhibited an extremely high stem density, with seedlings distributed irregularly rather than at uniform spacing based on field observations, making density regulation particularly challenging. To evaluate the effects of density regulation, PCT was conducted to achieve three target residual densities of 2000, 3000, and 5000 trees ha−1, hereafter referred to as RD2000, RD3000, and RD5000, respectively. Target spacing was determined based on the theoretical relationship between stand density and area per tree (spacing ≈ √(10,000/N), where N is trees ha−1). Accordingly, spacing units of 2.2 × 2.2 m (RD2000), 1.8 × 1.8 m (RD3000), and 1.4 × 1.4 m (RD5000) were applied. These spacing units were used as practical guidelines to approximate the target residual densities in the field rather than to impose strictly uniform spacing. These density levels were selected to represent the stem density prescribed for approximately 10-year-old pine stands under national forest management guidelines ([22]; RD5000), the conventional planting density commonly used in artificial regeneration (RD3000), and the recommended residual stem density at the PCT stage under national forest management guidelines ([23]; RD2000).
PCT was conducted using a selection-based thinning approach, in which individual trees were selectively removed based on their spacing, vigor, and competitive status within the stand. Residual trees were preferentially retained to promote well-distributed and healthy individuals, resulting in an irregular spatial pattern consistent with operational practice. Three residual density treatments (RD2000, RD3000, and RD5000), corresponding to target stand densities of 2000, 3000, and 5000 trees ha−1, respectively, were implemented as described above. These treatments represent different levels of density reduction from the initial stand condition and were used to characterize thinning intensity in this study. Each residual density treatment was applied to ten independent treatment units to ensure replication. Treatment units were established using a random sampling design, with locations randomly assigned across the study area while maintaining comparable site characteristics (e.g., slope, aspect, and initial stand conditions) among treatments to reduce potential spatial bias. Within each treatment unit, stand structure and growth responses were assessed using the plot-based sampling design described in Section 2.2, allowing for consistent comparison among treatments. Thinning operations were conducted in December 2021. Thinning was carried out by a three-person work crew consisting of one operator using a brush saw for felling small trees and two workers responsible for slash handling using chainsaws, reflecting common operational practices in small-scale PCT operations.

2.2. Measurement and Data Collection

Work productivity during PCT was evaluated using a time-and-motion study. Four observation lines were observed for each treatment using the line distance method, and each line corresponded to a treated area of approximately 200 m2. Observation lines were systematically distributed within each treatment unit to capture representative working conditions. A total of 16 observation lines were established for each residual density treatment (RD2000, RD3000, and RD5000), resulting in 48 observation lines across all treatments. The number of observation lines was determined based on preliminary field trials to ensure sufficient data reliability while maintaining operational feasibility. Motor-manual early cutting was performed using a brush saw by an experienced operator with more than 20 years of professional forestry experience, and field data were collected through direct observation using a stopwatch. Working time was recorded continuously during thinning operations and divided into two main work elements: time spent determining working width and selecting residual trees, and time spent clearing and cutting competing trees. The working width and residual trees were determined by the operator based on local stand conditions, and the time required for this decision-making process was recorded separately from cutting time.
Only productive working time was considered in the analysis, and delays and interruptions were excluded. Delays were categorized into three groups: (1) mechanical delays (e.g., breakdowns, saw-chain derailment, and saw-chain replacement), (2) operator delays (e.g., rest, breaks, physiological needs, smoking, and phone calls), and (3) other operational delays (e.g., waiting, machine interference, reconnaissance, refueling, and preparation, [24]). Work productivity was therefore calculated using treated area rather than total stand area. Hourly machine costs for motor-manual thinning operations were estimated using the standard machine rate calculation method described by Miyata [25]. Cost components included machine purchase price, salvage value, economic life, interest and insurance, fuel and lubricant consumption, repair and maintenance costs, labor charges, and utilization rates, which were obtained from the management company (Table 2). All cost parameters were standardized to 2021. While fixed costs (e.g., machine purchase price) were treated as constant, variable costs such as labor and fuel were based on current market values and thus already reflect inflation-adjusted conditions. Hourly machine costs were expressed in USD per productive machine hour (PMH).
Monitoring surveys were conducted annually for three consecutive years following the implementation of PCT. Thirty-three circular sample plots (100 m2 each) were established across the treatment and control stands (Figure 1). Ten plots were assigned to each residual density treatment (RD2000, RD3000, and RD5000), while three plots were established in adjacent unmanaged control stands with similar site conditions. Although the number of control plots was smaller than that of treatment plots, this limitation was considered in the statistical analysis, and results involving the control should be interpreted with caution. All trees within each plot were measured, and the number of sample trees ranged from 22 to 55 per plot. Unmanaged control plots (three plots) were established within adjacent naturally regenerated stands with similar site conditions. Measurements were conducted once per year during the same period (May) to ensure temporal consistency. DBH was measured for all trees using a diameter tape at a fixed height of 1.2 m above ground level. Total tree height was measured using a Haglöf hypsometer. Crown dimensions were measured in the four cardinal directions (north, south, east, and west), and crown area was calculated assuming an elliptical crown projection based on mean crown width.
C r o w n   w i d t h = π × D 1 2 × D 2 2
where D1 and D2 represent the mean crown diameters measured along two perpendicular directions (e.g., north–south and east–west).
In addition, the height to the base of the live crown was recorded for all trees in each survey year.

2.3. Statistical Analysis

All statistical analyses were conducted using R statistical software (version 4.5.2; R Core Team). Prior to hypothesis testing, data distributions were assessed for normality using the Shapiro–Wilk test, and homogeneity of variances was examined using Levene’s test. The results of these tests indicated that most response variables did not meet the assumptions of normality (Shapiro–Wilk test, p < 0.05) and/or homogeneity of variances (Levene’s test, p < 0.05), justifying the use of non-parametric statistical methods. Differences among residual density (thinning) treatments were evaluated using the Kruskal–Wallis rank sum test. When significant treatment effects were detected, post hoc pairwise comparisons were performed using Dunn’s test with Bonferroni adjustment to control for multiple comparisons. This analytical framework was used to assess treatment effects on productivity, DBH, tree height, and crown area over the monitoring period. Statistical significance was set at α = 0.05.

3. Results

3.1. Effects of Thinning Intensity on Productivity and Cost

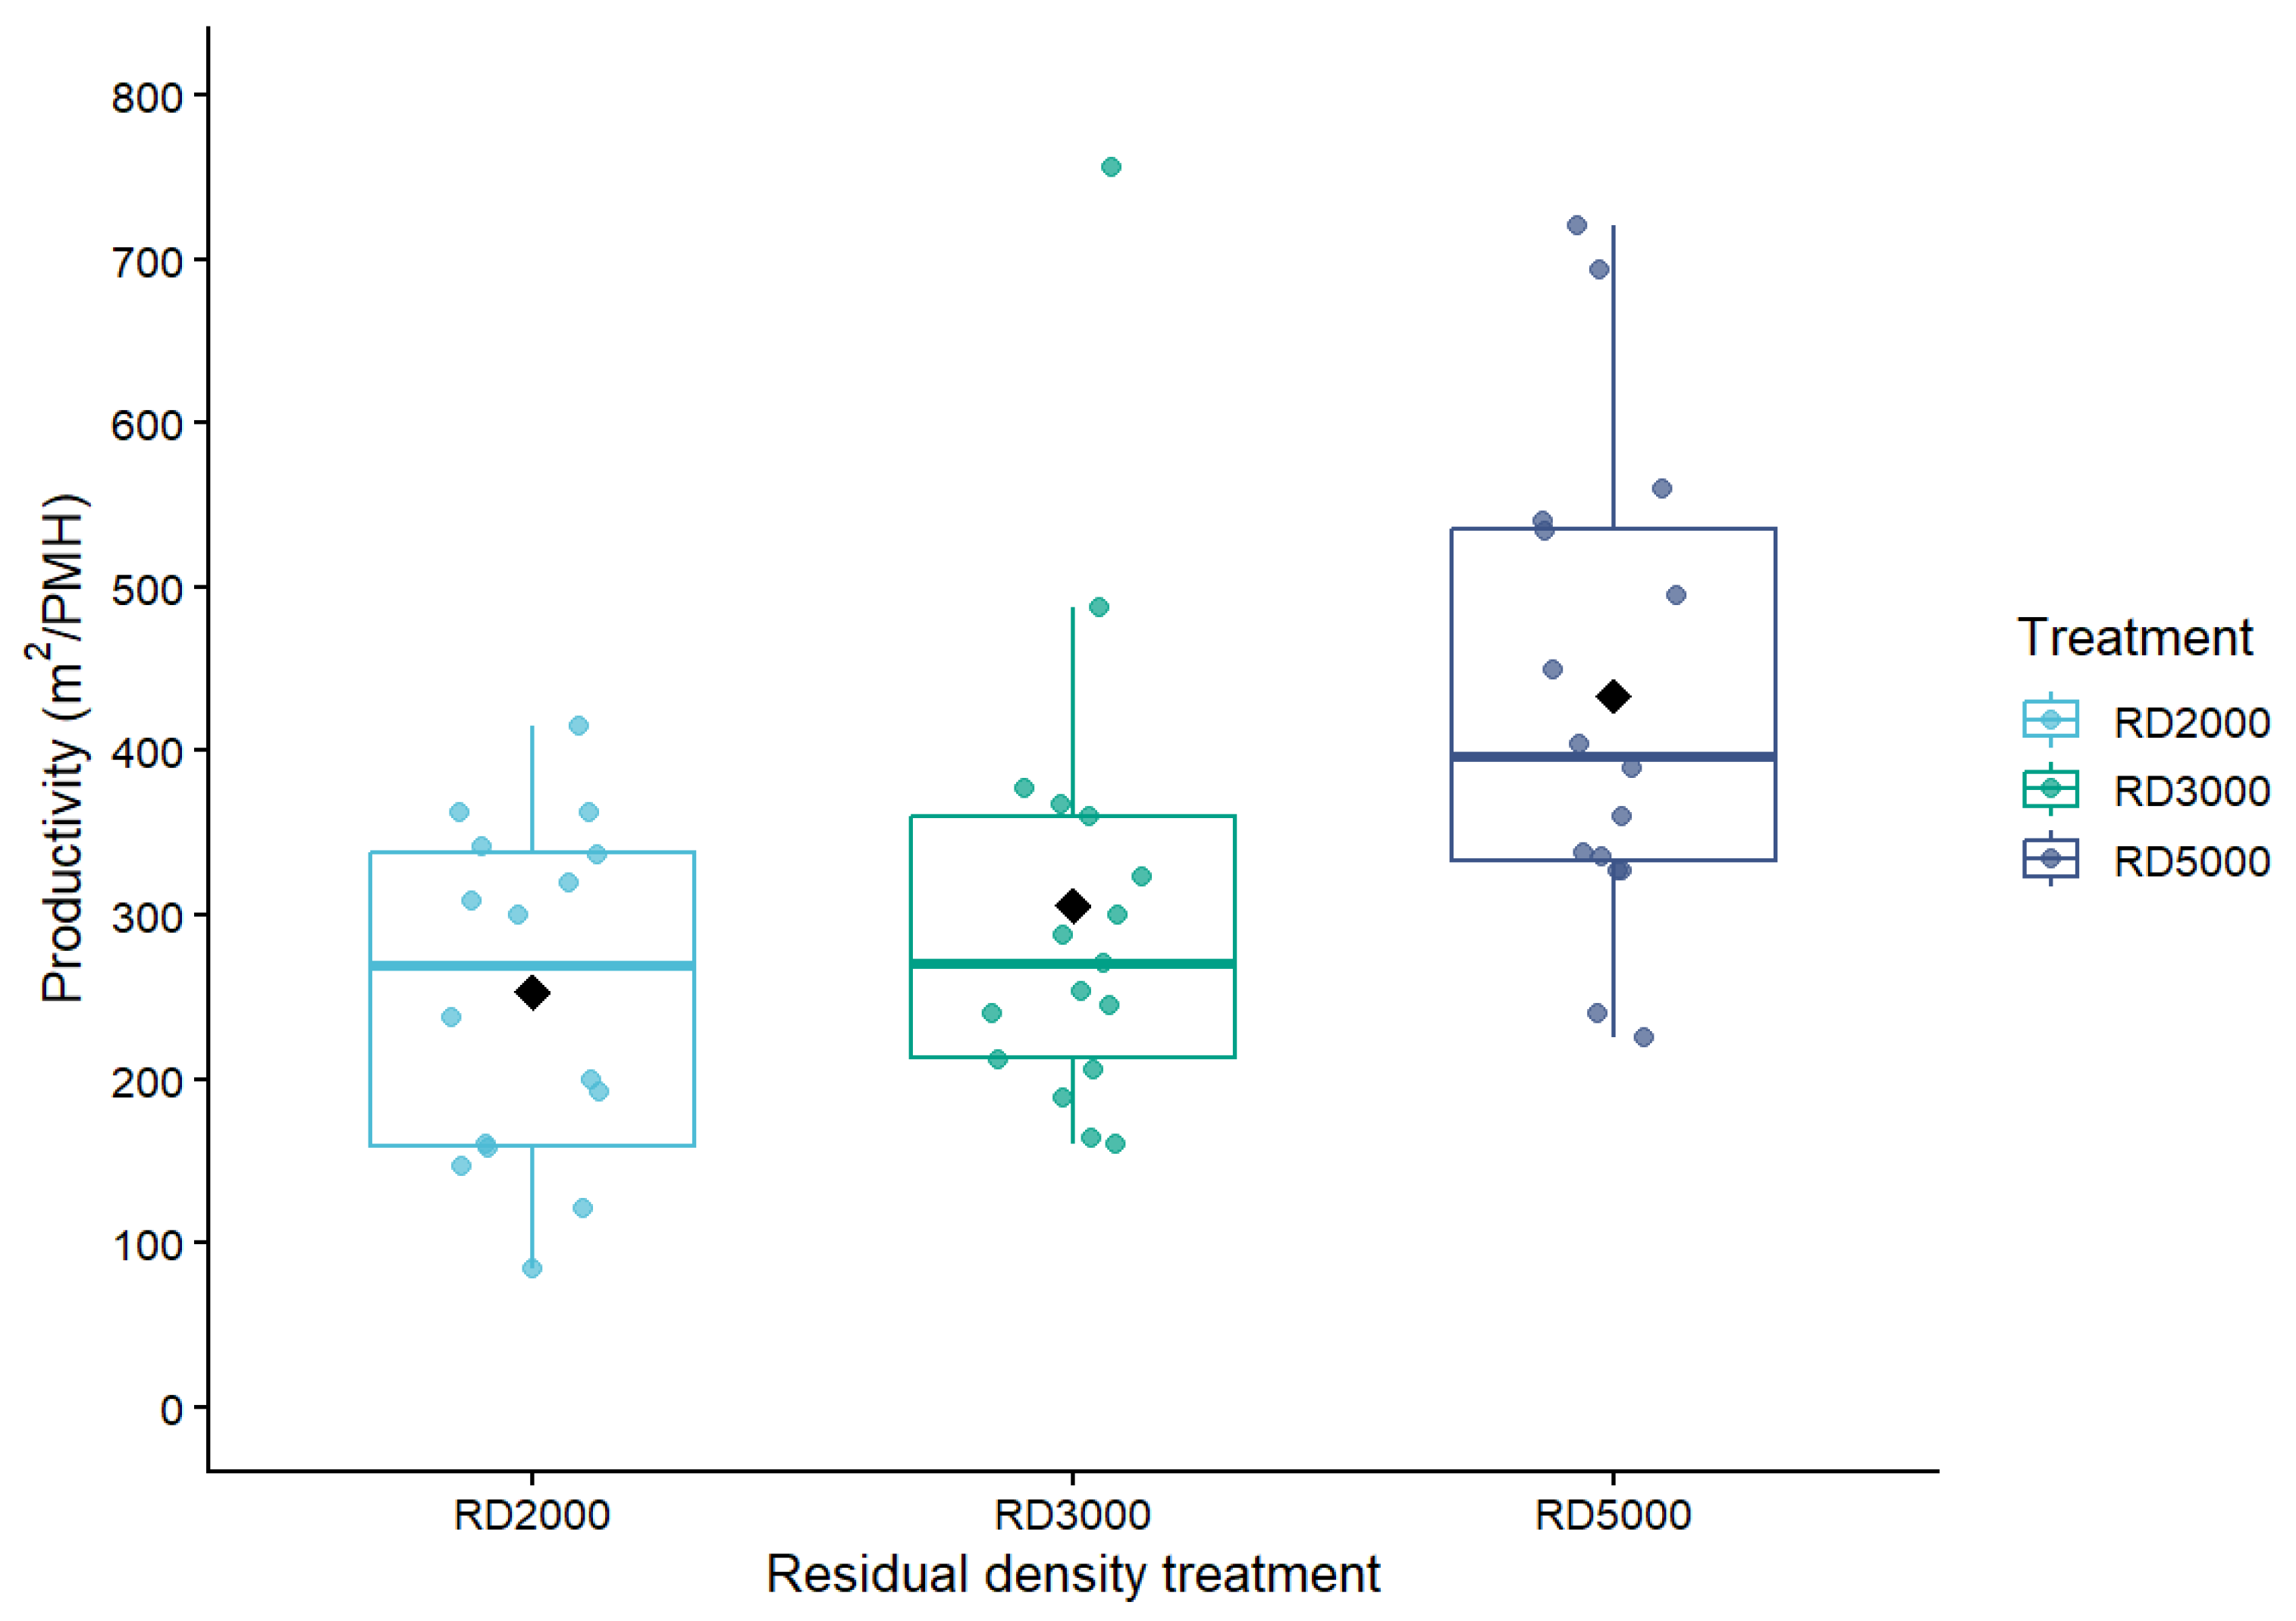
PCT productivity increased with increasing residual stand density (Figure 2). Time-and-motion analysis indicated that mean (±standard error) productivity was 252.9 ± 25.5 m2 PMH−1 in RD2000, 305.7 ± 35.0 m2 PMH−1 in RD3000, and 433.7 ± 36.6 m2 PMH−1 in RD5000. Although productivity tended to increase from RD2000 to RD3000, this difference was not statistically significant (p > 0.05). In contrast, productivity under RD5000 was significantly higher than under both lower residual density treatments (p < 0.05). RD5000 also required a smaller treated area to achieve the target residual density. PCT costs varied among residual density treatments. Total thinning costs were estimated at US$ 20.4 ha−1 for RD2000, US$ 16.7 ha−1 for RD3000, and US$ 11.9 ha−1 for RD5000. Overall, higher residual densities were associated with improved operational efficiency, reflected in both higher productivity and lower thinning costs.

3.2. Effects of Thinning Intensity on Tree Growth

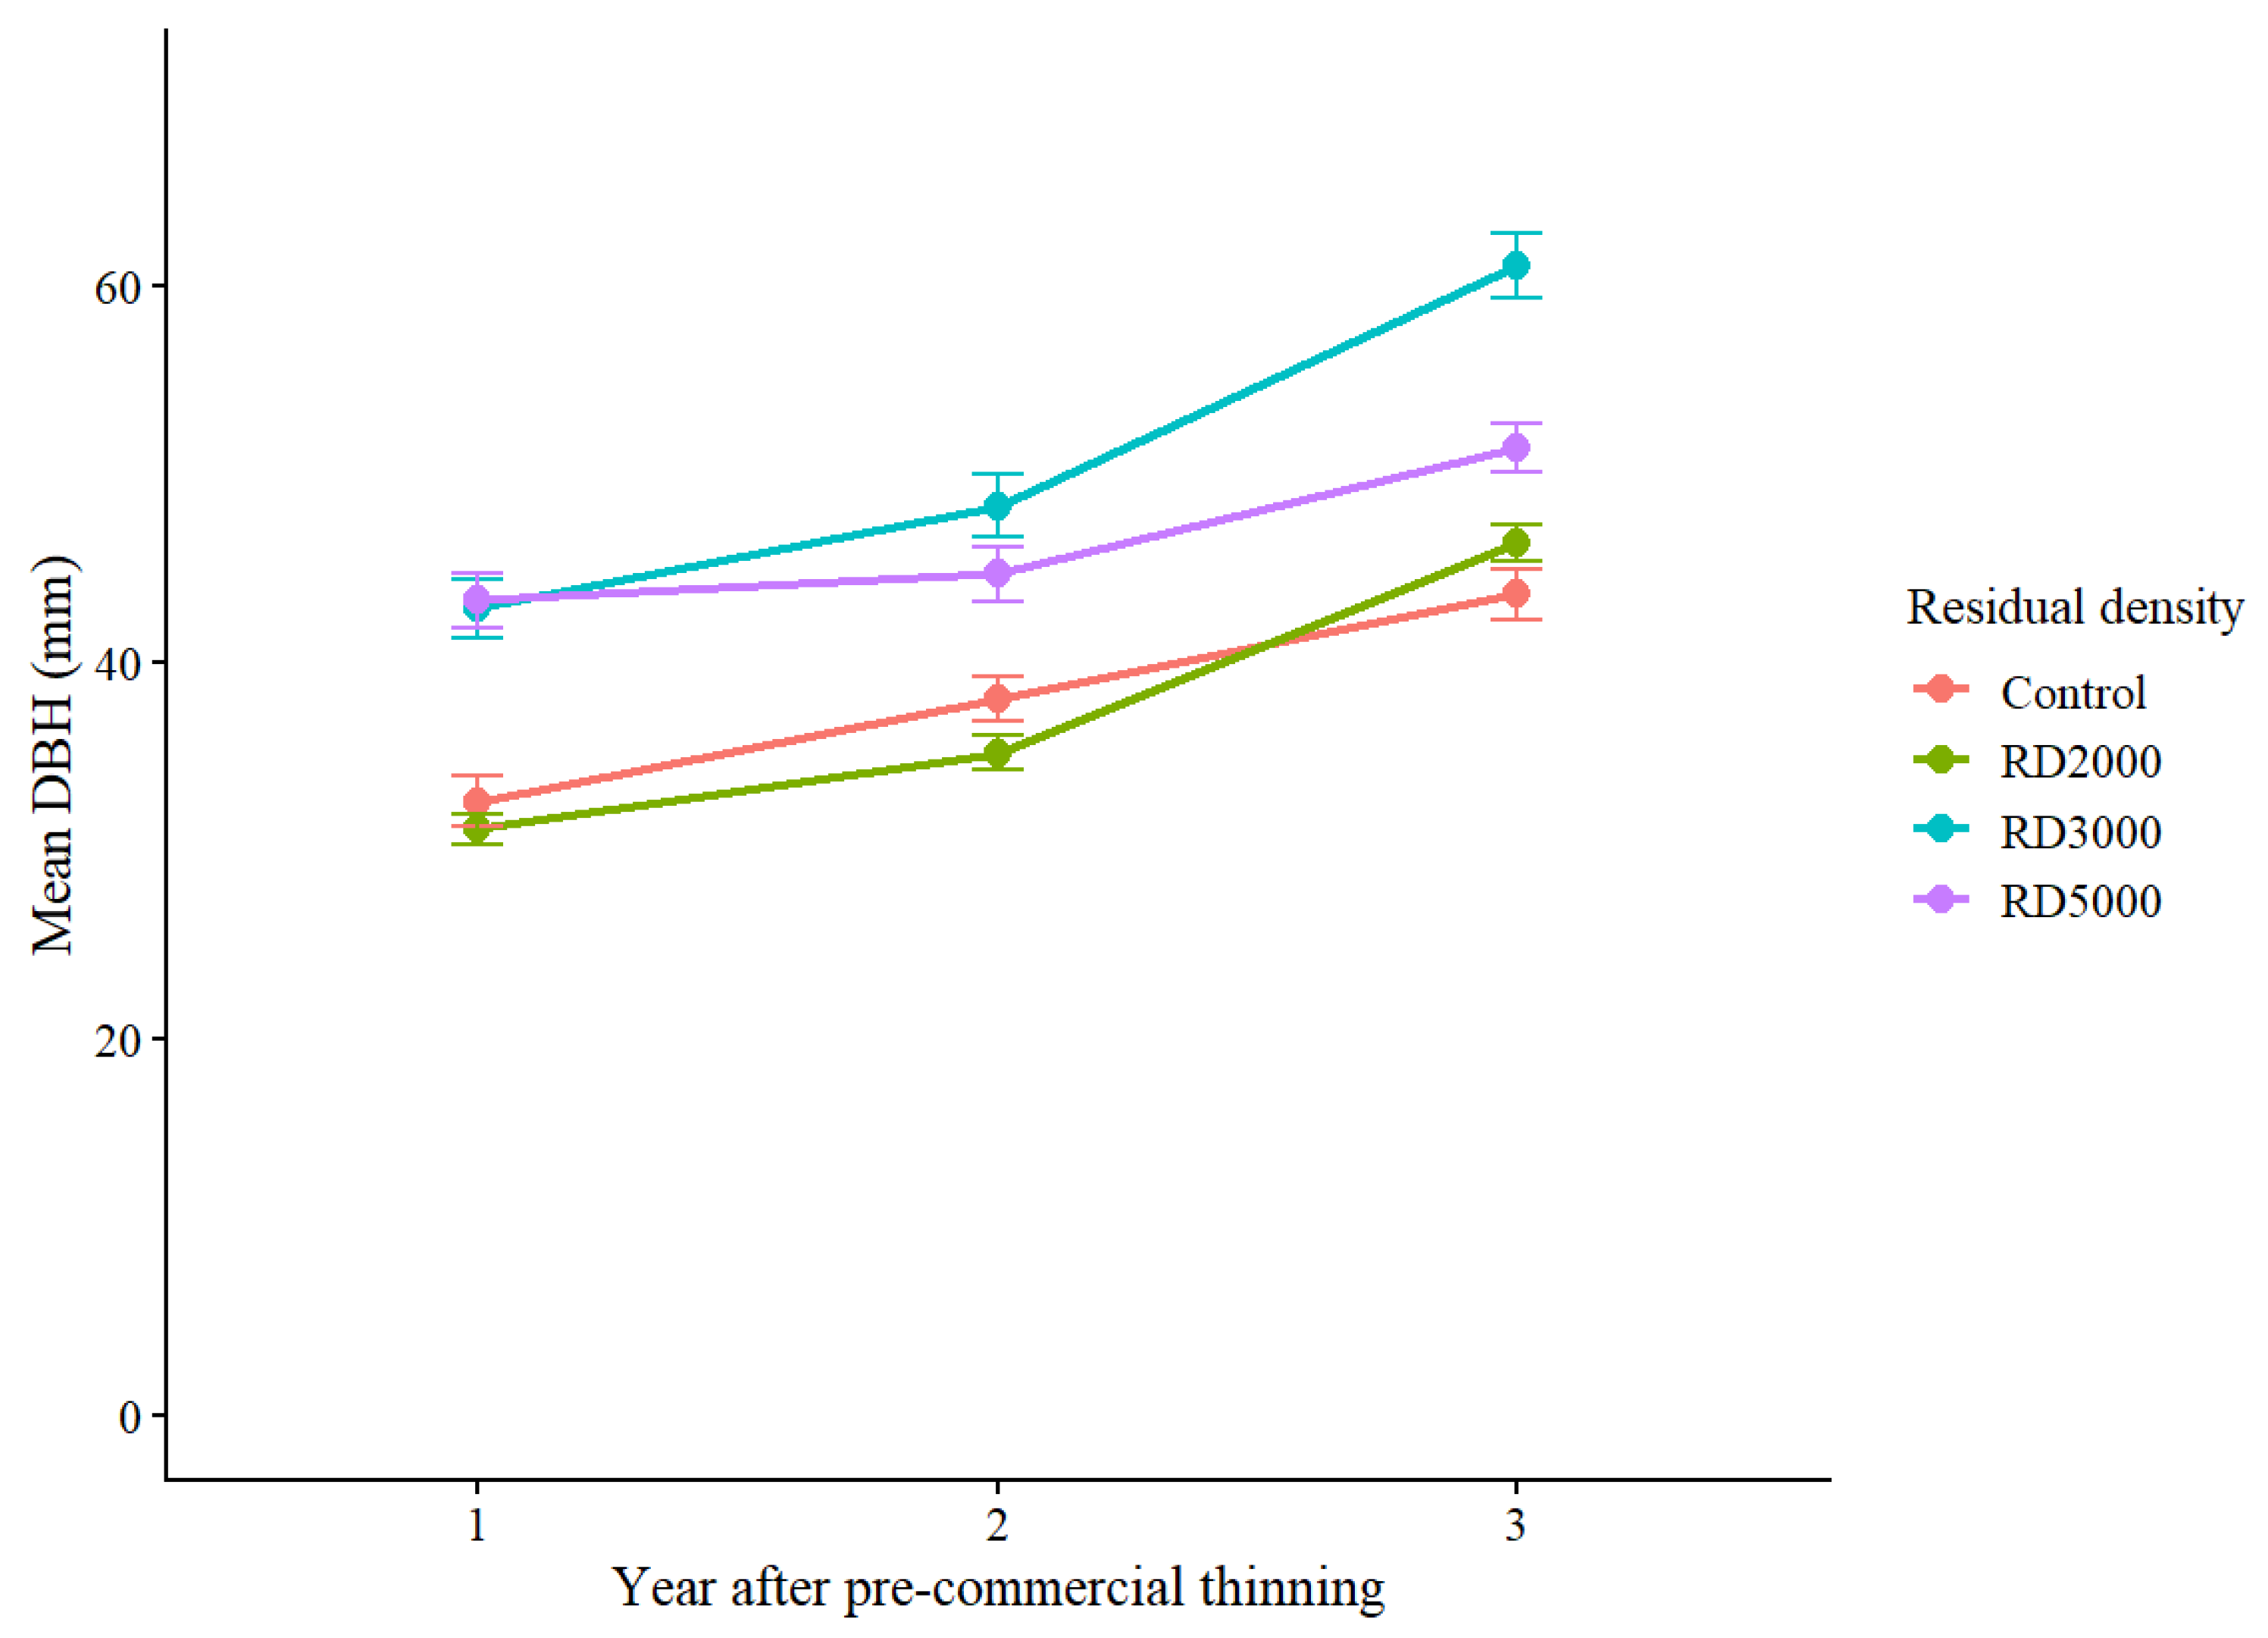
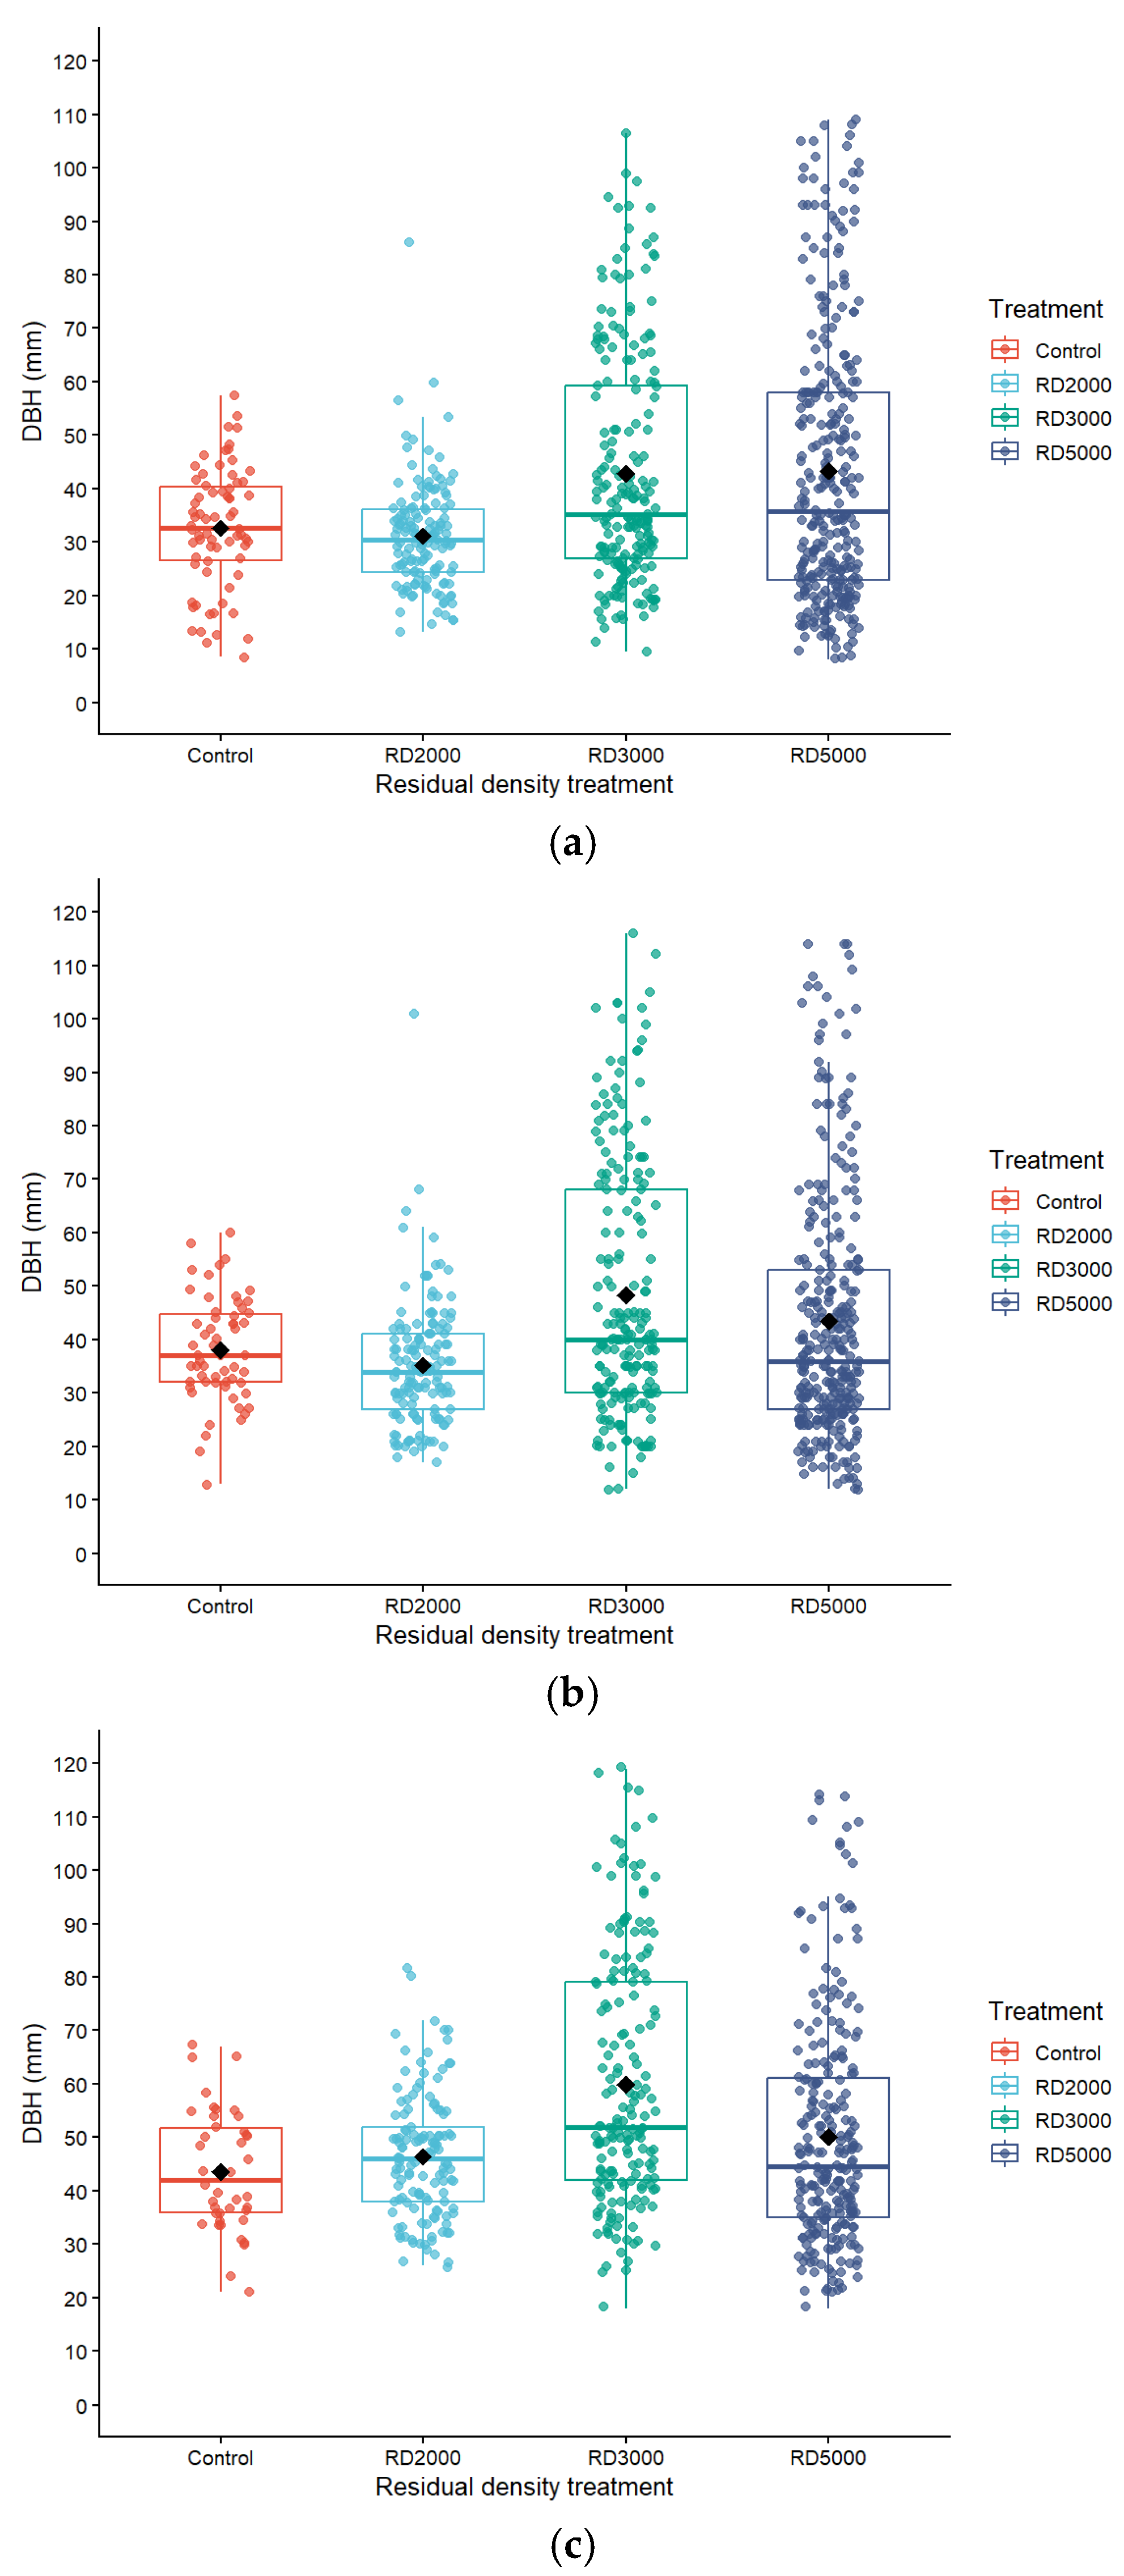
DBH differed significantly among residual density treatments over the three-year monitoring period (Figure 3). Differences between RD3000 and RD5000 became statistically significant by the third year after thinning. In the first year after thinning, post hoc comparisons indicated that mean DBH was significantly greater in RD3000 and RD5000 (approximately 43 mm) than in RD2000 and the control (approximately 31–33 mm; p < 0.001), whereas no significant difference was detected between RD3000 and RD5000 or between RD2000 and the control (Figure 4). In the second year, DBH increased across all treatments, with RD3000 (48.3 ± 1.70 mm) and RD5000 (44.7 ± 1.43 mm) remaining significantly larger than RD2000 (35.2 ± 0.97 mm; p < 0.001), but not differing significantly from each other. By the third year, DBH differences became more pronounced, and RD3000 reached the highest mean DBH (61.1 ± 1.85 mm), significantly exceeding the control (43.6 ± 1.71 mm), RD2000 (46.4 ± 1.02 mm), and RD5000 (51.4 ± 1.44 mm), while no significant difference was observed between RD2000 and the control. Annual DBH increment showed a similar pattern, with RD3000 exhibiting the highest growth rates, followed by RD5000, whereas RD2000 consistently showed the lowest increment.
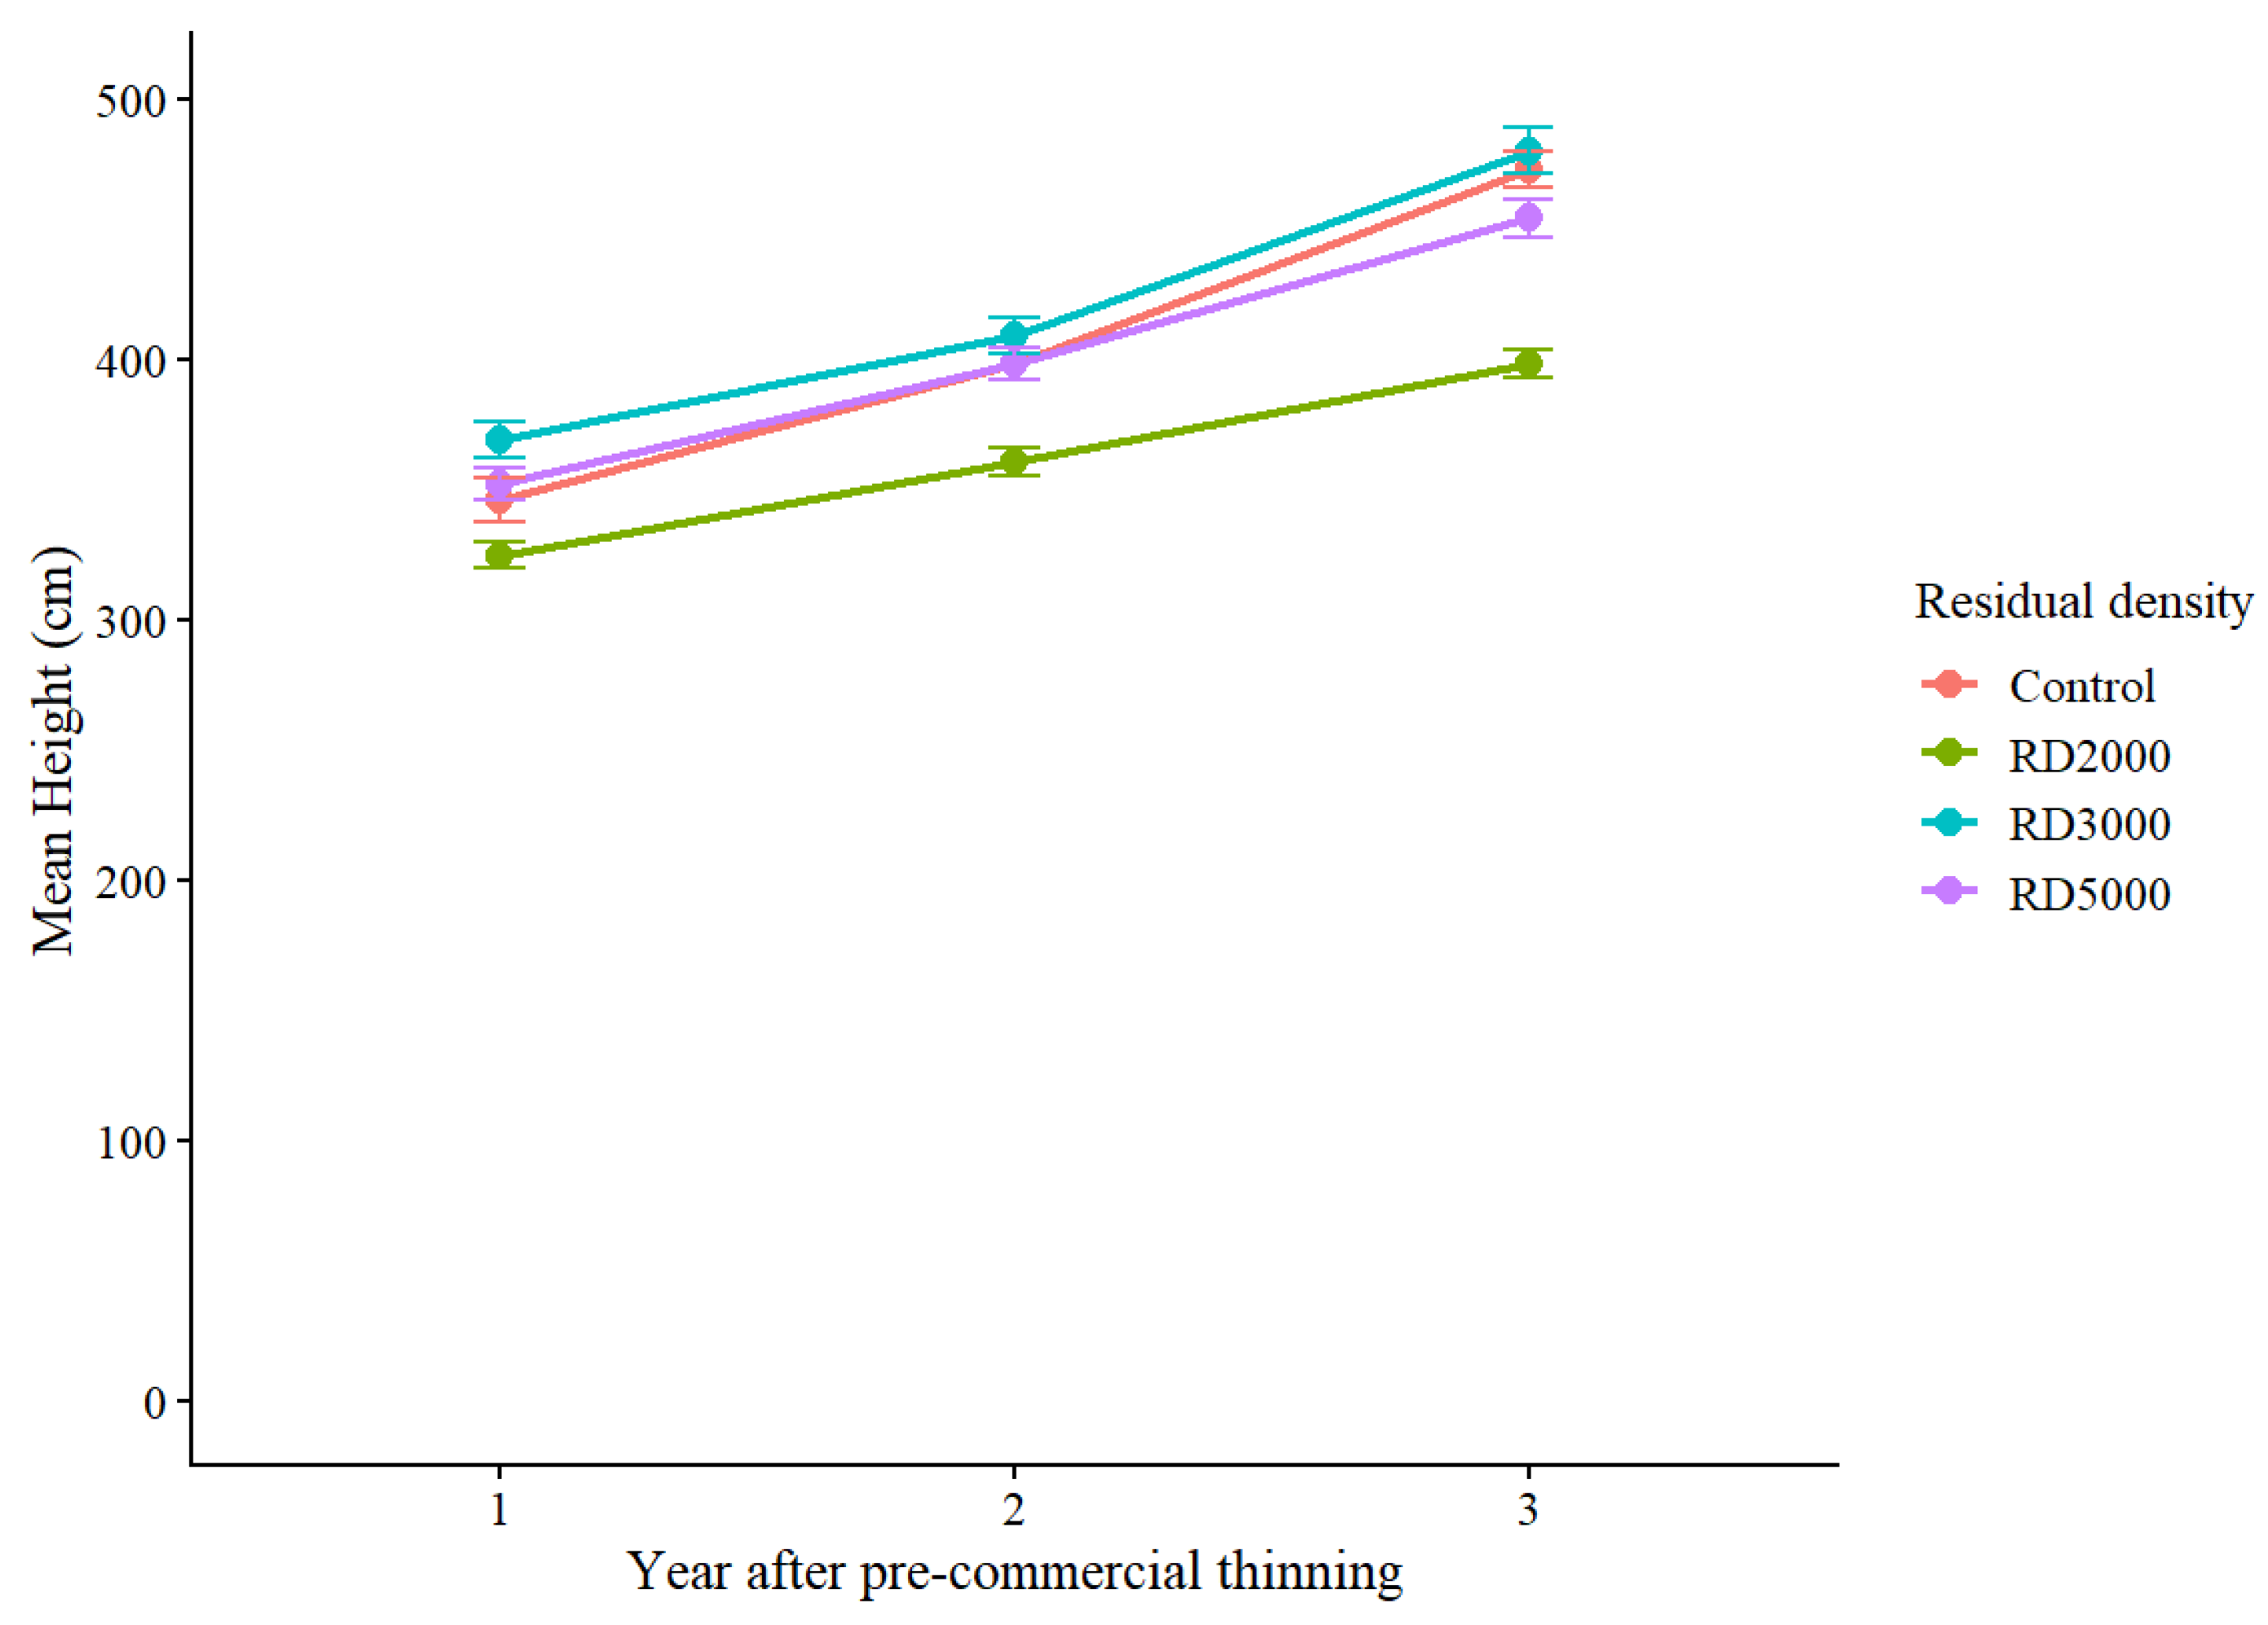
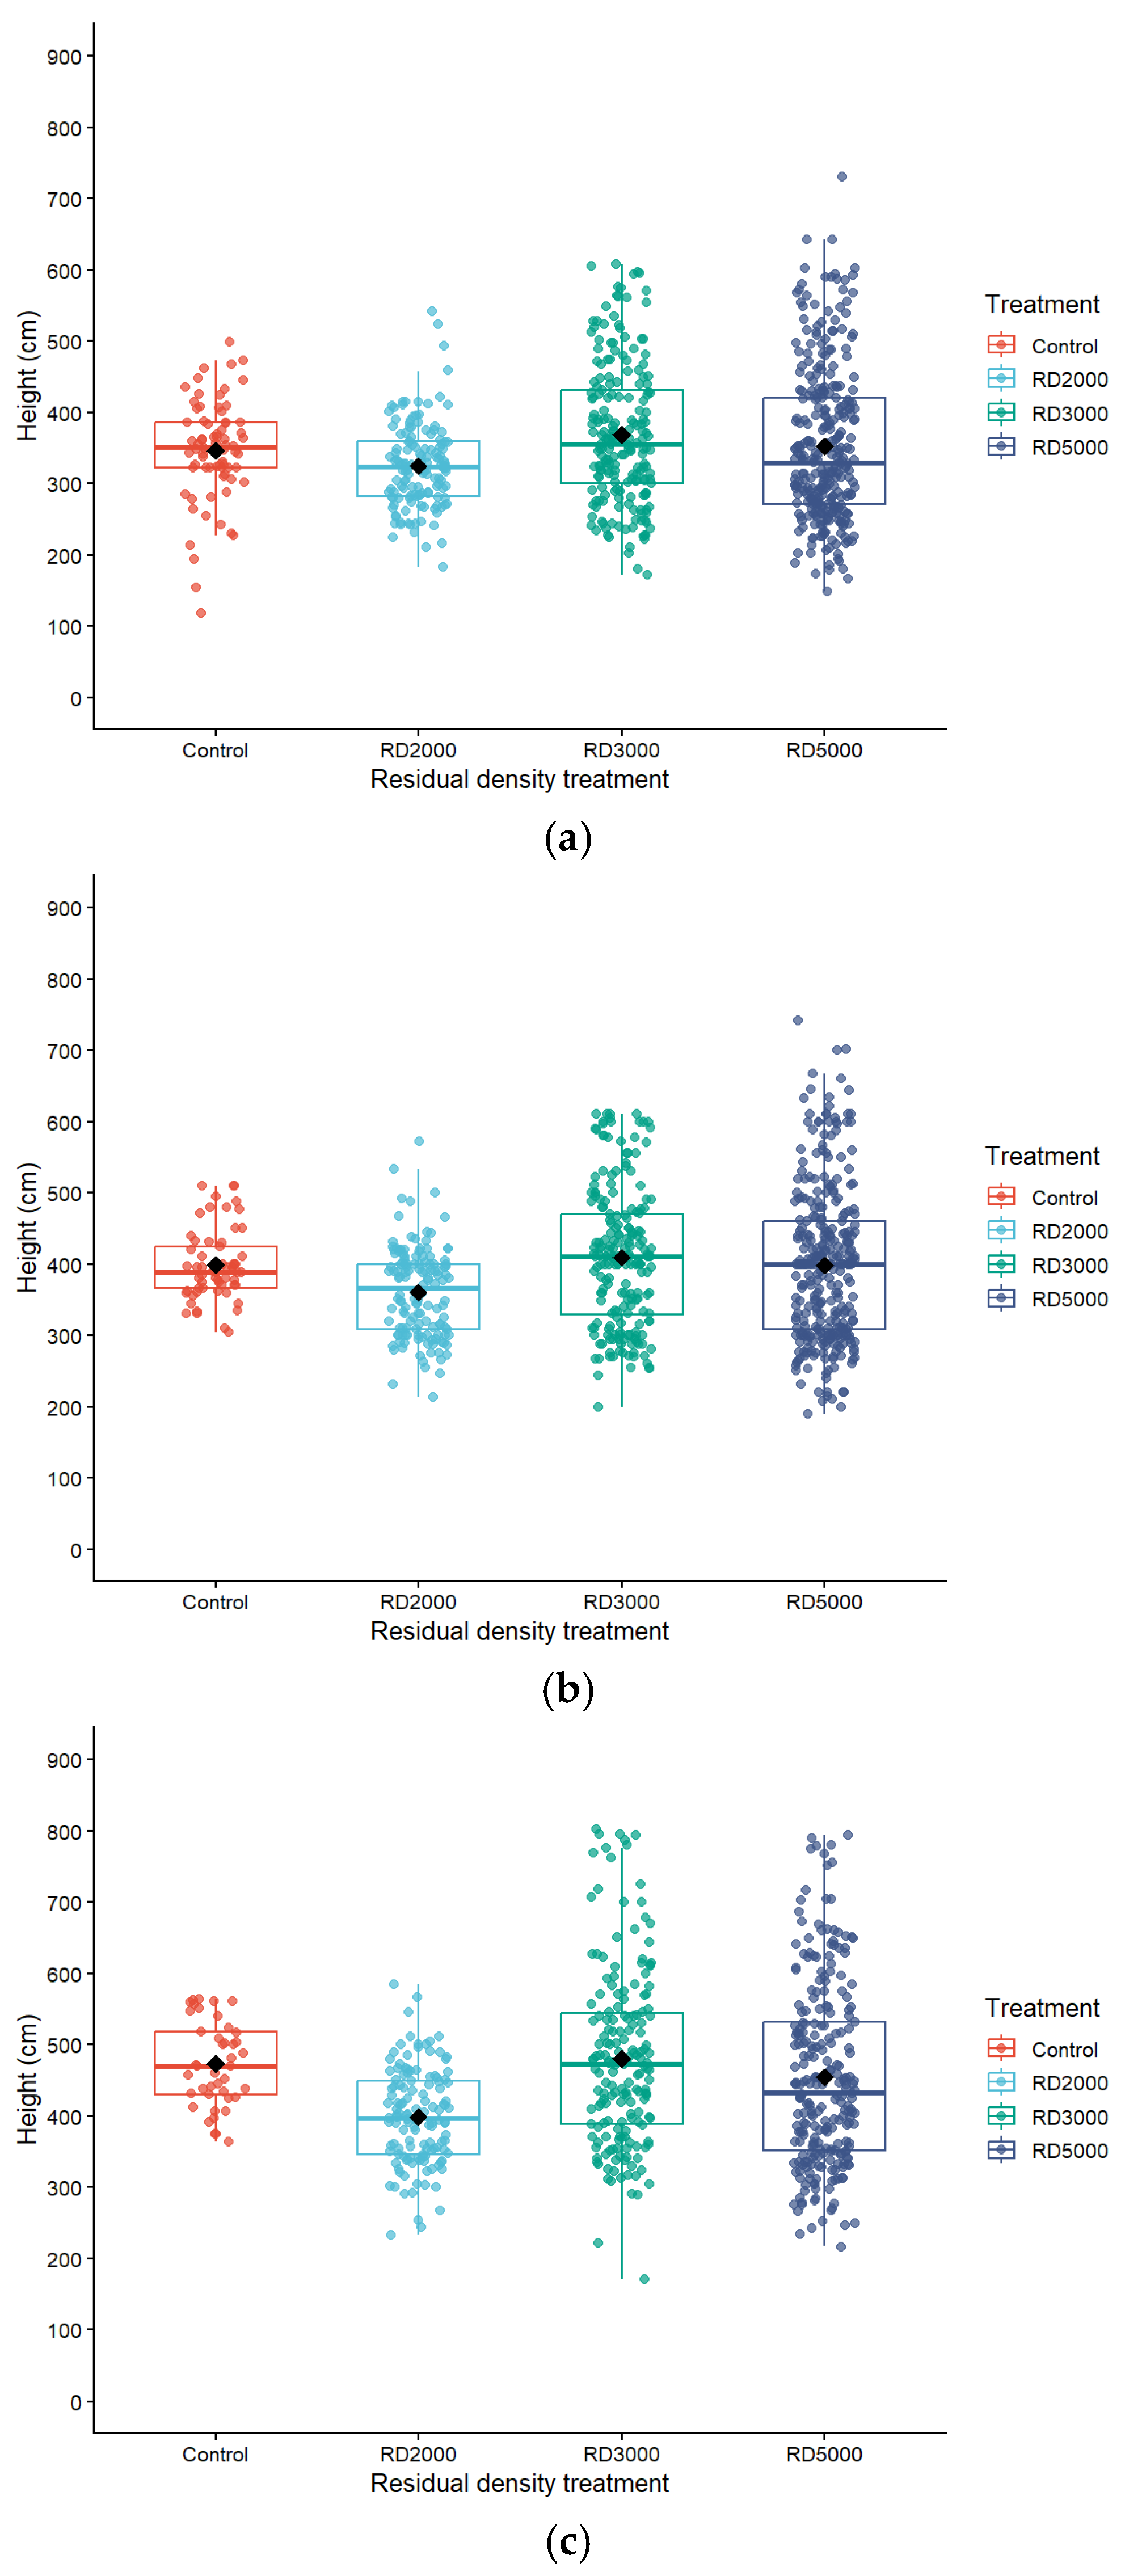
Tree height differed significantly among treatments over time (Figure 5), with year-specific comparisons shown in Figure 6. In the first year after thinning, tree height differed significantly among treatments (p = 0.001; Figure 6), with RD3000 showing greater height than RD2000, whereas no significant differences were detected among the control, RD3000, and RD5000. In the second year, height increased across all treatments (p < 0.001; Figure 6), but RD2000 remained significantly shorter than the control, RD3000, and RD5000, which did not differ from one another. By the third year after thinning, treatment effects on height were evident (p < 0.001; Figure 6), with RD2000 exhibiting significantly lower height than all other treatments, while RD3000 and the control did not differ significantly and RD5000 showed intermediate values. Overall, RD2000 consistently exhibited lower height growth than the other treatments throughout the monitoring period.
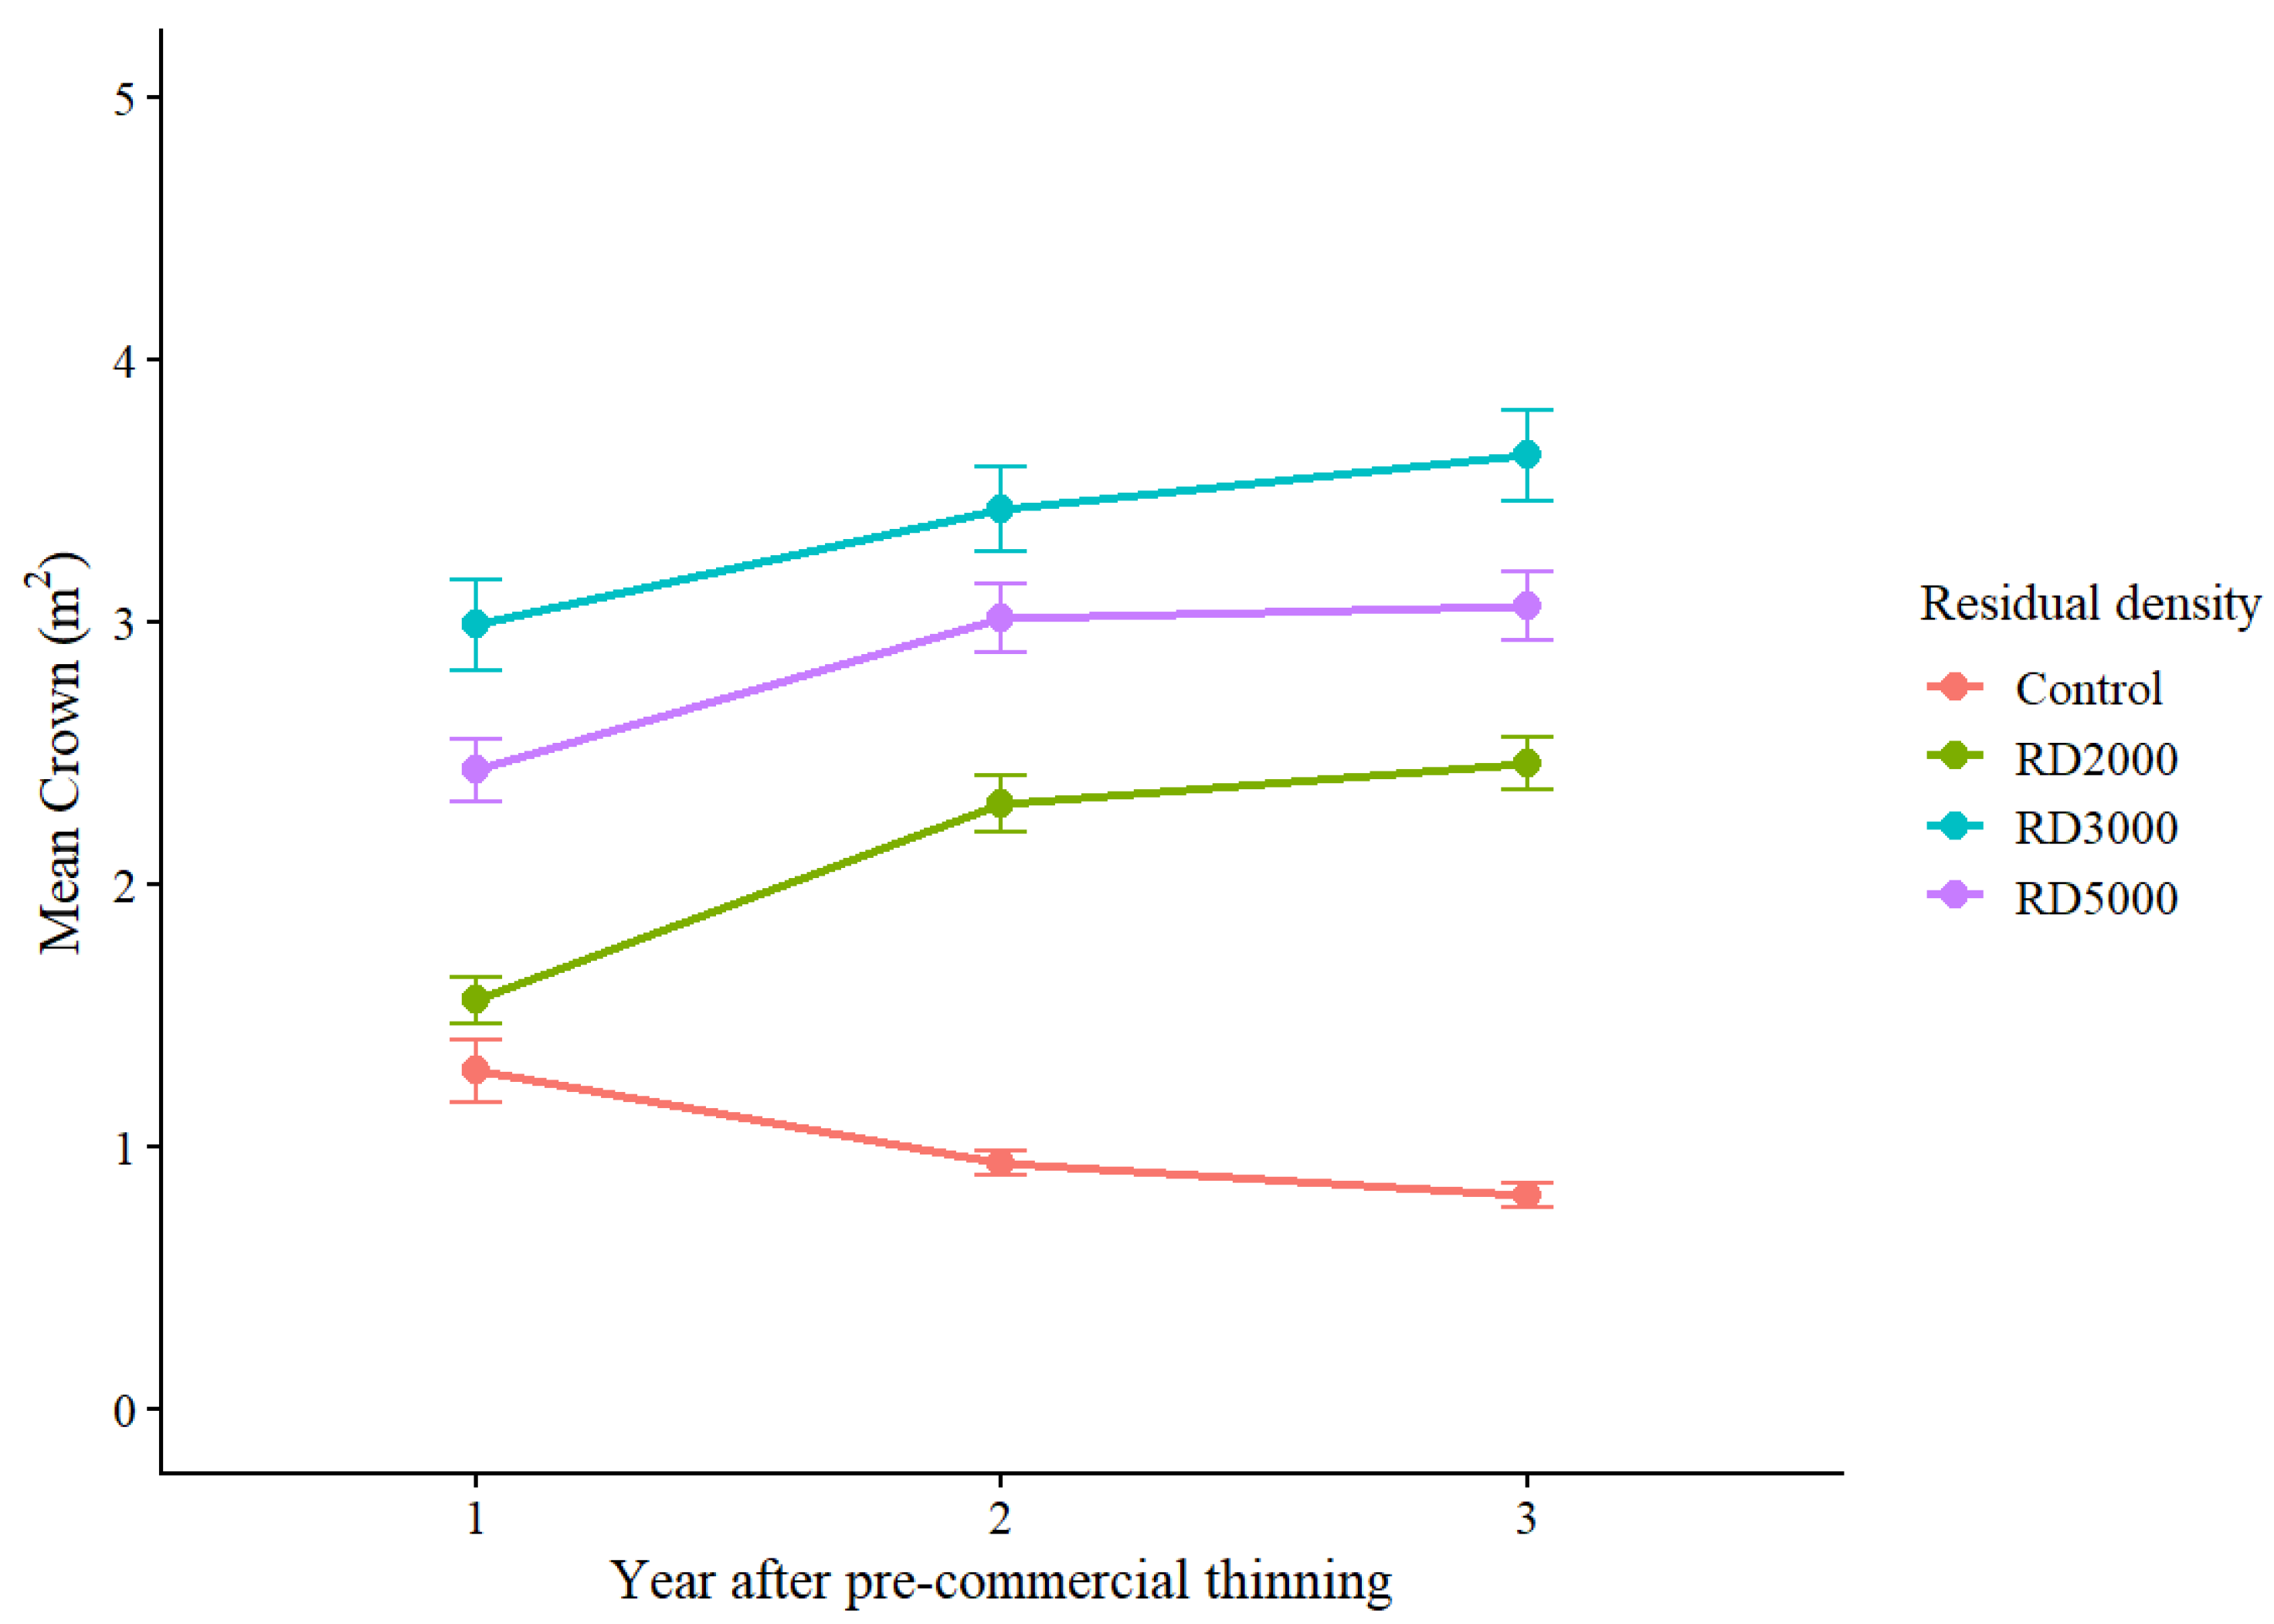
Crown area trajectories differed among residual density treatments following PCT, with crown area declining over time in the control, whereas all thinning treatments increased over the monitoring period (Figure 7). Among the thinning treatments, RD3000 showed the largest increases in crown area over time, followed by RD5000, while RD2000 showed comparatively smaller increases. Overall, crown expansion was greatest under RD3000 and lowest under RD2000, indicating a strong effect of residual density on crown development.
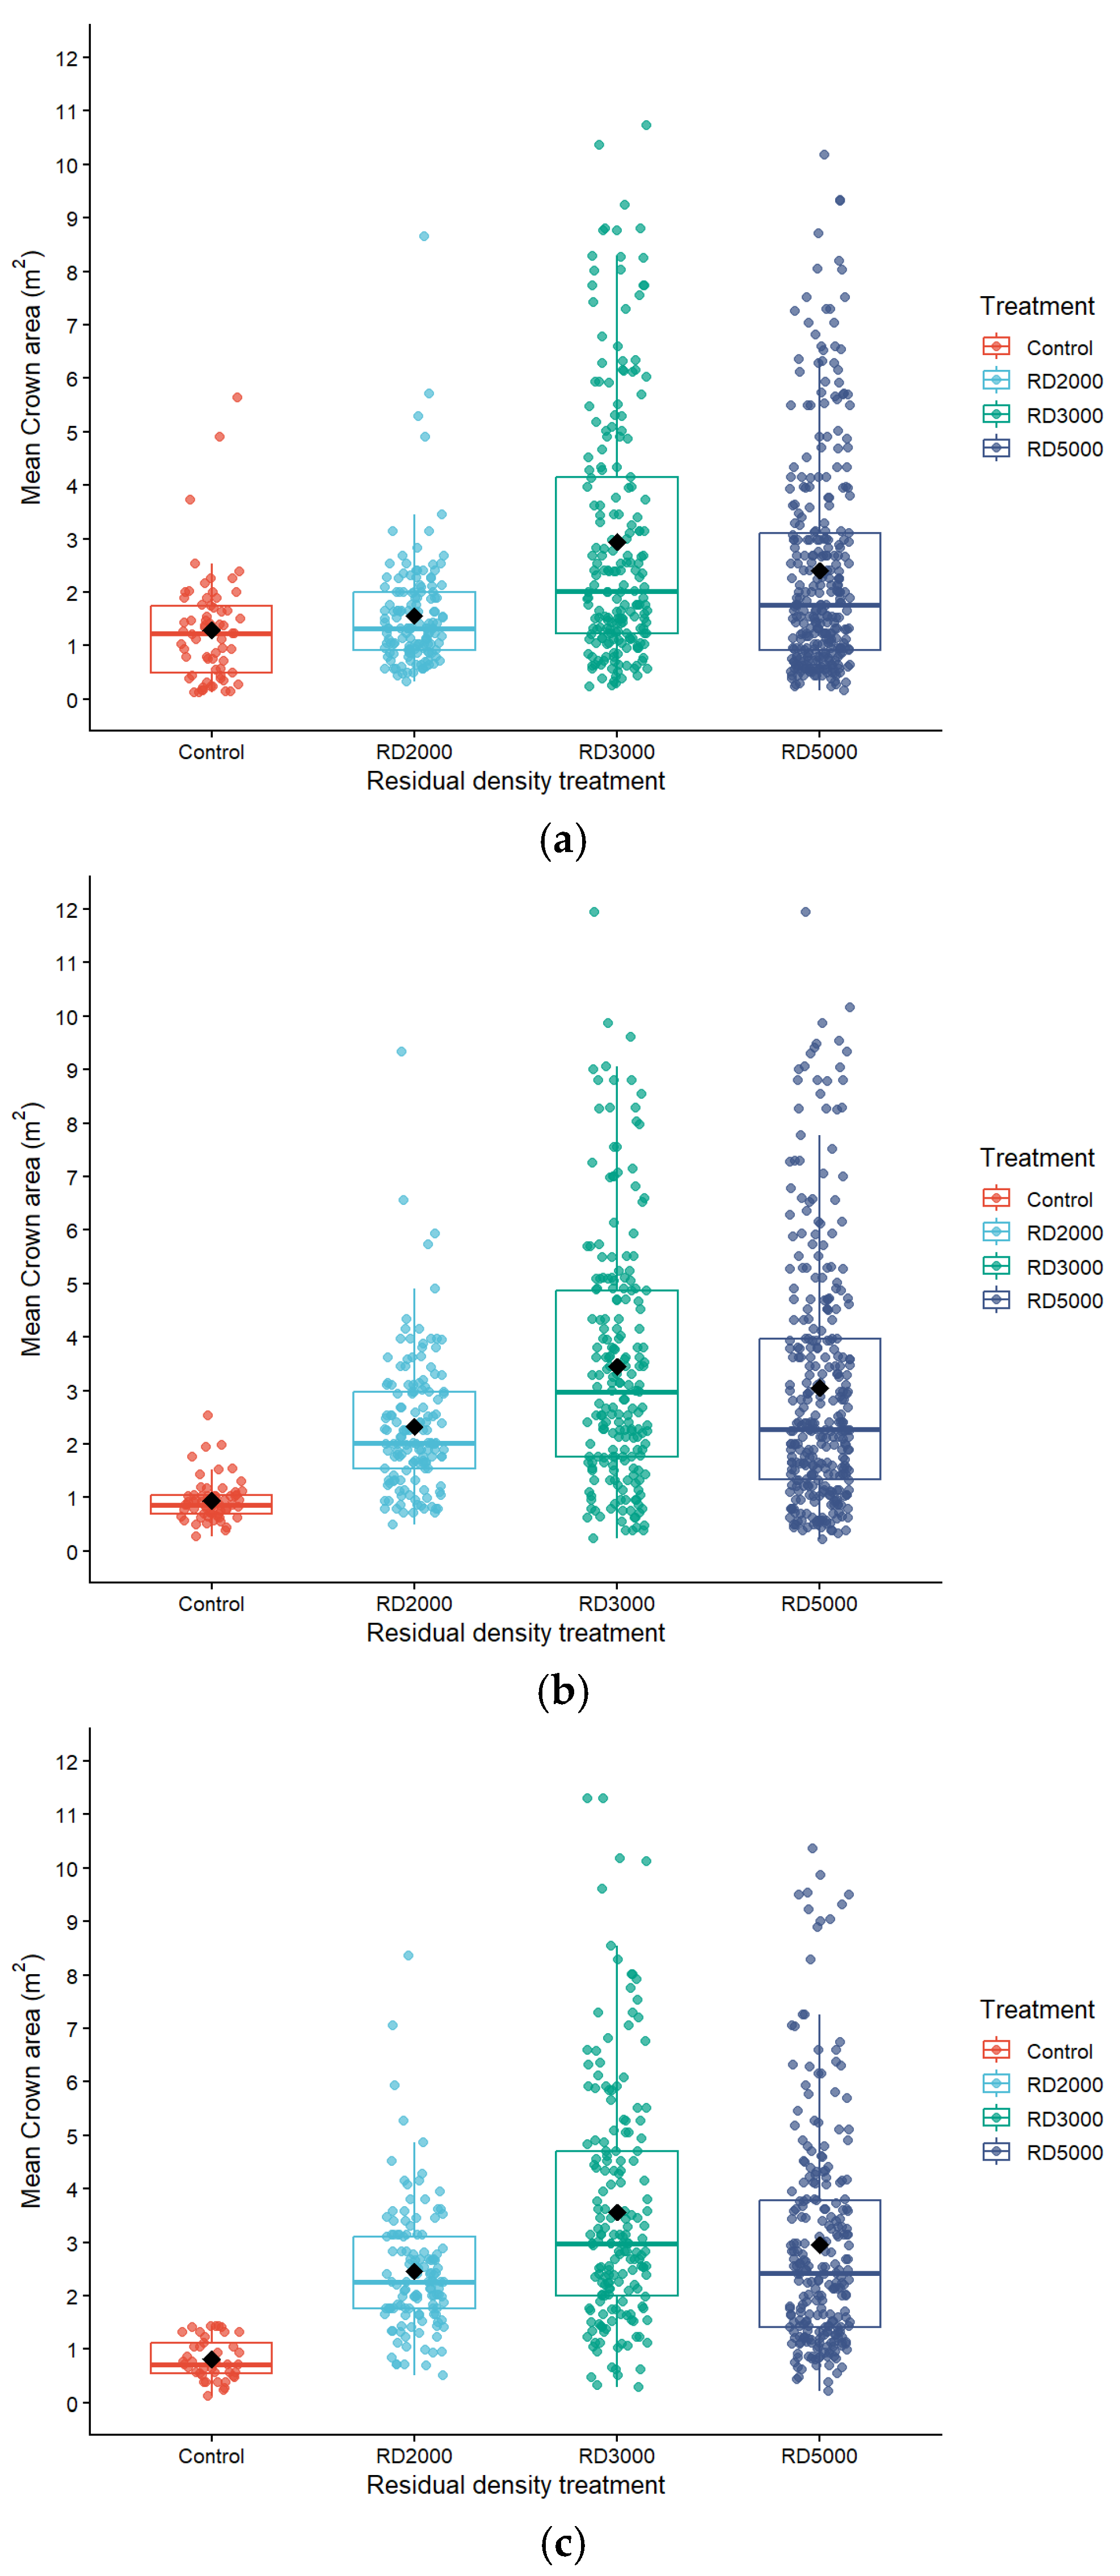
In the first year following PCT, crown area differed significantly among residual density treatments (p < 0.001; Figure 8). Crown area was significantly larger in RD3000 and RD5000 than in the control and RD2000, with RD3000 also exceeding RD5000. In the second year, treatment effects became more pronounced (p < 0.001; Figure 8). All thinning treatments exhibited significantly larger crown area than the control, and RD3000 remained significantly greater than RD2000, while differences between RD3000 and RD5000 were not significant after adjustment. By the third year after thinning, residual density effects on crown area were evident (p < 0.001; Figure 8). All thinning treatments showed significantly greater crown area than the control, with RD3000 exhibiting the largest crown area and remaining significantly greater than both RD2000 and RD5000, whereas RD2000 and RD5000 did not differ significantly from each other.

4. Discussion

Reducing tree density in young, naturally regenerated stands through PCT is widely recognized as a fundamental silvicultural treatment for promoting individual tree growth and preparing stand structure for subsequent commercial thinning. However, the stand-level implications of residual density selection remain insufficiently understood. In particular, limited information exists regarding how thinning intensity influences early stand development and operational performance in high-density naturally regenerated P. densiflora stands.
Operational studies have demonstrated that PCT productivity is strongly influenced by removal intensity and treated area because higher removal intensity increases clearing time and machine movement, thereby reducing overall work efficiency [27,28]. The productivity patterns observed in this study are consistent with these findings. The RD5000 treatment required removal of fewer trees and achieved higher productivity, whereas RD2000 required greater removal intensity and showed lower operational efficiency. These results indicate that thinning productivity is closely linked to operational workload and the proportion of effective working time allocated to cutting and handling activities. Overall, productivity increased as thinning intensity decreased, emphasizing the importance of balancing silvicultural objectives with operational efficiency when selecting residual density targets. In this study, growth responses and operational outcomes differed among residual density treatments. Over the three-year monitoring period, an intermediate residual density (RD3000) was associated with consistently larger values of diameter at breast height, tree height, and crown area than the other treatments. In contrast, the lowest residual density (RD2000) was associated with lower growth, whereas the highest residual density (RD5000) showed intermediate growth responses but achieved the highest operational productivity and lowest thinning costs.
The reduced growth observed under RD2000 can be attributed to excessive density reduction. High-intensity thinning likely induced a thinning shock, whereby abrupt canopy opening temporarily reduces physiological activity in residual trees [29]. In addition, excessive canopy removal may have altered microclimatic conditions by increasing solar radiation and temperature variability, potentially leading to increased moisture stress [30]. Furthermore, the very low residual density in RD2000 may have resulted in reduced site occupancy during early stand development, limiting efficient use of available resources despite reduced competition. In addition, increased exposure following intensive thinning may have promoted the development of competing understory vegetation and increased susceptibility to wind stress, which could further contribute to reduced growth under low residual density conditions. The observation that the control exhibited similar or higher growth than RD2000 further highlights the importance of stand stability and site occupancy. The control maintained a more continuous canopy structure, which likely buffered microclimatic fluctuations and reduced environmental stress. At the same time, higher stand density in the control allowed more efficient utilization of site resources, whereas the reduced density in RD2000 may have led to underutilization of available growing space.
These growth patterns are consistent with established mechanisms of thinning response, where excessively high thinning intensity may suppress growth through environmental stress and reduced site occupancy, while higher residual densities maintain competition that limits growth [31,32,33,34,35]. In this study, RD5000 likely maintained higher competition pressure than RD3000, resulting in moderate growth, whereas RD3000 achieved a more favorable balance between competition reduction and resource utilization. Overall, these findings indicate a clear trade-off between biological growth performance and operational efficiency. Residual densities around 3000 trees ha−1 were associated with stronger growth responses, whereas higher densities (RD5000) improved operational productivity and reduced thinning costs. From a management perspective, intermediate residual densities may be preferable when the objective is to maximize early stand growth, whereas higher residual densities may be selected when operational efficiency is prioritized. The optimal residual density identified in this study (approximately 3000 trees ha−1) is consistent with commonly recommended planting densities in Korean forest management guidelines, suggesting that current prescriptions provide a reasonable balance between growth performance and operational feasibility.
This study has several limitations. It was conducted at a single site, and stand responses may vary under different site conditions and regeneration contexts. The monitoring period was limited to three years, and longer-term responses related to subsequent thinning and stand development may differ from the early patterns observed here. In addition, productivity and cost estimates reflect the specific crew, equipment, and operational conditions during the treatment period. Furthermore, environmental variables such as light availability and soil moisture were not directly measured, and therefore the proposed mechanisms should be interpreted with caution.

5. Conclusions

This study showed that residual density following PCT strongly influences early stand development and operational performance in naturally regenerated P. densiflora stands. An intermediate residual density (RD3000) was associated with the most consistent increases in DBH, tree height, and crown area during the three-year monitoring period. In contrast, RD2000 was associated with reduced growth, whereas RD5000 achieved the highest operational productivity and lowest thinning costs but showed moderate growth responses. These findings indicate that residual density selection is an important factor influencing both stand development and thinning efficiency during early management of high-density naturally regenerated pine stands. They provide practical guidance for selecting residual density targets based on whether early growth performance or operational efficiency is prioritized. However, this study evaluated early responses at a single site over a relatively short monitoring period. Therefore, additional multi-site and long-term studies are needed to determine whether these early growth patterns persist and influence subsequent stand structure and thinning outcomes.

Author Contributions

Conceptualization, E.L., S.C. and S.-T.L.; methodology, E.L., S.C., Y.L. and S.-T.L.; validation, E.L., S.C. and Y.L.; formal analysis, E.L. and S.C.; investigation, E.L., S.C., Y.L. and S.-T.L.; resources, E.L., S.C., Y.L. and S.-T.L.; data curation, E.L., S.C. and Y.L.; writing—original draft preparation, E.L., S.C., Y.L. and S.-T.L.; writing—review and editing, E.L. and S.-T.L.; visualization, E.L. and S.C.; supervision, S.-T.L.; project administration, E.L., S.C. and S.-T.L.; funding acquisition, E.L. and S.-T.L. All authors have read and agreed to the published version of the manuscript.

Funding

This research was supported by the National Institute of Forest Science (Grant No. SC0600-2023-01-2025) and the 2025 Yeungnam University Research Grant.

Data Availability Statement

The raw data supporting the conclusions of this article will be made available by the authors on request.

Conflicts of Interest

The authors declare no conflicts of interest.

References

  1. Kim, M.; Lee, S.; Lee, S.; Yi, K.; Kim, H.-S.; Chung, S.; Chung, J.; Kim, H.S.; Yoon, T.K. Seed Dispersal Models for Natural Regeneration: A Review and Prospects. Forests 2022, 13, 659. [Google Scholar] [CrossRef]
  2. Mejstřík, M.; Svátek, M.; Pollastrini, M.; Šrámek, M.; Matula, R. Differential roles of seed and sprout regeneration in forest diversity and productivity after disturbance. For. Ecosyst. 2024, 11, 100198. [Google Scholar] [CrossRef]
  3. Crouzeilles, R.; Beyer, H.L.; Monteiro, L.M.; Feltran-Barbieri, R.; Pessôa, A.C.M.; Barros, F.S.M.; Lindenmayer, D.B.; Lino, E.D.S.M.; Grelle, C.E.V.; Chazdon, R.L.; et al. Achieving cost-effective landscape-scale forest restoration through targeted natural regeneration. Conserv. Lett. 2020, 13, e12709. [Google Scholar] [CrossRef]
  4. Busch, J.; Bukoski, J.J.; Cook-Patton, S.C.; Griscom, B.; Kaczan, D.; Potts, M.D.; Yi, Y.; Vincent, J.R. Cost-effectiveness of natural forest regeneration and plantations for climate mitigation. Nat. Clim. Change 2024, 14, 996–1002. [Google Scholar] [CrossRef]
  5. Chazdon, R.L.; Guariguata, M.R. Natural regeneration as a tool for large-scale forest restoration in the tropics: Prospects and challenges. Biotropica 2016, 48, 716–730. [Google Scholar] [CrossRef]
  6. Crouzeilles, R.; Ferreira, M.S.; Chazdon, R.L.; Lindenmayer, D.B.; Sansevero, J.B.B.; Monteiro, L.; Iribarrem, A.; Latawiec, A.E.; Strassburg, B.B.N. Ecological restoration success is higher for natural regeneration than for active restoration in tropical forests. Sci. Adv. 2017, 3, e1701345. [Google Scholar] [CrossRef]
  7. Arroyo-Rodríguez, V.; Melo, F.P.L.; Martínez-Ramos, M.; Bongers, F.; Chazdon, R.L.; Meave, J.A.; Norden, N.; Santos, B.A.; Leal, I.R.; Tabarelli, M. Multiple successional pathways in human-modified tropical landscapes: New insights from forest succession, forest fragmentation and landscape ecology research. Biol. Rev. 2017, 92, 326–340. [Google Scholar] [CrossRef] [PubMed]
  8. Korea Forest Service. Available online: https://www.forest.go.kr (accessed on 24 January 2026).
  9. Ministry of Data and Statistics. Available online: https://www.index.go.kr/unity/potal/main/EachDtlPageDetail.do?idx_cd=1304 (accessed on 19 January 2026).
  10. Min, K. Forestry profitability in Korea with evaluating stumpage prices. J. Korean Soc. For. Sci. 2019, 108, 405–417. [Google Scholar] [CrossRef]
  11. You, J.W.; Won, H.K.; Han, H.; Kim, H.S. A comparative analysis of management efficiency between natural regeneration and plantation. Korean J. For. Econ. 2020, 27, 85–91. [Google Scholar]
  12. Choung, Y.; Lee, J.; Cho, S.; Noh, J. Review on the succession process of Pinus densiflora forests in Republic of Korea: Progressive and disturbance-driven succession. J. Ecol. Environ. 2020, 44, 126–142. [Google Scholar] [CrossRef]
  13. Lee, C.S.; Chun, Y.M.; Lee, W.K. Establishment, Regeneration, and Succession of Korean Red Pine (Pinus densiflora S. et Z.) Forestin Korea. In Forest Degradation Around the World; IntechOpen: London, UK, 2018; pp. 47–76. [Google Scholar]
  14. Lee, S.-J.; Shin, D.-B.; Lee, A.-R.; Oh, S.-H. Characteristics of dieback of Pinus densiflora and risk assessment in the Wangpicheon ecosystem and landscape conservation area in Uljin, Republic of Korea. Forests 2023, 14, 903. [Google Scholar] [CrossRef]
  15. Chung, J.; Lee, S.T.; Kim, H.S.; Chung, S.H. Seed Inflow Characteristics of the Korean Red Pine according to Harvest Type in Natural Regeneration Forests. J. Korean Soc. For. Sci. 2023, 112, 331–339. [Google Scholar] [CrossRef]
  16. Shin, J.-S.; Lee, Y.-S.; Kim, E.-S.; Jang, K.; Lee, J.-S.; Seo, J.-W. The effects of Climate on the Death and Growth Decline of Pinus densiflora Siebold & Zucc. using the Annual Ring-Width Time Series. J. Korean Wood Sci. Technol. 2025, 53, 441–453. [Google Scholar] [CrossRef]
  17. Jin, H.; Lee, D.; Choi, J. Stand-level incremental growth model incorporating thinning effects for Pinus densiflora, Pinus koraiensis, and Larix kaempferi plantations in Korea. For. Ecol. Manag. 2026, 613, 123801. [Google Scholar] [CrossRef]
  18. Shono, K.; Cadaweng, E.A.; Durst, P.B. Application of assisted natural regeneration to restore degraded tropical forestlands. Restor. Ecol. 2007, 15, 620–626. [Google Scholar] [CrossRef]
  19. Yang, Y.; Wang, L.; Yang, Z.; Xu, C.; Xie, J.; Chen, G.; Lin, C.; Guo, J.; Liu, X.; Xiong, D.; et al. Large ecosystem service benefits of assisted natural regeneration. J. Geophys. Res. Biogeosci. 2018, 123, 676–687. [Google Scholar] [CrossRef]
  20. Shoo, L.P.; Catterall, C.P. Stimulating natural regeneration of tropical forest on degraded land: Approaches, outcomes, and information gaps. Restor. Ecol. 2013, 21, 670–677. [Google Scholar] [CrossRef]
  21. National Institute of Forest Science. Establishment Techniques for Successive Stands of Pinus densiflora and Larix kaempferi Through Natural Regeneration; Research Report 21-12; National Institute of Forest Science: Seoul, Republic of Korea, 2021; p. 181.
  22. National Institute of Forest Science. Tree Volume Biomass and Stand Yield Tables; Paper No. 979; National Institute of Forest Science: Seoul, Republic of Korea, 2021; p. 373.
  23. National Institute of Forest Science. Standardized Manual of Sustainable Forest Resources Management; National Institute of Forest Science: Seoul, Republic of Korea, 2005; p. 289.
  24. Spinelli, R.; Visser, R. Analyzing and estimating delays in harvester operations. Int. J. For. Eng. 2008, 19, 36–41. [Google Scholar] [CrossRef]
  25. Miyata, E.S. Determining Fixed and Operating Costs of Logging Equipment; General Technical Report NC-55; USDA Forest Service: Washington, DC, USA, 1980; pp. 1–16.
  26. Construction Association of Korea. Available online: https://homenet.kocea.or.kr:1443/home/index.do (accessed on 6 January 2026).
  27. Nova Scotia Department of Natural Resources. The Productivity of a Modified Method of Precommercial Thinning; Forest Research Report No. 52; Nova Publishers: Halifax, NS, Canada, 1994; pp. 1–14.
  28. Routa, J.; Nuutinen, Y.; Asikainen, A. Productivity in mechanizing early tending in spruce seedling stands. Croat. J. For. Eng. 2020, 41, 1–11. [Google Scholar] [CrossRef]
  29. Picchio, R.; Venanzi, R.; Latterini, F.; Marchi, E.; Laschi, A.; Lo Monaco, A. Corsican pine (Pinus laricio Poiret) stand management: Medium and long lasting effects of thinning on biomass growth. Forests 2018, 9, 257. [Google Scholar] [CrossRef]
  30. Ma, S.; Concilio, A.; Oakley, B.; North, M.; Chen, J. Spatial variability in microclimate in a mixed-conifer forest before and after thinning and burning treatments. For. Ecol. Manag. 2010, 259, 904–915. [Google Scholar] [CrossRef]
  31. Gorrod, E.; White, L.; Bedward, M.; Hope, B.; Chu, N.; McAllister, D. Restoration thinning accelerates small tree growth but may slow large tree growth in a multi-age flood-dependent forest. J. Appl. Ecol. 2024, 61, 1560–1572. [Google Scholar] [CrossRef]
  32. Misson, L.; Tang, J.W.; Xu, M.; McKay, M.; Goldstein, A. Influences of recovery from clear-cut, climate variability, and thinning on the carbon balance of a young ponderosa pine plantation. Agric. For. Meteorol. 2005, 130, 207–222. [Google Scholar] [CrossRef]
  33. Park, J.; Kim, T.; Moon, M.; Cho, S.; Ryu, D.; Kim, H.S. Effects of thinning intensities on tree water use, growth, and resultant water use efficiency of 50-year-old Pinus koraiensis forest over four years. For. Ecol. Manag. 2018, 408, 121–128. [Google Scholar] [CrossRef]
  34. Zeide, B. Thinning and growth: A full turnaround. J. For. 2001, 99, 20–25. [Google Scholar] [CrossRef]
  35. Pretzsch, H.; Schütze, G. Transgressive overyielding in mixed compared with pure stands of Norway spruce and European beech in Central Europe: Evidence on stand level and explanation on individual tree level. Eur. J. For. Res. 2009, 128, 183–204. [Google Scholar] [CrossRef]
Figure 1. Summary of the stand’s characteristics and spatial arrangement of the treatment plots and sampling locations. The orange border lines indicate the boundaries of each treatment plot, and the yellow dots represent the sampling locations within the plots.
Forests 17 00593 g001
Figure 2. Productivity (m2 per productive machine hour: m2/PMH) under three residual density treatments (RD2000, RD3000, and RD5000). Boxes represent the interquartile range with median lines, diamonds indicate mean values, and points represent individual observations.
Forests 17 00593 g002
Figure 3. Mean DBH (mm) under three residual density treatments (RD2000, RD3000, and RD5000) during three years after pre-commercial thinning. Error bars represent standard errors.
Forests 17 00593 g003
Figure 4. Distribution of diameter at breast height (DBH) under four residual density treatments (Control, RD2000, RD3000, and RD5000) in the (a) first, (b) second, and (c) third year after pre-commercial thinning. Boxes represent the interquartile range with median lines, diamonds indicate mean values, and points represent individual trees.
Forests 17 00593 g004
Figure 5. Mean height (cm) under three residual density treatments (RD2000, RD3000, and RD5000) during three years after pre-commercial thinning. Error bars represent standard errors.
Forests 17 00593 g005
Figure 6. Distribution of height under four residual density treatments (Control, RD2000, RD3000, and RD5000) in the (a) first, (b) second, and (c) third year after pre-commercial thinning. Boxes represent the interquartile range with median lines, diamonds indicate mean values, and points represent individual trees.
Forests 17 00593 g006
Figure 7. Temporal changes in mean crown area (m2) under four residual density treatments (Control, RD2000, RD3000, and RD5000) over three years following pre-commercial thinning. Points represent mean values, and error bars indicate ± standard error.
Forests 17 00593 g007
Figure 8. Distribution of crown area (m2) under four residual density treatments (Control, RD2000, RD3000, and RD5000) in the (a) first, (b) second, and (c) third year after pre-commercial thinning. Boxes represent the interquartile range with median lines, diamonds indicate mean values, and points represent individual trees.
Forests 17 00593 g008
Table 1. Description of the stand’s characteristics.
ParameterValue
Area (ha)5.3
Stem density (trees ha−1)30,057
Mean root collar diameter (mm)30.2 ± 15.3
Mean diameter at breast height (mm)19.0 ± 9.8
Mean tree height (cm)255.1 ± 63.2
Basal area (m2 ha−1)10.8 ± 7.3
Table 2. Cost elements and hourly machine costs for each piece of equipment.
ElementBrush CutterChain Saw
Purchase price (USD)340310
Salvage value (%)1010
Economic life (year)44
Interest and insurance (%)1717
Fuel cost (USD/liter)22
Lube and oil, percent of fuel cost (% of fuel cost)1095
Repair and maintenance (% of depreciation)8080
Operator wages (USD/day) a171171
Benefit rate (% of operator wage)2020
Utilization rate (%)8080
a The data provided by the Construction Association of Korea [26].
Disclaimer/Publisher’s Note: The statements, opinions and data contained in all publications are solely those of the individual author(s) and contributor(s) and not of MDPI and/or the editor(s). MDPI and/or the editor(s) disclaim responsibility for any injury to people or property resulting from any ideas, methods, instructions or products referred to in the content.