Article

Phenotypic Variation and Selection of Prototype Plus Trees in Autochthonous Silver Fir from the Tisovik Relict Population: Evidence from a Conservation Plantation in the Białowieża Forest

1
Faculty of Civil Engineering and Environmental Sciences, Institute of Forest Sciences, Bialystok University of Technology, Wiejska 45E, 15-351 Bialystok, Poland
2
Department of Forestry and Forest Ecology, University of Warmia and Mazury, Pl. Łódzki 2, 10-727 Olsztyn, Poland
*
Author to whom correspondence should be addressed.
Forests 2026, 17(5), 572; https://doi.org/10.3390/f17050572
Submission received: 31 March 2026 / Revised: 29 April 2026 / Accepted: 4 May 2026 / Published: 8 May 2026
(This article belongs to the Special Issue Sustainable and Suitable Ecological Management of Forest Plantation)

Abstract

This study assessed phenotypic variation among open-pollinated half-sib families from a single relict population. Autochthonous silver fir (Abies alba Mill.) preserved in the Tisovik Reserve of Białowieża Forest represents the northeasternmost isolated relict population of the species in Europe. To secure its genetic resources and evaluate its breeding potential, a conservation plantation of open-pollinated half-sib families was established in the Hajnówka Forest District outside the natural species range. This study assessed the effects of half-sib family affiliation on the growth and phenotypic performance of almost two thousand 28–31-year-old trees representing 20 half-sib families and compared them with age-matched managed stands in the State Forests of Poland. Significant within- and among-family variation was observed for diameter at breast height (DBH) and height (H), while environmental factors had only marginal influence under the uniform site conditions of the plantation. Several half-sib families produced disproportionately high numbers of individuals with exceptional phenotypic performance, including DBH values exceeding 25 cm and height values surpassing those of managed stands. Based on a combined assessment of qualitative traits, selection differential, and 95th percentile values, 30 prototype plus trees were selected as sources of scions for establishing a future seed orchard. The outstanding growth parameters of these individuals correspond to stand ages of 40–65 years according to yield tables, despite their biological age of only 28–31 years. The results confirm the high breeding value and substantial genetic variability of the Tisovik population and demonstrate its potential for producing genetically diverse planting material adapted to lowland sites under changing climatic conditions.

1. Introduction

In the Tisovik Reserve, located in the Belarusian part of the Białowieża Forest, there exists the northeasternmost isolated relict population of Abies alba Mill. within the species’ natural range in Europe. Currently, only 20 trees have survived there, although historically the population numbered several hundred individuals [1]. A half-sib conservation plantation of this population was established in the 1990s in the Hajnówka Forest District on the initiative of Professor A.F. Korczyk. The term half-sib refers to generative offspring produced through open pollination of a single maternal tree [2], which in our case concerns 20 trees.
The purpose of establishing this plantation was twofold: the active conservation of the genetic resources of the autochthonous A. alba, which is currently listed in the Red Data Book of Belarus [3]; and the assessment of its breeding value. This, in turn, aims to provide a foundation for the development of a future seed base and the production of highly valuable silvicultural planting material adapted to the environmental conditions of the northeastern Polish Lowland [4,5,6].
Some authors indicate that the minimum number of maternal trees required for establishing a seed plantation is 25 [7]. According to the guidelines [8], the minimum number for A. alba should be 30. We assumed that, in order to maintain genetic diversity while simultaneously ensuring sufficient economic gain from future stands, the number of prototype plus trees should be set at 30 individuals.
The term “prototype plus tree” requires clarification. The authors are aware that the examined trees are less than half the standard age required for plus trees (80 years in the case of silver fir) [8,9]. Thus, they are not yet at an age that allows for a fully relevant assessment of phenotypic and productive traits. However, it should be emphasized that measurements of their parameters conducted in 2018 and 2023 showed virtually unchanged rankings of leading individuals (prototype plus trees), despite intense intraspecific competition—particularly strong due to the high stand density and the current growth phase (pole stage). Therefore, the concept of prototype plus trees was adopted, enabling the advancement of seed production from a prototype seed orchard by at least 50 years. This is of great importance in the context of rapidly changing climatic conditions [10].
The limited phenotypic studies conducted on the conservation plantation (focusing on needle morphology and anatomy) indicate substantial variation both within and among the half-sib families (lines) [1]. However, no studies examining basic quantitative traits (DBH and H) have been carried out by other authors to date [11]. In comparison with our previous study, all families in all three plots were studied, with additional measurements of the H of several hundred trees, and not just the nine best specimens.
Based on the above, a methodological algorithm was adopted for the experiment, conducted within the framework of classical selection: the picking of the 20 best trees (according to qualitative traits, DBH, and H) from each half-sib family, along with the additional identification of 10 individuals belonging to the phenotypically superior half-sib families. The selected trees will subsequently serve as a source of biological material (scions) for grafting in the establishment of a prototype seed orchard.
In this study, all plant material originates from a single relict population (Tisovik). Therefore, the analytical and comparative units are open-pollinated maternal half-sib families, and the term ‘provenance’ is used exclusively to denote the population of origin, not experimental units.
The main objective of this study was to assess the effects of half-sib family affiliation on silvicultural traits and, on this basis, to identify the most productive half-sib families from which 10 prototype plus trees were to be selected. Under the conditions of a relatively small plantation area (0.66 ha) with uniform characteristics and randomized family placement, differences in silvicultural parameters are consistent with differentiation among half-sib families and may reflect underlying genetic variation, although environmental and stand-structural effects cannot be fully excluded. Given the unequal family representation and age differences among plots, the results should be interpreted as phenotypic patterns rather than direct estimates of genetic effects. However, as follows from the results of our previous studies [11], the spatial structure of tree distribution is also significant, but in the case of families with a significant number of trees, randomly clustered across the area of the plots, the influence of this factor is approximated. We also compared the quantitative traits of silver fir from the conservation plantation originating from the Tisovik Reserve with analogous parameters of stands of similar age growing in managed forests of the State Forests.

2. Materials and Methods

2.1. Object of the Study

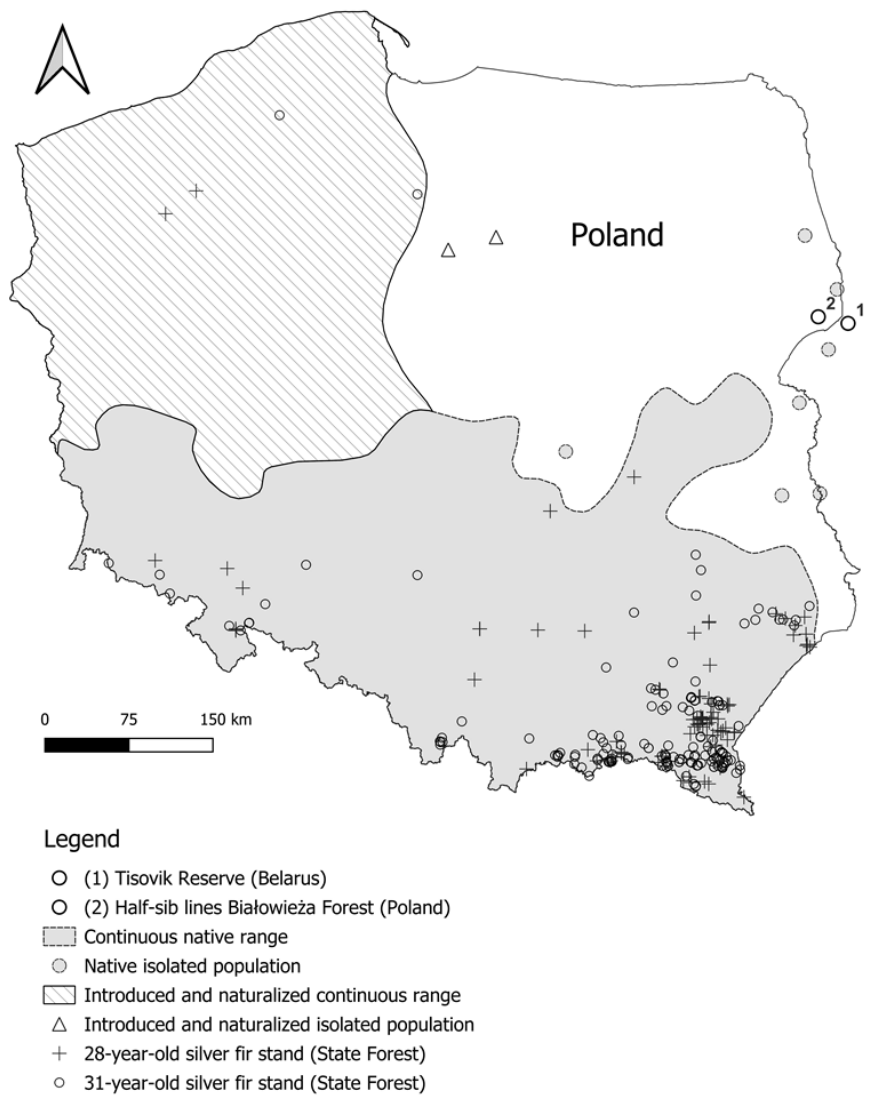
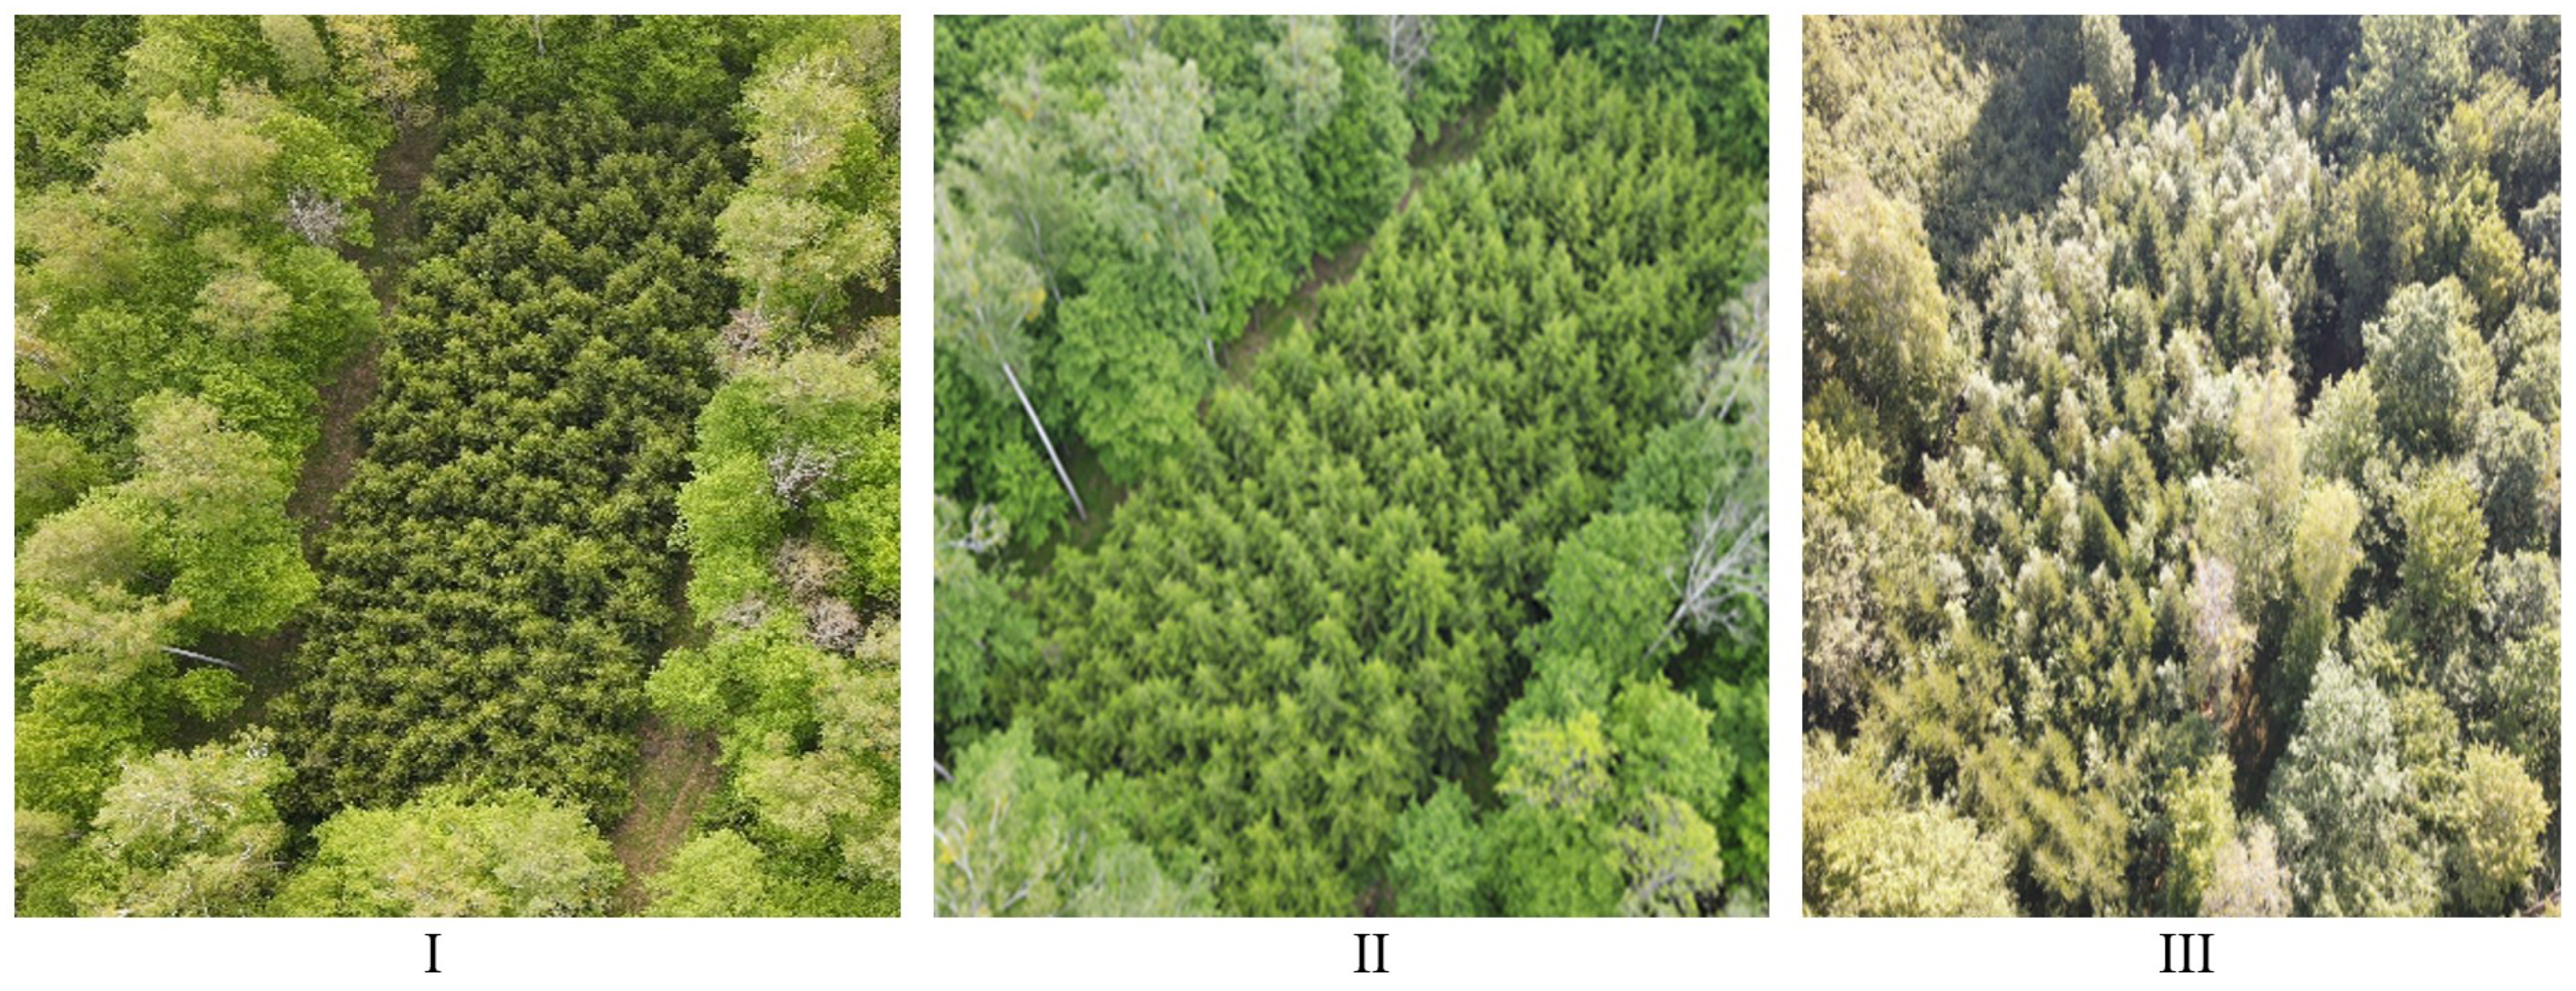
The conservation plantation is located in the eastern part of Poland (Figure 1), outside the natural range of the species, at an elevation of 173–177 m. It consists of three rectangular plots of 28.5 × 77.5 m (Figure 2), each covering an area of 0.22 ha, situated in compartments 416Ag and 416Cf of the Hajnówka Forest District, on a fresh mixed coniferous forest site. In 1996, 4-year-old seedlings were planted on Plot I: 1551 individuals representing 11 half-sib families. In 1998, 3-year-old seedlings were planted on Plot II: 1166 individuals representing 20 half-sib families; and on Plot III: 1279 individuals representing 17 half-sib families. The planting material originated from open-pollinated seeds collected from 20 trees in the Tisovik Reserve and was planted at a spacing of 1.3 × 1.0 m.
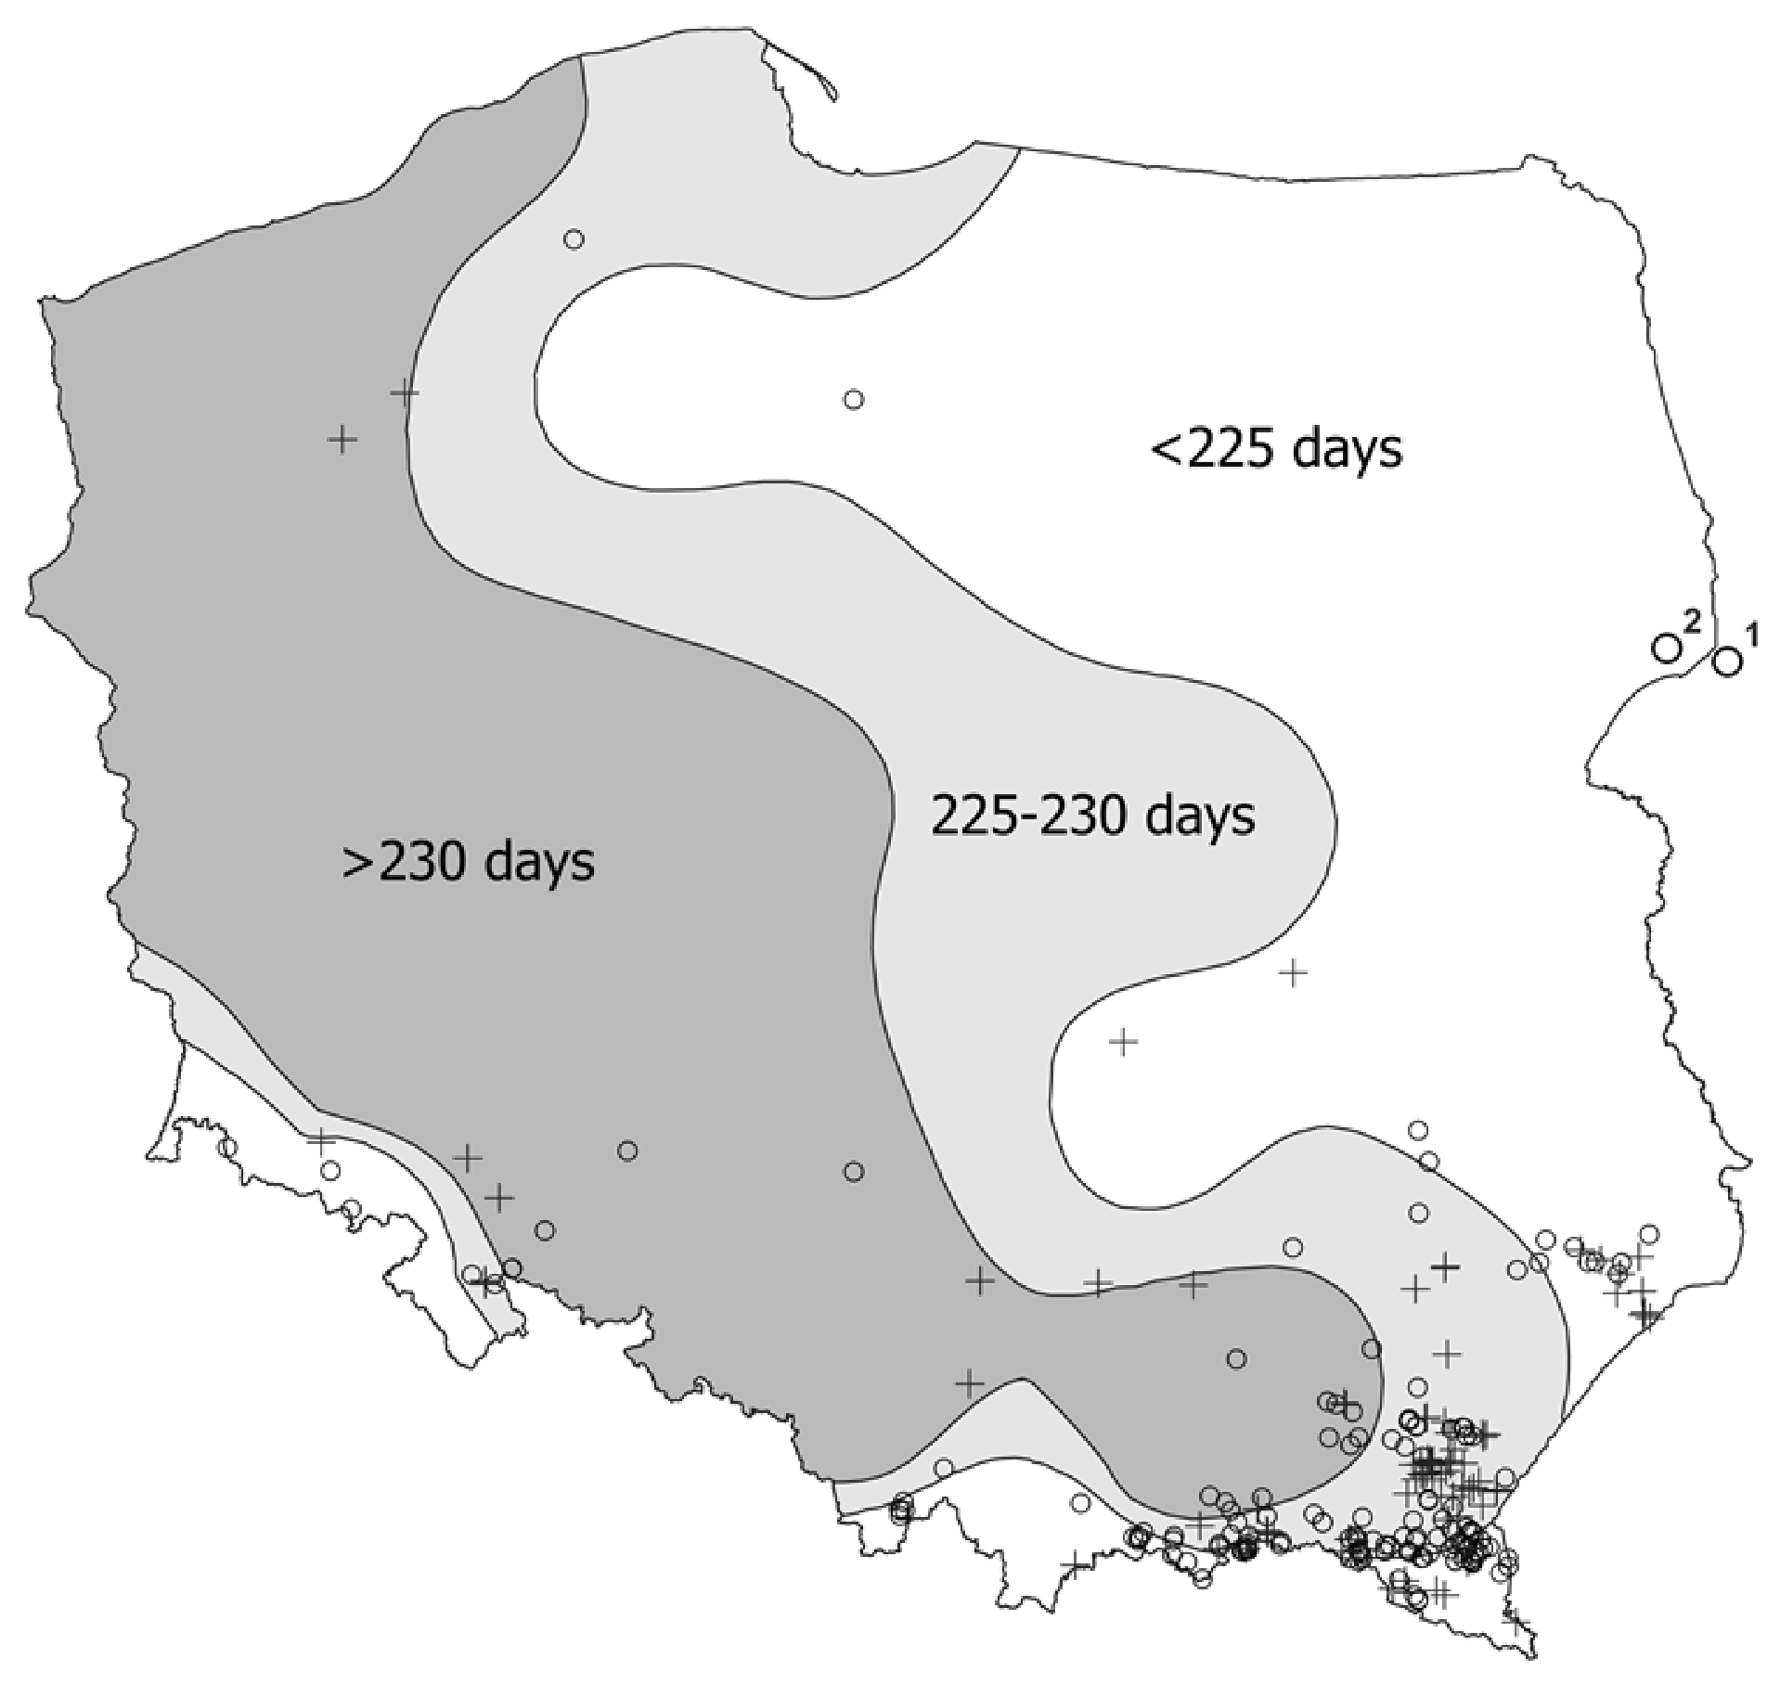
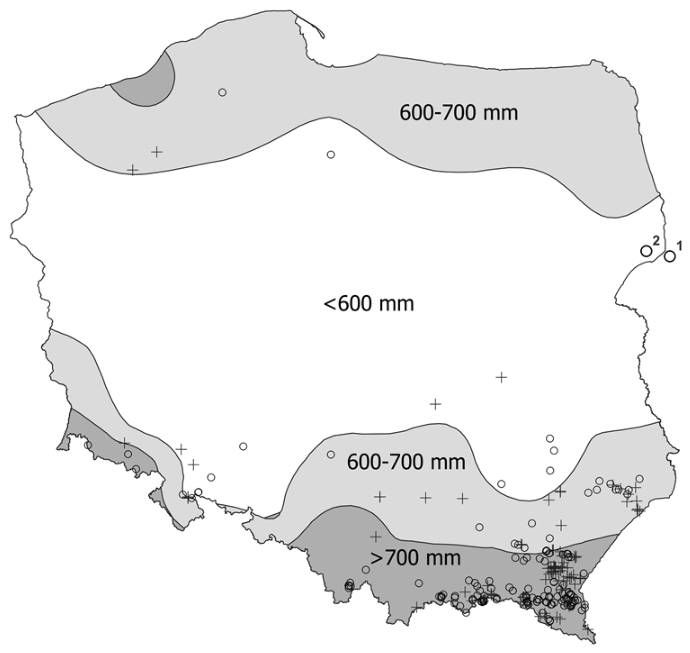
According to Tomczyk and Bednorz [13], during the last 30 years, precipitation in this area has been below 600 mm per year, the mean annual temperature has been approximately 8 °C, and the growing season has lasted fewer than 225 days (Appendix A, Figure A1, Figure A2 and Figure A3).
In 2013, a late cleaning operation was carried out, after which the effects of intraspecific competition were still evident. The total number of individuals examined in the year of the main measurements (2023) was 1918, i.e., 678 in Plot I, 676 in Plot II, and 564 in Plot III (Table 1). At the time of the fieldwork, the biological age of the trees was 31 years on Plot I and 28 years on Plots II and III.
As shown in Table 1, the number of individuals within the half-sib families across the plots is not uniform, which creates certain difficulties for statistical analysis. For example, half-sib family 1 on Plot I includes only 3 individuals, while provenance 2 on Plot III consists of just 6 trees. In contrast, some half-sib families (albeit not many) contain a sufficiently large number of trees to allow for proper statistical evaluation—for instance, families 2, 15, and 17 on Plot I. The provenances occurring on this plot should be considered more phenotypically representative in relation to Plots II and III, which is associated with their older age. This applies particularly to the more numerous half-sib families.

2.2. Methods

A qualitative assessment and measurements of the most important silvicultural parameters of the trees—including the candidates for prototype plus trees—were carried out at all three sites. The selection of one best individual from each of the 20 half-sib families, as well as an additional 10 representing the overall best provenances, was performed using the methodology adopted in Poland for evaluating qualitative and quantitative traits [8].
Qualitative assessment of stem and crown traits was conducted using a standardized three-level scoring system: (1) high quality—straight stem without visible defects, narrow and regular crown with well-distributed fine branches; (2) intermediate quality—minor stem curvature or moderate crown asymmetry; (3) low quality—pronounced stem defects, strong curvature, or poorly formed crown. Taking into account the age stage of growth, the evaluation of trunk clearance of branches was not used. Assessments were conducted by the same trained observers across all plots to ensure consistency. Crown evaluation was performed using a Magirus ladder lift basket. Qualitative scores were used as an initial screening criterion; only trees classified as level 1 or 2 were subsequently considered in the quantitative ranking based on DBH and H.
DBH measurements for a total of 1918 individuals (Table 1) were conducted using calipers at a height of 1.3 m, with an accuracy of 0.1 cm. Dead trees (completely defoliated), of which there were virtually none, as well as trees with severe crown damage (broken crowns) were excluded from the measurements. The field data were grouped into 2 cm diameter classes. Tree H was measured using a Vertex 5 ultrasonic hypsometer (Haglof)—three trees from each diameter class were measured for all half-sib families. The total number of measured H in Plot I was 238 pcs, or 35.1% of all trees, while in Plots II and III it was 529 pcs, or 42.7%.
The desktop research was aimed at identifying methods that would allow, on the basis of phenotypic data, a relevant determination of the half-sib families most promising for establishing a prototype seed orchard—specifically those in which it would be possible to select more than one tree for scion collection.
To determine the pool of the best provenances, we applied two methodological approaches.
The first approach, which had a preliminary and indicative character, consisted of determining the selection differential (S), calculated as the difference between the mean value of a given trait within a half-sib family and the mean value of the entire population [14]. For the calculation, we used the formula S = X s X p , where S is the selection differential, X s is the mean (DBH and H) of the studied half-sib family, and X p is the mean (DBH and H) of the whole population. In the context of our study, the biological interpretation of the selection differential is that it indirectly indicates the genetic potential of the analyzed half-sib families.
Previously, the height–diameter relationships were modeled using measurements from three trees per 2 cm DBH class. Family specific DBH–H curves were fitted and subsequently used to estimate the height of all trees within a given family [15]. Second-degree polynomial models best described the height–DBH relationship (Appendix B). Families with very small sample sizes were treated with caution and excluded from comparative modeling where reliable curve fitting was not possible. For half-sib lines represented with less than 11 trees, the heights of all trees were measured during field surveys: sib lines 1, 16, and 21 (Plot I) and 1, 21, and 23 (Plots II–III).
Next, using the second, more precise approach, we focused on calculating the 95th percentile of DBH and H for half-sib families with an adequate sample size. In this way, a lower bound of the pool representing the top 5% of the tallest and thickest phenotypes was obtained. That is, the 95th percentile was used to identify differences in upper-tail phenotype values representing potential plus-tree candidates, which is consistent with classical progeny–provenance testing practice. This indicator is more objective than the selection differential, since it does not depend on the distribution of the variable (DBH and H) within the family and represents trees of the highest biosocial class, characterizing the maximum potential of each family in the given climatic and soil conditions. It is necessary, however, to accept as granted the numerical diversity of the half-sib families noted, which is the weak point of the second approach. The 95th percentile was used as an exploratory descriptor of upper-tail phenotypes within half-sib families, rather than as a robust estimator of genetic superiority, especially in families with small and unequal sample sizes.
The analysis of quantitative traits in the studied population was supplemented with a comparison of the average values achieved by silver fir in managed stands growing within the State Forests in various parts of Poland, mostly in its southern regions, i.e., within the natural range of the species (Figure 1). For this purpose, stands aged 28 years (87 stands—used for comparison with the plantations on Plots II and III) and 30 years (139 stands—used for comparison with Plot I) were selected. The comparative stands represented habitat types including coniferous and mixed forests, as well as lowland, upland, and montane forest sites. The data were obtained from the Forest Data Bank [15].
The statistical description of the comparative stands is presented in Table 2, while their locations in relation to total precipitation, temperature, and the length of the growing season are shown on the maps included in Appendix A (Figure A1, Figure A2 and Figure A3).
Non-parametric statistical tests were applied with a significance level of α = 0.05. DBH and H values were compared among the half-sib families using the Kruskal–Wallis ANOVA followed by the Dunn–Bonferroni post hoc test. Sample sizes within several half-sib families were small (e.g., N = 3), which may limit their statistical power; therefore, interpretation of non-significant results for these families should be made cautiously. DBH and H values of the studied half-sib families were also compared with the average values observed in managed forests in Poland using the Wilcoxon test. The analyses were performed using the PQStat (version 1.8, https://pqstat.pl/) and Jamovi (version 2.6, https://www.jamovi.org) software packages.
The study design is biased by unequal representation of half-sib families and age differences among plots. These factors may influence the observed growth patterns and were accounted for by cautious interpretation of the statistical results.

3. Results

3.1. Comparative Analysis of Half-Sib-Families Among Themselves and in Relation to Managed Stands

The average DBH of silver fir stands in managed forests of the State Forests is 7.0 cm at age 28 and 7.7 cm at age 31 (Table 2), although there are a few stands in which it reaches 14–15 cm. The average H ranges from 6.8 m (28 years) to 9.1 m (31 years), with maximum values falling between 13 and 16 m. The most important factor influencing DBH in the analyzed silver fir stands across Poland was their elevation level. Stands located in upland and mountainous areas had significantly higher DBH compared with those growing in lowland regions. However, this result may be affected by the relatively small number of stands located in the lowlands (nine sites). In the case of H, no effect of elevation above sea level was detected.
No effects of mean annual temperature, annual precipitation sum, or the length of the growing season on DBH or H were detected. The only exception was DBH in the 31-year-old stands, which was significantly lower in the category of annual precipitation up to 600 mm compared with the remaining precipitation classes.
It is worth noting that the studied silver fir plantation is located at the lower boundary of all of the presented abiotic factors: lowland elevation, annual precipitation up to 600 mm, mean annual air temperature below 8 °C, and a growing season shorter than 225 days. Therefore, theoretically, as indicated by the above analysis (Table 2), at least two factors—elevation above sea level and annual precipitation—may act as limiting factors for growth.
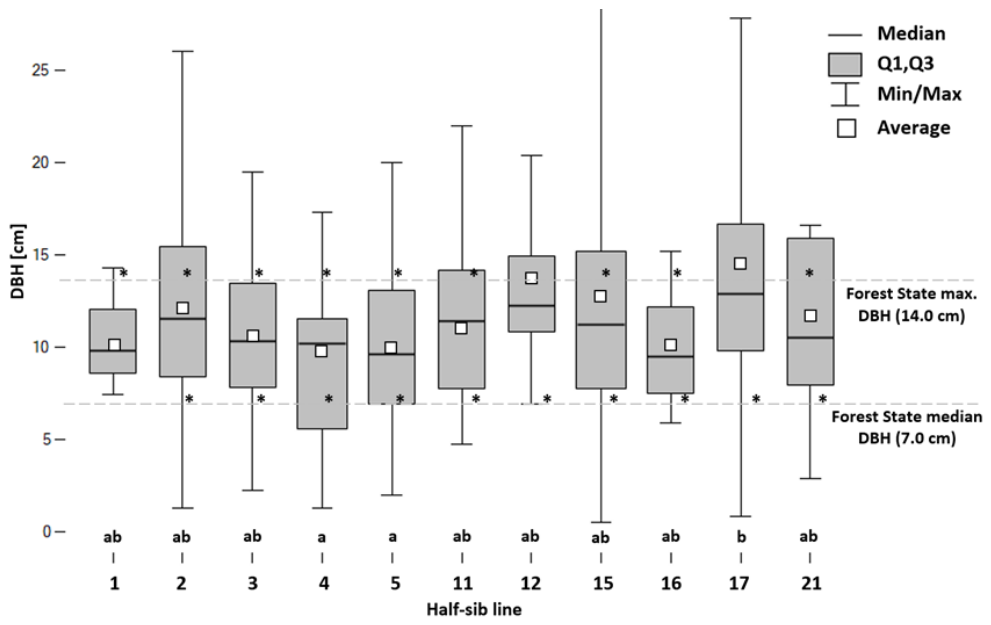
The average DBH of the 31-year-old silver firs (Plot I) in most half-sib families significantly exceeded the corresponding values observed in managed stands of the State Forests (Table 2, Figure 3). There were also half-sib families displaying exceptionally strong growth. For example, the average DBH of half-sib family 12 did not differ significantly from that of the best-performing managed stands (Max DBH = 14.0 cm), while half-sib family 17 even exceeded this value.
Significant differences among the half-sib families on Plot I were found only between families 4 and 5—which showed the lowest mean DBH (10.2 and 9.6 cm, respectively)—and family 17, which exhibited the highest value (12.9 cm). On average, the DBH of 31-year-old silver firs was around 10 cm, although the maximum values were highly variable.
In the context of the objective of the present study—namely, identifying half-sib families with the greatest proportion of individuals showing superior silvicultural traits—particular attention should be paid to families 2, 15, and 17. These half-sib families contained trees with DBH exceeding 25 cm, nearly twice the plot mean. Among them, family 17 is the most representative, as it includes the largest total number of individuals (Table 1), within which the specimens with the highest parameter values are most fully represented.
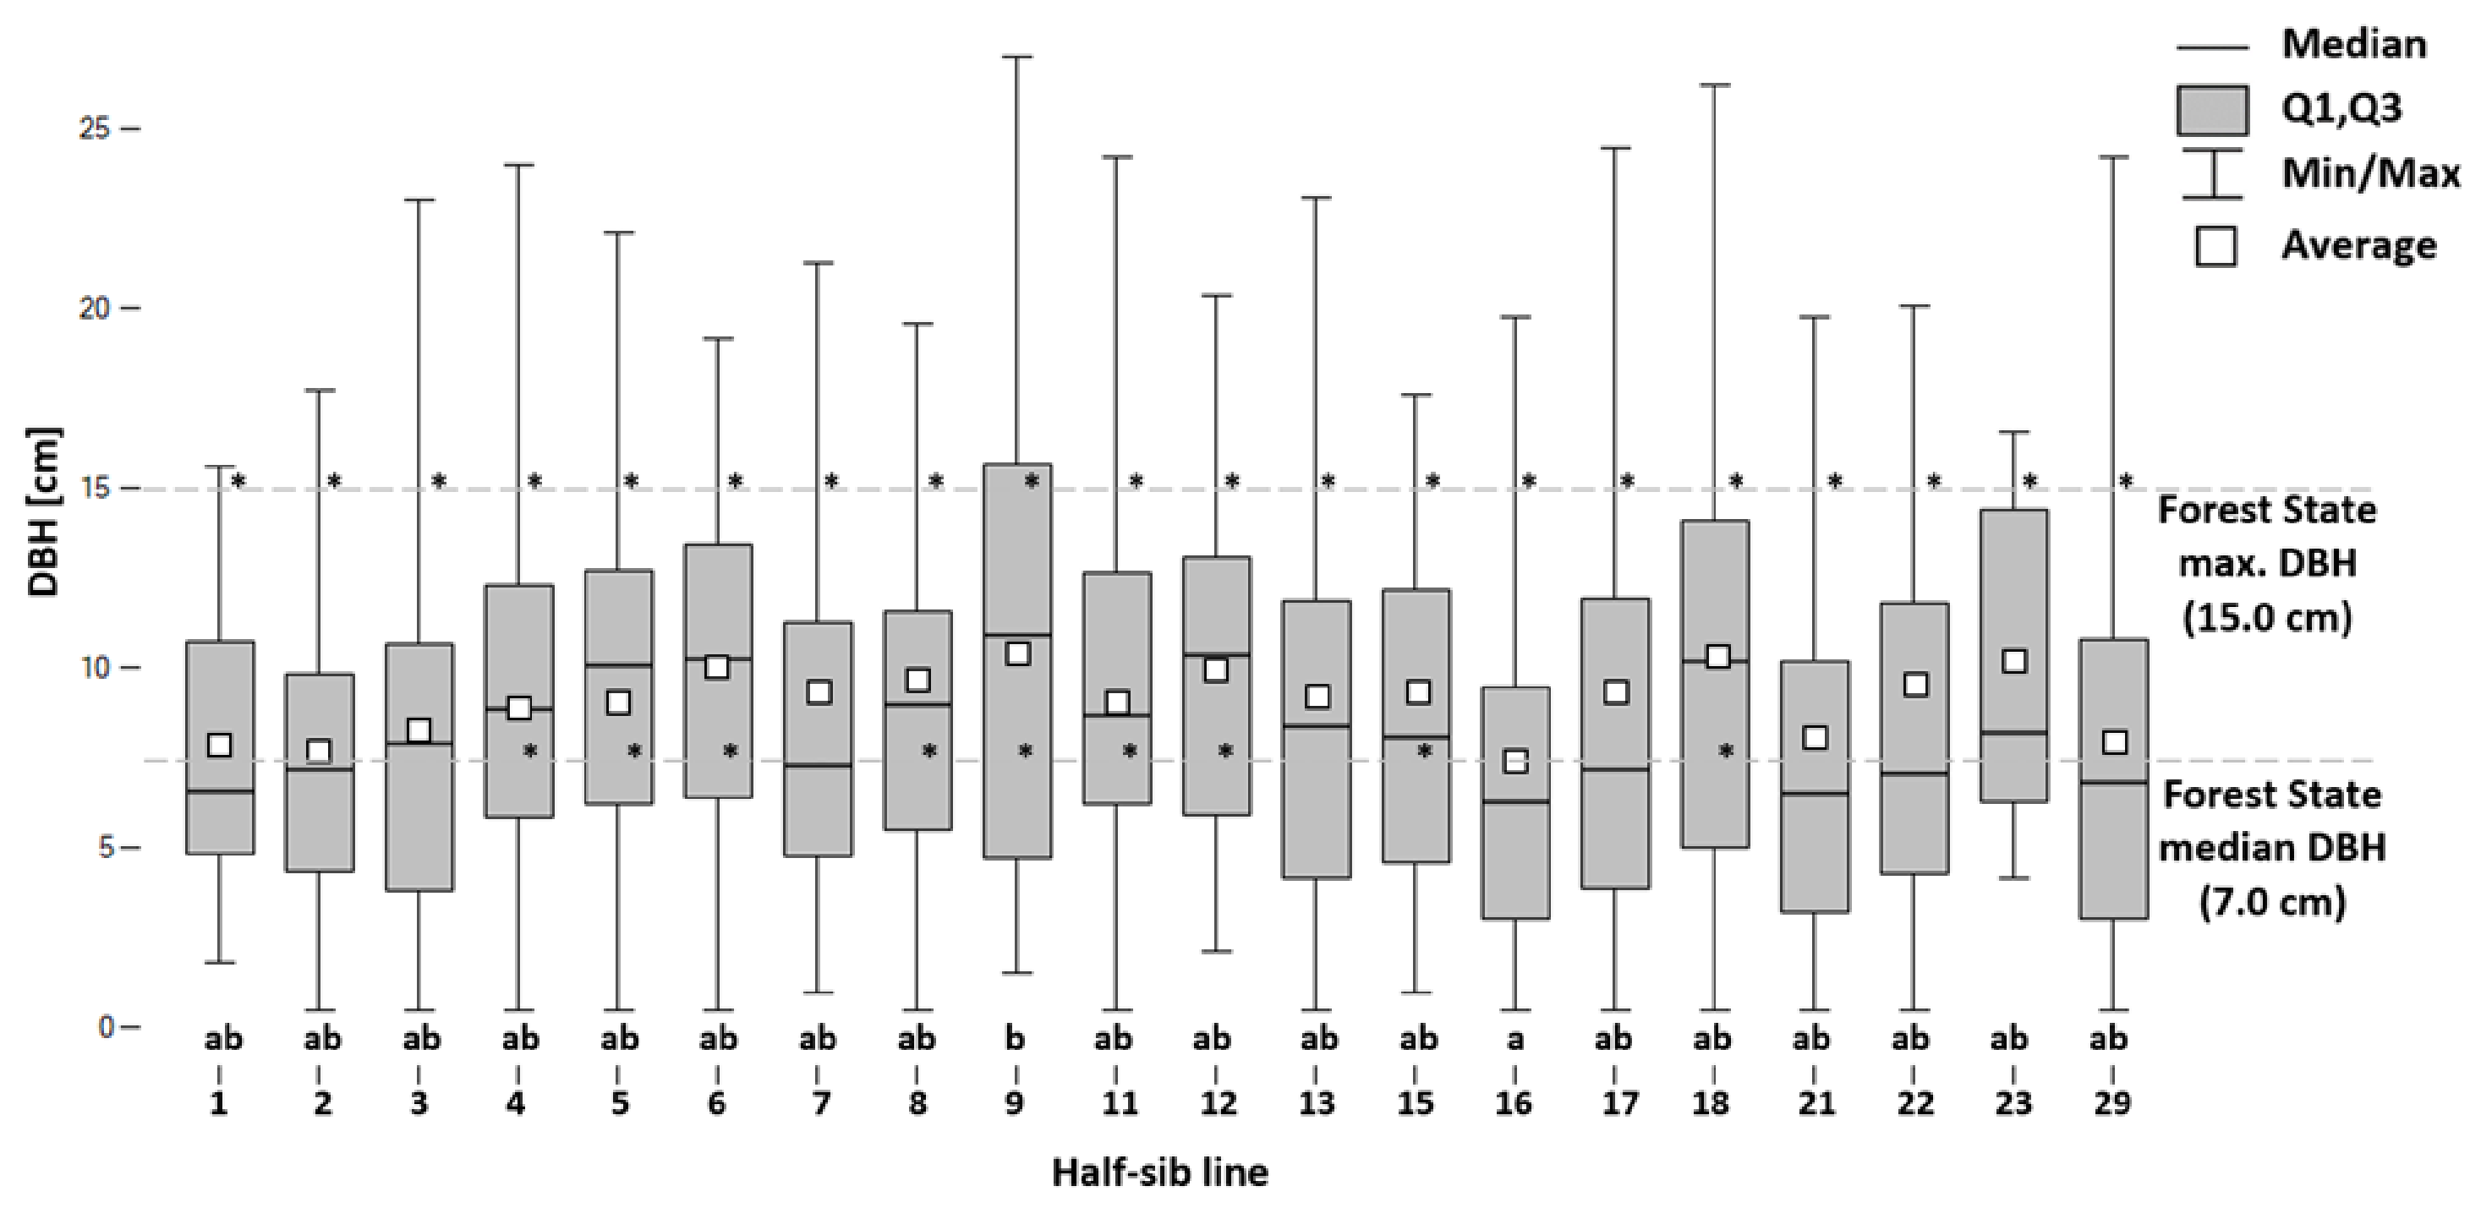
The 28-year-old silver firs (Plots II–III) also exceeded the values observed in the State Forests, albeit to a lesser extent (Figure 4). The mean DBH of eleven out of the twenty half-sib families did not differ significantly from those values. None of the examined half-sib families reached the maximum DBH recorded in the State Forests. It should be noted, however, that this maximum value (15 cm) was even higher than the maximum recorded for the 31-year-old stands.
Within the plots, half-sib family 9 was characterized by the highest DBH values, reaching a maximum of 10.9 cm, whereas family 16 displayed a statistically significantly lower mean DBH (6.3 cm). Half-sib family 18 also deserves attention, as its mean DBH values were similar to those of family 9. In both of these provenances, individual trees with DBH exceeding 25 cm were recorded. It should be emphasized that a similar magnitude of outliers was also observed on Plot I (Figure 3), although the trees there are three years older.
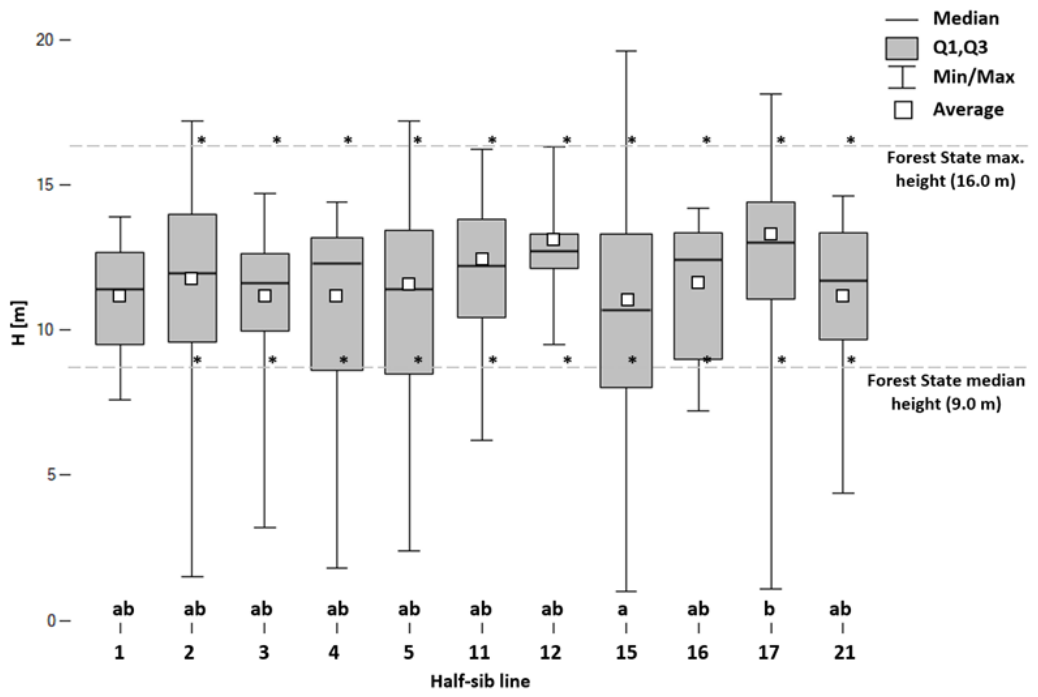
In terms of tree H, the 31-year-old silver firs (Plot I) exhibited sufficiently high performance, similar to the pattern observed for DBH (Figure 5). Ten of the eleven half-sib families had mean H values exceeding those recorded in managed forests. The lack of a statistically significant difference for half-sib family 1 is likely due to the small number of trees (n = 3). However, none of the half-sib families reached height values comparable to those of the tallest stands of the same age observed in the State Forests.
In the case of H, the variation among the half-sib families was relatively small. Statistically significant differences were found only between half-sib family 15, which had the lowest mean H value on this plot (10.7 m), and family 17, which reached the highest value (13.0 m). On the other hand, within family 15, outliers approaching nearly 20 m in H were recorded.
Taking both DBH and H into account, the trees from half-sib family 17 should be noted for their more harmonious growth form. An analysis of Figure 5 clearly shows that, because the median and the mean are very close in most cases (with the exception of families 4 and 16), there is no pronounced asymmetry nor a strong influence of outliers (extremely low or high values) on the overall H dataset. In this case, the mean value truly reflects the productive potential of the half-sib families examined.
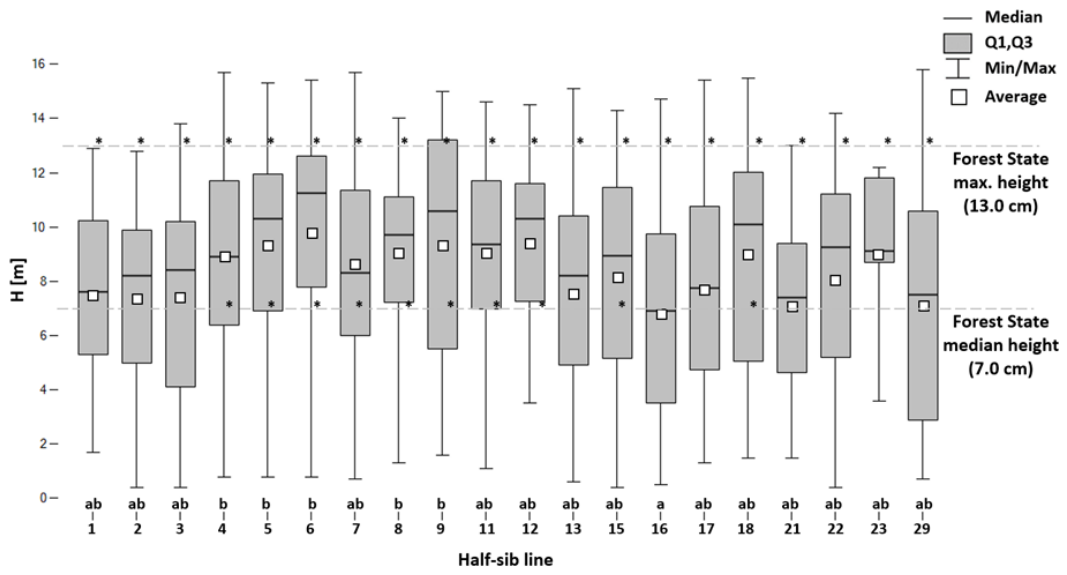
The H of the 28-year-old silver firs (Plots II and III) was higher than the national cohort average (7.0 m) in ten of the half-sib families. None of the families, however, reached the H values recorded in the tallest stands of the same age within the State Forests (13.0 m) (Figure 6).
Within the plantation, significant differences in mean H were found only between half-sib family 16 (6.9 m) and families 4, 5, 6, 8, and 9, whose heights ranged from 8.9 to 11.3 m. In most of the examined half-sib families, individual trees exceeded 13 m in H, which was the maximum value recorded for stands of the same age in the State Forests. As shown by the analysis in Figure 6, the best-performing provenances in terms of H, including families 5, 6, 8, and 9, exhibit left-skewed distributions, indicating that most observations (the highest H values) are concentrated in the right part of the distribution.

3.2. Selection of the Best Half-Sib Families of Autochthonous Silver Fir from the Tisovik Reserve

The highest positive values of the selection differential for DBH were recorded for half-sib families 12 and 17 on Plot I, and for families 5, 11, 12, 18, and 23 on Plots II and III. Based on H, the most noteworthy half-sib families were 11, 12, and 17 on Plot I, and 5, 6, 9, and 23 on Plots II and III (Table 3).
Knowledge of the deviation from the population mean in DBH and H for individual provenances is undoubtedly important for their preliminary evaluation. However, it does not allow for assessing their ability to produce a substantial number of individuals with the most desirable phenotypic traits.
The analysis of the coefficient of variation (CV) for the studied parameters (Table 1) indicates a very substantial dispersion of values within the examined provenances. In the vast majority of cases, the variability in the data series is high (CV > 30%). Pronounced variation in diameter and height within even-aged stands is characteristic of shade-tolerant species, of which A. alba is a typical example [16]. Assuming that other factors (light availability, soil conditions, spatial arrangement) remain constant, a shift in the distribution of measurement data toward a stronger representation of larger individuals may suggest a genetic determination of this phenomenon.
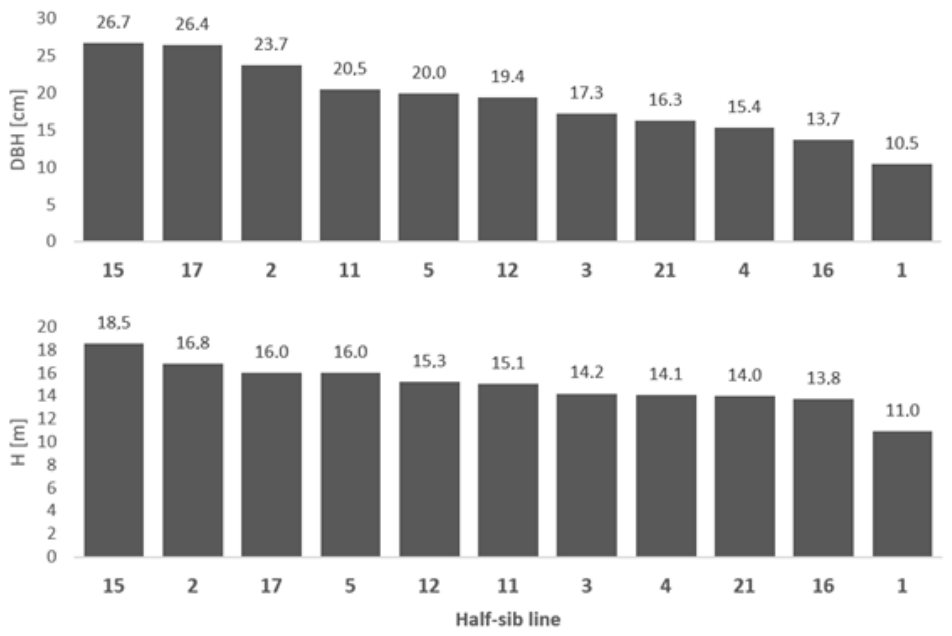
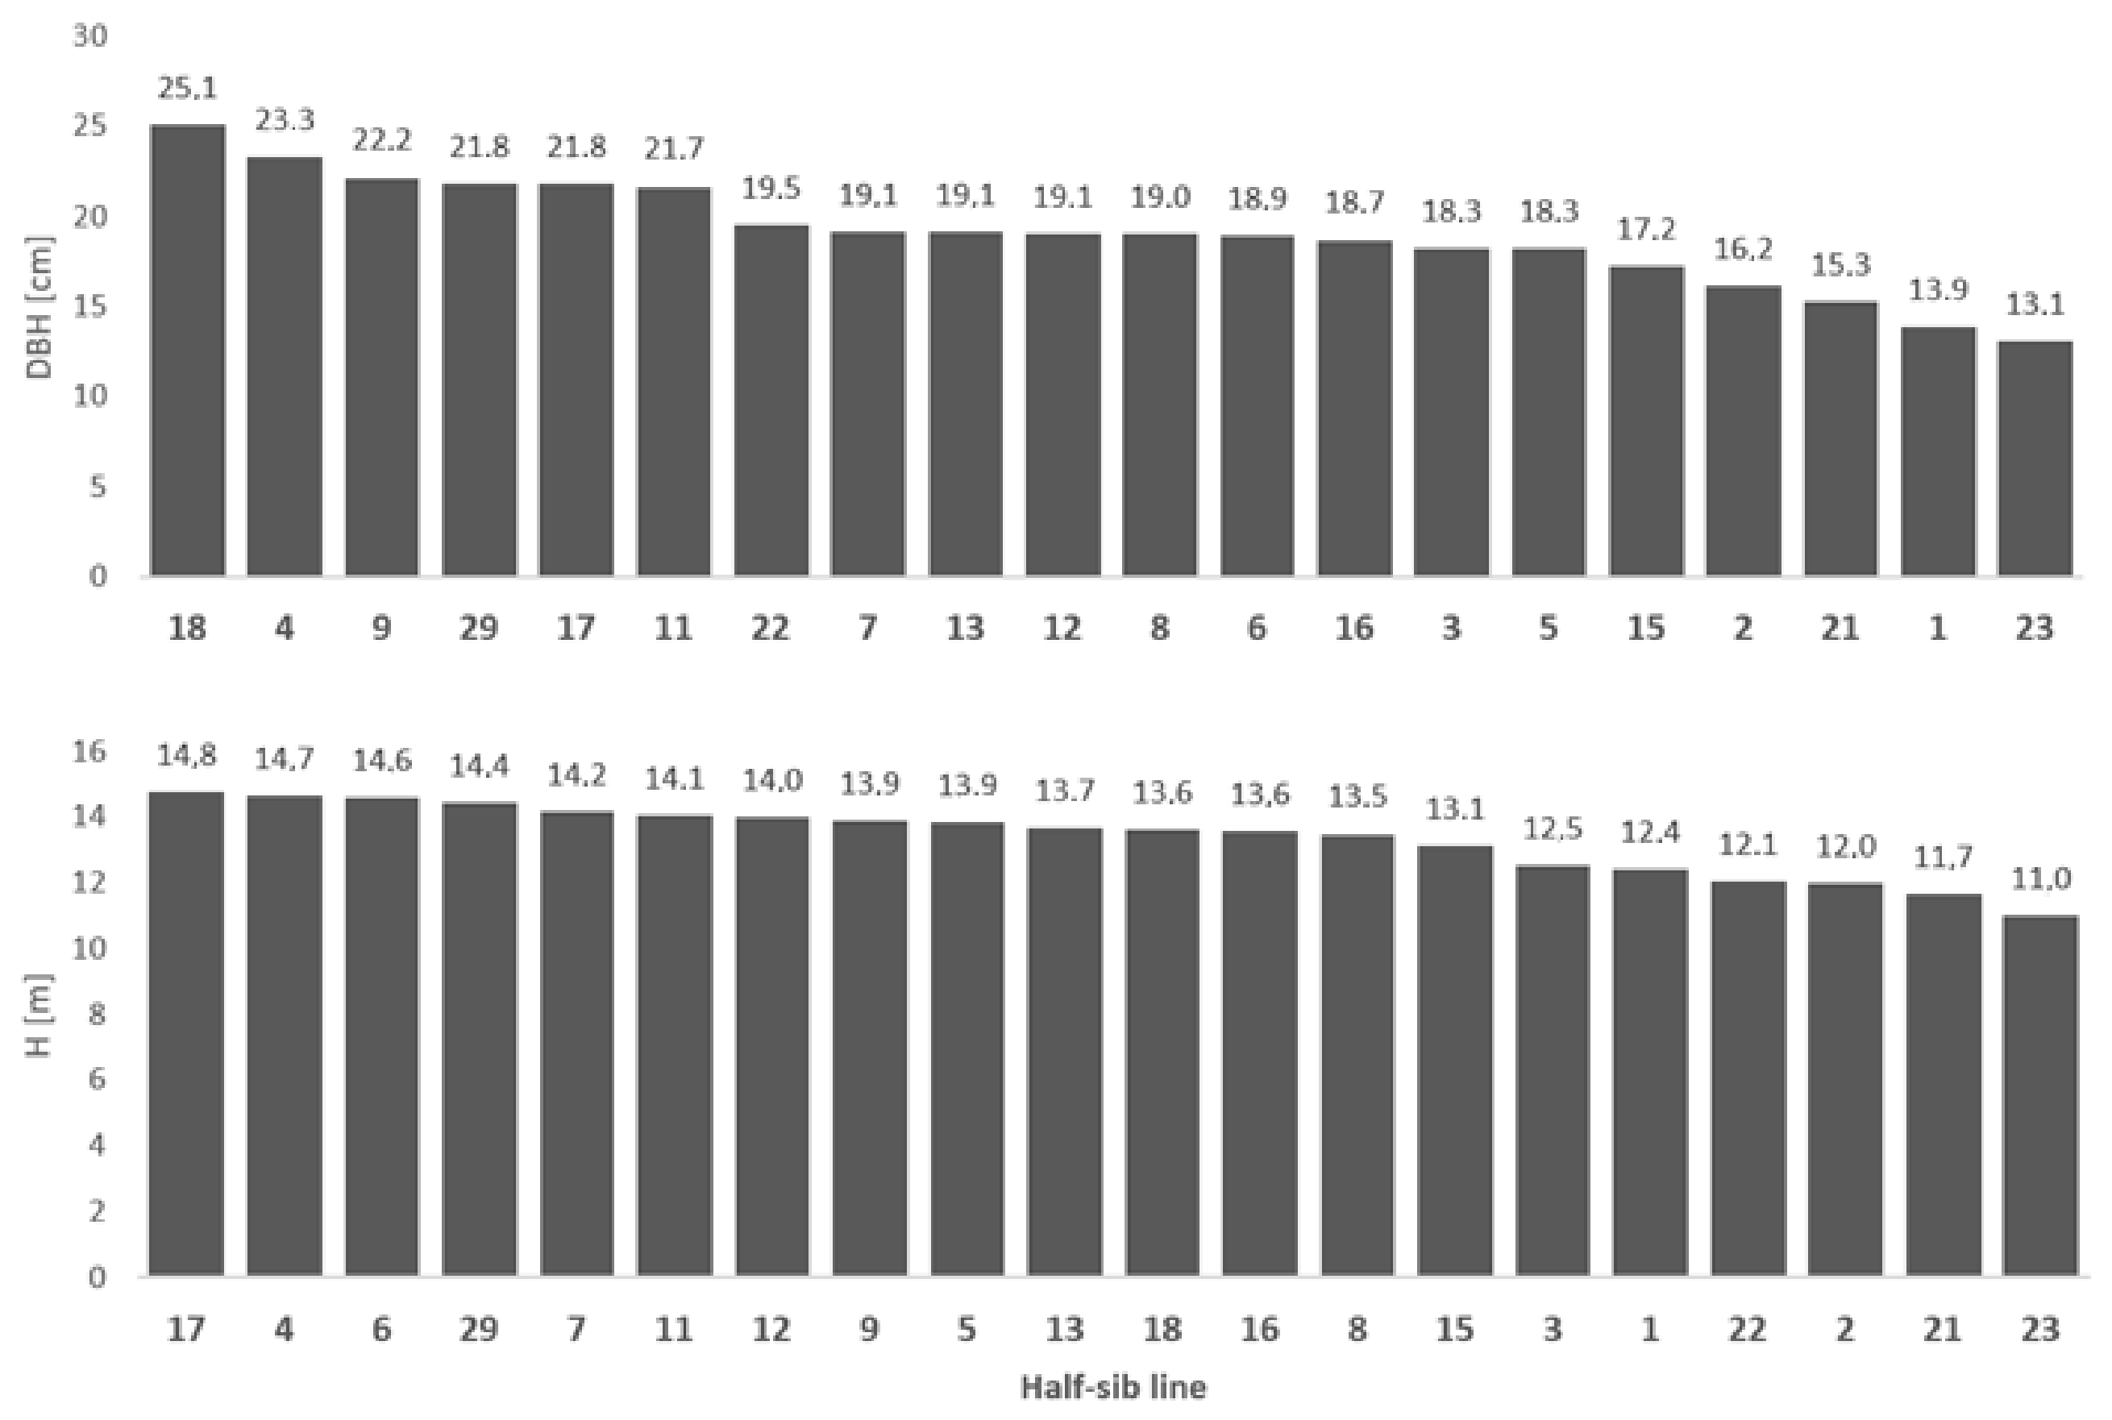
Considering the predisposition to produce individuals with exceptionally large DBH values within Plot I, provenances 17, 15, and 2 can be distinguished (Figure 7). With respect to H, the leading half-sib families are 5, 17, and 2, with families 15 and 12 showing nearly the same potential. In Plots II and III, the half-sib families characterized by the greatest DBH potential were 18, 9, and 22, whereas for H, the most prominent families were 6, 9, and 4 (Figure 8).
Based on the results presented above, the prototype plus trees were ultimately selected (Table 4), from which scions were collected for grafting. These comprised, first, the thickest and tallest individuals representing each half-sib family—20 trees in total—and second, an additional 10 trees that, although slightly smaller within their respective families, still exhibited large DBH and H values relative to the entire population and were identified within the phenotypically superior half-sib families. All selected silver fir individuals displayed good stem and crown quality traits and were characterized by high health and vitality.
In some cases, the younger trees (by three years) representing the same half-sib families as those on Plot I exhibited even higher parameter values (for example, trees with grafting ID codes 11 and 12—half-sib family 11; ID 13 and 14—half-sib family 12; and ID 23 and 24—half-sib family 17) (Table 4). In such situations, preference was given to these younger individuals as prototype plus trees. In addition to their superior phenotypic traits despite their younger age, the potential to increase the genetic diversity of future generations was also taken into account, given the undeniable variability in pollination combinations (sources) of the same tree in the Tisovik Reserve across different years.
Patterns observed in the upper tail of DBH and H distributions should be interpreted cautiously, particularly for families represented by a limited number of individuals.
Comparisons with State Forest stands were intended to provide descriptive context for growth performance rather than a strict inferential benchmark, given differences in site conditions, management history, and analytical structure.

4. Discussion

According to Gončarenko and Sawickij [17] and Gončarenko [18], a particularly interesting feature of the Tisovik Reserve population is its considerable heterozygosity, despite the small number of trees currently remaining (20 individuals). Moreover, it should be noted that 17 out of the 20 A. alba trees in Tisovik possess unique genotypes [18], and one of the trees with the highest allelic diversity is tree no. 17, from which half-sib family 17 included in the present study originates. This family was also the most strongly represented as a source of scions (Table 4).
Given the above, it is reasonable to assume that the heterozygosity level in the offspring growing in the conservation plantation in the Hajnówka Forest District will be further strengthened. As reported by Mittenbühler et al. [19], in those cases, it is almost impossible to find two genetically identical trees—each of them is unique. According to calculations by Gončarenko [18], open pollination among the 20 trees in the Tisovik Reserve can result in more than 13,000 different genotypes, 1918 of which are currently represented in the conservation plantation in the Hajnówka Forest District (Table 1). This implies that, for the selection of prototype plus trees, it is appropriate to designate not just a single individual but several from the best half-sib families, among which families 15, 17, and 2 on Plot I should be highlighted in particular.
We assumed that this approach would make it possible, during the future use of the prototype seed orchard, to maintain both the productive potential (stand volume) of artificial stands established in the Polish Lowlands and their genetic diversity, which underlies a high level of adaptive capacity. At the same time, it will help avoid inbreeding depression, particularly when an appropriate clone-mixing arrangement is applied in the orchard design.
Returning to the phenotypic parameters of the selected trees, two points should be emphasized: their values are significantly higher than the averages for the corresponding half-sib families and plots, as well as for managed stands within the species’ natural range (see the Section 3). For example, the mean DBH of such trees on Plot I is 25.3 cm, which is 2.25 times greater than the plot mean. A similar relationship can be observed for Plots II and III, where the value of 21.8 cm is 2.5 times greater than the average. The average H of the better-performing families on Plot I is 12.1 m, while it is 10.3 m on Plots II and III, whereas for the selected trees this parameter reaches 16.6 m on Plot I and 14.2 m on Plots II and III.
When the mean values of the key silvicultural parameters of the selected trees are compared with the yield tables of Szymkiewicz [20], it becomes evident that, at the age of 28–31 years, their H corresponds to that of dominant stand trees aged approximately 40–45 years, while their DBH is comparable to that of trees aged 55–65 years.
Our results are consistent with the high heterozygosity and strong individual genotypic differentiation previously reported for the Tisovik population [17,18], confirming the adaptive potential of this relict gene pool.
Despite growing under the lowest precipitation range (<600 mm) and the shortest growing season among all reference stands (<225 days), the Tisovik offspring maintained good growth. This suggests that specific adaptive mechanisms are likely at play, and their study deserves more attention [21,22]. Utilizing the ecological potential of A. alba may be one of the pillars of future forest sustainability when developing forestry strategies in a changing climate.
The results indicate the presence of substantial phenotypic variation and identify promising candidate trees for further breeding and conservation efforts. However, confirmation of breeding value in a quantitative genetic sense would require multi-site progeny testing or genetic analyses.

5. Conclusions

This study is, to date, the only one dedicated to analysis of the growth performance, phenotypic variability, and breeding potential of offspring originating from the autochthonous relict population of A. alba in the Tisovik Reserve.
Clear differences were observed in the ability of half-sib families to generate individuals with outstanding silvicultural traits, even though the mean DBH and H often did not differ significantly between most families.
The selection of 30 prototype plus trees—20 representing the best individuals within each half-sib family, and 10 from the phenotypically superior half-sib families—creates a foundation for establishing the first prototype seed orchard for this relict population.
The results support the identification of phenotypically superior individuals suitable for scion collection, but they do not constitute definitive evidence of breeding value or adaptive superiority.

Author Contributions

Conceptualization, A.M. and P.B.; methodology, A.M., S.P. and P.B.; software, S.P., P.B. and E.B.; validation, A.M., S.P., P.B. and K.W.; formal analysis, K.W. and E.B.; investigation, A.M., S.P. and P.B.; resources, A.M.; writing—original draft preparation, A.M., S.P. and P.B.; editing, P.B.; supervision, A.M.; project administration, A.M.; funding acquisition, A.M. All authors have read and agreed to the published version of the manuscript.

Funding

This study was carried out within the framework WZ/WB-INL/2/2025 and financed from the science funds from the Ministry of Science and Higher Education in Poland.

Data Availability Statement

The original contributions presented in this study are included in the article. Further inquiries can be directed to the authors. The raw data supporting the conclusions of this article will be made available by the authors on request.

Conflicts of Interest

The authors declare no conflicts of interest.

Appendix A. Location of the Study and Comparative Sites in Relation to Selected Climatic Factors
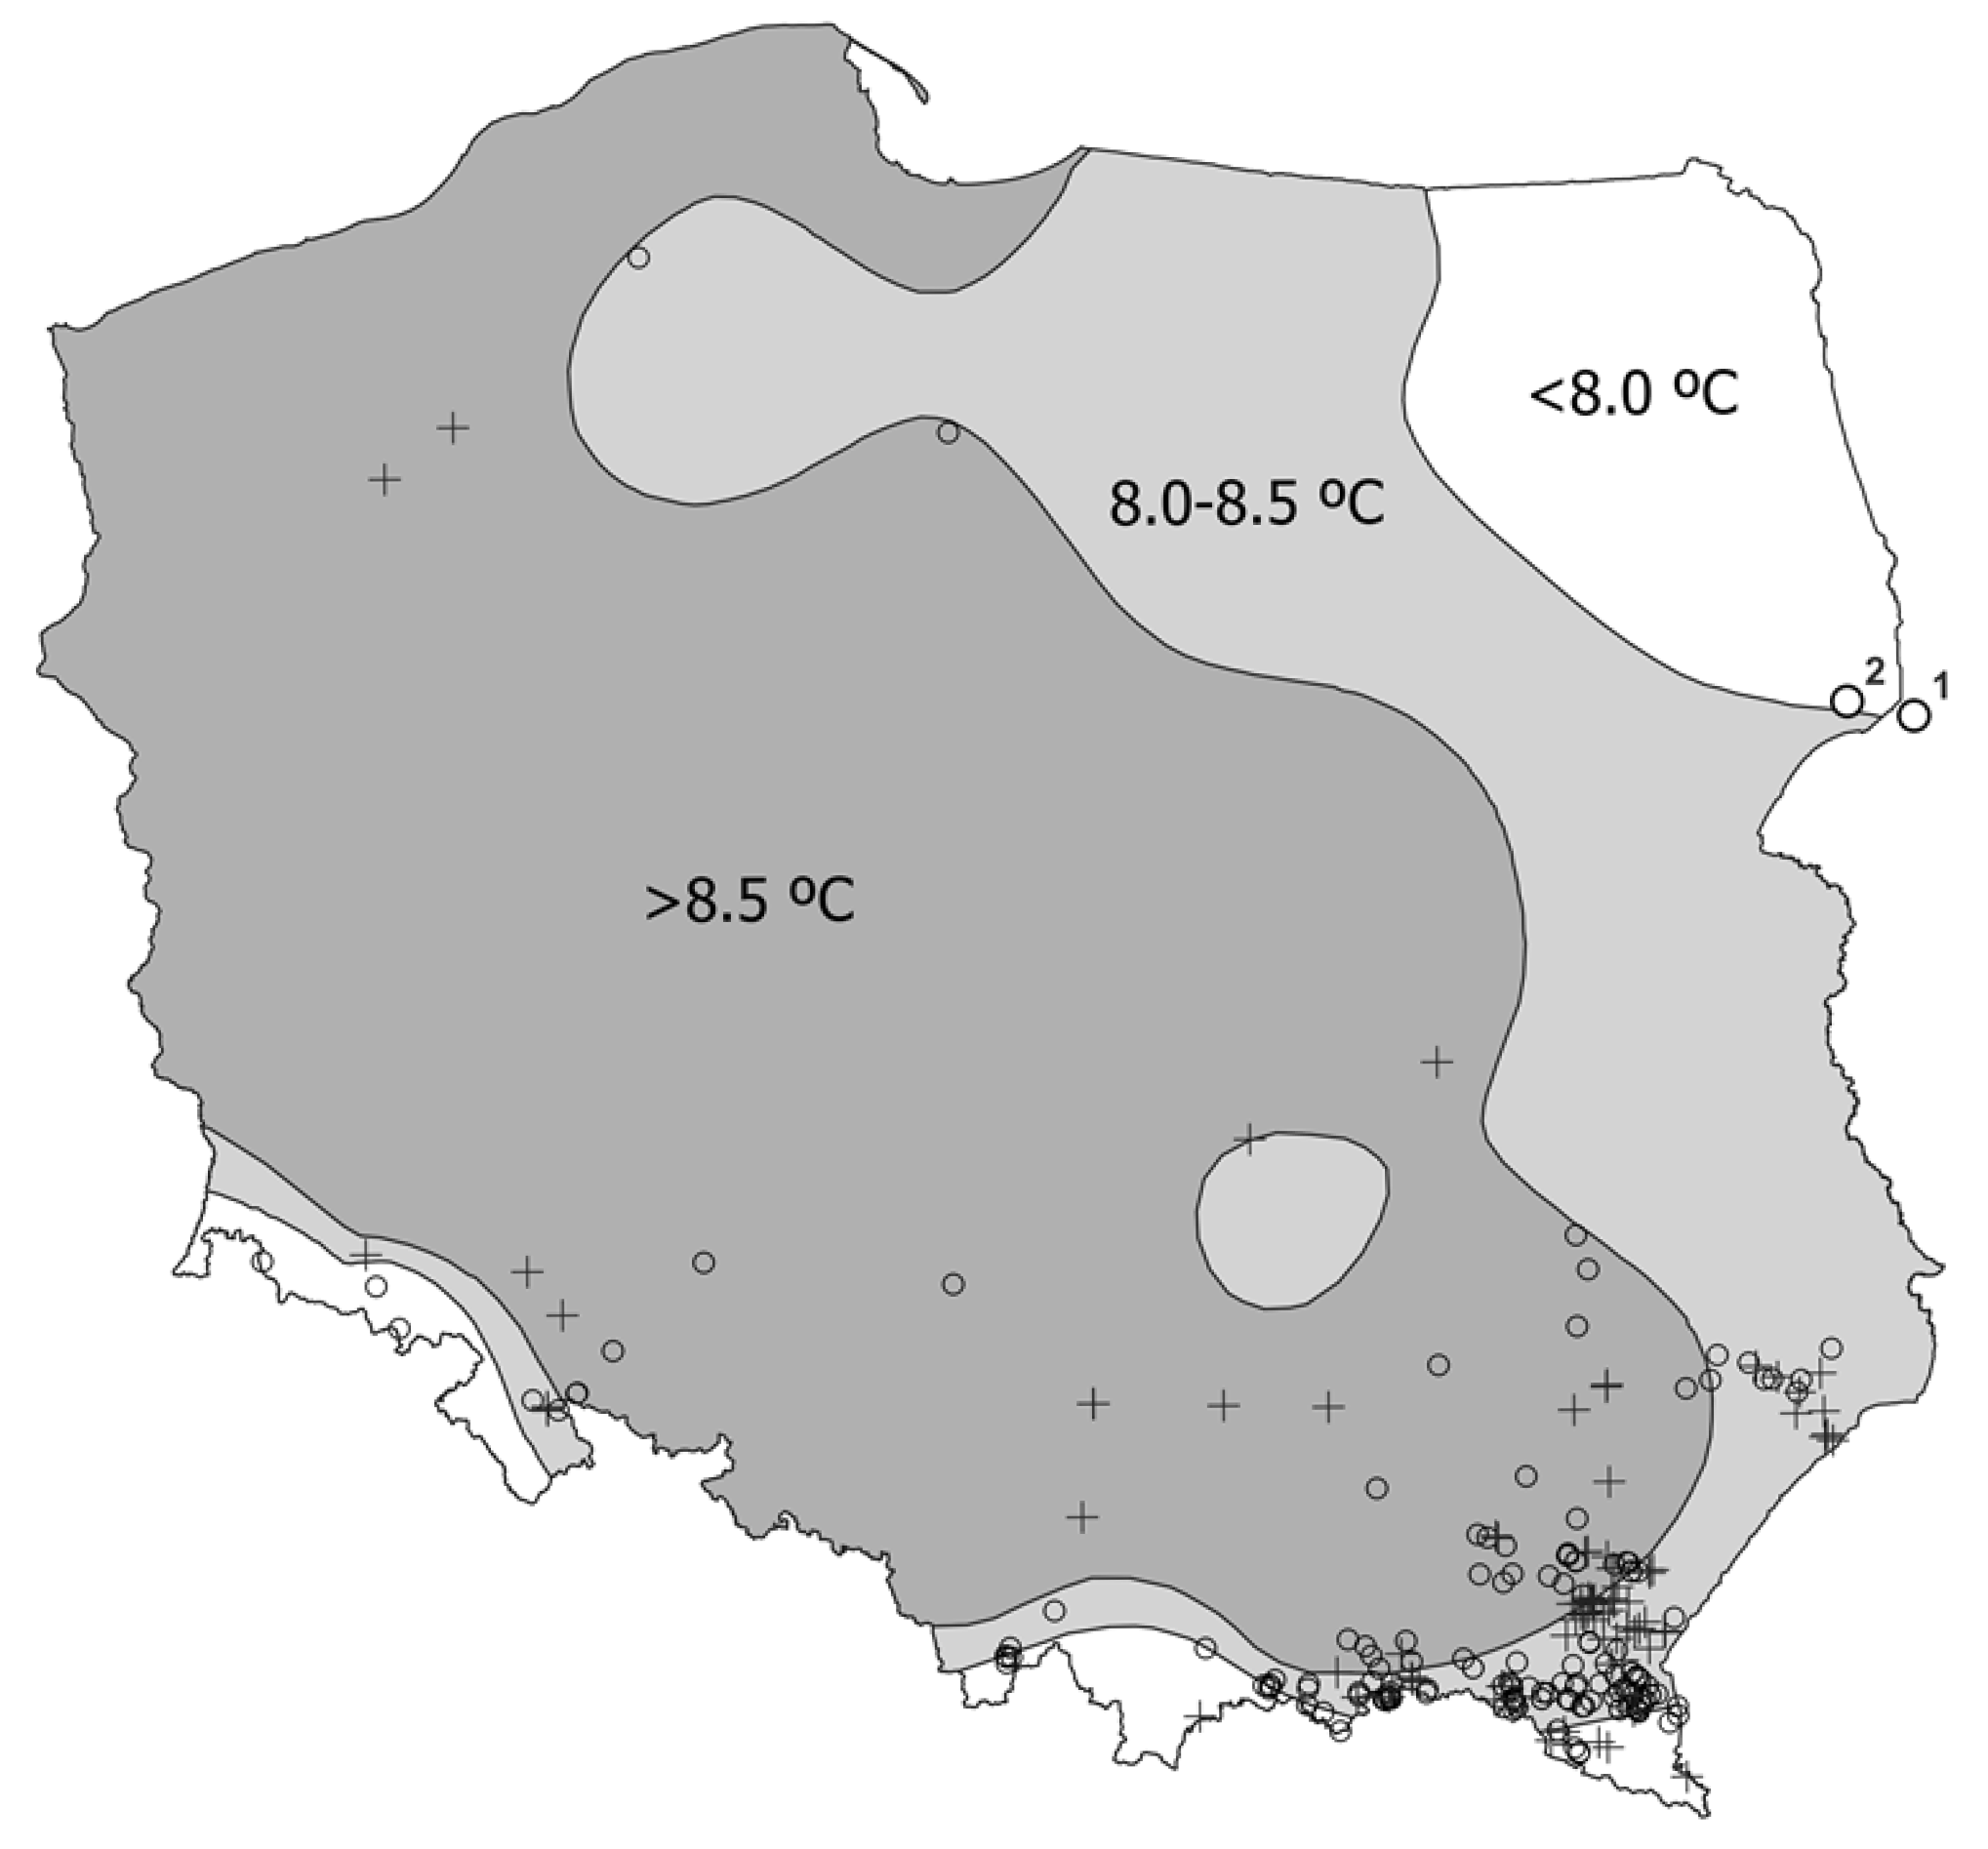
Figure A1. Temperature, based on Tomczyk and Bednorz [13]. Points 1 and 2 are the same as in Figure 1.
Forests 17 00572 g0a1
Figure A2. Annual precipitation. Points 1 and 2 are the same as in Figure 1.
Forests 17 00572 g0a2
Figure A3. Length of the growing season. Points 1 and 2 are the same as in Figure 1.
Forests 17 00572 g0a3

Appendix B. Equations Used to Calculate Tree H

Table A1. Equations used to calculate tree H. For sib-lines 1, 16, and 21 (Plot I) and 1, 21, and 23 (Plots II–III), the H of all trees was measured in the field. N—number of all trees in half-sib line in given plot; %—percentage of trees of the half-sib line used to create the model equation.
Half-Sib LineModel Equation for H R 2 DBH Range [cm]N%
Plot I (31 years old)
2 H = 0.027 D B H 2 + 1.321 D B H + 0.1111 0.951.3–26.03725
3 H = 0.0294 D B H 2 + 1.1699 D B H + 2.5295 0.892.2–19.32279
4 H = 0.0552 D B H 2 + 1.7814 D B H 0.0253 0.961.3–17.31875
5 H = 0.0367 D B H 2 + 1.5471 D B H 0.2065 0.942.0–20.02537
11 H = 0.0221 D B H 2 + 1.0472 D B H + 3.1239 0.774.7–22.02471
12 H = 0.0180 D B H 2 + 0.9184 D B H + 4.2475 0.836.9–20.41482
15 H = 0.0164 D B H 2 + 1.083 D B H + 0.5934 0.970.5–28.73821
17 H = 0.0297 D B H 2 + 1.387 D B H 0.0341 0.900.8–27.83825
Plot II–III (28 years old)
2 H = 0.0418 D B H 2 + 1.4491 D B H 0.3336 0.980.5–17.72456
3 H = 0.0311 D B H 2 + 1.2863 D B H 0.2436 0.950.5–23.02846
4 H = 0.0292 D B H 2 + 1.3511 D B H 0.5383 0.950.5–24.03321
5 H = 0.0323 D B H 2 + 1.3833 D B H 0.2963 0.970.5–22.12842
6 H = 0.0419 D B H 2 + 1.5444 D B H 0.4241 0.910.5–19.22956
7 H = 0.0352 D B H 2 + 1.4258 D B H 0.1563 0.941.0–21.32963
8 H = 0.0316 D B H 2 + 1.2661 D B H + 0.8080 0.930.5–19.63122
9 H = 0.0287 D B H 2 + 1.2819 D B H + 0.1432 0.961.5–27.03242
11 H = 0.0291 D B H 2 + 1.2813 D B H + 0.1223 0.960.5–24.23439
12 H = 0.0273 D B H 2 + 1.1556 D B H + 1.2310 0.912.1–20.42844
13 H = 0.0243 D B H 2 + 1.1767 D B H + 0.3755 0.970.5–23.12379
15 H = 0.0426 D B H 2 + 1.5205 D B H 0.6716 0.961.0–17.63138
16 H = 0.0281 D B H 2 + 1.2453 D B H + 0.0417 0.950.5–19.82639
17 H = 0.0235 D B H 2 + 1.1212 D B H + 0.7610 0.950.5–24.53646
18 H = 0.0277 D B H 2 + 1.2347 D B H + 0.2426 0.940.5–26.23438
22 H = 0.0489 D B H 2 + 1.6230 D B H 0.7826 0.950.5–20.12576
29 H = 0.0263 D B H 2 + 1.2350 D B H + 0.1314 0.960.5–24.22576

References

  1. Pawlaczyk, E.M.; Bobowicz, A.M.; Lesiczka, P. Genetyczne zróżnicowanie czterech rodów jodły pospolitej (Abies alba Mill.) z rezerwatu Tisovik. In Zarządzanie Ochroną Przyrody w Lasach; Wyższa Szkoła Zarządzania Środowiskiem w Tucholi: Tuchola, Poland, 2010; pp. 120–138. [Google Scholar]
  2. Krekova, Y.; Chebotko, N.; Kagan, D.; Ivanovskaya, S.; Vibe, S.; Kabanov, A. The growth rate and genetic variability of Scots pine (Pinus sylvestris L.) half-sibs in test crops of Northern Kazakhstan. Not. Bot. Horti Agrobot.-Cluj-Napoca 2023, 51, 13261. [Google Scholar] [CrossRef]
  3. Maslâk, S.M.; Železnowa, T.W.; Karlûkewič, A.; Fedorowa, I.A.; Dawidowič, O.W.; Bužinskaâ, E.I.; Âzykowič, L.W.; Nikiforow, M.E.; Parfenow, W.I.; Čajkowskij, A.I.; et al. Krasnaja Kniga Respubliki Belarus: Rastenija. Redkie i Nahodjaščiesja pod Ugrozoj Isčeznovenija Vidy Dikorastuščih Rastenij (The Red Data Book of the Republic of Belarus: Plants. Rare and Endangered Species of Wild Plants); Belarus Publishing House: Minsk, Belarus, 2025. [Google Scholar]
  4. Korczyk, A.F.; Kawecka, A.; Martysevič, V.V.; Strelkov, A.Z. Naturalne stanowisko jodły pospolitej (Abies alba Mill.) w Puszczy Białowieskiej. Pr. Inst. Badaw. Leśn. Ser. A 1997, 837, 27–62. [Google Scholar]
  5. Korczyk, A.F. The ancestral conservative tillage of silver fir in the “Tisovik” reserve of the Białowieża Primeval Forest. Leśn. Pr. Badaw. 2015, 76, 153–167. [Google Scholar] [CrossRef][Green Version]
  6. Korczyk, A.F. The “Tisovik” reserve of Silver fir in the Belarusian national park “Belavezhskaya Pushcha”. Leśn. Pr. Badaw. 2015, 76, 18–36. [Google Scholar] [CrossRef][Green Version]
  7. Giertych, M. Pozytywne oddziaływanie człowieka na strukturę genetyczną drzew leśnych. In Elementy Genetyki i Hodowli Selekcyjnej Drzew Leśnych; Sabor, J., Ed.; CILP: Warszawa, Poland, 2006; pp. 429–437. [Google Scholar]
  8. Lasy Państwowe. Wytyczne Dotyczące Ochrony Leśnych Zasobów Genowych na Potrzeby Nasiennictwa i Hodowli Drzew Leśnych; Technical Report; Dyrektor Generalny Lasów Państwowych: Warszawa, Poland, 2013.
  9. Minister of the Environment. Rozporządzenie Ministra Środowiska z Dnia 23 Kwietnia 2004 r. w Sprawie Szczegółowych Wymagań, Jakie Powinien Spełniać Leśny Materiał Podstawowy (Regulation of the Minister of the Environment of 23 April 2004 on Detailed Requirements to Be Met by Forest Reproductive Material). Dz.U. 2004 nr 100 poz. 1026. Available online: https://isap.sejm.gov.pl/isap.nsf/DocDetails.xsp?id=WDU20041001026 (accessed on 7 May 2024).
  10. Klisz, M.; Ukalski, K.; Ukalska, J.; Jastrzebowski, S.; Puchałka, R.; Przybylski, P.; Mionskowski, M.; Matras, J. What Can We Learn from an Early Test on the Adaptation of Silver Fir Populations to Marginal Environments? Forests 2018, 9, 441. [Google Scholar] [CrossRef]
  11. Marozau, A.; Kotszan, U.; Nowakowska, J.; Berezovska, D.; Moser, W.K.; Hsiang, T.; Oszako, T. The Influence of the Provenance and Spatial Structure on the Growth of European Silver Fir (Abies alba Mill.) of Autochthonous Origin in a Forest Plantation in the Białowieża Forest. Forests 2022, 13, 831. [Google Scholar] [CrossRef]
  12. Caudullo, G.; Welk, E.; San-Miguel-Ayanz, J. Chorological maps for the main European woody species. Data Brief 2017, 12, 662–666. [Google Scholar] [CrossRef] [PubMed]
  13. Tomczyk, A.; Bednorz, E. Atlas Klimatu Polski (1991–2020); Bogucki Wydawnictwo Naukowe: Poznań, Poland, 2022; p. 124. [Google Scholar]
  14. He, Z.; Xiao, Y.; Lv, Y.; Yeh, F.C.; Wang, X.; Hu, X. Prediction of Genetic Gains from Selection in Tree Breeding. Forests 2023, 14, 520. [Google Scholar] [CrossRef]
  15. Bank Danych o Lasach. Portal Banku Danych o Lasach. 2026. Available online: https://www.bdl.lasy.gov.pl/portal/ (accessed on 10 January 2026).
  16. Bledý, M.; Vacek, S.; Brabec, P.; Vacek, Z.; Cukor, J.; Černý, J.; Ševčík, R.; Brynychová, K. Silver Fir (Abies alba Mill.): Review of Ecological Insights, Forest Management Strategies, and Climate Change’s Impact on European Forests. Forests 2024, 15, 998. [Google Scholar] [CrossRef]
  17. Gončarenko, G.G.; Sawickij, B.P. Populacionno-Genetičeskie Resursy Pichty Beloj v Belarusi; Polespecat: Gomel, Belarus, 2000; p. 122. [Google Scholar]
  18. Gonczarenko, G.G. Analysis of Population Genetic Resources (on the Example of White Fir in Belarus); F. Skorina Gomel State University: Gomel, Belarus, 2002; p. 112. [Google Scholar]
  19. Mittenbühler, I.K.; Gailing, O.; Müller, M. Genetic variation of silver fir (Abies alba Mill.) in the Palatinate Forest. Silvae Genet. 2025, 74, 133–143. [Google Scholar] [CrossRef]
  20. Szymkiewicz, B. Tablice Zasobności i Przyrostu Drzewostanów Ważniejszych Gatunków Drzew Leśnych; PWRiL: Warszawa, Poland, 2001; p. 179. [Google Scholar]
  21. Tinner, W.; Colombaroli, D.; Heiri, O.; Henne, P.D.; Steinacher, M.; Untenecker, J.; Vescovi, E.; Allen, J.R.M.; Carraro, G.; Conedera, M.; et al. The past ecology of Abies alba provides new perspectives on future responses of silver fir forests to global warming. Ecol. Monogr. 2013, 83, 419–439. [Google Scholar] [CrossRef]
  22. Marozau, A.; Bagińska, E.; Kalaji, H.M.; Wilamowski, K.; Oszako, T.; Borowik, P. Adaptive performance of autochthonous silver fir (Abies alba Mill.) outside its natural range: Growth and chlorophyll fluorescence in the Białowieża Forest. Eur. J. For. Res. 2026, 145, 57. [Google Scholar] [CrossRef]
Figure 1. Location of the study site (visualization of data from Caudullo et al. [12]).
Forests 17 00572 g001
Figure 2. (IIII) View of the study plots from above (photo: Konrad Wilamowski).
Forests 17 00572 g002
Figure 3. Silver fir DBH characteristics by half-sib families in Plot I compared with the mean and maximum values in the stands of the State Forests. The letters next to the family numbers indicate significant differences between the factors. An asterisk next to a bar indicates that the mean DBH of the half-sib family differs significantly from the mean or maximum value observed in the State Forests.
Forests 17 00572 g003
Figure 4. Silver fir DBH characteristics by half-sib families in Plots II and III compared with the mean and maximum values in the stands of the State Forests. The letters next to the family numbers indicate significant differences between the factors. An asterisk next to a bar indicates that the mean DBH of the half-sib family differs significantly from the mean or maximum value observed in the State Forests.
Forests 17 00572 g004
Figure 5. Silver fir H characteristics by half-sib families in Plot I compared with the mean and maximum values in stands of the State Forests. The letters next to the family numbers indicate significant differences between the factors. An asterisk next to a bar indicates that the mean H of the half-sib family differs significantly from the mean or maximum value observed in the State Forests.
Forests 17 00572 g005
Figure 6. Silver fir H characteristics by half-sib families in Plots II and III compared with the mean and maximum values in stands of the State Forests in Poland. The letters next to the family numbers indicate significant differences between the factors. An asterisk next to a bar indicates that the mean H of the half-sib family differs significantly from the mean or maximum value observed in the State Forests.
Forests 17 00572 g006
Figure 7. The 95th percentile of DBH and H for each half-sib family in Plot I.
Forests 17 00572 g007
Figure 8. The 95th percentile of DBH and H for each half-sib family in Plots II–III.
Forests 17 00572 g008
Table 1. Average values of silvicultural parameters for silver fir half-sibs and for the entire population.
Half-Sib CodeNumber of Trees (pcs)DBH ± SD (cm); CV (%)H ± SD (m); CV (%)
IIIIIIIII + IIIIII + III
1310910.5 ± 3.5; 33.37.6 ± 4.0; 52.611.0 ± 3.2; 29.17.6 ± 3.3; 43.4
215137612.0 ± 5.0; 41.77.3 ± 4.3; 58.911.5 ± 3.4; 29.67.3 ± 3.3; 45.2
3286110.3 ± 4.2; 40.87.9 ± 4.6; 58.211.0 ± 2.6; 23.67.4 ± 3.4; 45.9
42486749.1 ± 4.2; 46.19.2 ± 4.7; 51.110.7 ± 3.6; 33.68.8 ± 3.7; 42.0
56858910.3 ± 4.2; 40.89.4 ± 4.5; 47.911.2 ± 3.2; 28.59.2 ± 3.7; 40.2
630229.9 ± 5.2; 52.59.6 ± 4.1; 42.7
71458.3 ± 5.0; 60.28.4 ± 3.9; 46.4
875638.7 ± 4.4; 50.68.9 ± 3.2; 35.9
9274910.4 ± 6.1; 58.79.3 ± 4.2; 45.1
1134286011.6 ± 4.5; 38.89.4 ± 4.9; 52.111.9 ± 2.5; 21.08.9 ± 3.4; 38.2
1217293412.7 ± 4.1; 32.39.9 ± 4.8; 48.512.7 ± 2.0; 15.79.4 ± 3.0; 31.9
1313168.2 ± 5.5; 67.17.6 ± 3.9; 51.3
15179612111.8 ± 5.3; 44.98.4 ± 4.7; 56.010.7 ± 3.5; 32.78.2 ± 3.7; 45.1
168333410.0 ± 3.6; 36.07.0 ± 4.7; 67.111.4 ± 2.6; 22.86.7 ± 3.7; 55.2
17155235513.4 ± 5.3; 39.68.3 ± 5.7; 68.712.3 ± 2.9; 23.67.7 ± 3.8; 49.4
18543510.3 ± 6.5; 63.18.9 ± 4.0; 44.9
21111111.0 ± 4.9; 44.57.7 ± 6.4; 83.111.0 ± 3.3; 30.07.2 ± 4.2; 58.3
2216178.6 ± 5.6; 65.18.0 ± 3.8; 47.5
2359.9 ± 5.3; 53.59.1 ± 3.4; 37.4
2918157.8 ± 6.0; 76.97.2 ± 4.1; 56.9
Total67867656411.9 ± 5.0; 42.08.9 ± 5.1; 57.311.4 ± 3.2; 28.18.5 ± 3.7; 43.5
SD—standard deviation, CV—coefficient of variation.
Table 2. Average DBH and H of comparative stands from State Forests depending on selected physico-geographical and climatic factors.
Factor28 Years31 Years
NDBH ± SDH ± SDNDBH ± SDH ± SD
Elevation
Lowlands96.3 ± 2.1 a7.2 ± 1.9 a97.1 ± 1.8 a8.2 ± 2.8 a
Uplands517.0 ± 1.3 b6.9 ± 1.9 a447.7 ± 1.6 b9.3 ± 2.7 a
Mountains277.1 ± 1.8 b6.6 ± 1.7 a867.8 ± 1.9 b9.2 ± 2.4 a
Annual precipitation sum
up to 600 mm47.5 ± 3.3 a8.0 ± 2.2 a96.8 ± 1.0 a8.8 ± 2.8 a
600–700 mm256.9 ± 1.2 a7.1 ± 1.4 a177.7 ± 1.5 b9.6 ± 2.5 a
above 700 mm587.0 ± 1.6 a6.6 ± 2.0 a1137.8 ± 1.9 b9.1 ± 2.5 a
Mean annual air temperature
below 8 °C66.3 ± 0.8 a5.7 ± 1.6 a207.4 ± 1.8 a8.4 ± 2.3 a
8.0–8.5 °C557.2 ± 1.8 a6.8 ± 1.9 a877.8 ± 1.9 a9.3 ± 2.6 a
above 8.5 °C266.7 ± 1.2 a7.2 ± 1.6 a327.6 ± 1.5 a9.2 ± 2.3 a
Length of growing season
up to 225 days197.1 ± 2.2 a6.8 ± 2.1 a517.7 ± 1.8 a9.0 ± 2.7 a
225–230 days587.0 ± 1.4 a6.8 ± 1.8 a747.7 ± 1.7 a9.0 ± 2.2 a
above 230 days106.6 ± 0.8 a7.1 ± 1.7 a147.9 ± 2.0 a10.4 ± 2.5 a
Mean 7.0 ± 1.66.8 ± 1.81397.7 ± 1.89.1 ± 2.5
Median 7.07.0 7.09.0
Max 15.013.0 14.016.0
N—Number of stands (pcs), SD—standard deviation. Identical lowercase letters next to mean values indicate no statistically significant differences between the factors; different letters denote statistically significant differences (Kruskal–Wallis ANOVA with Dunn–Bonferroni post-hoc test, α = 0.05).
Table 3. Selection differential (S) of half-sib families with respect to primary phenotypic parameters.
Half-Sib CodeS (DBH)S (H)
Plot IPlots II + IIIPlot IPlots II + III
1−1.4−1.3−0.4−0.9
2+0.1−1.6+0.1−1.2
3−1.6−1.0−0.4−0.9
4−2.8+0.3−0.7+0.3
5−1.6+0.5−0.2+0.7
6+1.0+1.1
7-0.6−0.1
8-0.2+0.4
9+1.5+0.8
11−0.3+0.5+0.5+0.5
12+0.8+1.0+1.3+0.9
13−0.7−0.9
15−0.1−0.5−0.7−0.3
16−1.9−1.90−1.8
17+1.5−0.5+0.9−0.8
18+1.4+0.4
21−0.9−1.2−0.4−1.3
22−0.3−0.5
23+1.0+0.6
29−1.1−1.3
Table 4. The best individuals as prototype plus trees selected within respective half-sib families and also within the phenotypically superior half-sibs.
Graft IDHalf-Sib FamilyPlotRowTree No.DBH [cm]H [m]
11II43415.613.2
22I131026.017.6
32I271222.917.4
43II5923.014.6
54II401523.615.2
65II45622.114.7
76II111319.213.6
87III4821.315.7
98III26319.613.6
109III121527.014.5
1111I161322.016.4
1211III16524.214.3
1312I8320.415.3
1412III20520.414.9
1513II23923.115.8
1615I211028.719.5
1715I39928.115.9
1816II281123.013.0
1917I50527.817.0
2017I22825.816.4
2117I42725.715.9
2217I50424.417.1
2317I50624.414.2
2417II301124.515.6
2518II31526.214.5
2618III27925.414.7
2721II33819.813.4
2822II34720.113.0
2923II36316.612.2
3029II38824.214.0
Disclaimer/Publisher’s Note: The statements, opinions and data contained in all publications are solely those of the individual author(s) and contributor(s) and not of MDPI and/or the editor(s). MDPI and/or the editor(s) disclaim responsibility for any injury to people or property resulting from any ideas, methods, instructions or products referred to in the content.