Article

Impact of Forest Operations Planning on Greenhouse Gas Emissions

Department of Forest Utilization, Institute of Forest Sciences, Warsaw University of Life Sciences—SGGW, 159 Nowoursynowska St., 02-776 Warsaw, Poland
*
Author to whom correspondence should be addressed.
Forests 2026, 17(3), 388; https://doi.org/10.3390/f17030388
Submission received: 26 January 2026 / Revised: 3 March 2026 / Accepted: 16 March 2026 / Published: 20 March 2026

Abstract

This study investigates how key planning variables—the number of wood assortments, the geometric shape of clear-cut areas, and the extraction (forwarding) distance—influence greenhouse gas (GHG) emissions. Twelve plots formed a heterogeneous sample with similar site type and soil moisture conditions. A Komatsu 931 harvester and a 855 forwarder, driven by the experienced operators, were used to ensure consistency in operator skill. For each plot, the isoperimetric quotient was computed to quantify how plot shape correlated with labor hours, fuel consumption, and the resulting volume of GHG emitted. The number of assortments extracted per plot ranged from three to fourteen product groups. The results show that plots with more complex shapes require significantly more operator time and fuel. Increasing the number of assortments amplifies handling time and fuel use. Longer extraction distances further exacerbate the emissions. These findings underscore the importance of integrating spatial geometry and wood assortment planning into harvest scheduling to enhance productivity and reduce the carbon footprint of forest operations. Recommendations for practitioners include prioritizing more compact treatment units, optimizing assortment grouping, and minimizing extraction distances as key strategies for precision forestry.

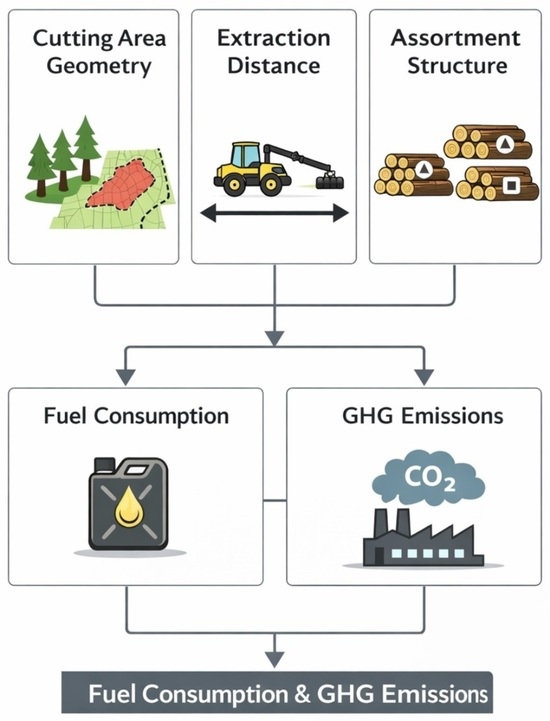
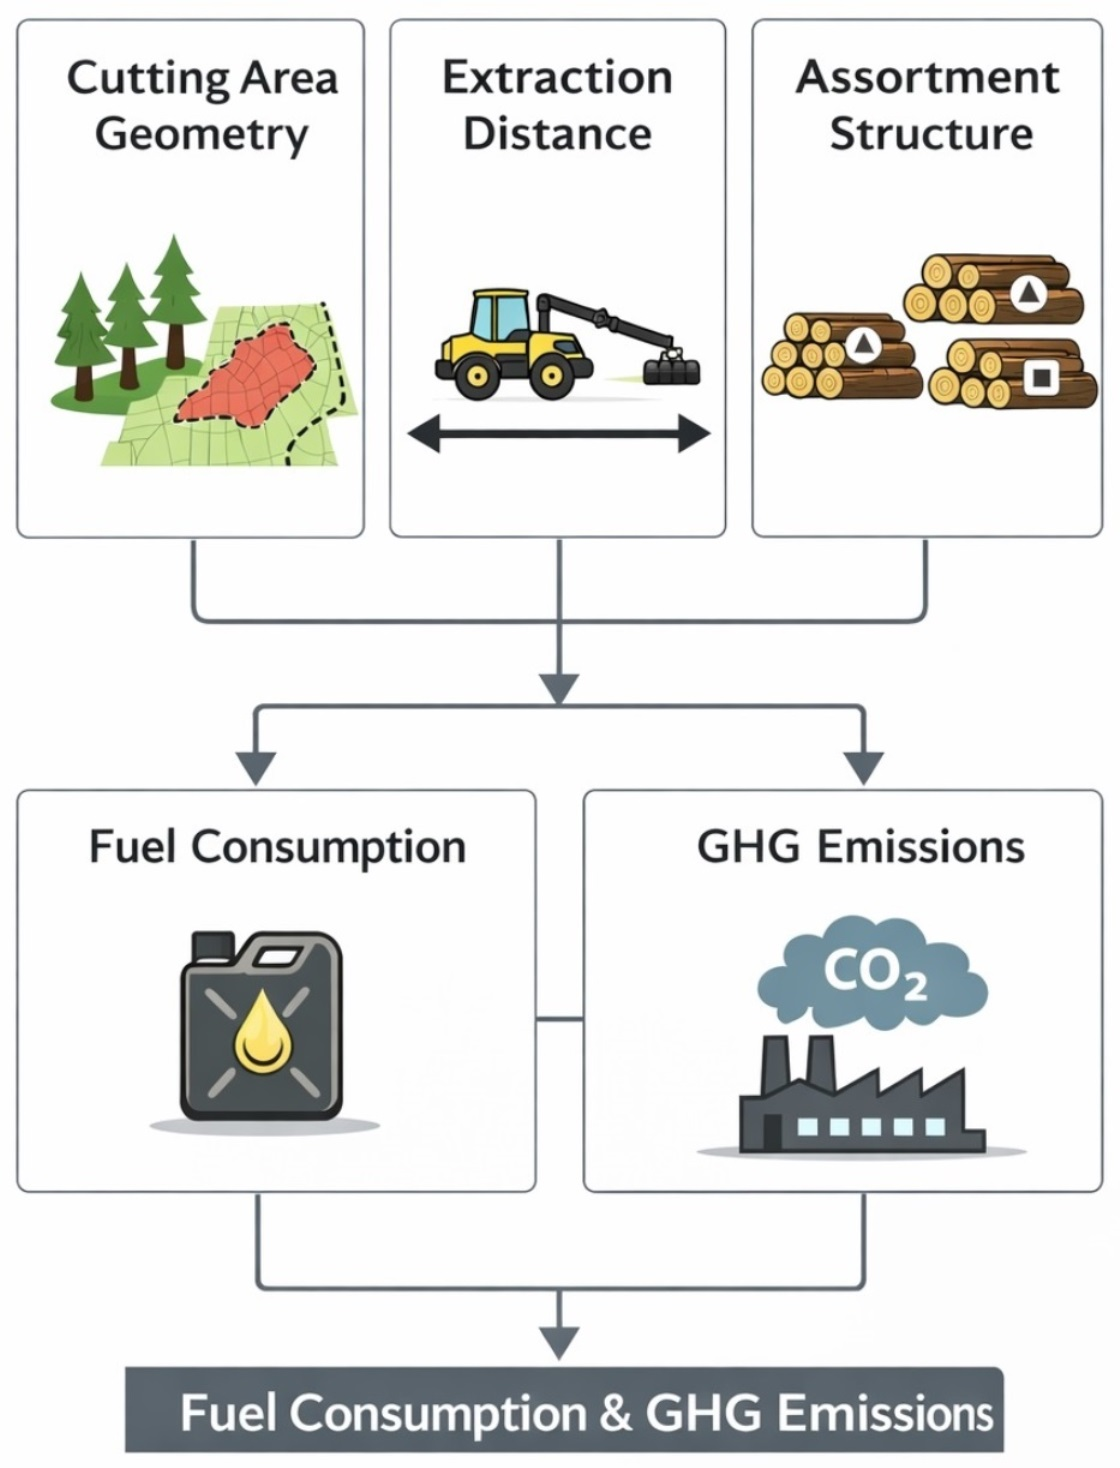
Graphical Abstract

1. Introduction

Timber harvesting is a fundamental aspect of forest management. In many developed countries, timber harvesting and transportation are mainly mechanized using the cut-to-length (CTL) system, which relies on harvesters and forwarders. This system ensures high productivity and cost efficiency [1,2,3,4].
Climate change driven by increased greenhouse gas (GHG) emissions is forcing transformations across various sectors of the economy, including forestry [5,6]. Forestry has traditionally been considered climate-friendly due to forests’ ability to absorb CO2. Forest operations, such as harvesting and transporting timber, emit carbon dioxide and other greenhouse gases from machinery fuel consumption [7,8]. On a global scale, timber harvesting activities generate a significant, though often overlooked, carbon footprint. Reducing this footprint is an essential part of sustainable forest management and is consistent with climate policy objectives and the development of the bioeconomy [9,10]. GHGs primarily include carbon (CO2, CH4), nitrogen (N2O), and fluorine compounds—hydrofluorocarbons (HFCs), perfluorocarbons (PFCs), sulfur hexafluoride (SF6), and nitrogen trifluoride (NF3). Due to the wide range of substances that make up greenhouse gases, for this study, the term GHG is understood as carbon dioxide equivalent (CO2e).
Another critical factor in reducing emissions is the increasing legal and technical requirements for forestry equipment [11,12]. Modern harvesters and other machines use advanced diesel engines that comply with off-road machinery emission standards. In the European Union, Stage standards apply (the most recent of which is Stage V), while in the United States, equivalent standards are known as Tier standards (e.g., Tier 4 Final) [13,14]. These standards limit the emission of pollutants, such as nitrogen oxides (NOx) and particulate matter (PM), and require the use of exhaust gas treatment technologies, including particulate filters, selective catalytic reduction (SCR) systems, and exhaust gas recirculation (EGR) systems.
An indirect side effect is often improved fuel consumption efficiency, which reduces the CO2 emissions per unit of work performed. Additionally, initiatives are being implemented to use alternative fuels, such as biodiesel, and hybrid or electric drives in forestry machines. These initiatives may significantly reduce future greenhouse gas emissions from timber harvesting processes [15,16,17].
Despite these technological advances, operational planning remains a decisive factor in minimizing the carbon footprint. Properly planned work can maximize the potential of modern machines, e.g., by planning machine passes under optimal terrain and weather conditions, reducing downtime, and synchronizing the work of harvesters and forwarders to minimize idle time and fuel use [18,19,20].
Previous studies have mainly focused on the impact of individual technologies on productivity or emissions. In contrast, comprehensive forest planning to improve work efficiency and reduce emissions has received less attention. Precision forestry is a multifaceted concept encompassing a range of methodologies, including holistic planning for forestry operations. This approach involves meticulously considering geometric parameters, such as clearings and the strategic organization of wood assortments [21,22]. The underlying principles of this concept, termed “site-specific activities,” facilitate the concurrent optimization of economic and ecological objectives by utilizing comprehensive spatial and environmental data.
Adequate planning of timber harvesting operations, in addition to minimizing timber transport distance, has been demonstrated to substantially reduce machinery fuel consumption, thereby decreasing CO2 emissions [23,24,25]. The timber forwarding process involves moving logs from the felling site to the forest road. It has been demonstrated that proximity to these thoroughfares directly correlates with reduced fuel consumption and costs [26,27].
In Poland, the average density of the forest road network is approximately 15.3 m/ha. The road density results from a cost–benefit analysis of road construction and maintenance versus the timber value delivered [28].
The object of this study was the operational performance, fuel consumption, and GHG emissions of a fully mechanized cut-to-length (CTL) harvesting system operating in clear-cut conditions, in relation to forest operation planning variables. This study aimed to test the following criteria concerning the impact of four planning factors on the efficiency of forestry machinery:
  • The length of the planned skid trail.
  • The number of assortments prepared.
  • The proportion of assortments ≥ 3 m and ≥5 m in length.
  • The shape of the felling area as described by the isoperimetric quotient.
It was verified whether these factors affected the fuel consumption (and, indirectly, greenhouse gas emissions) of the harvester and forwarder. The study treated the timber harvesting and forwarding process as a uniform technical and spatial system. The choice of assortments, storage locations and surface shape were found to affect energy consumption and CO2 emissions. The study covered only emissions from fuel consumption during forestry work. Emissions related to processes such as the production of forestry machinery, and the construction of haul roads, were not taken into account. It was determined whether there were statistically significant correlations between planning parameters (e.g., assortment length) and work efficiency and fuel consumption.

2. Materials and Methods

The research aims to conduct an integrated, multi-factor assessment of how planning factors influence fuel consumption and CO2 emissions when using a harvester–forwarder tandem in forest conditions in western Poland. This is an empirical validation of whether the factors identified in numerous publications apply to the region under study under similar conditions.
The study examined a total of 12 clear-cut plots located in western Poland in the area of the regional directorate of State Forests in Zielona Góra. Prior to felling, the upper story of the tree stand in all the studied plots consisted of an 80–120-year-old Scots pine (Pinus sylvestris L.) monoculture (Table 1). The habitat type and soil moisture levels were similar. The work was executed using a single set of machines produced by Komatsu Forest AB (Umea, Sweden) (the Komatsu 931 harvester with the C124 head, with a gross weight of 21,120 kg and an engine power of 190 kW, and the Komatsu 855 forwarder, weighing 18,387 kg and equipped with a 187 kW engine) operated by the same experienced operators to eliminate any differences resulting from operator qualifications. The harvester was operated by a person with 20 years of experience in working with forestry machines. He has been working with the studied Komatsu 931 harvester since the beginning of 2023. The forwarder was operated by a second person who also had over a dozen years of forest work experience. He has also been operating the research machine since the beginning of 2023. The terrain conditions were good. The terrain slope did not exceed 8% (average slope was 4.5%), and the harvested areas did not contain any water reservoirs/peat bogs, nor were they adjacent to public roads. The terrain was uniform, with no obstacles. The analysis identified the factors contributing to plot diversity: their shape or isoperimetric ratio, area, number of planned assortments, assortments’ length, and average forwarding distance.
The necessary data on felling plots, wood extraction lengths, and storage locations were obtained from the contractor’s records at the Forest Transport Center (FTC) in Gorzów Wielkopolski, Poland. The machines were equipped with GPS modules and Komatsu’s Smart Forestry monitoring system, developed by Komatsu Forest AB (Umea, Sweden), which enabled work tracking and the determination of detailed performance parameters. The following data were retrieved from the Smart Forestry system: the distance traveled (km), the fuel consumption (L) per hour of operation and per unit of processed wood (L/m3), the operating time on each surface, the number of trees felled and logs produced, the number and volume of harvested assortments, and the assortment volume in each product type. The assortments produced in the surveyed plots ranged in length from 1.6 m to 14 m. Sawmill timber was harvested in lengths from 6 m to 14 m, divided into four quality classes. In addition, timber was harvested in the form of logs in lengths of 5 m, 3 m, 2.7 m, 2.5 m, 2.4 m, 1.8 m, and 1.6 m, as well as firewood in lengths of 1.6 m and 1.4 m. Pine, birch, beech, and other species also appeared in small quantities in the harvested wood.
The isoperimetric quotient ( Q ) was calculated for each surface using the following formula:
Q = 4 π A P 2
where
  • A : plot area [m2].
  • P : perimeter [m].
The isoperimetric quotient is the ratio of a figure’s area to the square of its perimeter, multiplied by the constant 4π. For a flat figure, this quotient is always less than or equal to 1; equality only occurs for a circle. This parameter has previously been used in studies on machine performance [29,30]. The obtained data determined the percentage of the harvested volume produced in lengths of 5 m or greater and 3 m or greater for each studied surface. To assess the greenhouse gas (GHG) emissions, a value of 2.69 g CO2/L was adopted, based on information in related publications [11,29,31]. These values are indicative, as exact GHG emissions depend on factors such as fuel quality, catalytic system efficiency, and the general technical machine’s condition [32,33,34,35].
The research was conducted to test the following hypotheses:
Hypothesis H1.
The transport distance of the timber most strongly determines the forwarder’s fuel consumption.
Hypothesis H2.
More assortments produced on the surface result in higher fuel consumption for both machines.
Hypothesis H3.
The greater the proportion of long assortments produced on the surface, the lower the fuel consumption coefficient.
Hypothesis H4.
The value of the isoperimetric coefficient affects the length of the machine travel, particularly for forwarders, which results in higher fuel consumption.
The normality of the data distribution was tested using the Shapiro–Wilk test. Pearson’s linear correlation coefficient was used to examine relationships among normally distributed variables, while Spearman’s rank correlation coefficient was used for non-normally distributed variables.
The relationships between the selected parameters and unit CO2 emissions were illustrated using linear regression and fitted LOESS curves. These calculations were performed in the R environment (v4.4.1) using the ‘ggplot2’, ‘dplyr’, ‘readxl’, ‘plotly’, ‘tidyr’, ‘janitor’ and ‘patchwork’ packages.
The clear-cuts in the sample ranged in size from 1.65 to 6.92 ha, and the plots’ perimeters ranged from 600.6 to 2789.0 m. The isoperimetric quotient ranged from 0.090 to 0.573. The lowest quotient was obtained for plot 11, which was very irregular in shape, and the highest quotient was obtained for plot 5. The harvested volume varied significantly (from 423.8 to 1946.2 m3), as did the average trunk volume (from 0.33 to 1.05 m3).
Most analyzed parameters met the normality criteria. The exceptions were the distributions of the number of assortments and the share of assortments with lengths ≥ 3 m and ≥5 m, which were non-normal. The same assortment shares and the variable “L/m3 of wood” also showed an irregular distribution in the forwarder data. Multicollinearity among the selected operational predictors (area, perimeter, number of assortments, extraction distance, number of logs, processed wood volume, and fuel consumption) was evaluated using the Belsley condition index. The analysis was conducted on standardized variables (z-scores) to eliminate scale effects. The condition index (CI) was calculated from the singular value decomposition of the standardized predictor matrix. Interpretation followed conventional thresholds: CI < 10 (low), 10–30 (moderate), and >30 (strong multicollinearity). The rank of the design matrix was verified to exclude exact linear dependencies prior to analysis.

3. Results

The harvester produced 4 to 14 assortments per plot. No clear correlation was observed between the number of assortments and the felling area. More assortments were usually harvested on plots with a higher average timber volume, without significantly reducing the machine’s efficiency. For example, plot 8 had 14 assortments. However, the average harvester indicators (efficiency and fuel consumption) were similar to those of plots with fewer assortments (Table 2).
The harvester’s specific fuel consumption clearly depended on the size of the harvested trees and the length of the assortments obtained. In plots with small trees and no long logs—such as plot 1, where none of the sections were longer than 5 m—the fuel consumption was the highest, reaching 0.98 L/m3. By contrast, in plot 10, which had a large proportion of long logs (60% of logs were more than 5 m long) and a higher average weight of individual trees, the harvester consumed only 0.58 L/m3 of wood processed.
There was a strong negative correlation between the average weight of a single tree and unit fuel consumption—the larger the trees (and the longer the sections), the less fuel needed per unit of harvested raw material. For instance, in plot 11, where the average tree volume was 1.05 m3, the unit fuel consumption was 0.73 L/m3; in plot 1, where the average tree volume was 0.33 m3, the unit fuel consumption was 0.98 L/m3.
The predictor matrix was of full rank, indicating that there were no exact linear dependencies among the variables. The maximum condition index was 46.7 for the number of stems and logs, suggesting strong multicollinearity. Elevated values were primarily associated with structural relationships between stand density indicators, harvested volume, and fuel consumption. Also, there was visible multilinearity between the amount of processed wood and the fuel used.
The average hourly intensity of the harvester engine was 16.6 L/h (average fuel consumption per hour of operation). This parameter was relatively constant, ranging from 13.2 to 18.6 L/h under various plot and tree stand conditions.
Upon analyzing the forwarder’s performance data, it became evident that performance varied by the plot where the work was carried out. From the volume of timber harvested by the harvester, 79% was picked up using the forwarder under test. The remaining 21% consisted of timber that was so long that other technical measures were required. The details of the forwarder’s work are summarized in Table 3.
The average forwarding productivity was 13.27 m3/h. However, in plots with large individual log volumes, it increased to 21.1 m3/h, comparable to a harvester’s average fuel consumption. The lowest productivity (9.1 m3/h) was recorded in plot 11, which had the longest extraction distance (500 m).
The average fuel consumption per cubic meter of wood was 0.91 L, but this value varied greatly depending on the transportation distance. In plots with a forwarding distance of 200 m, the value was 0.68 L/m3; in plots with a distance of 500 m, the value increased to 1.63 L/m3. Other factors influencing the fuel consumption were also noted. Logs with a small volume required a large amount of fuel. For example, in plot 11, the average single log was 0.06 m3, and the fuel consumption was 1.01 L/m3—the size of the transported logs affected the fuel consumption. The impact is nonlinear because the fuel consumption initially decreased as the average log volume increased (plots 6 and 10). The volume of individual logs is associated with a high weight, which limits the forwarder’s load capacity, leading to more trips and higher fuel consumption. In terms of hours, the forwarder consumed less fuel—an average of 13.4 L/h—most likely because its engine load was more constant than that of the harvester.
The plot’s shape (the isoperimetric quotient) did not significantly affect emissions. Although irregular plots required longer machine runs, especially for forwarders, these differences did not directly translate into increased unit fuel consumption.
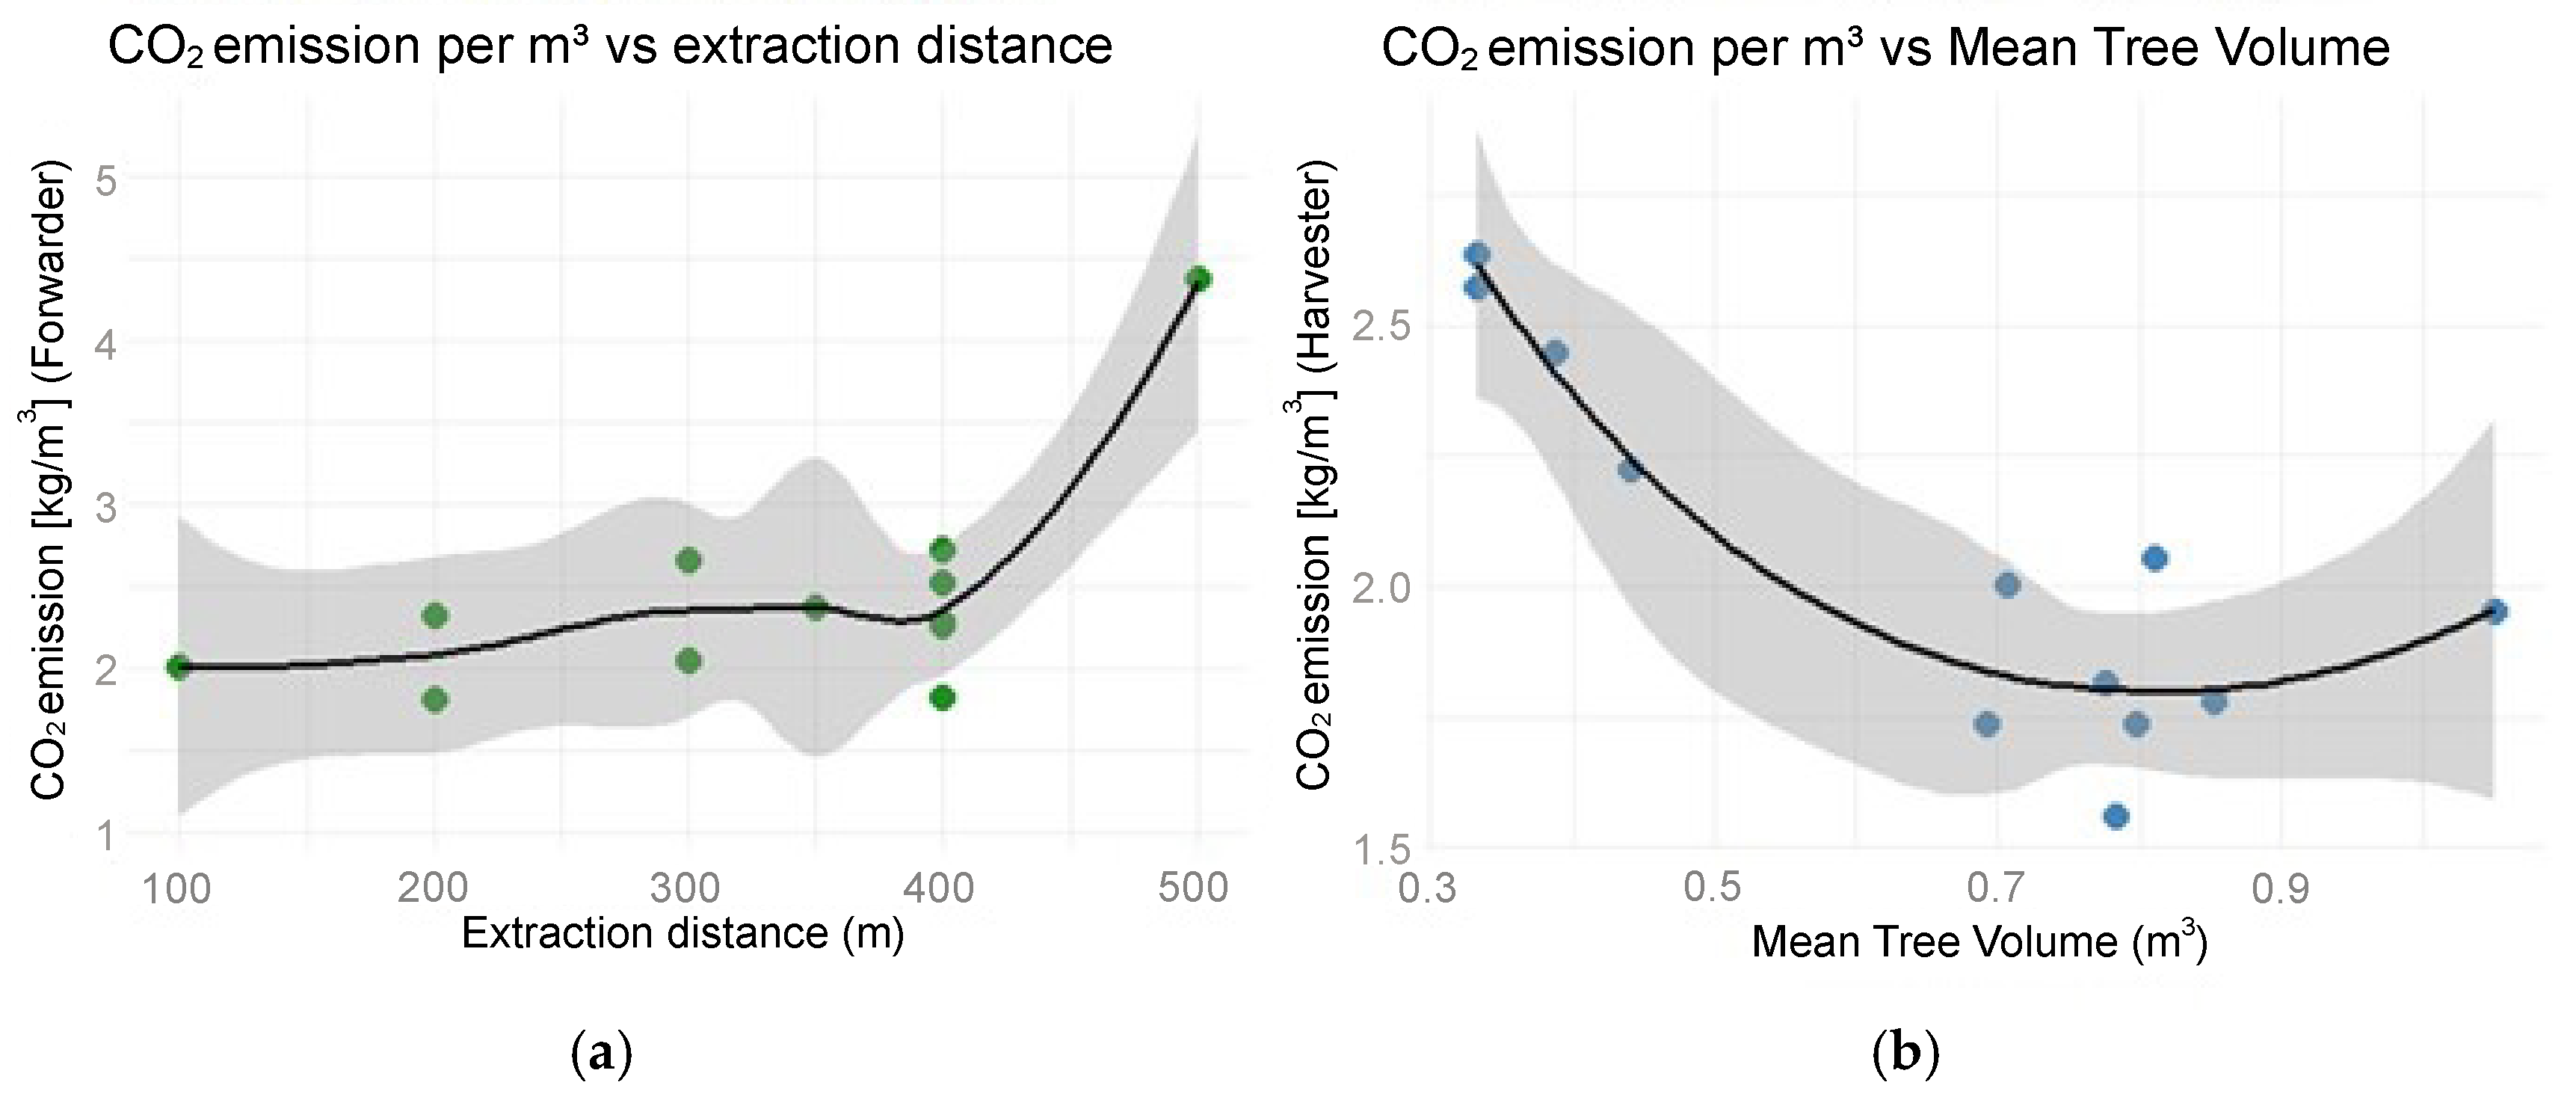
Although the isoperimetric ratio does not affect fuel consumption as much as the hauling distance, its independence from scale, dimensionlessness, and a clear geometric interpretation make it a useful empirical descriptive measure. The factors that had a real impact on fuel combustion, and thus CO2 emissions, were the distance of skidding and the size of the assortments. In the case of stands with a larger average volume, emissions tended to be lower (Figure 1).
Based on the analysis of the relationships among the studied parameters, it can be concluded that the total distance covered by the machines was determined by the plot size and, for the forwarder, by the extraction distance. Based on the sample studied, no significant effect of the isoperimetric coefficient on fuel consumption was found. The research confirmed that the plot shape (i.e., the isoperimetric quotient) did not have a statistically significant impact on the fuel consumption of the forestry machines in the analyzed sample. Therefore, Hypothesis H1 was rejected.
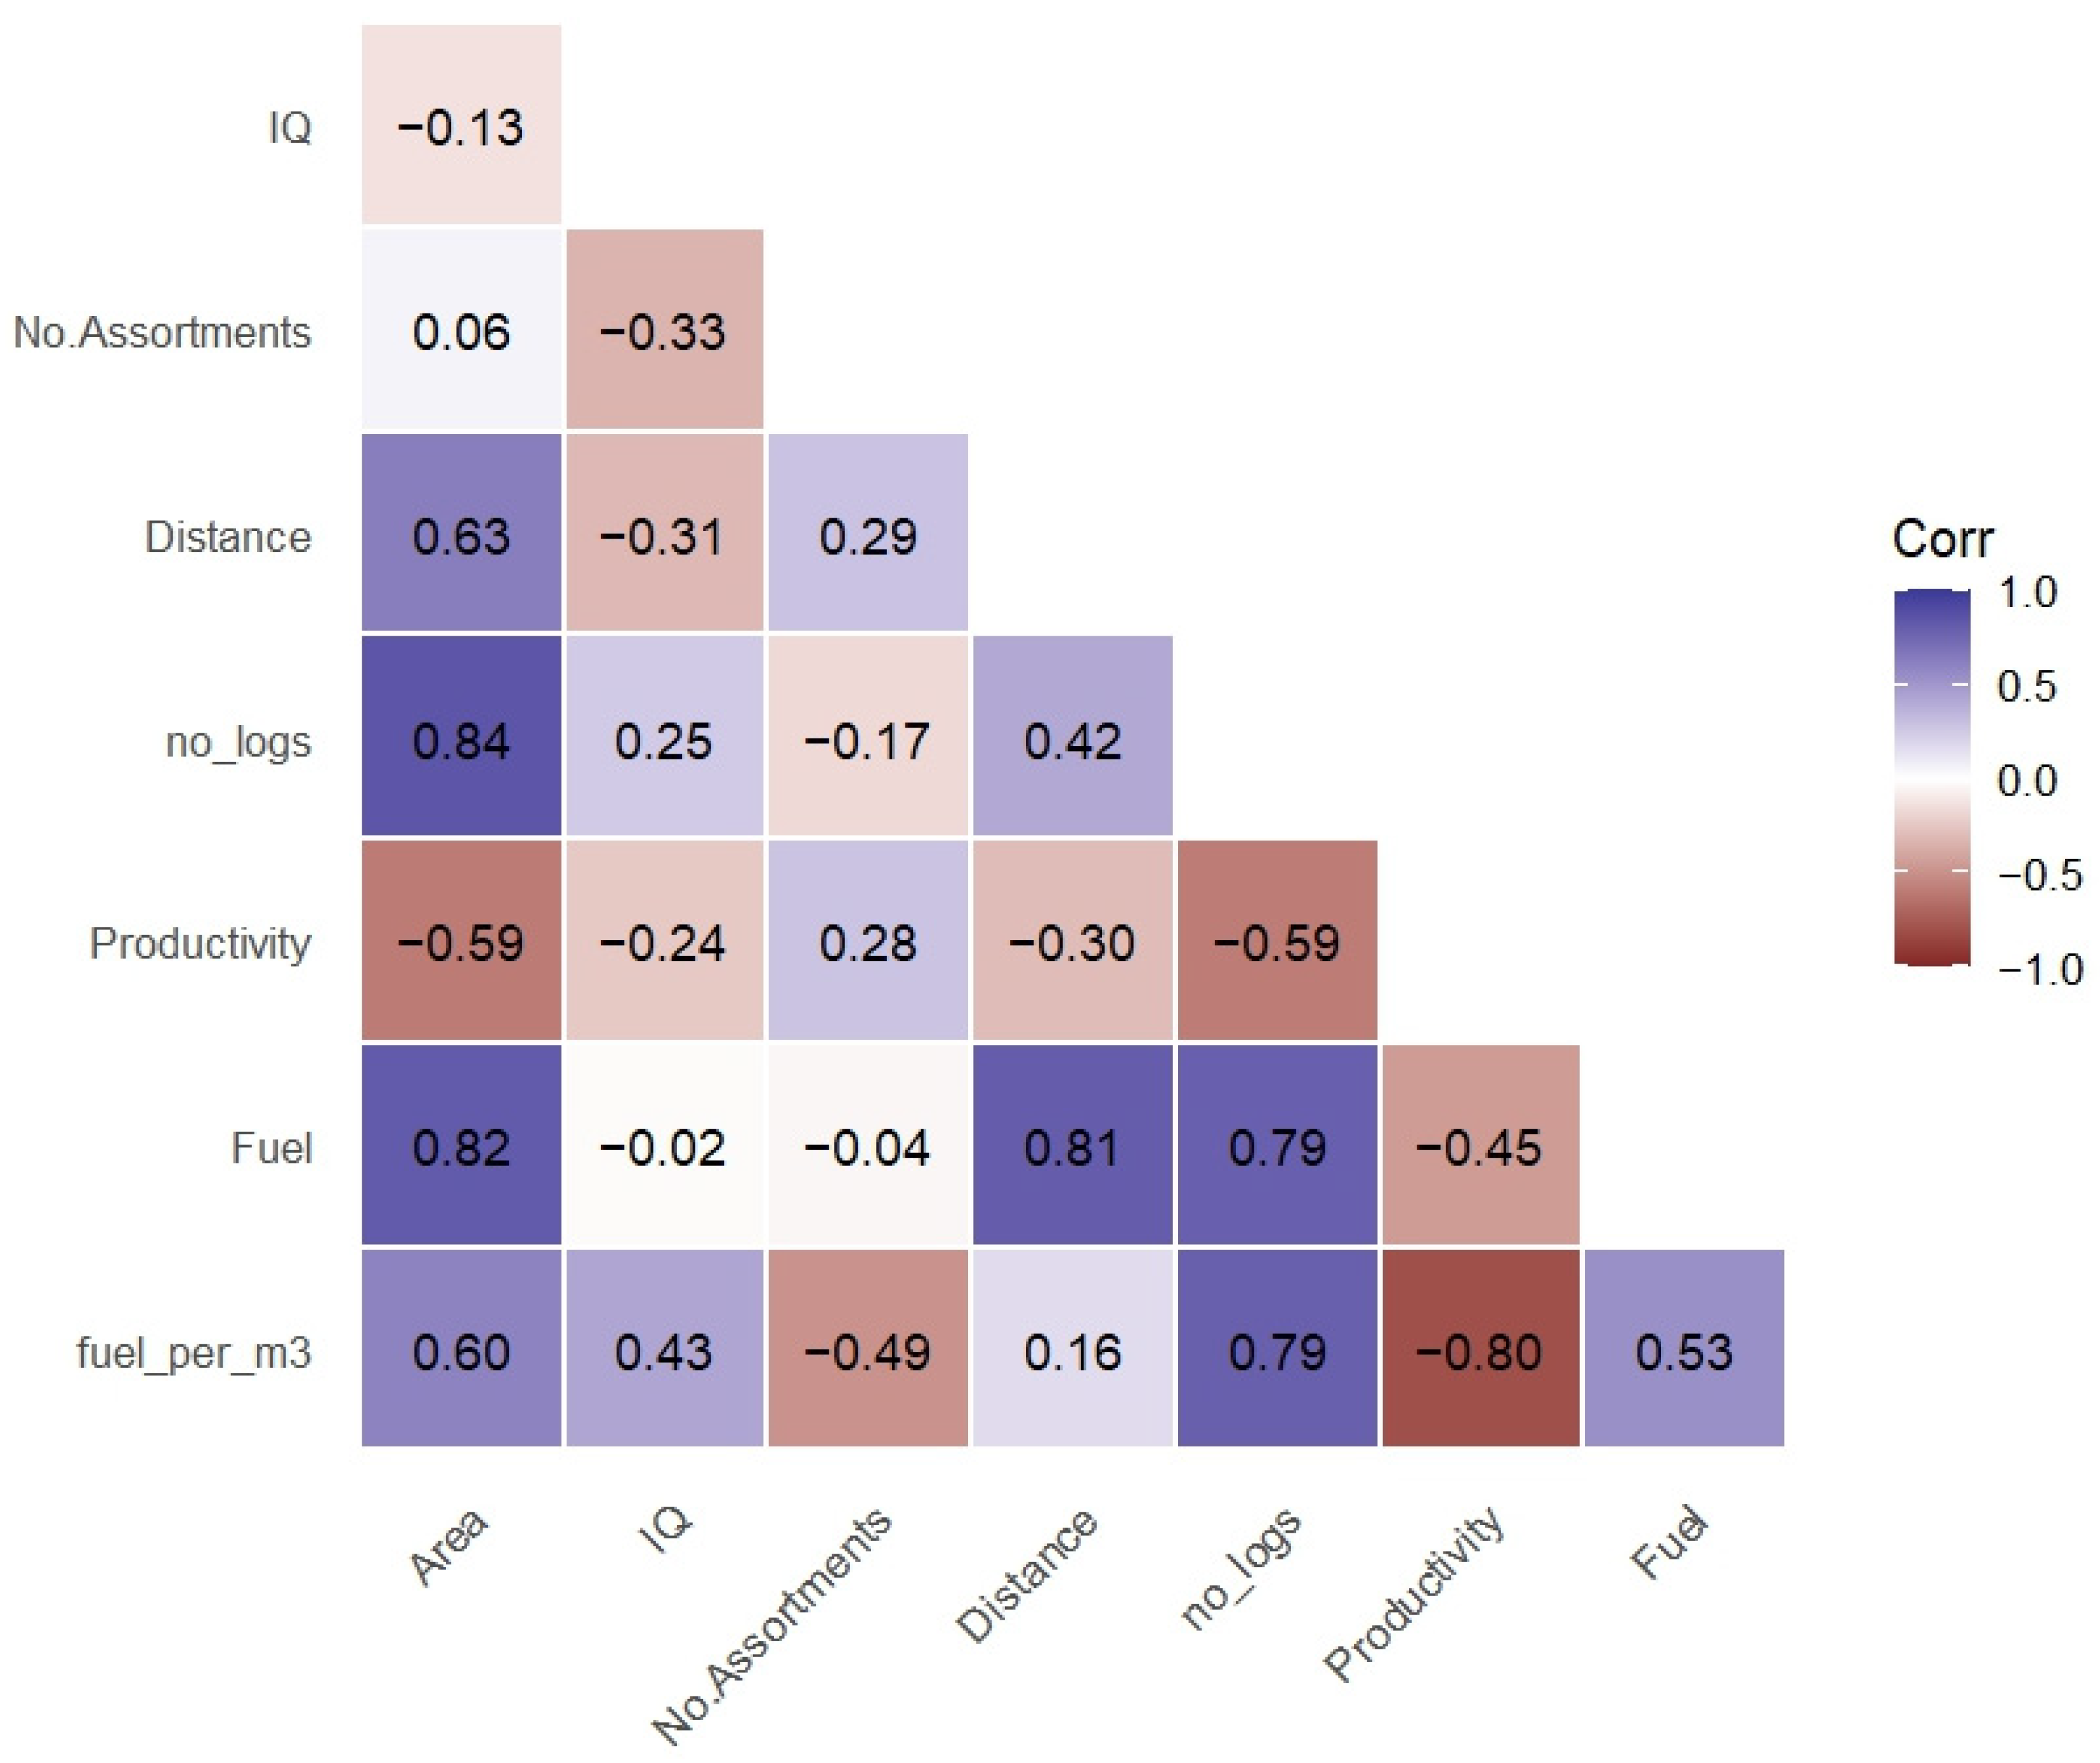
Analyzing the correlation between the harvester’s performance coefficients revealed a relationship between the isoperimetric coefficient (iso) and the amount of fuel used per cubic meter of wood (R = 0.43) or per hour of machine operation (R = 0.4) (Figure 2). After checking the statistical power of the correlation, it was found that these results were not statistically significant (p > 0.05).
A moderate correlation was observed between the number of assortments produced and fuel use per 1 m3 of processed wood (−0.49) per hour of machine operation (0.42). The statistical power analysis yielded p-values greater than 0.05. When analyzing the impact of the length of the assortments produced, it was noted that as the proportion of assortments with lengths of 3 m or more increased, the overall fuel consumption decreased (R = −0.52), as did the fuel use per cubic meter of harvested wood (R = −0.80). In both cases, the correlation was statistically significant (p-value < 0.05). It is worth mentioning that a significant positive correlation was observed between the average tree trunk volume and the fuel consumption per cubic meter of harvested wood (R = −0.74, p < 0.05).
The obtained results did not confirm the assumptions of the second hypothesis. Hypothesis H3 was confirmed: long assortments (≥5 m) strongly and positively contributed to an increase in harvester productivity (lower fuel consumption per m3).
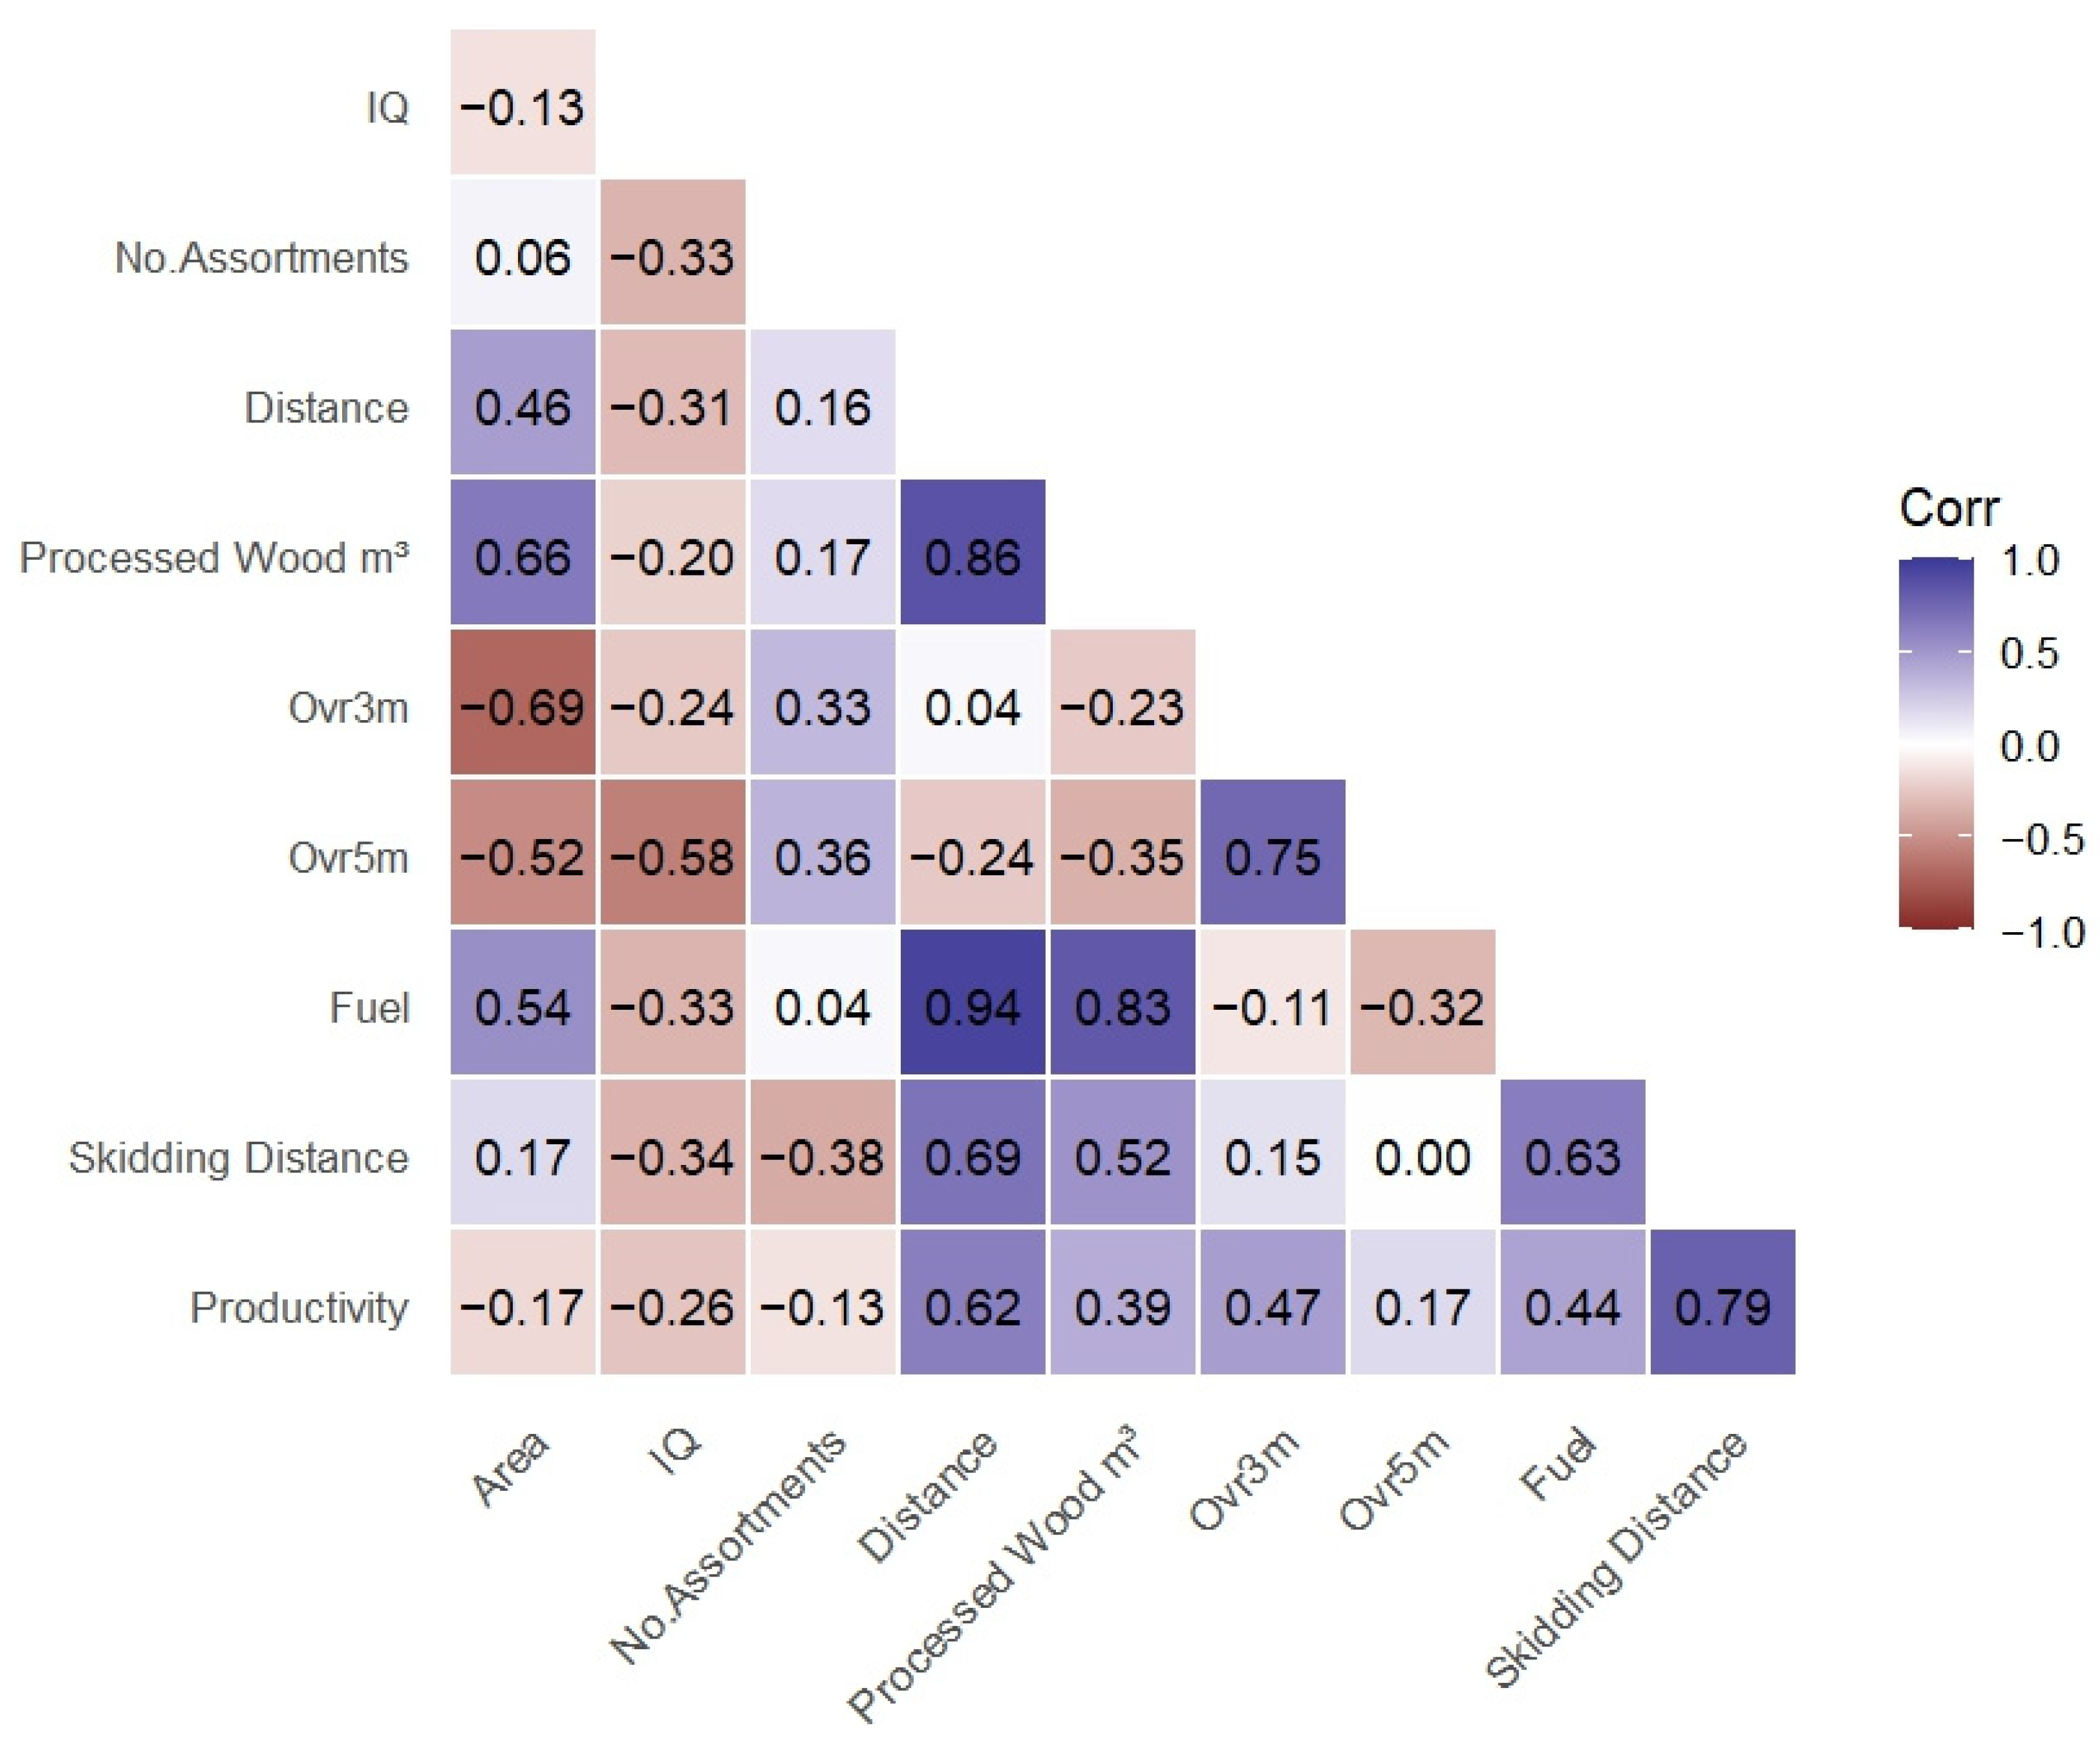
When analyzing the statistical power of these correlations, the p-values for each factor were greater than 0.05, indicating they were not statistically significant. A strong positive correlation was observed between the skid trail length and the total fuel consumption when studying work performance parameters. The Pearson correlation coefficient was R = 0.81 (p = 0.0015), and the Spearman rank correlation coefficient was R = 0.82 (p = 0.0011). This indicates that extending the extraction route significantly increases the fuel consumption; the greater the distance the forwarder must travel during wood transportation, the higher the total fuel consumption. As shown in Figure 3, Hypothesis H4 was strongly confirmed by the forwarder results: transporting timber over longer distances was a key factor in determining the fuel consumption (and greenhouse gas emissions).
No statistically significant correlation was found between the number of assortments or the impact of assortments longer than five meters on the amount of fuel consumed. The Spearman’s rank correlation test revealed a significant negative correlation (R = −0.59) between the percentage of assortments measuring 5 m or longer and the total fuel consumption.
A clear inverse relationship was also found between the size of individual trees and the unit labor and fuel requirements. In plots with larger trees (higher average volume), the harvester was more productive (higher m3/h) and fuel-efficient (lower L/m3). A strong negative correlation (R = −0.74) was found between the average tree volume and harvester fuel consumption per unit of harvested wood. The harvester achieved the highest efficiency, with a considerable average tree weight and long assortments. In contrast, the forwarder achieved the highest efficiency with a moderate log size and short extraction distances. Terrain factors such as the plot’s size and shape primarily affected the machines’ total working time and mileage (especially the forwarder’s). No significant decrease in efficiency was observed due to the plot’s irregular shape. The transport distance and the size and number of timber units to be harvested and transported were more important factors.
Variance decomposition analysis for forwarder data revealed that the dimension associated with the highest condition index (CI = 43.5) was dominated by operational and structural variables, particularly fuel consumption (0.98), extraction distance (0.96), number of assortments (0.91), and productivity (0.82). This indicates a systemic coupling between forwarding distance, operational complexity, and fuel demand rather than isolated pairwise dependencies.
The energy consumption of the harvesting and extraction operations directly translates into carbon dioxide emissions. Assuming an emission factor of 2.69 kg of CO2 equivalent per 1 L of diesel fuel consumed, the combustion results can be expressed as CO2e emissions. A harvester that consumes an average of 0.75 L/m3 of harvested wood emits approximately 2.0 kg of CO2 per cubic meter. A forwarder with an average fuel consumption of 0.91 L/m3 per cubic meter generates approximately 2.4 kg of CO2 per unit of transported raw material. Converted to the area of the felling site, these values correspond to emissions of ~550 kg of CO2 per hectare for the harvester and ~530 kg of CO2 per hectare for the forwarder. Together, these values correspond to approximately 1.1 tons of CO2 per hectare of felling site. The CO2 emissions in the studied plots varied significantly (Table 4).
These values varied significantly depending on the planning factors studied. The length of the extraction route had the most substantial impact on CO2 emissions from wood transport. Increasing the distance over which the raw material was transported resulted in higher fuel consumption by the forwarder and, thus, higher emissions. For instance, in a plot with a skid trail of approximately 500 m, the forwarder consumed 1.63 L/m3 (approximately 4.38 kg CO2 per cubic meter). By contrast, at a distance of approximately 100 m, it consumed only 0.75 L/m3 (approximately 2.0 kg of CO2 per cubic meter). Under extreme conditions, the forwarder emitted over 1.1 tons of CO2 per hectare (on the longest trail), while in the most accessible plot with a short trail, it emitted approximately 0.27 tons of CO2 per hectare.
For the harvester, the dimensions of the trees being harvested and the length of the assortments were crucial. At logging sites with denser stands, the harvester achieved higher fuel efficiency, resulting in lower CO2 emissions per unit of wood. In the plot with the highest average single-tree volume (0.78 m3), the harvester’s fuel consumption was approximately 0.58 L/m3 (1.56 kg CO2/m3). In an plot with small-diameter trees (an average of 0.39 m3 per trunk), the fuel consumption increased to 0.91 L/m3 (2.45 kg CO2/m3). The proportion of long logs in the harvest also affected emissions. In plots where long assortments (≥5 m) predominated, lower fuel consumption was recorded than in plots where short logs predominated. This trend was particularly evident for assortments of 5 m or longer (a statistically significant negative correlation with fuel consumption). A very high proportion of long heavy logs could decrease forwarder efficiency by reducing the load per cycle, offsetting the fuel benefits. In the analyzed sample, increasing the forwarder’s assortment diversity did not increase the overall fuel consumption or, thus, emissions. For the harvester, there was even a slight decrease in unit emissions (kg CO2/m3) with a larger number of assortments.
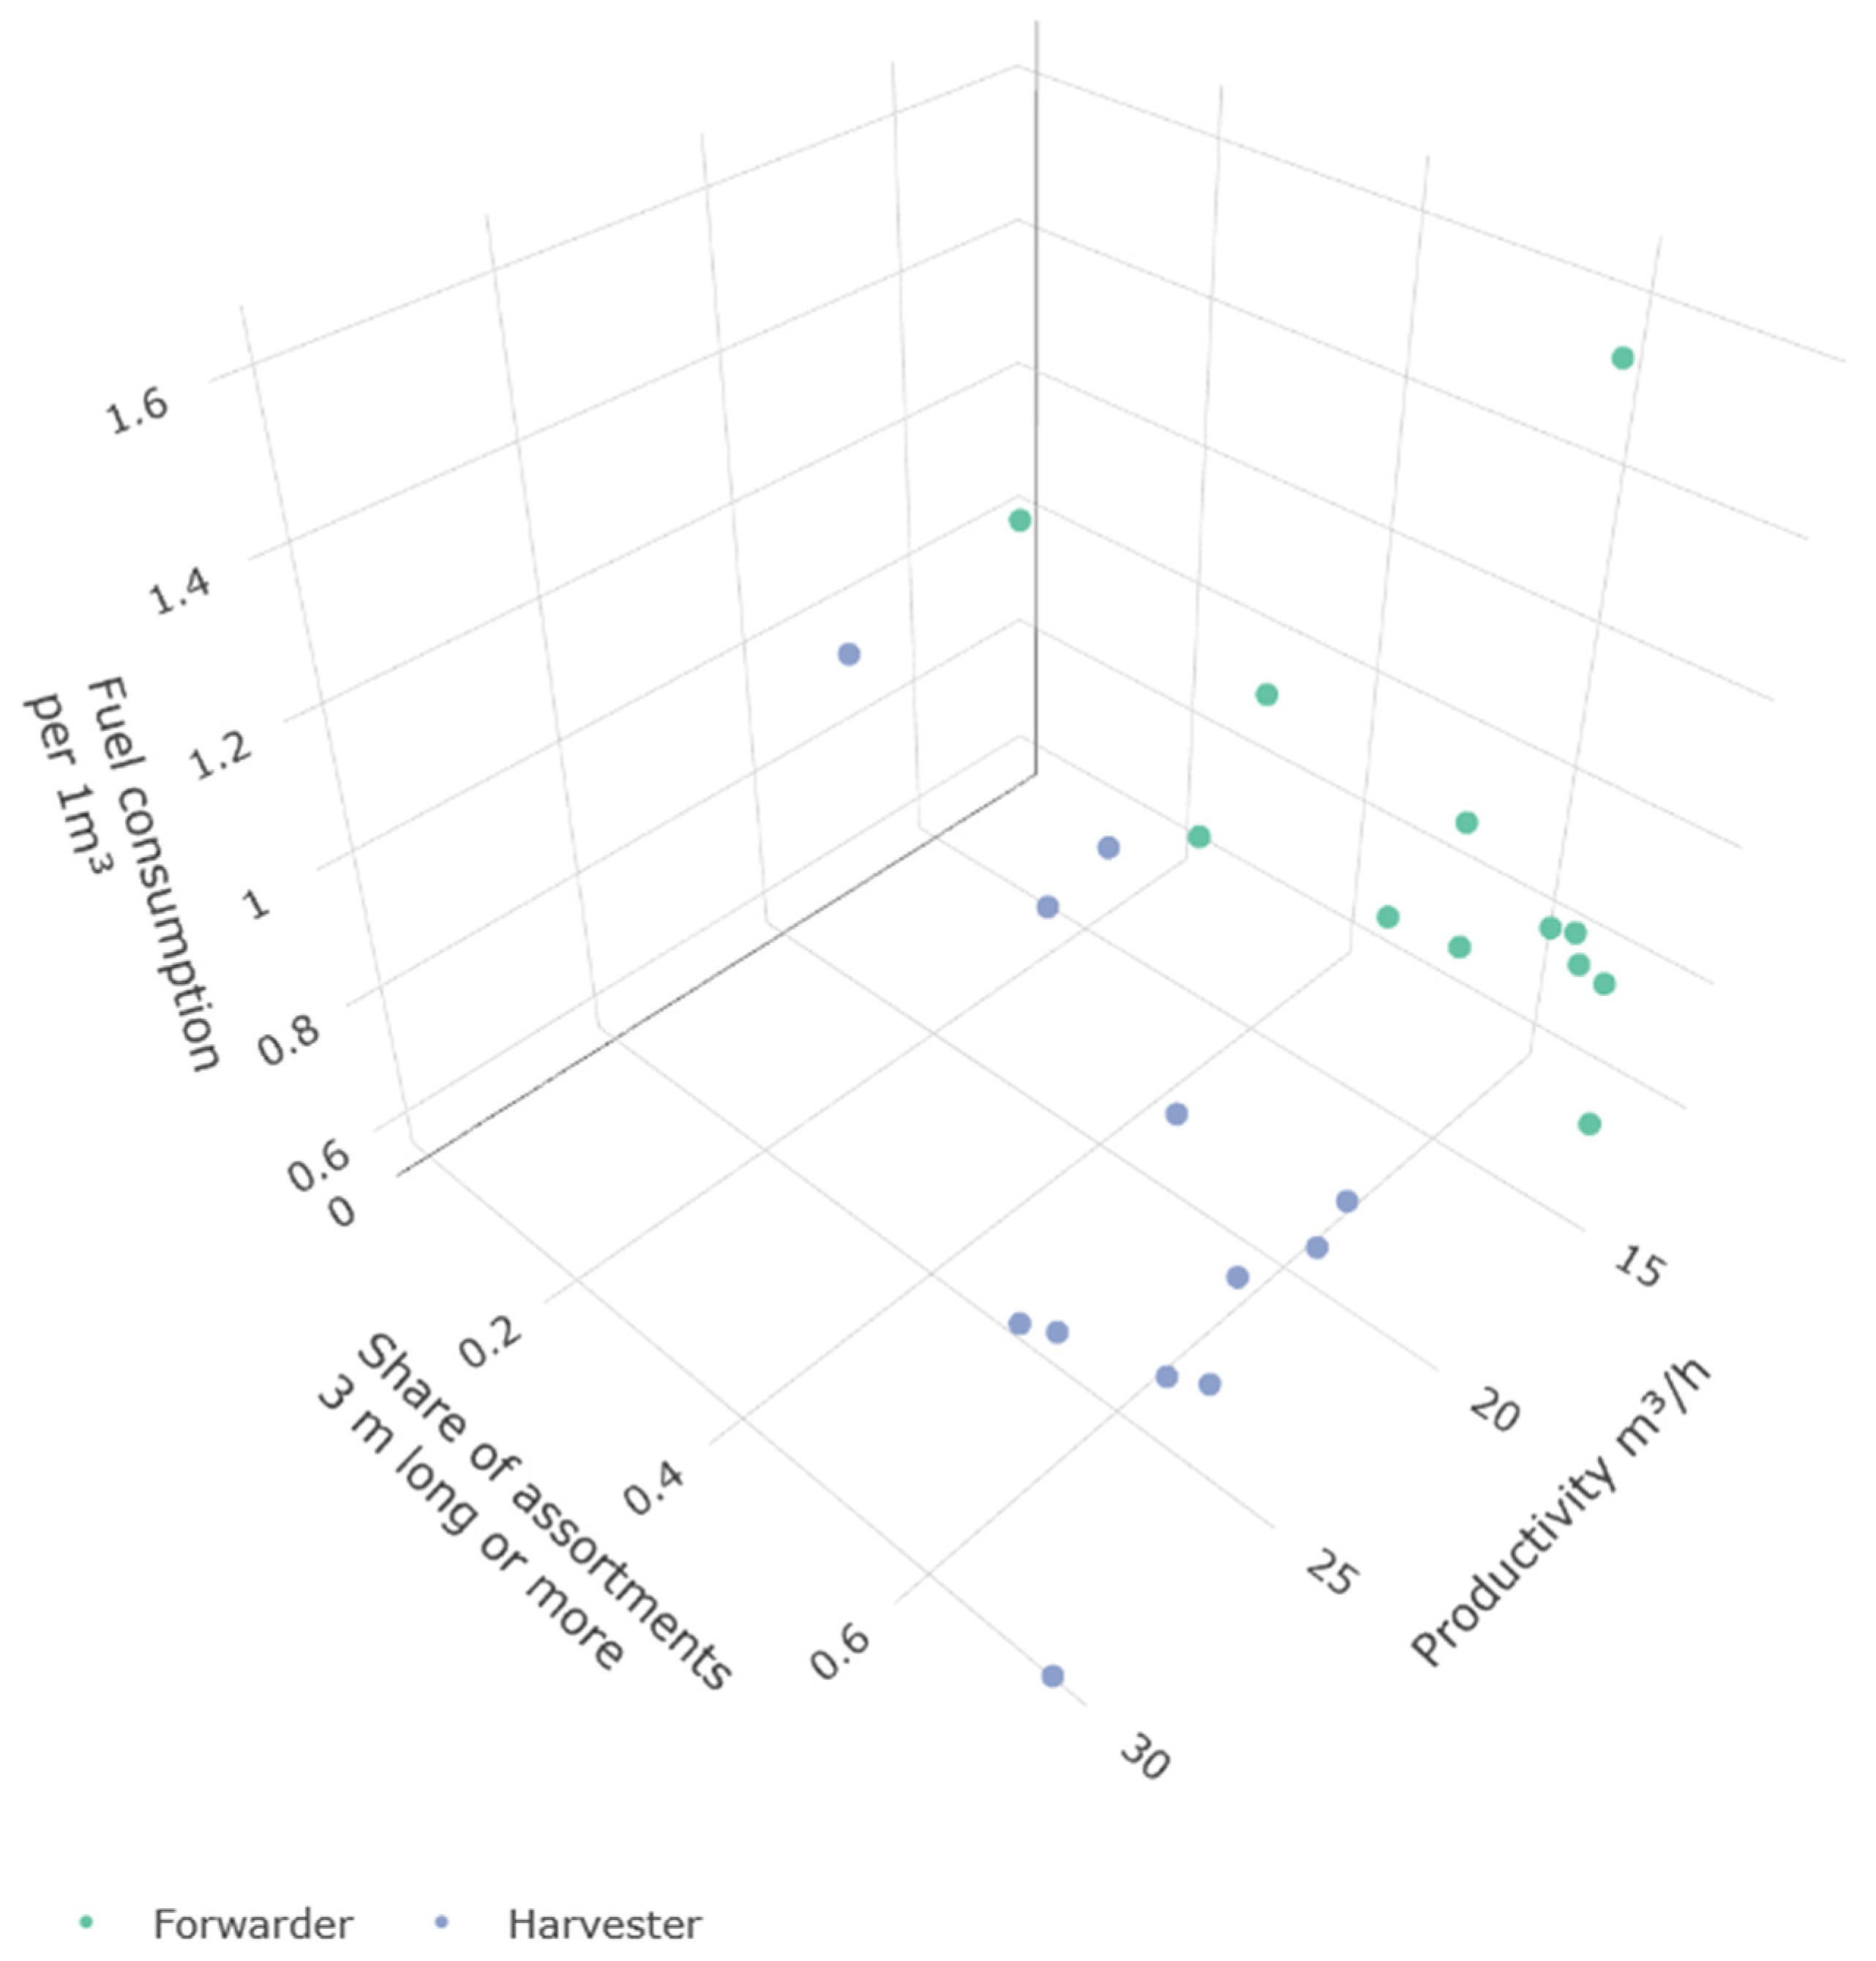
Fuel consumption and productivity depend more on the proportion of logs that are at least 3 m long than on the forwarder itself (Figure 4). Nevertheless, the forwarder itself is not insignificant.

4. Discussion

The results obtained are consistent with the trends presented in previous studies. Stands with long assortments, such as Plot 10, had the lowest fuel consumption (0.58 L per cubic meter) by the harvester. For forwarder operation, plots with the shortest skidding distance result in lower fuel consumption per cubic meter (0.75 L/m3) and per working hour (12.01 L/h). The length of the assortments produced was important for both the harvester and the forwarder.
For the harvester, it determined the number of cutting cycles per tree. On the other hand, the forwarder can collect material from the plot more quickly if it is processed into longer products. This reduces the number of crane cycles required to harvest the same amount of wood.
Machine productivity increased with a greater proportion of long assortments. For example, in plot 10, the harvester achieved a productivity rate of 30.26 m3/h, while the forwarder achieved 14.53 m3/h.
Reducing greenhouse gas emissions is essential to mitigate climate change. In this context, maintaining adequate forest cover and good forest health is essential to increase the sequestration potential of forest ecosystems [36,37,38,39]. Young forests have a significantly greater capacity to absorb carbon dioxide than old forests [40,41,42]. In the dying phase, old trees can even become a source of CO2 emissions [43,44]. Therefore, forest renewal and generational change require timber harvesting as an integral part of forest management [45,46,47].
Modern logging operations in Europe rely mainly on multi-purpose machines with diesel engines, which means that these processes contribute significantly to CO2 and other GHG emissions into the atmosphere [13,25,31]. In response to this problem, a number of regulations limiting the acceptable level of exhaust emissions from forestry machines have been introduced in recent years. An example is the Stage V emissions standard in force in the European Union, which imposes strict limits on nitrogen oxide and particulate matter emissions, among others [48,49,50,51]. The estimated CO2-equivalent emissions are just an overall average. Actual emissions will vary depending on factors such as the machine’s technical efficiency, the operator’s work habits, and the quality of the fuel used. Regardless of technological progress, an equally important factor influencing the amount of emissions is the way in which the forestry work is planned and organized [7,52,53]. Proper planning of logging operations can contribute not only to increased economic efficiency through reduced fuel consumption, but also to reduced greenhouse gas emissions [25,54].
Addressing CO2 emissions, it should also be remembered that the production of forestry machinery and the construction of forest roads involve significant GHG emissions [55].
The main aspects to consider during the planning stage include the geometry of the felling plots, the length of the planned forwarding route, the number and type of planned assortments, and the timeframe [56,57]. Research has shown that assortment length is important for productivity, so short assortments should be limited as much as possible.
Studies have not found a statistically significant relationship between the isoperimetric coefficient and the unit fuel consumption of a harvester or forwarder [30,58,59]. Although this coefficient is less strongly correlated with fuel consumption than skidding distance, the data show that it can be considered to some extent when planning forestry work. Previous studies have indicated that the surface irregularity moderately influences the machine performance and energy efficiency [60]. The limited number of plots analyzed in this study (n = 12) and the fact that most plots were moderately regular and rectangular in shape may explain these differences. To maintain the sample heterogeneity, the number of plots was limited. The results suggest that increasing the sample size in future studies would be beneficial to more fully capture the impact of this factor. The sample could be expanded to include data from other machines, thereby increasing the sample size. However, other factors that would make a reliable comparison difficult would have to be taken into account, such as different operators or different machine technical conditions.
The number of assortments produced in a given plot did not negatively affect operational efficiency. In the case of the harvester, the opposite relationship was observed: a larger number of assortments was associated with lower unit fuel consumption. This effect may result from the fact that more diverse assortments were found mainly in more abundant stands, where the operator had greater flexibility in making decisions regarding the optimal cutting of the trunk [61,62,63,64]. Under such conditions, it was possible to perform the work more quickly with fewer cycles and fewer manipulations [65,66]. However, the key factor determining the harvester’s performance was the dimension of the product. Harvesting small assortments from younger or weaker trees is less fuel-efficient; the machine consumes more fuel because of the greater number of cutting and handling cycles required to obtain the same volume of wood. The most significant impact on reducing fuel consumption per 1 m3 of wood was the extraction distance and the share of long assortments: both ≥3 m and ≥5 m in length. In plots dominated by short assortments, the number of cutting and sorting cycles required was higher, resulting in higher fuel consumption. The relationship between the length of assortments and machine productivity has been described previously by other authors [67,68].
In the Polish market, where the State Forests are the dominant forest holder, the lengths of the assortments produced are often determined by customer requirements [69]. It is common practice for wood processing facilities to prefer shorter assortments, as this reduces the need for cross-cutting at the sawmill. However, this approach may lead to the transfer of operating costs—including fuel consumption and CO2 emissions—to forestry contractors [70]. In the case of forwarder operation, a larger number of assortments may require separating the material and storing it at in separate points [71,72]. For less experienced operators, this may lead to increased fuel consumption.
In practice, planning the shortest possible extraction routes is recommended, which may require constructing additional forest roads or optimizing the storage locations [73]. These results underscore the importance of precise forestry planning. Increasing the compactness of logging units, optimizing the distribution of assortments, and reducing transportation distances can significantly lower machine operating costs and greenhouse gas emissions [74].
The analyzed studies showed a slight correlation between the proportion of long assortments and the forwarder’s reduction in total fuel consumption, but this effect was weak. This can be explained by the high skill level of the operator who worked on all the research sites; this experience enabled effective grouping of assortments and reduced the number of trips [71,75,76]. In addition, all storage sites were located along a single forest road, allowing the transport of more than one type of assortment in a single run. The most important factor affecting fuel consumption and emissions from the forwarder operation was the length of the skid trail. This relationship was not linear; as shown in Figure 1, after exceeding a skid trail length of 300 m, the unit fuel consumption began to rise rapidly. These results are consistent with the literature, which has repeatedly emphasized that the extraction distance is a key parameter influencing costs, work efficiency, and GHG emissions in timber transport from the stump to the storage site [77]. This is because longer forwarding distances increase the number of transport cycles, the duration of each cycle, and fuel consumption during both the loaded phase and the return trip without a load.
Research on work efficiency is characterized by the influence of many factors, such as the operator’s skill, the machine’s technical condition, and weather conditions that affect the ground’s load-bearing capacity and, consequently, the mobility of the machines [36,60,76,78,79,80,81,82]. Therefore, it was decided to conduct research on a smaller, more heterogeneous sample.
The study plots were similar in terms of habitat parameters. Still, they varied considerably in their shape and the parameters of the harvested material (number of assortments, length, and volume of a single tree or log). The p-values obtained in the statistical tests often fluctuated around the threshold of statistical significance, suggesting that future studies should increase sample sizes to improve test power.

5. Conclusions

No statistically significant impact of the isoperimetric quotient of the plot on the fuel consumption of forestry machines was found. Furthermore, the number of assortments did not significantly affect the unit productivity. The harvester efficiency (L/m3) was highest in stands with a high average tree volume and a high proportion of assortments ≥ 5 m in length.
The forwarder performed better with moderate log lengths and shorter wood transportation distances. The extraction distance was the main factor in determining the forwarder’s total fuel consumption (average correlation R = 0.81, p = 0.0015).
These conclusions align with those of other studies on precision forestry, emphasizing the importance of a holistic approach to forest work planning for sustainable forest management. This research confirmed that the length of the wood extraction distance has the most significant impact on CO2 emissions from forestry machines among the planning variables. Increasing the distance raw material is transported results in a proportional increase in the forwarder’s fuel consumption, leading to significantly higher CO2 emissions per unit of harvested wood and per hectare.
The size of the harvested trees was also an important factor. Larger trees (yielding longer assortments) reduced the fuel consumption of harvesters per unit of wood harvested, thus lowering CO2 emissions. In contrast, small assortments required more cutting, loading, and transport cycles, thereby increasing fuel consumption. Expanding the number of assortments did not lead to higher exhaust emissions. Therefore, proper assortment planning (even for multiple product groups) does not reduce the fuel efficiency.
To ensure greater statistical power, a larger data set covering several dozen plots would be necessary. Alternatively, one could compile data from several machines of the same model and account for the operator as a differentiating factor.

Author Contributions

Conceptualization, D.P.; methodology, D.P. and T.M.; validation, D.P.; formal analysis, D.P.; investigation, D.P.; resources, D.P.; data curation, D.P.; writing—original draft preparation, D.P. and G.T.; writing—review and editing, T.M. and G.T.; visualization, D.P.; supervision, T.M.; project administration, D.P. All authors have read and agreed to the published version of the manuscript.

Funding

This research received no external funding.

Data Availability Statement

The raw data for this publication were obtained from the Smart Forestry system by Komatsu Forest AB, Umea, Sweden. Access to this data can be purchased directly from the manufacturer.

Acknowledgments

The graphical abstract was generated with the assistance of an AI-based image generation tool. The authors reviewed and edited the final version.

Conflicts of Interest

The authors declare no conflicts of interest.

References

  1. Prinz, R.; Spinelli, R.; Magagnotti, N.; Routa, J.; Asikainen, A. Modifying the Settings of CTL Timber Harvesting Machines to Reduce Fuel Consumption and CO2 Emissions. J. Clean. Prod. 2018, 197, 208–217. [Google Scholar] [CrossRef]
  2. Bacescu, N.M.; Cadei, A.; Moskalik, T.; Wiśniewski, M.; Talbot, B.; Grigolato, S. Efficiency Assessment of Fully Mechanized Harvesting System through the Use of Fleet Management System. Sustainability 2022, 14, 16751. [Google Scholar] [CrossRef]
  3. Liski, E.; Jounela, P.; Korpunen, H.; Sosa, A.; Lindroos, O.; Jylhä, P. Modeling the Productivity of Mechanized CTL Harvesting with Statistical Machine Learning Methods. Int. J. For. Eng. 2020, 31, 253–262. [Google Scholar] [CrossRef]
  4. Moskalik, T.; Borz, S.A.; Dvořák, J.; Ferencik, M.; Glushkov, S.; Muiste, P.; Lazdiņš, A.; Styranivsky, O. Timber Harvesting Methods in Eastern European Countries: A Review. Croat. J. For. Eng. 2017, 38, 231–241. [Google Scholar]
  5. Zhao, S.; Yeom, C.; Cai, H.; Wang, Q. Assessing Forestry Strategy for Addressing Climate Change and Its Challenges Toward Carbon Neutrality in China. J. Sustain. Res. 2024, 6, e240063. [Google Scholar] [CrossRef]
  6. Keenan, R.J. Climate Change Impacts and Adaptation in Forest Management: A Review. Ann. For. Sci. 2015, 72, 145–167. [Google Scholar] [CrossRef]
  7. Labelle, E.R.; Lemmer, K.J. Selected Environmental Impacts of Forest Harvesting Operations with Varying Degree of Mechanization. Croat. J. For. Eng. 2019, 40, 239–257. [Google Scholar] [CrossRef]
  8. Engel, A.M.; Wegener, J.; Lange, M. Greenhouse Gas Emissions of Two Mechanised Wood Harvesting Methods in Comparison with the Use of Draft Horses for Logging. Eur. J. For. Res. 2012, 131, 1139–1149. [Google Scholar] [CrossRef]
  9. Butarbutar, T.; Köhl, M.; Neupane, P.R. Harvested Wood Products and REDD+: Looking beyond the Forest Border. Carbon Balance Manag. 2016, 11, 4. [Google Scholar] [CrossRef][Green Version]
  10. Peng, L.; Searchinger, T.D.; Zionts, J.; Waite, R. The Carbon Costs of Global Wood Harvests. Nature 2023, 620, 110–115. [Google Scholar] [CrossRef]
  11. Lijewski, P.; Merkisz, J.; Fuć, P.; Ziółkowski, A.; Rymaniak, Ł.; Kusiak, W. Fuel Consumption and Exhaust Emissions in the Process of Mechanized Timber Extraction and Transport. Eur. J. For. Res. 2017, 136, 153–160. [Google Scholar] [CrossRef]
  12. Sakata, S.; Zeleke Aklilu, A.; Pizarro, R. Greenhouse Gas Emissions Data: Concepts and Data Availability. In OECD Statistics Working Papers 2024/03; Organisation for Economic Co-Operation and Development (OECD): Paris, France, 2024. [Google Scholar]
  13. Kärhä, K.; Eliasson, L.; Kühmaier, M.; Spinelli, R. Fuel Consumption and CO2 Emissions in Fully Mechanized Cut-to-Length (CTL) Harvesting Operations of Industrial Roundwood: A Review. Curr. For. Rep. 2024, 10, 255–272. [Google Scholar] [CrossRef]
  14. Emberger, P.; Thuneke, K.; Remmele, E.; Ettl, J. Results of Recurrent In-Service Exhaust Gas Measurements with an EU Stage IV Forest Harvester Fuelled with Rapeseed Oil within the Emission Durability Period. SN Appl. Sci. 2023, 5, 191. [Google Scholar] [CrossRef]
  15. Akbari, M.; Piri, H.; Renzi, M.; Bietresato, M. The Effects of Biodiesel on the Performance and Gas Emissions of Farm Tractors’ Engines: A Systematic Review, Meta-Analysis, and Meta-Regression. Energies 2024, 17, 4226. [Google Scholar] [CrossRef]
  16. Pesonen, J.; Prinz, R.; Ovaskainen, H.; Kauranen, P.; Poikela, A.; Kärhä, K. Alternative Powertrains and Fuels in Heavy Non-Road Mobile Machinery and Their Future Expectations—A Review. Curr. For. Rep. 2025, 11, 10. [Google Scholar] [CrossRef]
  17. Xu, H.; Ou, L.; Li, Y.; Hawkins, T.R.; Wang, M. Life Cycle Greenhouse Gas Emissions of Biodiesel and Renewable Diesel Production in the United States. Environ. Sci. Technol. 2022, 56, 7512–7521. [Google Scholar] [CrossRef] [PubMed]
  18. Kaulen, A.; Mayer, D.; Franz, M.F.; Purfürst, T. Practical Application of Carbon Footprint of Timber Supply Chain Using Forest Machine Data. Croat. J. For. Eng. 2025, 46, 289–307. [Google Scholar] [CrossRef]
  19. Bosela, M.; Merganičová, K.; Torresan, C.; Cherubini, P.; Fabrika, M.; Heinze, B.; Höhn, M.; Kašanin-Grubin, M.; Klopčič, M.; Mészáros, I.; et al. Modelling Future Growth of Mountain Forests Under Changing Environments. In Climate-Smart Forestry in Mountain Regions; Springer: Cham, Switzerland, 2022; ISBN 9783030807665. [Google Scholar]
  20. Tampekis, S.; Kantartzis, A.; Arabatzis, G.; Sakellariou, S.; Kolkos, G.; Malesios, C. Conceptualizing Forest Operations Planning and Management Using Principles of Functional Complex Systems Science to Increase the Forest’s Ability to Withstand Climate Change. Land 2024, 13, 217. [Google Scholar] [CrossRef]
  21. Holopainen, M.; Vastaranta, M.; Hyyppä, J. Outlook for the next Generation’s Precision Forestry in Finland. Forests 2014, 5, 1682–1694. [Google Scholar] [CrossRef]
  22. Cammerino, A.R.B.; Ingaramo, M.; Piacquadio, L.; Monteleone, M. Assessing and Mapping Forest Functions through a GIS-Based, Multi-Criteria Approach as a Participative Planning Tool: An Application Analysis. Forests 2023, 14, 934. [Google Scholar] [CrossRef]
  23. Haavikko, H.; Kärhä, K.; Poikela, A.; Korvenranta, M.; Palander, T. Fuel Consumption, Greenhouse Gas Emissions, and Energy Efficiency of Wood-Harvesting Operations: A Case Study of Stora Enso in Finland. Croat. J. For. Eng. 2022, 43, 79–97. [Google Scholar] [CrossRef]
  24. Stanula, Z.; Wieruszewski, M.; Mydlarz, K.; Adamowicz, K. Fuel Use Reduction and Economic Savings from Optimization of Road Transportation of Coniferous Roundwood. Energies 2023, 16, 5334. [Google Scholar] [CrossRef]
  25. Alex, A.; Kizha, A.R.; George, A.K.; Bick, S.; Wang, J.; Klein, S.; Louis, L.T.; Li, L.; Perera, P.; Manohar, K.A. Carbon Footprint of the Predominant Mechanized Timber Harvesting Methods in the Northeastern US. Clean. Circ. Bioecon. 2024, 9, 100097. [Google Scholar] [CrossRef]
  26. Loeffler, D.; Jones, G.; Vonessen, N.; Healey, S.; Chung, W. Estimating Diesel Fuel Consumption and Carbon Dioxide Emissions from Forest Road Construction. In Forest Inventory and Analysis (FIA) Symposium 2008, Proceedings of the RMRS-P-56CD, Park City, UT, USA, 21–23 October 2008; United States Department of Agriculture, Forest Service, Northeastern Research Station: Fort Collins, CO, USA, 2009; 11p. [Google Scholar]
  27. Đuka, A.; Grigolato, S.; Papa, I.; Pentek, T.; Poršinsky, T. Assessment of Timber Extraction Distance and Skid Road Network in Steep Karst Terrain. iForest 2017, 10, 886–894. [Google Scholar] [CrossRef]
  28. Grajewski, S.M. Forest Road Engineering in Poland: Current Status and Development Perspectives. Sylwan 2022, 166, 123–140. [Google Scholar] [CrossRef]
  29. Ottaviani Aalmo, G.; Kerstens, P.J.; Belbo, H.; Bogetoft, P.; Talbot, B.; Strange, N. Efficiency Drivers in Harvesting Operations in Mixed Boreal Stands: A Norwegian Case Study. Int. J. For. Eng. 2021, 32, 74–86. [Google Scholar] [CrossRef]
  30. Rossi, F.; Breidenbach, J.; Puliti, S.; Astrup, R.; Talbot, B. Assessing Harvested Sites in a Forested Boreal Mountain Catchment through Global Forest Watch. Remote Sens. 2019, 11, 543. [Google Scholar] [CrossRef]
  31. Pszenny, D.; Moskalik, T. Consumables Usage and Carbon Dioxide Emissions in Logging Operations. Forests 2025, 16, 1197. [Google Scholar] [CrossRef]
  32. Reşitoğlu, I.A.; Altinişik, K.; Keskin, A. The Pollutant Emissions from Diesel-Engine Vehicles and Exhaust Aftertreatment Systems. Clean Technol. Environ. Policy 2015, 17, 15–27. [Google Scholar] [CrossRef]
  33. Farinango-Herrera, C.; Zambrano-Ramón, J.; Rojas-Reinoso, E.V. Thermographic Analysis of Exhaust Gas and Emissions by Varying Catalyst Behaviour and Injection Parameters. Energies 2024, 17, 1417. [Google Scholar] [CrossRef]
  34. Clairotte, M.; Suarez-Bertoa, R.; Zardini, A.A.; Giechaskiel, B.; Pavlovic, J.; Valverde, V.; Ciuffo, B.; Astorga, C. Exhaust Emission Factors of Greenhouse Gases (GHGs) from European Road Vehicles. Environ. Sci. Eur. 2020, 32, 125. [Google Scholar] [CrossRef]
  35. Seber, G.; Escobar, N.; Valin, H.; Malina, R. Uncertainty in Life Cycle Greenhouse Gas Emissions of Sustainable Aviation Fuels from Vegetable Oils. Renew. Sustain. Energy Rev. 2022, 170, 112945. [Google Scholar] [CrossRef]
  36. Mo, L.; Zohner, C.M.; Reich, P.B.; Liang, J.; de Miguel, S.; Nabuurs, G.J.; Renner, S.S.; van den Hoogen, J.; Araza, A.; Herold, M.; et al. Integrated Global Assessment of the Natural Forest Carbon Potential. Nature 2023, 624, 92–101. [Google Scholar] [CrossRef] [PubMed]
  37. Psistaki, K.; Tsantopoulos, G.; Paschalidou, A.K. An Overview of the Role of Forests in Climate Change Mitigation. Sustainability 2024, 16, 6089. [Google Scholar] [CrossRef]
  38. Ameray, A.; Bergeron, Y.; Valeria, O.; Montoro Girona, M.; Cavard, X. Forest Carbon Management: A Review of Silvicultural Practices and Management Strategies Across Boreal, Temperate and Tropical Forests. Curr. For. Rep. 2021, 7, 245–266. [Google Scholar] [CrossRef]
  39. Mäkelä, A.; Minunno, F.; Kujala, H.; Kosenius, A.K.; Heikkinen, R.K.; Junttila, V.; Peltoniemi, M.; Forsius, M. Effect of Forest Management Choices on Carbon Sequestration and Biodiversity at National Scale. Ambio 2023, 52, 1737–1756. [Google Scholar] [CrossRef]
  40. Service, F.; Smith, J.E.; Heath, L.S.; Skog, K.E.; Birdsey, R.A. Methods of Calculating Forest Ecosystem and Harvested Carbon with Stand Estimates for Forest Types of the United States; Northeastern Research Station, Forest Service, United States Department of Agriculture: Fort Collins, CO, USA, 2006.
  41. Heinrich, V.H.A.; Dalagnol, R.; Cassol, H.L.G.; Rosan, T.M.; de Almeida, C.T.; Silva Junior, C.H.L.; Campanharo, W.A.; House, J.I.; Sitch, S.; Hales, T.C.; et al. Large Carbon Sink Potential of Secondary Forests in the Brazilian Amazon to Mitigate Climate Change. Nat. Commun. 2021, 12, 1785. [Google Scholar] [CrossRef]
  42. Robinson, N.; Drever, C.R.; Gibbs, D.A.; Lister, K.; Esquivel-Muelbert, A.; Heinrich, V.; Ciais, P.; Silva-Junior, C.H.L.; Liu, Z.; Pugh, T.A.M.; et al. Protect Young Secondary Forests for Optimum Carbon Removal. Nat. Clim. Change 2025, 15, 793–800. [Google Scholar] [CrossRef]
  43. Dye, A.W.; Houtman, R.M.; Gao, P.; Anderegg, W.R.L.; Fettig, C.J.; Hicke, J.A.; Kim, J.B.; Still, C.J.; Young, K.; Riley, K.L. Carbon, Climate, and Natural Disturbance: A Review of Mechanisms, Challenges, and Tools for Understanding Forest Carbon Stability in an Uncertain Future. Carbon Balance Manag. 2024, 19, 35. [Google Scholar] [CrossRef]
  44. Cheng, Y.; Oehmcke, S.; Brandt, M.; Rosenthal, L.; Das, A.; Vrieling, A.; Saatchi, S.; Wagner, F.; Mugabowindekwe, M.; Verbruggen, W.; et al. Scattered Tree Death Contributes to Substantial Forest Loss in California. Nat. Commun. 2024, 15, 641. [Google Scholar] [CrossRef]
  45. Putz, F.E.; Romero, C.; Sist, P.; Schwartz, G.; Thompson, I.; Roopsind, A.; Ruslandi; Medjibe, V.; Ellis, P. Sustained Timber Yield Claims, Considerations, and Tradeoffs for Selectively Logged Forests. PNAS Nexus 2022, 1, pgac102. [Google Scholar] [CrossRef] [PubMed]
  46. Canuel, C.M.; Thiffault, É.; Thiffault, N. Post-Harvest Regeneration Is Driven by Ecological Factors Rather than Wood Procurement Intensity in Eastern Canadian Forests. Forestry 2024, 97, 663–677. [Google Scholar] [CrossRef]
  47. Brown, M.L.; Canham, C.D.; Murphy, L.; Donovan, T.M. Timber Harvest as the Predominant Disturbance Regime in Northeastern U.S. Forests: Effects of Harvest Intensification. Ecosphere 2018, 9, e02062. [Google Scholar] [CrossRef]
  48. European Parliament. Regulation (EU) 2016/1628 of the European Parliament and of The Council of 14 September 2016 on Requirements Relating to Emission Limits for Gaseous and Particulate Pollutants and Type Approval for Internal Combustion Engines. Off. J. Eur. Union 2016, 252, 53–117. [Google Scholar]
  49. Hagan, R.; Markey, E.; Clancy, J.; Keating, M.; Donnelly, A.; O’Connor, D.J.; Morrison, L.; McGillicuddy, E.J. Non-Road Mobile Machinery Emissions and Regulations: A Review. Air 2022, 1, 14–36. [Google Scholar] [CrossRef]
  50. Sparrevik, M.; Qiu, X.; Stokke, R.A.; Borge, I.; de Boer, L. Investigating the Potential for Reduced Emissions from Non-Road Mobile Machinery in Construction Activities through Disruptive Innovation. Environ. Technol. Innov. 2023, 31, 103187. [Google Scholar] [CrossRef]
  51. Szymlet, N.; Kami, M.; Ziółkowski, A.; Sobczak, J. Analysis of Non-Road Mobile Machinery Homologation Standards in Relation to Actual Exhaust Emissions. Energies 2024, 17, 3624. [Google Scholar] [CrossRef]
  52. Sasaki, N. Timber Production and Carbon Emission Reductions through Improved Forest Management and Substitution of Fossil Fuels with Wood Biomass. Resour. Conserv. Recycl. 2021, 173, 105737. [Google Scholar] [CrossRef]
  53. Mäkipää, R.; Abramoff, R.; Adamczyk, B.; Baldy, V.; Biryol, C.; Bosela, M.; Casals, P.; Curiel Yuste, J.; Dondini, M.; Filipek, S.; et al. How Does Management Affect Soil C Sequestration and Greenhouse Gas Fluxes in Boreal and Temperate Forests?—A Review. For. Ecol. Manag. 2023, 529, 120637. [Google Scholar] [CrossRef]
  54. Kärhä, K.; Haavikko, H.; Kääriäinen, H.; Palander, T.; Eliasson, L.; Roininen, K. Fossil-Fuel Consumption and CO2eq Emissions of Cut-to-Length Industrial Roundwood Logging Operations in Finland. Eur. J. For. Res. 2023, 142, 547–563. [Google Scholar] [CrossRef]
  55. Kühmaier, M.; Kral, I.; Kanzian, C. Greenhouse gas emissions of the forest supply chain in Austria in 2018. Sustainability 2018, 14, 792. [Google Scholar] [CrossRef]
  56. Ferreira da Silva, E.; Fernandes da Silva, G.; Orfanó Figueiredo, E.; Ribeiro de Mendonça, A.; Junio de Oliveira Santana, C.; César Fiedler, N.; Pereira Martins Silva, J.; Otone Aguiar, M.; Silva Santos, J. Optimized Forest Planning: Allocation of Log Storage Yards in the Amazonian Sustainable Forest Management Area. For. Ecol. Manag. 2020, 472, 118231. [Google Scholar] [CrossRef]
  57. Hansson, L.J.; Forsmark, V.; Flisberg, P.; Rönnqvist, M.; Mörk, A.; Jönsson, P. A Decision Support Tool for Forwarding Operations with Sequence-Dependent Loading. Can. J. For. Res. 2022, 52, 1513–1526. [Google Scholar] [CrossRef]
  58. Räty, J.; Hauglin, M.; Astrup, R.; Breidenbach, J. Assessing and Mitigating Systematic Errors in Forest Attribute Maps Utilizing Harvester and Airborne Laser Scanning Data. Can. J. For. Res. 2022, 53, 284–301. [Google Scholar] [CrossRef]
  59. Nölke, N.; Fehrmann, L.; Jaya, I.N.S.; Tiryana, T.; Seidel, D.; Kleinn, C. On the Geometry and Allometry of Big-Buttressed Trees—A Challenge for Forest Monitoring: New Insights from 3D-Modeling with Terrestrial Laser Scanning. iForest 2015, 8, 574–581. [Google Scholar] [CrossRef]
  60. Allman, M.; Jankovský, M.; Bobrík, V.; Dudáková, Z. Operational Efficiency and Environmental Impacts: A Study on Cut-to-Length Logging in the Carpathian Forests. Front. For. Glob. Change 2025, 8, 1567136. [Google Scholar] [CrossRef]
  61. Li, X.; Duan, A.; Zhang, J. Influence of Stand Density, Site, Age, and Competition on the Timber Assortment Structure of Chinese Fir Plantations. Sci. Rep. 2024, 14, 29056. [Google Scholar] [CrossRef]
  62. Felton, A.; Nilsson, U.; Sonesson, J.; Felton, A.M.; Roberge, J.M.; Ranius, T.; Ahlström, M.; Bergh, J.; Björkman, C.; Boberg, J.; et al. Replacing Monocultures with Mixed-Species Stands: Ecosystem Service Implications of Two Production Forest Alternatives in Sweden. Ambio 2016, 45, 124–139. [Google Scholar] [CrossRef]
  63. Merganič, J.; Merganičová, K.; Marušák, R.; Tipmann, L.; Šálek, L.; Dragoun, L.; Stolariková, R. Relation between Forest Stand Diversity and Anticipated Log Quality in Managed Central European Forests. Int. J. Biodivers. Sci. Ecosyst. Serv. Manag. 2016, 12, 128–138. [Google Scholar] [CrossRef]
  64. Johansson, M.; Erlandsson, E.; Kronholm, T.; Lindroos, O. The Need for Flexibility in Forest Harvesting Services–a Case Study on Contractors’ Workflow Variations. Int. J. For. Eng. 2023, 34, 13–25. [Google Scholar] [CrossRef]
  65. Szewczyk, G.; Sowa, J.M.; Grzebieniowski, W.; Kormanek, M.; Kulak, D.; Stańczykiewicz, A. Sequencing of Harvester Work during Standard Cuttings and in Areas with Windbreaks. Silva Fenn. 2014, 48, 1159. [Google Scholar] [CrossRef]
  66. Palander, T.; Ovaskainen, H.; Lauren, A.; Pasi, A. An Enhanced Method for Improving the Efficiency of Harvesting Tree Plantations on Flat and Sloping Terrain Using a Cutting-Cycle Productivity Model. J. For. Res. 2025, 36, 39. [Google Scholar] [CrossRef]
  67. Labelle, E.R.; Breinig, L.; Sycheva, E. Exploring the Use of Harvesters in Large-Diameter Hardwood-Dominated Stands. Forests 2018, 9, 424. [Google Scholar] [CrossRef]
  68. Mederski, P.S.; Schweier, J.; Đuka, A.; Tsioras, P.; Bont, L.G.; Bembenek, M. Mechanised Harvesting of Broadleaved Tree Species in Europe. Curr. For. Rep. 2022, 8, 1–19. [Google Scholar] [CrossRef]
  69. Zastocki, D.; Oktaba, J.; Lachowicz, H. Changes in the Market of Precious Wood: A Case Study of Submission System in Poland. Forests 2021, 12, 421. [Google Scholar] [CrossRef]
  70. Trzciński, G.; Tymendorf, Ł. Transport Work for the Supply of Pine Sawlogs to the Sawmill. Forests 2020, 11, 1340. [Google Scholar] [CrossRef]
  71. Gagliardi, K.; Ackerman, S.; Ackerman, P. Multi-Product Forwarder-Based Timber Extraction: Time Consumption and Productivity Analysis of Two Forwarder Models over Multiple Products and Extraction Distances. Croat. J. For. Eng. 2020, 41, 231–242. [Google Scholar] [CrossRef]
  72. Manner, J. Automatic and Experimental Methods to Studying Forwarding Work. Ph.D. Thesis, Swedish University of Agricultural Sciences, Uppsala, Sweden, 2019. [Google Scholar]
  73. Flisberg, P.; Rönnqvist, M.; Willén, E.; Forsmark, V.; Davidsson, A. Optimized Locations of Landings in Forest Operations. Can. J. For. Res. 2022, 52, 59–69. [Google Scholar] [CrossRef]
  74. Manner, J.; Nordfjell, T.; Lindroos, O. Effects of the Number of Assortments and Log Concentration on Time Consumption for Forwarding. Silva Fenn. 2013, 47, 1030. [Google Scholar] [CrossRef]
  75. Bacescu, N.M.; Hueller, S.; Marchi, L.; Grigolato, S. Evaluating Variables’ Influence on Forwarder Performance and Fuel Efficiency in Mountain Salvage Logging Using an Automatic Work-Element Detection Method. Forests 2024, 15, 2169. [Google Scholar] [CrossRef]
  76. Hartsch, F.; Dreger, F.A.; Englund, M.; Hoffart, E.; Rinkenauer, G.; Wagner, T.; Jaeger, D. Positive and Negative Work Practices of Forest Machine Operators: Interviews and Literature Analysis. Forests 2022, 13, 2153. [Google Scholar] [CrossRef]
  77. Prinz, R.; Mola-Yudego, B.; Ala-Ilomäki, J.; Väätäinen, K.; Lindeman, H.; Talbot, B.; Routa, J. Soil, Driving Speed and Driving Intensity Affect Fuel Consumption of Forwarders. Croat. J. For. Eng. 2023, 44, 31–43. [Google Scholar] [CrossRef]
  78. Rossit, D.A.; Olivera, A.; Viana Céspedes, V.; Broz, D. A Big Data Approach to Forestry Harvesting Productivity. Comput. Electron. Agric. 2019, 161, 29–52. [Google Scholar] [CrossRef]
  79. Ovaskainen, H. Timber Harvester Operators’ Working Technique in First Thinning and the Importance of Cognitive Abilities on Work Productivity; The Finnish Society of Forest Science: Vantaa, Finland, 2009; Volume 2009, ISBN 9789516512467. [Google Scholar]
  80. Melander, L.; Ritala, R. Separating the Impact of Work Environment and Machine Operation on Harvester Performance. Eur. J. For. Res. 2020, 139, 1029–1043. [Google Scholar] [CrossRef]
  81. Eliasson, L.; Kärhä, K.; Arlinger, J. Fuel Consumption in Logging Operations in Sweden. Int. J. For. Eng. 2023, 34, 366–372. [Google Scholar] [CrossRef]
  82. Palander, T. Precision Modeling of Fuel Consumption to Select the Most Efficient Logging Method for Cut-to-Length Timber Harvesting. Forests 2025, 16, 294. [Google Scholar] [CrossRef]
Figure 1. Impact of (a) forwarder extraction distance and (b) mean harvested tree volume on CO2 emissions.
Forests 17 00388 g001
Figure 2. Correlation matrix for harvester parameters. IQ—isoperimetric quotient; No. Assortments—number of assortments produced; Distance—total distance traveled; No. Logs—number of logs produced; Productivity—amount of wood processed during 1 h [m3/H]; Fuel—total fuel consumption; Fuel consumption [L/m3]—amount of fuel needed to process 1 cubic meter of wood.
Forests 17 00388 g002
Figure 3. Correlation matrix for forwarder parameters. IQ—isoperimetric quotient; No. Assortments—number of assortments produced; Distance—total distance traveled; processed wood m3—amount of processed wood; Ovr3m—share of assortments with a length of 3 m or more; Ovr5m share of assortments with a length of 5 m or more Fuel—total fuel consumption; Productivity—amount of wood processed during 1 h [m3/h].
Forests 17 00388 g003
Figure 4. Three-dimensional graph showing the relation between fuel consumption per cubic metre of wood, work efficiency expressed in cubic metres per hour, and the proportion of assortments measuring 3 metres or more in length.
Forests 17 00388 g004
Table 1. Characteristics of the research plots.
PlotArea [m2]Perimeter [m]Isoperimetric CoefficientNo.
Assortments
Volume of Logs with Length ≥ 5 m
[%]
Volume of Logs with Length ≥ 3 m [%]Mean Tree Volume [m3]Mean Log
Volume [m3]
Mean
Extraction Distance
[m]
166,009.311634.190.3114000.330.05300
261,657.251553.200.321540550.440.08400
347,117.241441.630.285845560.850.15300
434,133.731844.560.126758650.780.19350
516,458.23600.590.573443660.810.16200
661,181.351494.310.3446030.330.05200
748,441.681349.980.334837530.800.15400
847,745.741576.870.2411449670.690.12100
933,668.061068.760.370650680.710.15400
1033,816.821547.860.177663730.780.16400
1199,125.132550.90.191747661.050.22500
1269,172.631409.640.43770360.390.06400
Mean51,543.931506.040.316.833650.670.660.13329.17
Table 2. Harvester performance parameters. No. Assort.—the number of assortments produced in a cutting plot. Vol. 5 m—percentage share of assortments measuring 5 m or more in length. Vol. 3 m—percentage share of assortments measuring 3 m or more in length. m3—volume of harvested wood; Fuel—amount of fuel consumed on site; L/m3—fuel consumption per 1 cubic meter; MTH—machine work hours; L/h—fuel consumption per hour of work; m3/h—productivity in cubic meters per hour; MTV—mean tree volume [m3]; MLV—mean log volume [m3].
PlotNo. Assort.Stems Logsm3Fuel [L]L/m3MTHL/hm3/hDistance [km]MTVMLV
14421428,4501398.4513700.9876:3617.8918.4013.910.330.05
25276015,1051216.0410050.8355:0318.2622.119.170.440.08
38174395891485.969830.6658:1213.2425.6214.930.850.15
476472602502.43390.6720:0316.9125.127.960.780.19
545232597423.773240.7618:1817.723.543.530.810.16
66298219,052992.819500.860:2415.7316.5512.690.330.05
78226711,8811809.0111680.6570:1216.6425.8418.920.800.15
814166297331150.877430.6547:0915.7624.4914.510.690.12
96179586701267.489450.7558:5716.0321.858.830.710.15
106170182281331.347720.5844:3317.3330.268.530.780.16
117185387571946.214130.7396:3314.6320.2730.151.050.22
127483331,0701874.2617040.9191:3918.5920.6024.590.390.06
Table 3. Forwarder performance parameters. No. Assort.—the number of assortments produced in a cutting plot; Vol. 5 m—percentage of volume for assortments 5 m long or longer [%]; Vol. 3 m—percentage of volume for assortments 3 m long or longer [%]; m3—volume of transported wood. MLV—mean log volume [m3]. Fuel—amount of fuel consumed on site; L/m3—fuel consumption per 1 cubic meter; MTH—machine work hours; L/h—fuel consumption per hour of work; m3/h—productivity in cubic meters per hour; Extr. Dist.—mean extraction distance [m].
PlotNo. Assort.Vol. ≥ 5 m Vol. ≥ 3 mm3MLV FuelL/m3MTHL/hm3/hDistance [km]Extr. Dist.
144011250.0511150.9993:0912.114.7962300
2540559600.089010.9468:2713.1613.2566.8400
38455611560.158780.7666:1813.2413.3063.5300
4758653890.193430.8825:2413.5013.7236.5350
5443663500.163020.8623:4812.6913.1319.6200
6649268930.056030.6847:5112.6012.8337200
78375313930.1511680.8478:1814.9214.97121400
81449679310.126970.7558:0612.0112.0260.20100
96506810170.158640.8563:1213.6713.7170.5400
106637310520.167120.6849:4514.3114.5367.9400
117476614820.2224111.63163:4514.729.10172500
12703614450.0614631.01105:5413.8113.93132400
Table 4. A comparison of the fuel consumption by the harvester and forwarder, as well as the total CO2 emissions (kg), CO2 emissions per cubic meter of harvested wood, and emissions per hectare of production plot.
PlotFuel
Harvester [L]
Fuel
Forwarder [L]
CO2 Emitted by Harvester [kg]CO2 Emitted by Forwarder [kg]CO2_harv_m3CO2_forw_m3CO2_harv_haCO2_forw_ha
1137011153685.302999.352.642.67558.30454.38
210059012703.452423.692.222.52438.46393.09
39838782644.272361.821.782.04561.21501.26
4339343911.91922.671.822.37267.16270.31
5324302871.56812.382.062.32529.56493.60
69506032555.501622.072.571.82417.69265.12
7116811683141.923141.921.742.26648.60648.60
87436971998.671874.931.742.01418.61392.69
99458642542.052324.162.012.29755.03690.32
107727122076.681915.281.561.82614.10566.37
11141324113800.976485.591.954.38681.831163.41
12170414634583.763935.472.452.72662.66568.93
Disclaimer/Publisher’s Note: The statements, opinions and data contained in all publications are solely those of the individual author(s) and contributor(s) and not of MDPI and/or the editor(s). MDPI and/or the editor(s) disclaim responsibility for any injury to people or property resulting from any ideas, methods, instructions or products referred to in the content.