Article

Canebrake and Associated Forest Structure Influence Avifauna Occurrence

School of Forestry and Horticulture, Southern Illinois University, 1205 Lincoln Dr., Carbondale, IL 62901, USA
*
Author to whom correspondence should be addressed.
Forests 2026, 17(3), 309; https://doi.org/10.3390/f17030309
Submission received: 29 January 2026 / Revised: 23 February 2026 / Accepted: 25 February 2026 / Published: 28 February 2026
(This article belongs to the Section Forest Biodiversity)

Abstract

Past restoration of hardwood forests prioritized planting of woody vegetation cover, particularly oaks (Quercus spp.). This restoration regime often did not consider other microhabitat components, which failed to restore habitat complexity. Giant cane (Arundinaria gigantea (Walter) Muhl.) was an important microhabitat feature for creating a dense understory structure within the hardwood forest landscape. Many bird species are associated with stands of giant cane (canebrakes) for food, cover, and nesting ground. The decline of canebrakes may reduce nesting and foraging habitat, negatively impacting bird communities. Here, we used a hierarchical multi-species occupancy model to assess how giant cane and its associated overstory forest structure influenced breeding bird occupancy in southern Illinois. Bird surveys were conducted from May to July 2022–2024 at 100 site-years using passive acoustic monitoring. Responses to the vegetation structure (tree density and size) and canebrakes varied among species and nesting guilds (overstory, understory, and ground). Occurrence probabilities of 54% of the bird species increased with the presence of canebrake. We did not find any significant relationships between bird occupancy and vegetation structure and canebrake characteristics. Overall, maintaining a hardwood forest stand with a heterogeneous canopy cover would create variations in light environments, allowing canebrakes to benefit bird species across nesting guilds.

1. Introduction

Forest conversion to urbanized areas and agricultural fields has negatively impacted bird communities due to the loss of forested habitat [1,2,3,4]. Past restoration efforts and management of hardwood forests prioritized the restoration of woody vegetation cover, particularly oak species (Quercus spp.), assuming that it was sufficient to provide food and cover for bird communities [5,6]. This restoration regime often did not consider forest structural development and other microhabitat components (e.g., understory vegetation and vines), which failed to fully restore habitat complexity [6,7,8,9,10]. Maintaining variation among microhabitat features and vegetation compositions, including a combination of closed overstory canopies and areas with dense understory vegetation, is important to promote occurrence, breeding success, and survival of diverse bird species [5,11,12,13,14].
Giant cane (Arundinaria gigantea (Walter) Muhl.) is a woody perennial bamboo species native to the southeastern United States [15,16,17]. Due to habitat loss from land conversion and suppression of disturbances, <2% of giant cane habitat remains from its original distribution [18]. The species is considered disturbance-dependent, typically favoring conditions following fires, windstorms, flooding, and forest harvesting [10,19,20]. In open areas with few trees, giant cane forms dense monotypic stands called “canebrakes”, which are used by many bird species for nesting and cover [4,21,22,23,24,25]. In addition, canebrakes serve as a stopover habitat for migratory birds [23,25,26]. In southern Illinois, Hoover [25] reported 38 species of breeding birds including Swainson’s warbler (Limnothlypis swainsonii (Audubon)), a species of conservation concern, in or near canebrake. Currently, canebrakes are highly fragmented and persist mainly as understory vegetation in closed-canopy forests and edge vegetation [27].
Although associations between birds and canebrakes have been observed across the southeastern United States [23,24], studies on canebrake avifauna often focused on Swainson’s warbler [22,25,28,29]. To our knowledge, systematic surveying of the canebrake avifauna community is limited to only one study by Hoover [25]. Given that many avifauna utilize canebrakes as nesting, foraging, and roosting habitat [23,24], the decline of canebrakes could negatively impact the abundance and occurrence of bird communities. For example, the extinction of Bachman’s warbler (Vermivora bachmanii (Audubon)) was speculated to be associated with the loss of canebrakes [30,31]. In addition, dense canebrakes associated with canopy gaps provide the high foliage density preferred by species of conservation concern [32], such as the Kentucky warbler (Geothlypis formosa (Wilson)) and prothonotary warbler (Protonotaria citrea (Boddaert)) [24,25,33].
Managing structural features such as canopy openness and understory density on a fine scale is important to determine the density and reproductive success of forest birds [34]. Species occupancy has been used as an alternative measure to evaluate the habitat quality, which could aid in determining reproductive success [35]. Good-quality habitat should have higher occupancy rates than poor-quality habitat [35,36]. Therefore, insights into bird occupancy [37] could aid in our understanding of how remnant canebrakes, along with associated overstory vegetation structures, can be managed to improve the habitat quality for bird conservation, especially for species that are associated with early succession forests and open habitats [38].
We assessed how canebrake and the associated overstory forest structure influenced breeding bird occupancy in southern Illinois. Given variations in habitat requirements across bird species, the relationships between bird occupancy and habitat characteristics will differ among nesting guilds. We hypothesized that the occupancy probability of overstory-nesting birds such as eastern wood-pewee (Contopus virens (L.)), scarlet tanager (Piranga olivacea (Gmelin)), and blue-gray gnatcatcher (Polioptila caerulea (L.)) would be higher at sites with a large tree size and high tree density, indicating a closed canopy forest structure. We hypothesized that the occupancy probability of species that utilize a dense understory cover and canebrakes for breeding and nesting, such as Swainson’s warbler, white-eyed vireo (Vireo griseus (Boddaert)), indigo bunting (Passerina cyanea (L.)), hooded warblers (Setophaga citrina (Boddaert)), and Kentucky warblers, would be higher at sites with a higher density of canebrakes and low overstory density [4,25,26,39]. We further hypothesized that the occupancy probability of ground-nesting species such as ovenbird (Seiurus aurocapilla (L.)) would be higher at sites with canebrake and high understory cover, associated with a low density of overstory trees.

2. Materials and Methods

2.1. Study Area

Our study was conducted at 64 locations (32 canebrakes and 32 adjacent non-canebrakes) within forested areas across Jackson, Union, Alexander, and Pulaski counties in southern Illinois, USA, at the Cypress Creek National Wildlife Refuge (CCNWR), the Shawnee National Forest (SNF), and lands managed by the Illinois Department of Natural Resources (IDNR), including the Burning Star State Fish and Wildlife Area and Giant City State Park (Figure 1).
First, 32 sites (16 canebrakes and 16 non-canebrakes) were surveyed in 2022, and then a different set of 32 sites (16 canebrakes and 16 non-canebrakes) were surveyed in 2023. In 2024, we re-surveyed 22 sites (11 canebrakes and 11 non-canebrakes) from 2022 and 16 sites from 2023 (8 canebrakes and 8 non-canebrakes).
Due to the rarity of canebrakes, we conducted foot and road surveys in areas with known canebrakes in search of them. We defined a canebrake as an area with a well-established patch of giant cane reaching ≥10 m in width and length [25]. Once a canebrake site was established, we randomly selected a non-canebrake site; this was done to ensure an equal sample size between canebrake and non-canebrake sites. A non-canebrake site was ≥250 m from the edge of any established canebrakes within the same forest tract but did not contain giant cane as understory vegetation. The distance of 250 m was selected to ensure independence between sites. Likely due to the absence of giant cane, non-canebrake sites tended to have a higher mean percentage of shrub cover (7.56%) than canebrake sites (2.95%), although the mean percentages of herbaceous cover were similar between canebrake (28.13%) and non-canebrake sites (27.23%). In addition, the tree and sapling density was higher in non-canebrake sites than canebrake sites (Table 1).
Study sites were dominated by oaks (Quercus spp.), hickories (Carya spp.), hackberries (Celtis spp.), boxelder (Acer negundo L.), red maple (A. rubrum L.), eastern cottonwood (Populus deltoides Bartram ex Marshall), American sycamore (Platanus occidentalis L.), and sweetgum (Liquidambar styraciflua L.) [40,41,42]). Across the study region, soil types varied from newly deposited river sand to poorly drained soil with the mixture of silt loam and silty clay loam soils [43,44]. Annual temperatures ranged between 8.5 and 20.9 °C, with a mean of 14.7 °C, while annual precipitation was approximately 129.9 cm [45].

2.2. Bird Survey

Bird surveys were conducted during the breeding season (May–July; [16,25]) in 2022–2024 using AudioMoths Audio Recording Units (ARUs; Open Acoustics Devices, Oxford, UK). Specifically, we placed an ARU at 1.5 m above ground at the center of each site. An ARU was attached to a nearby tree or mounted to a T-post if in the absence of a suitable tree. To protect the ARUs from moisture, we placed each ARU in a resealable zipper storage bag with a desiccant at the bottom of the bag. We programmed the ARUs to record calls at the sampling rate of 48 kHz and medium gain for 10 min at 30 min before sunrise, at sunrise, and at 30 min after sunrise once every 6–8 days, with a total of 3 visits per site [46,47].
Bird vocalization files were processed into 1 min recordings and visualized on the RFCxArbimon platform [48]. Each recording was processed manually to identify bird songs or calls to the species by experts with bird identification and survey proficiency and with over 5 years’ experience. We combined the American crow (Corvus brachyrhynchos (Brehm)) and fish crow (Corvus ossifragus (Wilson)) due to uncertainty in species identification. If a species was detected at least once during the 10 min survey duration, the species was considered as present (“1”). A species was considered absent (“0”) if it was not detected during the survey durations. We omitted recordings of poor quality due to heavy rain and loud background noise where bird calls were unidentifiable and those recordings where files were corrupted. Due to failed recordings, we omitted data from 1 canebrake site and 1 non-canebrake site from 2022 from further analyses.

2.3. Habitat Covariates

At each site, we measured and calculated 9 variables that described canebrake characteristics and the overstory vegetation structure, which were important for the occurrence of avifauna [49,50,51], including the (1) tree density (stems/ha; stems with diameter at breast height at 1.37 m above ground [DBH] ≥ 10 cm), (2) sapling density (stems/ha; stems with 2.5–10 cm DBH), (3) tree basal area (m2/ha), (4) mean tree height (m), (5) standard deviation of tree height (m), (6) mean tree DBH (cm), and (7) standard deviation of tree DBH (cm) (Table 1). At canebrake sites, we also measured two canebrake attributes: (8) height and (9) density.
Measurements were collected for trees and saplings that were within the boundary of 10 × 10 m sampling plots around the centroid of each study site. Tree and sapling densities (stems/ha) were calculated by multiplying the number of total stems counted within a sampling plot by 100. Trees and saplings along the border of a sampling plot were included if more than half of the base was within the sampling plot. Tree basal area per sampling plot (m2/plot) was summed using the formula for the area of a circle, π×(DBH/2)2. DBH was measured using a diameter tape to the nearest cm. Mean DBH was calculated by averaging DBH among all trees measured within a sampling plot. Standard deviation of tree DBH was also calculated to describe the diversity in stand structure relating to the uneven-agedness, patch density, and tree dimensions [52]. Mean tree height was calculated by averaging the heights of trees within the sampling plot using a laser range finder [53]. Standard deviation of tree height was calculated among all trees within the sampling plot to describe the vertical heterogeneity of stands and canopy layering [52]. Canebrake density (stems/m2) of live culms was measured using a 1 m2 quadrat at the center of the sampling plot and at 5 m distances from the center in the four cardinal directions. Canebrake height (cm) was measured using a meter stick to the nearest cm and averaged for all older (>1 year) live culms among 5 quadrats. Correlated variables (r > |0.6|) were identified using a Pearson correlation [54].

2.4. Statistical Analyses

2.4.1. Vegetation PCA

We used Principal Component Analysis (PCA) to summarize 7 vegetation variables that described the overstory forest structure and to reduce the number of variables using the vegan package [55] in program R ver. 4.4.1 [56]. We selected the first three principal components (PCs), which explained approximately 72% of the total variance (Table S1). We interpreted each PC based on variable loading values. PC1 explained 41% of variations and was used to describe the tree size structure, by which a high PC1 value described sites with small tree sizes in DBH, height, and basal area, with low height variations among tree within the sampling plot (Table S1). PC2 explained 19% of variations and was used to describe tree density. A high PC2 value, which was correlated with a low tree density, described sites with a low tree cover and well-developed understory and ground vegetation (Table S1). PC3 explained 12% of variations and was used to describe stand size heterogeneity, such that a high PC3 value described sites with high variations in DBH and diverse tree ages (Table S1).

2.4.2. Multi-Species Occupancy Model

We used a hierarchical multi-species occupancy model with a Bayesian approach [57,58] to assess the influence of the site-level vegetation structure on bird occupancy probabilities in southern Illinois. In this model, we defined a true occurrence (i.e., presence/absence) for species i at site j as Zi,j, where Zi,j = 1 if species i was present at site j and Zi,j = 0 if species i was absent at site j. The estimate of true occurrence state Zi,j was assumed to follow a Bernoulli distribution defined as Zi,j~Bern(Ψi,j), where Ψi,j is the probability that species i occurs at site j. Due to imperfect detection, the detection model was defined based on the observed data as Xi,j,k~Bern(pi,j,k × Zi,j), where Z is the true occurrence, and p is the detection probability for species i at site j for the kth sampling occasion.
The model assumed that species-level parameters were random effects, which were drawn from a common (community-level) normal distribution, with the mean and variance for responses to each covariate measured across species as the hyper-parameter distribution. Through community-level hyper-parameters, the hierarchical model allows the sharing of information across species, which improves parameter estimates, especially for those species that have low detection [57,59]. We omitted any raptors (n = 8) as they were likely flyover species [60] and species that are associated with aquatic habitats, such as geese, herons, and kingfishers (n = 3). Then, we classified the remaining bird species (n = 81) into groups based on their nesting guilds according to Cooper et al. [60] and Cornell Lab [61] (Table S2). For nesting guilds, we grouped bird species (n = 78) into three groups: (1) overstory (e.g., tree canopy and cavities), (2) understory (e.g., shrub), and (3) ground (Table S2). Brown-headed cowbirds (Molothrus ater (Pennant)) are brood parasites; therefore, their nesting locations could depend on host species, which could vary in nesting strata [61,62]. In addition, eastern phoebe (Sayornis phoebe (Latham)) and the house finch (Haemorhous mexicanus (Müller)) are known nest on man-made structure [60,61]. Therefore, these three species were excluded from the analysis. Due to differences in species ecology and habitat preferences among bird species, we limited the sharing of information within the model to subsets of species within each group based on nesting guilds. However, sharing of information among subsets of groups was only used for modeling the occupancy probability, not detection, given that nesting guilds do not influence the species detection probability based on the survey date and time.
To make inferences about group-level responses to habitat covariates, we constructed a hierarchical model using the basic model structure as described in Kery and Royle [63], with some modifications based on Cole et al. [64] and White et al. [65]. We modeled the species-specific detection probability, pi,j,k, and occupancy probability, Ψi,j, on the logit-probability scale as a function of habitat and survey covariates. To assess the avifauna detection response, we included the survey date (linear and quadratic terms) and survey timing (before, during, and after sunrise) as survey-specific covariates. We assigned the survey timing as dummy variables, with the intercept corresponding to a survey timing during sunrise.
Logit(pi,j,k) = α0i + α1i (survey datej,k) + α2i (survey date2j,k) + α3i (survey timing_beforej,k) + α4i (survey timing_afterj,k)
To assess the avifauna occupancy response to the vegetation structure, we included the presence of canebrake (“1” for presence and “0” for absence), canebrake characteristics (linear and quadratic terms of density and height), and vegetation characteristics summarized by PC1, PC2, and PC3 as site-specific covariates. Parameters representing canebrake characteristics are relevant only to canebrake sites and were indicated by variable wj, where wj = 1 if site j was a canebrake site and 0 for a non-canebrake site. Due to the replication of some survey sites, we treated the site-year as a sampling unit, resulting in a total of 100 site-year combinations, and included a year effect (2022, 2023, and 2024) on occupancy. We assigned the year as dummy variables, with the intercept corresponding to year 2022. To account for pseudoreplication due to stacking of years, we included the ‘site’ as a random effect (εsitej).
Logit(Ψi,j) = β0i + β1i (PC1j) + β2i (PC2j) + β3i (PC3j) + β4i (canebrake presencej) + (β5i (canebrake densityj) + β6i (canebrake density2j) + β7i (canebrake heightj)) × wj + β8i (year2023j) + β9i (year2024j) + εsitej
We used a Bayesian approach to estimate the posterior distribution of the parameters, with Markov chain Monte Carlo sampled using the package ‘JAGSUI’ [66] in program R ver. 4.4.1 [56]. We used non-informative priors of N(0,0.01) for all group mean parameters and Unif(0,5) for all group standard deviation parameters. We generated three chains of 20,000 iterations after a burn-in of 55,000, with a thinning rate of 10. We obtained 6000 samples to characterize the posterior. Model convergence was assessed using the Gelman–Rubin statistic (Rhat); convergence was acceptable when the Rhat-value < 1.1 [67].

3. Results

We collected 135.7 h of recordings across 100 site-years from 2022 to 2024. We detected 81 species after removal of flyover species and species that were associated with aquatic habitats (n = 11), by which 78 species were detected at canebrake sites and 74 species were detected at non-canebrake sites (Table S2). The northern cardinal (Cardinalis cardinalis (L.)), Acadian flycatcher (Empidonax virescens (Vieillot)), American crow/fish crow, and tufted titmouse (Baeolophus bicolor (L.)) were among the species with the highest detection and occupancy across sites. Eight species, including the blue grosbeak (Passerina caerulea (L.)), Canada warbler (Cardellina canadensis (L.)), eastern meadowlark (Sturnella magna (L.)), eastern whip-poor-will (Antrostomus vociferus (Wilson)), golden-winged warbler (Vermivora chrysoptera (L.)), house wren (Troglodytes aedon (Vieillot)), rose-breasted grosbeak (Pheucticus ludovicianus (L.)), and red-headed woodpecker (Melanerpes erythrocephalus (L.)), were unique to canebrake sites. Three species, the northern mockingbird (Mimus polyglottos (L.)), gray-cheeked thrush (Catharus minimus (Lafresnaye)), and cedar waxwing (Bombycilla cedrorum (Vieilliot)), were unique to non-canebrake sites. Fifty-nine species that we detected are considered neotropical migrants (Table S2) under the Neotropical Migratory Bird Conservation Act [68] and might use our study sites as stopover sites.

3.1. Community-Level Detection

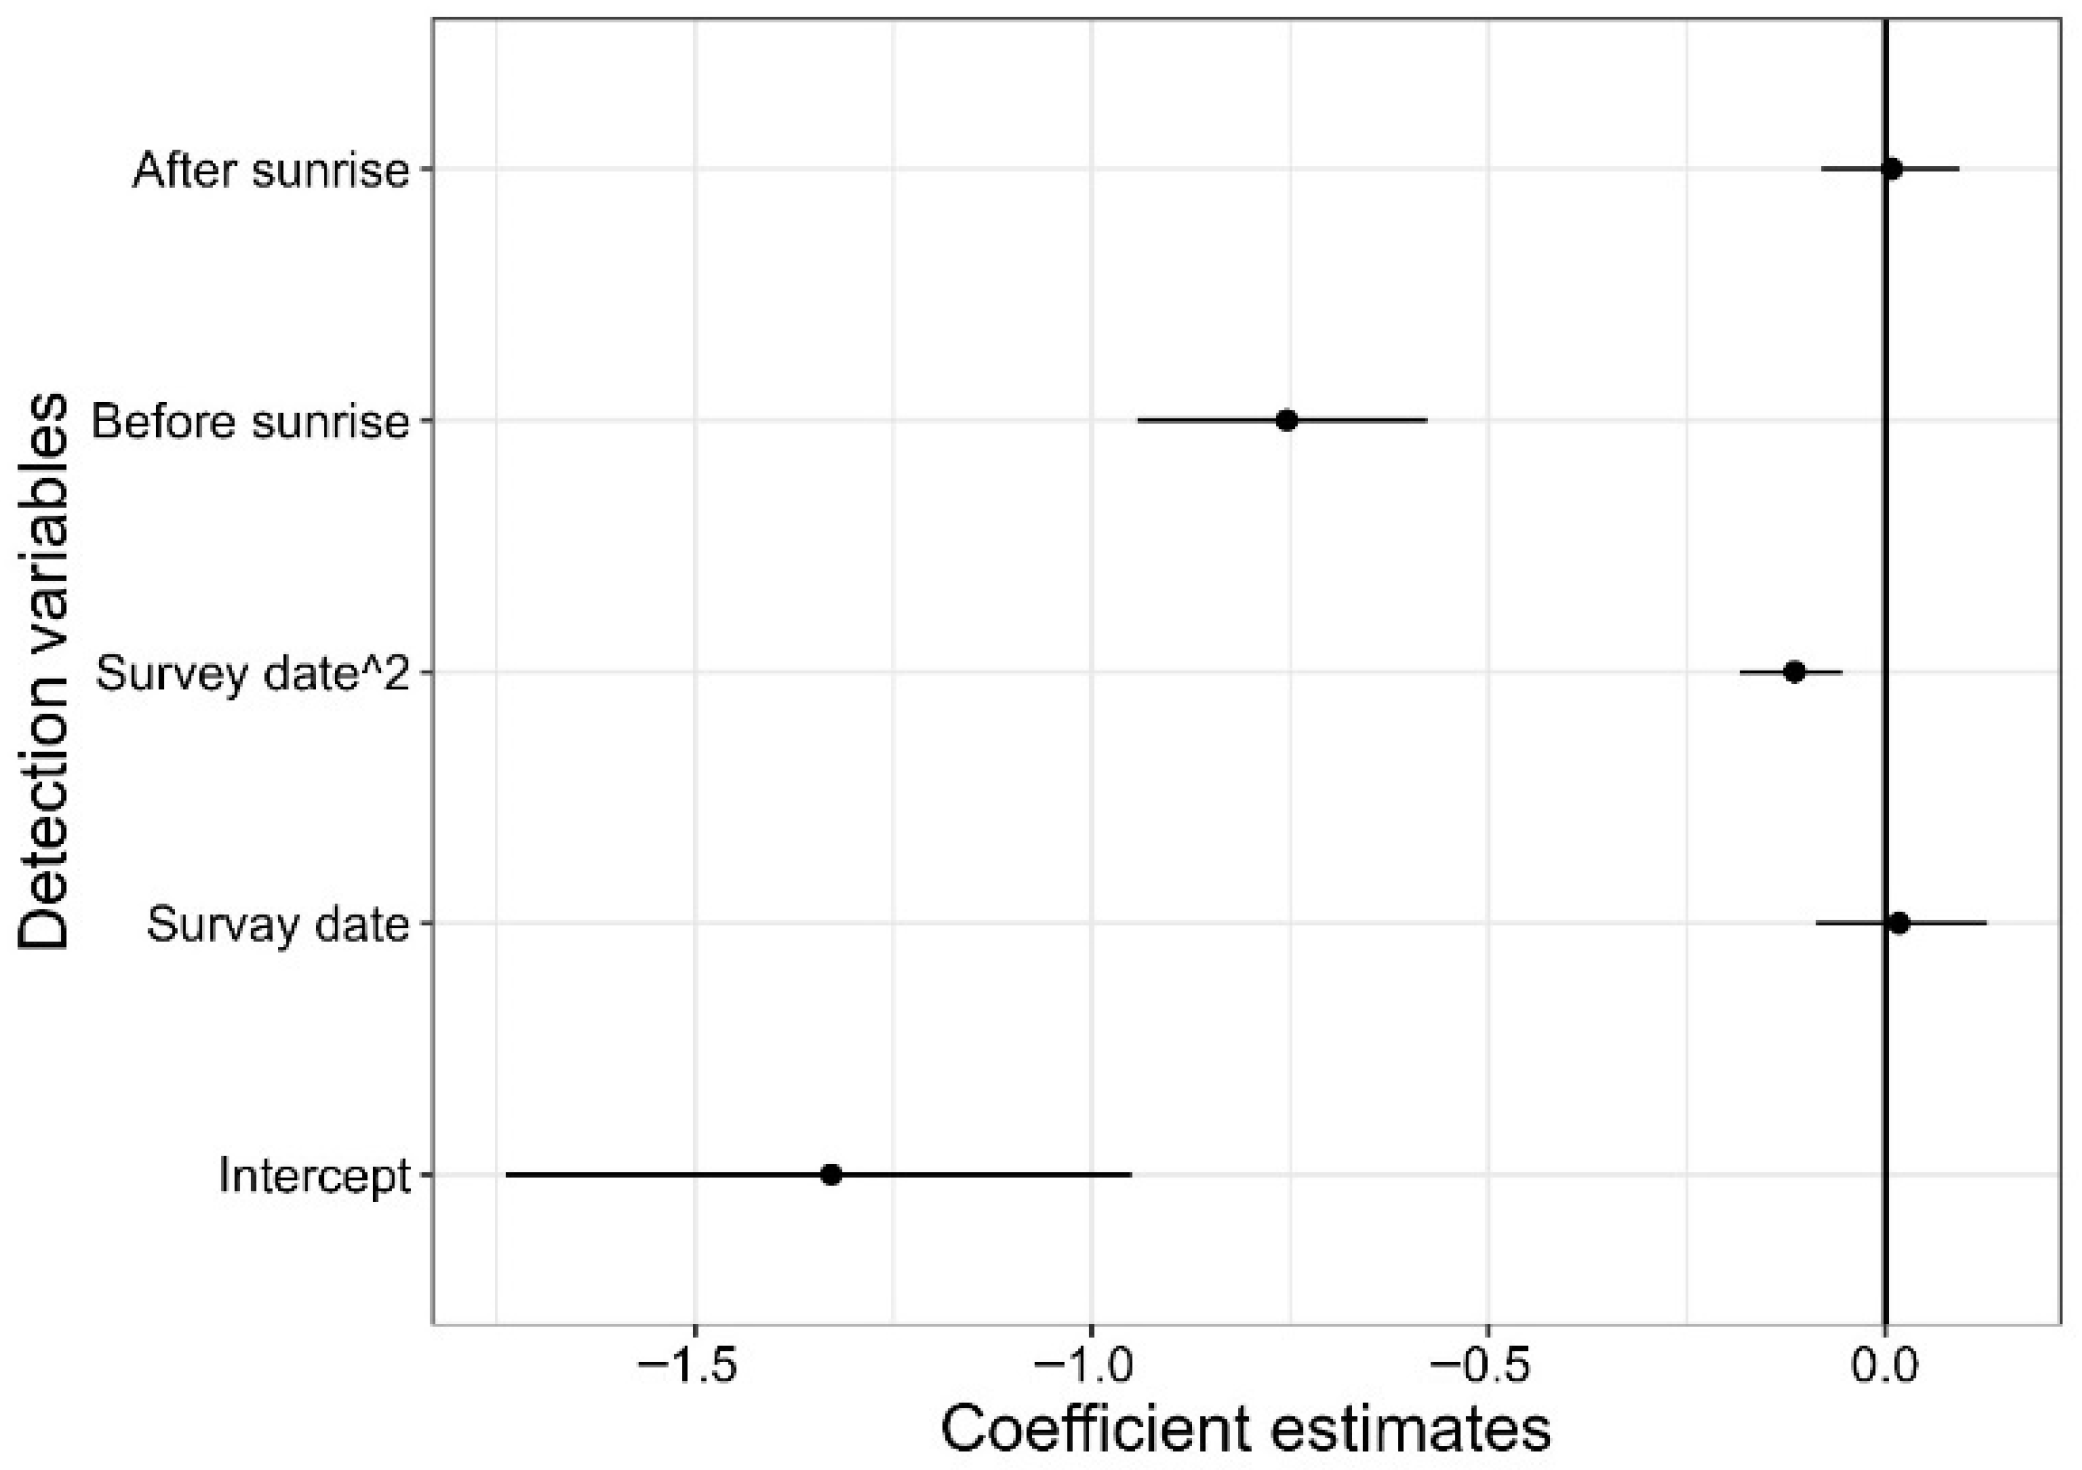
Overall, there was a significant negative relationship between detection probabilities of bird species and the quadratic term of survey dates (Figure 2). In addition, detection probabilities were significantly lower when surveys were conducted before sunrise, in comparison to a time at sunrise (Figure 2). Detection probabilities were not significantly affected by the remaining survey covariates (Figure 2).

3.2. Effects of Vegetation Structure on Species-Specific Occupancy

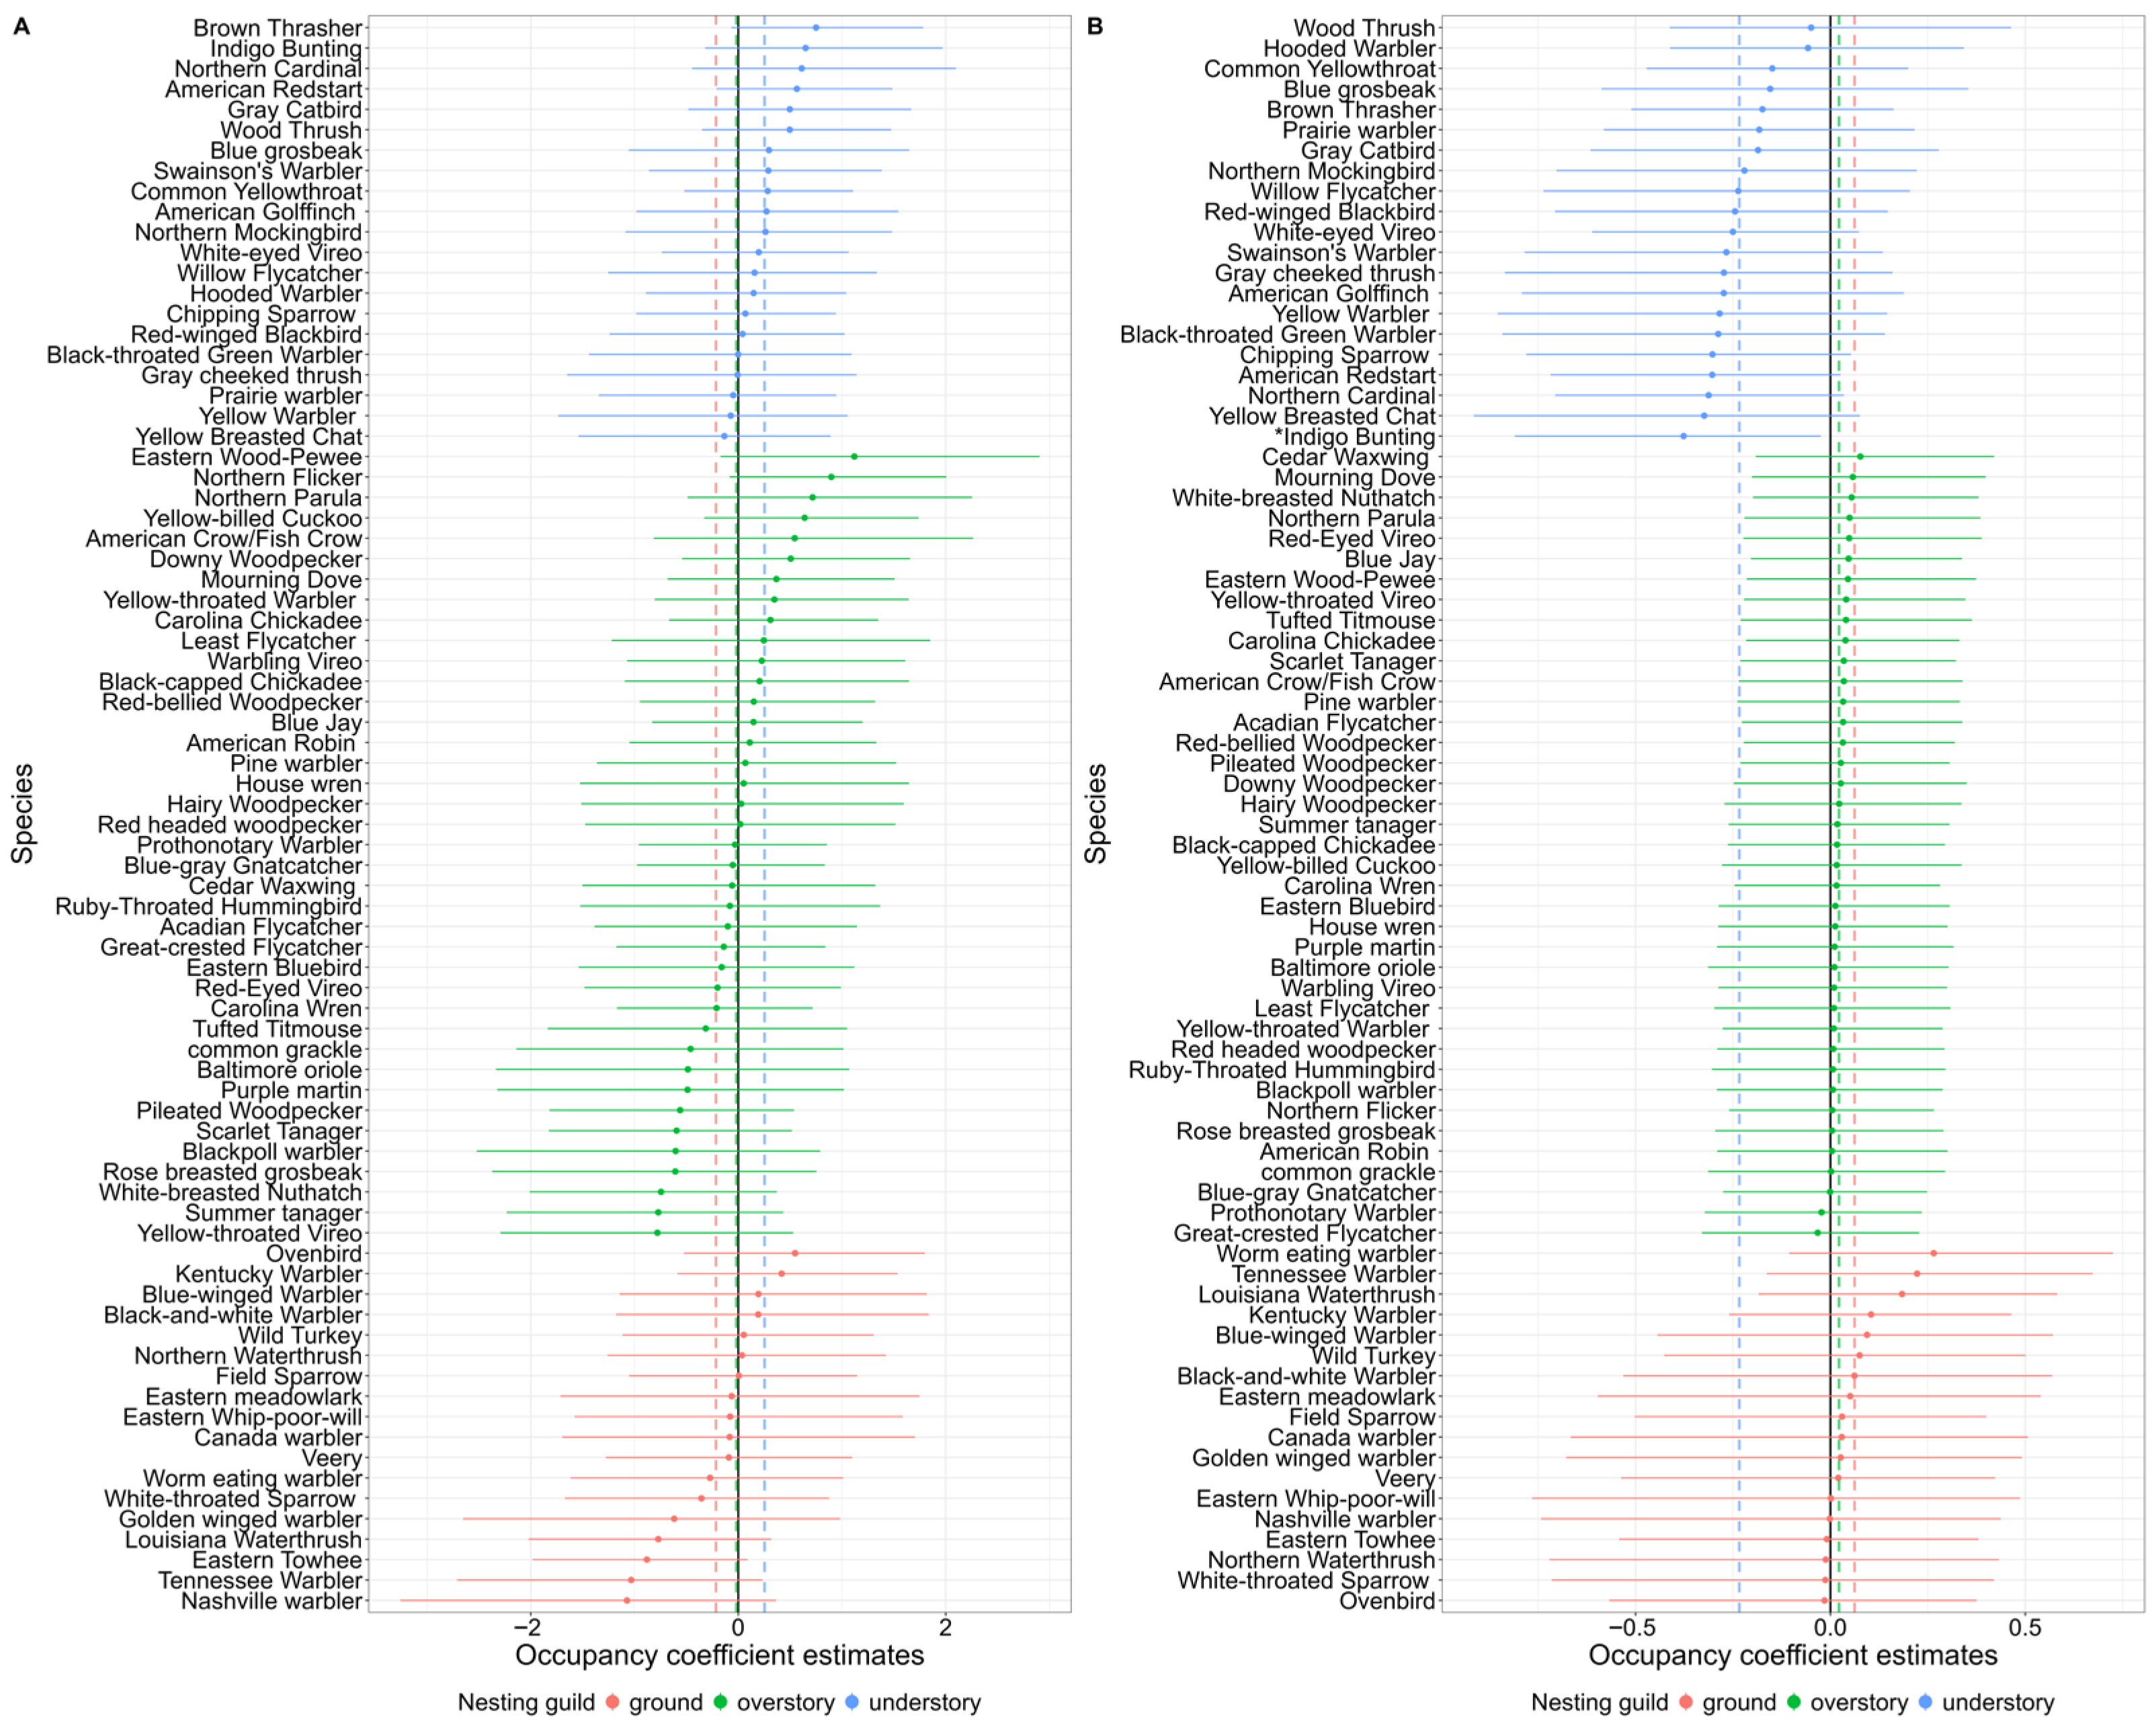
Responses to the vegetation structure were species-specific across nesting guilds (Figure 3). Approximately fifty-four percent of the species (42 out of 78 species) responded positively to the presence of canebrakes (Table S3). Species with positive responses to the presence of canebrakes were mostly within understory- and overstory-nesting guilds (Figure 3). Across canebrake sites, approximately 74%, 45% and 63% of the species had a positive response to canebrake height, density, and the quadratic term of canebrake density, respectively, although these responses were not statistically significant (Table S3). Among those species, only indigo bunting had a significant negative response to the quadratic term of canebrake density (bell-shaped) (Figure 3). For overstory vegetation characteristics, approximately 96%, 55%, and 44% of the species positively responded to PC1, PC2, and PC3, respectively, although these responses were not statistically significant (Table S3).

3.3. Effects of Vegetation Structure on Group-Specific Occupancy

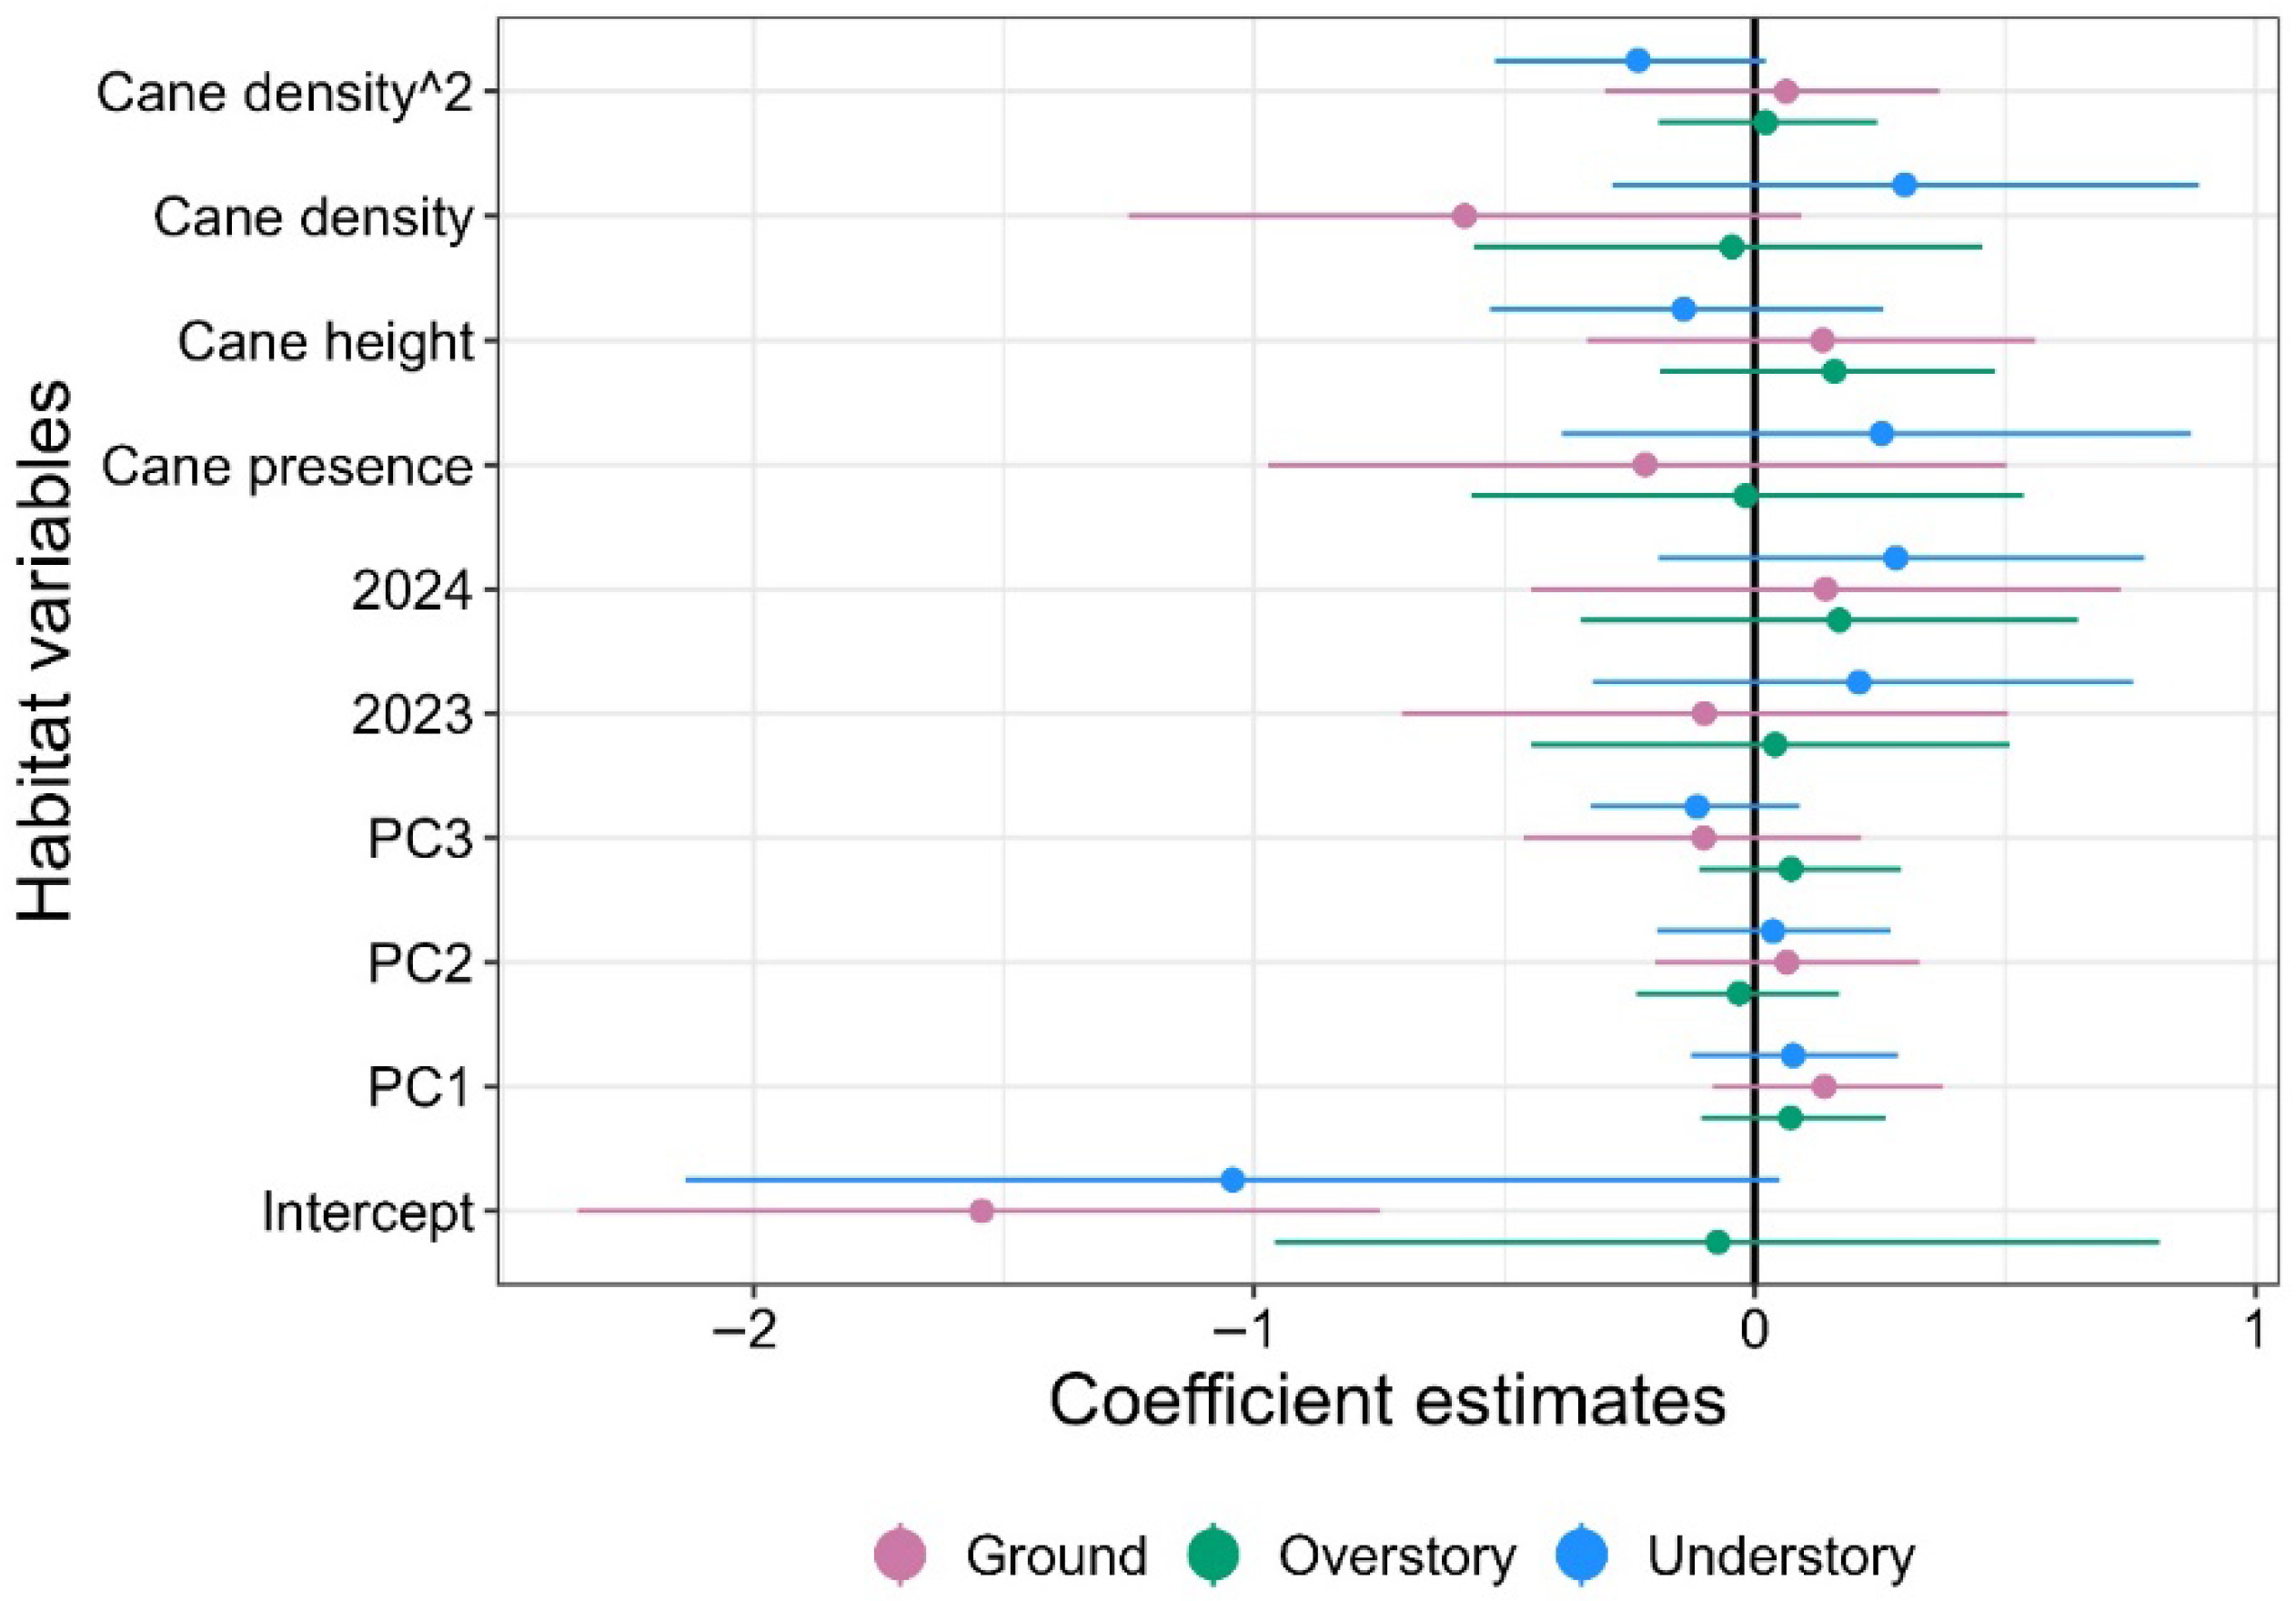
Group-specific occupancy probabilities for overstory species increased at sites with a (1) high PC1 and PC3, (small tree but high variation in tree DBH), (2) low PC2 (high tree density), and (3) the absence of canebrakes, although none were statistically significant (Figure 4). For canebrake sites, overstory species occupancy probabilities were higher at sites with tall canebrake but low in density, although the responses were not statistically significant (Figure 4).
Group-specific occupancy probabilities for understory species increased at sites with a (1) high PC1 and PC2 (small trees and low tree density), (2) low PC3 (low variation in tree DBH), and (3) the presence of canebrakes, although none were statistically significant (Figure 4). For canebrake sites, understory species occupancy probabilities were higher at sites with short canebrake but high in density, although the relationships were not statistically significant (Figure 4).
Group-specific occupancy probabilities for ground-nesting species increased at sites with a (1) high PC1 and PC2 (small trees and low tree density), (2) low PC3 (low variation in tree DBH), and (3) the absence of canebrakes (Figure 4). For canebrake sites, ground-nesting species occupancy probabilities were higher at canebrakes characterized by tall canebrake but a low density (Figure 4). However, none of the relationship between occupancy probabilities and vegetation structure was statistically significant.

4. Discussion

Overall, we observed a high number of bird species across all nesting guilds at canebrake sites, which was consistent with previous reports of a high bird diversity in or near canebrakes [23,24,25]. However, responses to the vegetation structure and the presence of canebrakes varied among species and nesting guilds. The forest composition is shaped by the interactions between tree cover and the development of understory and ground-layer vegetation [69,70,71]. Giant cane is among the species whose density and growth are influenced by light availability related to the tree cover [72,73,74,75]. An open canopy from disturbances, such as periodic fires, windstorms, and tree falls, allowed more light to reach the forest floor, leading to a higher density of canebrakes [72,73,74]. These relationships among forest layers highlight the importance of managing the overstory structure and understory vegetation to maintain forest features that promote the occupancy and habitat use of birds [34,71,76]. However, responses to changes in the canopy cover due to disturbances and successional stages are trait- and species-specific, which can also vary across forest types and sources of disturbances [77,78,79,80]. Studies reported a positive response to disturbances and canopy openness for species that are associated with edge/scrub habitats, ground-nesting species, and short-distance migrants [77,78,81]. Therefore, species that are associated with disturbances within forests and open habitat, such as indigo bunting, rusty blackbird (Euphagus carolinus (Müller)), rose-breasted grosbeak, and eastern towhee (Pipilo erythrophthalmus (L.)) [38], could benefit from a management of canebrakes.
Our hypothesis that the occupancy probability of canopy-nesting birds would be higher at sites with a large tree size and high tree density was not supported. We did not observe any significant relationships between overstory birds’ occupancy and the tree size or tree density. Although large trees created dense canopy cover for nest concealment from predators [76,82], the bird response to the stem density and tree size could be species-specific. For example, the presence and abundance of overstory species such as the eastern wood-pewee were positively related to the tree stem density [83]. Some canopy-nesting species, such as the Acadian flycatcher, great-crested flycatcher (Myiarchus crinitus (L.)), American redstart (Setophaga ruticilla (L.)), and yellow-throated vireo (Vireo flavifrons (Vieillot)), preferred areas with some canopy cover (40%–70%) [25]. Although retention of large canopy trees is important for species that are associated with mature forest [84], many bird species preferentially utilized forests with high structural diversity, like those containing mosaics of closed canopy and areas with gaps [34,49,81]. A high avian diversity was observed in mature, uneven-aged stands with various forest structures, such as snags and large woody debris [50]. Therefore, habitat use responses to the habitat structure may reflect a combination of multiple forest layers and the overall stand composition rather than the overstory layer alone. In addition, the presence of cavities, cracks, and bark pockets is important for cavity nesters [85], highlighting the importance of tree characteristics. Weak overstory responses could be a result of the spatial scale of our study (within-patch vs. stand-level) [83]. In addition, other traits, such as the migratory status (neotropical migrants vs. short-distance migrants) and foraging behaviors, could affect responses to habitat characteristics [78].
Given the relationships between canebrake vigor and overstory tree characteristics, we observed a negative relationship between overstory birds and the presence of canebrake, although it was not significant. Canebrakes required the high light intensity found in canopy gaps for growth and expansion [72,74]. Dense canebrakes are often associated with low-percentage canopy cover [75], which could limit the availability of overstory cover for species that nest in the trees. The trade-off between canebrake vigor and the overstory structure could explain the negative association between species that are associated with overstory cover and the canebrake presence.
Our hypothesis that the occupancy probability of species that utilize understory cover and canebrakes would be higher at sites with dense canebrake and low overstory cover was not supported. We found an increase in the occupancy probability of understory species with a small tree size with low variability, which can resemble early successional conditions found in canopy gaps [38], although the relationship was not significant. A mix of young trees, bare ground, and shrubs creates areas with dense ground cover for nesting [83]. Similar to our findings, understory species, such as the Carolina wren (Thryothorus ludovicianus (Latham)), white-eyed vireo, American redstart, Kentucky warbler, and hooded warbler, preferred a forest structure of treefall gaps [33].
Although the relationship was not significant, the occupancy probability of understory species was positively associated with the presence of canebrake and the canebrake density. The thicket structure of canebrake provided concealment for species that nest in the understory [24,33,39]. For example, the hooded warbler selected canebrake most often as the nest substrate [39]. Nests of white-eyed vireo, indigo bunting, and northern cardinal have also been found in canebrakes [25]. Eddleman et al. [21] also reported that canebrake was the dominant understory vegetation in Swainson’s warbler habitat in southern Illinois. The canebrake density was higher at occupied canebrake (6.1 culms/m2) than unoccupied canebrake (4.6 culms/m2) for Swainson’s warbler [22]. However, Peters et al. [29] reported a canebrake density of as low as 0.5–0.64 stems/m2 in areas used by Swainson’s warbler. The inconsistencies among studies regarding the density of canebrakes for Swainson’s warbler habitat could be influenced by other forest structure and canebrake characteristics [22].
Our hypothesis that the occupancy probability of ground-nesting species would be higher at sites with canebrake and high understory cover was not supported. We did not find a significant relationship between the occupancy of ground-nesting species and vegetation characteristics. Canebrake provides dense cover, which could conceal nests of ground-nesting birds such as wild turkeys (Meleagris gallopavo (L.)) from predators [24]. However, we observed a negative association between the occupancy of ground-nesting species and the canebrake density. A decrease in the occupancy of ground-nesting birds at sites with dense canebrake could be due to the low herbaceous ground cover and leaf litter depth found in dense canebrake [21,75]). For example, the abundance and nest site selection of ovenbirds were positively correlated with increased vegetation cover and a thick layer of leaf litter [86,87]. In addition, the density of ground- and shrub-nesting species such as the worm-eating warbler (Helmitheros vermivorum (Gmelin)) and Kentucky warbler was related to an increased tree height, ground litter, and understory density [34]. A positive association between the occupancy probability of ground-nesting species and canebrake height could be due to the high percentage of herbaceous cover often found at canebrake areas with taller culms [75], and an increased herbaceous layer could create more ground cover for nest concealment. Therefore, the balance between leaf litter depth and moderate overstory vegetation cover could influence the site occupancy of ground-nesting species [34,86,88].
Species that occupy canebrakes are often associated with forest opening, which is a characteristic of disturbed or early-succession habitats, as they prefer dense thickets of understory vegetation for nesting, roosting, and foraging [21,24,25,39]. However, canebrakes provide a wide array of microhabitat conditions, ranging from dense monodominant patches to lower-density conditions associated with the understory of a forest canopy. These differences in microhabitat conditions among canebrakes (e.g., open shrubs to forested areas with gaps) could lead to differences in species’ responses to canebrake sites. In addition, Pedroza and Guilherme [89] reported the absence of significant differences in the abundance, richness, and diversity of birds between bamboo habitats and adjacent non-bamboo habitats. Although the number of midstory and understory species was higher in bamboo habitats than non-bamboo habitats, as reported by Rother et al. [90], species abundance was similar between the two habitats. Utilization of canebrake habitats by both canebrake-associated species and non-canebrake species could also lead to insignificant results, such as those observed in our study. Moreover, because some patches of canebrakes were not large, we could detect species that were using areas outside of canebrakes. Nonetheless, the positive responses to the presence of canebrakes indicated that many species did not avoid canebrake habitat. However, the degree of dependency on canebrakes among the detected species needs further investigation.
Direct comparisons between our study and others should be made with caution due to the use of audio-recording units versus traditional point-counts. Species richness could be over-estimated or under-estimated by audio recordings in comparison with point-count surveys [91]. However, the detectability of the recording units varies depending on sound frequencies, directions, and habitat characteristics [92]. Mennill [91] reported a smaller radius of detection range (up to 100 m) for audio recordings in comparison to in-person point counts; however, the estimations of species richness were comparable between the two survey methods. Given that the audio recordings might have detected sounds up to 100 m [91], some species that were outside the boundaries of sites with small canebrake areas could be detected. Therefore, the occurrence of species detected in canebrakes, particularly those associated with dense overstory forests and low in detection (e.g., rare species), requires careful interpretation. In addition, the use of audio recordings limited our ability to determine the direct utilization of canebrake as a breeding ground (e.g., the presence of nests). Nest surveys within canebrakes and their surroundings could improve our understanding of species that rely on canebrakes for nesting.

5. Conclusions

Maintaining a hardwood forest stand with a heterogeneous overstory canopy cover (e.g., variations in tree height, density, and size) creates a range of mid- and understory light environments, allowing diverse habitat structures to benefit bird species across nesting guilds. The high diversity of forested birds observed at our canebrake sites highlighted the importance of maintaining and restoring canebrakes for bird conservation, especially for species that are associated with a dense understory and young forest stands. A moderate density of canebrakes would ensure sufficient cover for understory bird species, while allowing for the presence of other ground cover features such as shrub, herbaceous, and dense leaf litter. However, silviculture practices such as clear-cutting to create forest openings, which promote canebrake growth, may negatively impact forest-specialist species [79]. Therefore, maintaining a range of canebrake densities (e.g., wide range of canopy cover) through moderate disturbance, such as partial overstory removal and retaining some canopy trees, would be beneficial for birds with different nesting preferences. Moreover, silvicultural techniques such as variable retention harvesting and occasional burning also promote understory vegetation, such as shrub and herbaceous growth, for maintaining an open, early successional forest structure [71]. It is worth noting that canebrakes in our study were exclusively located within the forest cover; therefore, other bird species with different habitat preferences could be detected in canebrakes within treeless areas.
Although our study was conducted during the breeding season, habitat requirements for birds can vary throughout their life cycle (e.g., between breeding and non-breeding seasons) [13,93]. Species such as the red-winged blackbird (Agelaius phoeniceus (L.)), American robin (Turdus migratorius (L.)), rusty blackbird, and bobolink (Dolichonyx oryzivorus (L.)) were reported to use canebrake as a winter roosting habitat [24]. Year-round surveys of habitat uses of birds in canebrakes and associated forested areas could improve our understanding of habitat requirements for bird communities. In addition, determining habitat needs for birds requires information from multiple spatial scales [33,83]. Therefore, management of habitat within the fine-scale forest structure should be carried out along with the management of forest stand and landscape-scale factors. Furthermore, changes in hydrological regimes from channelization, conversion of land use, and river management could lead to changes in vegetation communities, prey abundance, and exposure to predation [94,95,96]. These changes could impact the composition of bird communities and breeding succession [33,96,97]. Given the vulnerability of wetlands and the riparian ecosystem to climate change [98,99], long-term monitoring of bird communities will be crucial for bird conservation.

Supplementary Materials

The following supporting information can be downloaded at https://www.mdpi.com/article/10.3390/f17030309/s1, Table S1: Results from the Principal Component Analysis (PCA) and factor loadings for the top three principal components; Table S2: A list of bird species detected across 100 site-year during May–July 2022–2024 in southern Illinois, USA with an exclusion of flyover species and species that are associated with aquatic habitats; Table S3: Summary of multi-species occupancy model estimates and 95% confidence intervals on occupancy and detection of 78 species of avifauna surveyed across 100 site-year during May–July 2022–2024 in southern Illinois, USA.

Author Contributions

Conceptualization, T.S., C.K.N., J.W.G., B.S.P., J.J.Z., and J.E.S.; Methodology, T.S., C.K.N., and J.W.G.; Data Collection, T.S.; Data Analyses, T.S.; Writing—Original Draft Preparation, T.S.; Writing—Review and Editing, T.S., C.K.N., J.W.G., B.S.P., J.J.Z., and J.E.S.; Supervision, C.K.N., J.W.G., B.S.P., J.J.Z., and J.E.S.; Funding Acquisition, J.W.G. All authors have read and agreed to the published version of the manuscript.

Funding

This research was funded by the McIntire-Stennis Cooperative Forestry Research Program Project Number ILLZ 23-R-001.

Institutional Review Board Statement

This study was conducted under IACUC permit #22-007, CCNWR permit #2022-003/2023-001R/2024-002, Shawnee NF permit #2600, IDNR permit #SS22-26/SS23-08/SS24-09, and research permit #W22.2004/W23.2004/W24.2024.

Data Availability Statement

Data is available as a supplementary file.

Acknowledgments

We thank Matt Conrad and Connor Marland for assisting with bird identification. We thank Jake Trowbridge, Laura Schammel, Ray Mentzer, Cory Vines, Madison Woods, and Hannah Bendler for helping with data collection. In addition, we would like to thank Karen Mangan, Amanda Nelson, IDNR, CCNWR, Shawnee NF biologists, and the Center for Wildlife Sustainability Research researchers for helping with permits and canebrake locations.

Conflicts of Interest

The authors declare no conflicts of interest.

Abbreviations

The following abbreviations are used in this manuscript:
ARUAudio recording unit
DBHDiameter at breast height
PCPrincipal component

References

  1. Harris, L.D. The Faunal Significance of Fragmentation of Southeastern Bottomland Forests. In Proceedings of the Symposium, the Forested Wetlands of the Southern United States; U.S. Department of Agriculture, Forest Service, Southeastern Forest Experiment Station: Asheville, NC, USA, 1989; Volume 50, pp. 126–134. [Google Scholar]
  2. Robinson, S.K.; Thompson, F.R., III; Donovan, T.M.; Whitehead, D.R.; Faaborg, J. Regional Forest Fragmentation and the Nesting Success of Migratory Birds. Science 1995, 267, 1987–1990. [Google Scholar] [CrossRef]
  3. Venture, L.M.V.J. Restoration, Management, and Monitoring of Forest Resources in the Mississippi Alluvial Valley: Recommendations for Enhancing Wildlife Habitat; Wilson, R., Ribbeck, K., King, S., Twedt, D., Eds.; LMVJV: Vicksburg, MS, USA, 2007. [Google Scholar]
  4. Benson, T.J.; Bednarz, J.C. Short-Term Effects of Flooding on Understory Habitat and Presence of Swainson’s Warblers. Wetlands 2010, 30, 29–37. [Google Scholar] [CrossRef]
  5. Hamel, P.B.; Meadows, J.S.; Gardiner, E.S.; Stanturf, J.A. Chainsaws, Canebrakes, and Cotton Fields: Sober Thoughts on Silviculture for Songbirds in Bottomland Forests. In Bottomland Hardwoods of the Mississippi Alluvial Valley: Characteristics and Management of Natural Function, Structure, and Composition; U.S. Department of Agriculture, Forest Service, Southern Research Station: Asheville, NC, USA, 2001; Volume 42, pp. 99–105. [Google Scholar]
  6. Faulkner, S.; Barrow, W., Jr.; Keeland, B.; Walls, S.; Telesco, D. Effects of Conservation Practices on Wetland Ecosystem Services in the Mississippi Alluvial Valley. Ecol. Appl. 2011, 21, S31–S48. [Google Scholar] [CrossRef]
  7. Allen, J.A.; Keeland, B.D.; Stanturf, J.A.; Clewell, A.F.; Kennedy, H.E., Jr. A Guide to Bottomland Hardwood Restoration; U.S. Geological Survey: Reston, VA, USA, 2004.
  8. Wilson, R.; Oliver, J.; Twedt, D.; Uihlein, W., III. Bottomland Hardwood Restoration in the Mississippi Alluvial Valley: Looking Past the Trees to See the Forest. In Ecology and Management of Bottomland Hardwood Systems: The State of Our Understanding: A Symposium; University of Missouri-Columbia: Columbia, MO, USA, 2005. [Google Scholar]
  9. Groninger, J.W. Increasing the Impact of Bottomland Hardwood Afforestation. J. For. 2005, 103, 184–188. [Google Scholar] [CrossRef]
  10. Shoemaker, C.M. Environmental and Landscape Factors Affecting the Continued Suppression of Canebrakes (Arundinaria gigantea, Poaceae) within Restorations of Bottomland Hardwood Forests. J. Torrey Bot. Soc. 2018, 145, 156–162. [Google Scholar] [CrossRef]
  11. Smith, W.P.; Hunt, H.E.; Townley, W.K. A Comparison of Breeding Bird Communities and Habitat Features between Old-Growth and Second-Growth. In Bottomland Hardwoods of the Mississippi Alluvial Valley: Characteristics and Management of Natural Function, Structure, and Composition; U.S. Department of Agriculture, Forest Service, Southern Research Station: Asheville, NC, USA, 2001; Volume 42, pp. 65–82. [Google Scholar]
  12. Wilson, R.R.; Twedt, D.J. Spring Bird Migration in Mississippi Alluvial Valley Forests. Am. Midl. Nat. 2003, 149, 163–175. [Google Scholar] [CrossRef]
  13. Montague-Drake, R.; Lindenmayer, D.; Cunningham, R. Factors Affecting Site Occupancy by Woodland Bird Species of Conservation Concern. Biol. Conserv. 2009, 142, 2896–2903. [Google Scholar] [CrossRef]
  14. Moorman, C.E.; Bowen, L.T.; Kilgo, J.C.; Hanula, J.L.; Horn, S.; Ulyshen, M.D. Arthropod Abundance and Seasonal Bird Use of Bottomland Forest Harvest Gaps. Wilson J. Ornithol. 2012, 124, 31–39. [Google Scholar] [CrossRef]
  15. Tucker, G.C. The Genera of Bambusoideae (Gramineae) in the Southeastern United States. J. Arnold Arbor. 1988, 69, 239–273. [Google Scholar] [CrossRef]
  16. Ward, D.B. Scientific Note: Arundinaria gigantea and Arundinaria Macrosperma, the Correct Names Respectively for the Switch Cane and the Giant Cane. Castanea 2009, 74, 189–195. [Google Scholar] [CrossRef]
  17. Triplett, J.K.; Oltrogge, K.A.; Clark, L.G. Phylogenetic Relationships and Natural Hybridization among the North American Woody Bamboos (Poaceae: Bambusoideae: Arundinaria). Am. J. Bot. 2010, 97, 471–492. [Google Scholar] [CrossRef]
  18. Noss, R.F.; Scott, J.M.; LaRoe, E.T., III. Endangered Ecosystems of the United States: A Preliminary Assessment of Loss and Degradation; US Department of the Interior, National Biological Service: Washington, DC, USA, 1995; Volume 28.
  19. Gagnon, P.R. Fire in Floodplain Forests in the Southeastern USA: Insights from Disturbance Ecology of Native Bamboo. Wetlands 2009, 29, 520–526. [Google Scholar] [CrossRef]
  20. Gagnon, P.R.; Passmore, H.A.; Platt, W.J. Multi-Year Salutary Effects of Windstorm and Fire on River Cane. Fire Ecol. 2013, 9, 55–65. [Google Scholar] [CrossRef]
  21. Eddleman, W.R.; Evans, K.E.; Elder, W.H. Habitat Characteristics and Management of Swainson’s Warbler in Southern Illinois. Wildl. Soc. Bull. 1980, 8, 228–233. [Google Scholar]
  22. Thomas, B.G.; Wiggers, E.P.; Clawson, R.L. Habitat Selection and Breeding Status of Swainson’s Warblers in Southern Missouri. J. Wildl. Manag. 1996, 60, 611–616. [Google Scholar] [CrossRef]
  23. Platt, S.G.; Brantley, C.G.; Rainwater, T.R. Canebrake Fauna: Wildlife Diversity in a Critically Endangered Ecosystem. J. Elisha Mitchell Sci. Soc. 2001, 117, 1–19. [Google Scholar]
  24. Platt, S.G.; Rainwater, T.R.; Elsey, R.M.; Brantley, C.G. Canebrake Fauna Revisited: Additional Records of Species Diversity in a Critically Endangered Ecosystem. J. Am. Bamboo Soc. 2013, 26, 1–12. [Google Scholar]
  25. Hoover, J.P. Survey of the Distribution, Size, and Development of Canebrakes in Southern Illinois; Illinois Natural History Survey: Champaign, IL, USA, 2010. [Google Scholar]
  26. Sallabanks, R.; Walters, J.R.; Collazo, J.A. Breeding Bird Abundance in Bottomland Hardwood Forests: Habitat, Edge, and Patch Size Effects. Condor 2000, 102, 748–758. [Google Scholar] [CrossRef]
  27. Brantley, C.G.; Platt, S.G. Canebrake Conservation in the Southeastern United States. Wildl. Soc. Bull. 2001, 29, 1175–1181. [Google Scholar]
  28. Somershoe, S.G.; Hudman, S.P.; Chandler, C.R. Habitat Use by Swainson’s Warblers in a Managed Bottomland Forest. Wilson Bull. 2003, 115, 148–154. [Google Scholar] [CrossRef]
  29. Peters, K.A.; Lancia, R.A.; Gerwin, J.A. Swainson’s Warbler Habitat Selection in a Managed Bottomland Hardwood Forest. J. Wildl. Manag. 2005, 69, 409–417. [Google Scholar] [CrossRef]
  30. Remsen, J. Was Bachman’s Warbler a Bamboo Specialist? Auk 1986, 103, 216–219. [Google Scholar]
  31. Steinberg, M.K. The Importance of Cultural Ecological Landscapes to the Survival of the Bachman’s Warbler (Vermivora bachmanii) in the Southeastern United States. Southeast. Geogr. 2010, 50, 272–281. [Google Scholar] [CrossRef]
  32. U.S. Fish and Wildlife Service. Birds of Conservation Concern 2021: Migratory Bird Program; U.S. Fish and Wildlife Service: Washington, DC, USA, 2021.
  33. Pashley, D.N.; Barrow, W.C. Effects of Land Use Practices on Neotropical Migratory Birds in Bottomland Hardwood Forests. In Status and Management of Neotropical Migratory Birds; Finch, D.M., Stangel, P.W., Eds.; Gen. Tech. Rep. RM-229; Rocky Mountain Forest and Range Experiment Station, US Dept. of Agriculture, Forest Service: Fort Collins, CO, USA, 1993; Volume 229, pp. 315–320. [Google Scholar]
  34. Bakermans, M.H.; Rodewald, A.D.; Vitz, A.C. Influence of Forest Structure on Density and Nest Success of Mature Forest Birds in Managed Landscapes. J. Wildl. Manag. 2012, 76, 1225–1234. [Google Scholar] [CrossRef]
  35. Milligan, M.C.; Dickinson, J.L. Habitat Quality and Nest-Box Occupancy by Five Species of Oak Woodland Birds. Auk Ornithol. Adv. 2016, 133, 429–438. [Google Scholar] [CrossRef]
  36. Sergio, F.; Newton, I. Occupancy as a Measure of Territory Quality. J. Anim. Ecol. 2003, 72, 857–865. [Google Scholar] [CrossRef]
  37. MacKenzie, D.I.; Nichols, J.D.; Lachman, G.B.; Droege, S.; Andrew Royle, J.; Langtimm, C.A. Estimating Site Occupancy Rates When Detection Probabilities Are Less than One. Ecology 2002, 83, 2248–2255. [Google Scholar] [CrossRef]
  38. Hunter, W.C.; Buehler, D.A.; Canterbury, R.A.; Confer, J.L.; Hamel, P.B. Conservation of Disturbance-Dependent Birds in Eastern North America. Wildl. Soc. Bull. 2001, 29, 440–455. [Google Scholar]
  39. Kilgo, J.C.; Sargent, R.A.; Chapman, B.R.; Miller, K.V. Nest-Site Selection by Hooded Warblers in Bottomland Hardwoods of South Carolina. Wilson Bull. 1996, 108, 53–60. [Google Scholar]
  40. Kruse, B.S.; Groninger, J.W. Vegetative Characteristics of Recently Reforested Bottomlands in the Lower Cache River Watershed, Illinois, USA. Restor. Ecol. 2003, 11, 273–280. [Google Scholar] [CrossRef]
  41. Crocker, S. Forests of Illinois, 2017; U.S. Department of Agriculture, Forest Service, Northern Research Station: Newtown Square, PA, USA, 2018.
  42. Crocker, S.J.; Brand, G.J.; Butler, B.J.; Haugen, D.E.; Little, D.C.; Meneguzzo, D.M.; Perry, C.H.; Piva, R.J.; Wilson, B.T.; Woodall, C.W. Illinois’ Forests 2005; Resour. Bull. NRS-29; U.S. Department of Agriculture, Forest Service, Northern Research Station: Newtown Square, PA, USA, 2009; Volume 29, p. 114. [CrossRef]
  43. Hosner, J.F.; Minckler, L.S. Bottomland Hardwood Forests of Southern Illinois—Regeneration and Succession. Ecology 1963, 44, 29–41. [Google Scholar] [CrossRef]
  44. Nelson, A.M.; Stoebner, T.J.; Schoonover, J.E.; Williard, K.W. Using Physical Parameters and Geographic Information System Analyses to Predict Potential Riparian Restoration Sites for Giant Cane in Southern Illinois; U.S. Department of Agriculture, Forest Service, Northern Research Station: Newtown Square, PA, USA, 2014; pp. 49–60.
  45. National Oceanic and Atmospheric Administration [NOAA]. Annual Climatological Statistics 1991–2020: Illinois (Station USC00110187); National Oceanic and Atmospheric Administration: Silver Spring, MD, USA, 2021.
  46. Dixon, A.P.; Baker, M.E.; Ellis, E.C. Agricultural Landscape Composition Linked with Acoustic Measures of Avian Diversity. Land 2020, 9, 145. [Google Scholar] [CrossRef]
  47. Toenies, M.; Rich, L.N. Advancing Bird Survey Efforts through Novel Recorder Technology and Automated Species Identification. Calif. Fish Wildl. 2021, 107, 56–70. [Google Scholar] [CrossRef]
  48. Rainforest Connection (RFCx). Available online: https://rfcx.org/ (accessed on 20 July 2025).
  49. Twedt, D.J.; Wilson, R.R. Management of Bottomland Hardwood Forests for Birds; Louisiana State University: Baton Rouge, LA, USA, 2007; pp. 49–64. [Google Scholar]
  50. Carrillo-Rubio, E.; Kery, M.; Morreale, S.J.; Sullivan, P.J.; Gardner, B.; Cooch, E.G.; Lassoie, J.P. Use of Multispecies Occupancy Models to Evaluate the Response of Bird Communities to Forest Degradation Associated with Logging. Conserv. Biol. 2014, 28, 1034–1044. [Google Scholar] [CrossRef] [PubMed]
  51. Shaw, T.; Scherer-Lorenzen, M.; Müller, S. Forest Structural Heterogeneity Positively Affects Bird Richness and Acoustic Diversity in a Temperate, Central European Forest. Front. Ecol. Evol. 2024, 12, 1387879. [Google Scholar] [CrossRef]
  52. Storch, F.; Dormann, C.F.; Bauhus, J. Quantifying Forest Structural Diversity Based on Large-Scale Inventory Data: A New Approach to Support Biodiversity Monitoring. For. Ecosyst. 2018, 5, 34. [Google Scholar] [CrossRef]
  53. Pariyar, S.; Mandal, R.A. Comparative Tree Height Measurement Using Different Instrument. Int. J. Ecol. Environ. Sci. 2019, 1, 12–17. [Google Scholar]
  54. Dormann, C.F.; Elith, J.; Bacher, S.; Buchmann, C.; Carl, G.; Carré, G.; Marquéz, J.R.G.; Gruber, B.; Lafourcade, B.; Leitão, P.J. Collinearity: A Review of Methods to Deal with It and a Simulation Study Evaluating Their Performance. Ecography 2013, 36, 27–46. [Google Scholar] [CrossRef]
  55. Oksanen, J. Vegan: Community Ecology Package. R Package Version 2015, 2, 3. [Google Scholar]
  56. R Core Team. R: A Language and Environment for Statistical Computing. R Foundation for Statistical Computing, Vienna, Austria. 2024. Available online: http://www.R-project.org/ (accessed on 6 November 2025).
  57. Dorazio, R.M.; Royle, J.A. Estimating Size and Composition of Biological Communities by Modeling the Occurrence of Species. J. Am. Stat. Assoc. 2005, 100, 389–398. [Google Scholar] [CrossRef]
  58. Zipkin, E.F.; Royle, J.A.; Dawson, D.K.; Bates, S. Multi-Species Occurrence Models to Evaluate the Effects of Conservation and Management Actions. Biol. Conserv. 2010, 143, 479–484. [Google Scholar] [CrossRef]
  59. Zipkin, E.F.; DeWan, A.; Andrew Royle, J. Impacts of Forest Fragmentation on Species Richness: A Hierarchical Approach to Community Modelling. J. Appl. Ecol. 2009, 46, 815–822. [Google Scholar] [CrossRef]
  60. Cooper, W.J.; McShea, W.J.; Forrester, T.; Luther, D.A. The Value of Local Habitat Heterogeneity and Productivity When Estimating Avian Species Richness and Species of Concern. Ecosphere 2020, 11, e03107. [Google Scholar] [CrossRef]
  61. Online Bird Guide, Bird ID Help, Life History, Bird Sounds from Cornell. Available online: https://www.allaboutbirds.org/news/ (accessed on 13 August 2025).
  62. Lowther, P.E. Nest Selection by Brown-Headed Cowbirds. Wilson Bull. 1979, 91, 118–122. [Google Scholar]
  63. Kéry, M.; Royle, J.A. Applied Hierarchical Modeling in Ecology: Analysis of Distribution, Abundance and Species Richness in R and BUGS; Academic Press: Cambridge, MA, USA, 2015. [Google Scholar]
  64. Cole, J.S.; Siegel, R.B.; Loffland, H.L.; Tingley, M.W.; Elsey, E.A.; Johnson, M. Explaining the Birds and the Bees: Deriving Habitat Restoration Targets from Multi-species Occupancy Models. Ecosphere 2019, 10, e02718. [Google Scholar] [CrossRef]
  65. White, S.; Faulk, E.; Tzilkowski, C.; Weber, A.; Marshall, M.; Wagner, T. Predicting Fish Species Richness and Habitat Relationships Using Bayesian Hierarchical Multispecies Occupancy Models. Can. J. Fish. Aquat. Sci. 2020, 77, 602–610. [Google Scholar] [CrossRef]
  66. Kellner, K. CRAN: Contributed Packages; jagsUI: A Wrapper around ‘rjags’ to Streamline ’JAGS’ analyses; CRAN: Vienna, Austria, 2015. [Google Scholar]
  67. Kéry, M.; Schaub, M. Bayesian Population Analysis Using WinBUGS: A Hierarchical Perspective; Academic Press: Cambridge, MA, USA, 2011. [Google Scholar]
  68. Neotropical Migratory Bird Conservation Act Species List. Available online: https://www.fws.gov/sites/default/files/documents/neotropical-migratory-bird-conservation-act-species-list.xlsx (accessed on 18 December 2025).
  69. Urban, D.L.; Smith, T.M. Microhabitat Pattern and the Structure of Forest Bird Communities. Am. Nat. 1989, 133, 811–829. [Google Scholar] [CrossRef]
  70. Yanai, R.D.; Twery, M.J.; Stout, S.L. Woody Understory Response to Changes in Overstory Density: Thinning in Allegheny Hardwoods. For. Ecol. Manag. 1998, 102, 45–60. [Google Scholar] [CrossRef]
  71. Hanberry, B.B.; Thompson, F.R., III. Open Forest Management for Early Successional Birds. Wildl. Soc. Bull. 2019, 43, 141–151. [Google Scholar] [CrossRef]
  72. Gagnon, P.R.; Platt, W.J.; Moser, E.B. Response of a Native Bamboo [Arundinaria gigantea (Walt.) Muhl.] in a Wind-Disturbed Forest. For. Ecol. Manag. 2007, 241, 288–294. [Google Scholar] [CrossRef]
  73. Gagnon, P.R.; Platt, W.J. Multiple Disturbances Accelerate Clonal Growth in a Potentially Monodominant Bamboo. Ecology 2008, 89, 612–618. [Google Scholar] [CrossRef]
  74. Cirtain, M.C.; Franklin, S.B.; Pezeshki, S.R. Effect of Light Intensity on Arundinaria Gigantea Growth and Physiology. Castanea 2009, 74, 236–246. [Google Scholar] [CrossRef]
  75. Suriyamongkol, T.; Zaczek, J.J.; Pease, B.S.; Schoonover, J.E.; Nielsen, C.K.; Groninger, J.W. Relationships between Forest Cover and Canebrakes in Southern Illinois. Erigenia 2025, 48, 48–56. [Google Scholar]
  76. Twedt, D.J.; Wilson, R.R.; Henne-Kerr, J.L.; Grosshuesch, D.A. Avian Response to Bottomland Hardwood Reforestation: The First 10 Years. Restor. Ecol. 2002, 10, 645–655. [Google Scholar] [CrossRef]
  77. Brawn, J.D.; Robinson, S.K.; Thompson, F.R., III. The Role of Disturbance in the Ecology and Conservation of Birds. Annu. Rev. Ecol. Syst. 2001, 32, 251–276. [Google Scholar] [CrossRef]
  78. Buffington, J.M.; Kilgo, J.C.; Sargent, R.A.; Miller, K.V.; Chapman, B.R. Comparison of Breeding Bird Communities in Bottomland Hardwood Forests of Different Successional Stages. Wilson Bull. 1997, 109, 314–319. [Google Scholar]
  79. Durães, R.; Carrasco, L.; Smith, T.B.; Karubian, J. Effects of Forest Disturbance and Habitat Loss on Avian Communities in a Neotropical Biodiversity Hotspot. Biol. Conserv. 2013, 166, 203–211. [Google Scholar] [CrossRef]
  80. Graser, A.; Frank, C.; Kunz, F.; Schuldt, A.; Senf, C.; Sudfeldt, C.; Trautmann, S.; Kamp, J. Increase in Disturbance-Induced Canopy Gaps Leads to Reorganization of Central European Bird Communities. Basic Appl. Ecol. 2025, 83, 88–97. [Google Scholar] [CrossRef]
  81. Fuller, R.J. Influence of Treefall Gaps on Distributions of Breeding Birds within Interior Old-Growth Stands in Białowieża Forest, Poland. Condor 2000, 102, 267–274. [Google Scholar] [CrossRef]
  82. Gebremichael, G.; Hundera, K.; De Decker, L.; Aerts, R.; Lens, L.; Atickem, A. Bird Community Composition and Functional Guilds Response to Vegetation Structure in Southwest Ethiopia. Forests 2022, 13, 2068. [Google Scholar] [CrossRef]
  83. McDermott, M.E.; Wood, P.B.; Miller, G.W.; Simpson, B.T. Predicting Breeding Bird Occurrence by Stand-and Microhabitat-Scale Features in Even-Aged Stands in the Central Appalachians. For. Ecol. Manag. 2011, 261, 373–380. [Google Scholar] [CrossRef]
  84. Gharehaghaji, M.; Shabani, A.A.; Feghhi, J.; Danehkar, A.; Kaboli, M.; Ashrafi, S. Effects of Landscape Context on Bird Species Abundance of Tree Fall Gaps in a Temperate Deciduous Forest of Northern Iran. For. Ecol. Manag. 2012, 267, 182–189. [Google Scholar] [CrossRef]
  85. Vuidot, A.; Paillet, Y.; Archaux, F.; Gosselin, F. Influence of Tree Characteristics and Forest Management on Tree Microhabitats. Biol. Conserv. 2011, 144, 441–450. [Google Scholar] [CrossRef]
  86. Senner, N.R.; Goodrich, L.J.; Barber, D.R.; Miller, M. Ovenbird Nest Site Selection within a Large Contiguous Forest in Eastern Pennsylvania: Microhabitat Characteristics and Nesting Density. J. Pa. Acad. Sci. 2009, 83, 3–9. [Google Scholar]
  87. Fox, V.L.; Buehler, C.P.; Byers, C.M.; Drake, S.E. Forest Composition, Leaf Litter, and Songbird Communities in Oak-vs. Maple-Dominated Forests in the Eastern United States. For. Ecol. Manag. 2010, 259, 2426–2432. [Google Scholar] [CrossRef]
  88. Rodewald, P.G.; Smith, K.G. Short-Term Effects of Understory and Overstory Management on Breeding Birds in Arkansas Oak-Hickory Forests. J. Wildl. Manag. 1998, 62, 1411–1417. [Google Scholar] [CrossRef]
  89. Pedroza, D.; Guilherme, E. Community Structure and Spatial Distribution of Understory Birds in Three Bamboo-Dominated Forests in Southwestern Amazonia. Community Ecol. 2021, 22, 277–293. [Google Scholar] [CrossRef]
  90. Rother, D.C.; Alves, K.J.F.; Pizo, M.A. Avian Assemblages in Bamboo and Non-Bamboo Habitats in a Tropical Rainforest. Emu 2013, 113, 52–61. [Google Scholar] [CrossRef]
  91. Mennill, D. Field Tests of Small Autonomous Recording Units: An Evaluation of in-Person versus Automated Point Counts and a Comparison of Recording Quality. Bioacoustics 2024, 33, 157–177. [Google Scholar] [CrossRef]
  92. Entling, M.H.; Ehlers, P.T.; Edo, M.; Rösch, V. Influence of Distance, Frequency, Habitat and Angle of Incidence on Sound Levels in Passive Acoustic Monitoring with AudioMoth Recorders. Ann. Appl. Biol. 2025, 188, 221–228. [Google Scholar] [CrossRef]
  93. Bitani, N.; Cordier, C.P.; Smith, D.A.E.; Smith, Y.C.E.; Downs, C.T. Microhabitat Requirements and Occupancy of Understorey Bird Forest Specialists in Southern Mistbelt Forests of KwaZulu-Natal, South Africa. For. Ecol. Manag. 2023, 549, 121484. [Google Scholar] [CrossRef]
  94. Figarski, T.; Kajtoch, Ł. Alterations of Riverine Ecosystems Adversely Affect Bird Assemblages. Hydrobiologia 2015, 744, 287–296. [Google Scholar] [CrossRef]
  95. Royan, A.; Hannah, D.M.; Reynolds, S.J.; Noble, D.G.; Sadler, J.P. Avian Community Responses to Variability in River Hydrology. PLoS ONE 2013, 8, e83221. [Google Scholar] [CrossRef]
  96. Hoover, J.P. Effects of Hydrologic Restoration on Birds Breeding in Forested Wetlands. Wetlands 2009, 29, 563–573. [Google Scholar] [CrossRef]
  97. Šálek, M.; Svobodová, J.; Zasadil, P. Loss of Diversity in Bird Communities after Regulation of Riverine Meanders: How Strong Is the Compensatory Effect of Mature Growth on Fishpond Dams? Acta Ornithol. 2007, 42, 89–97. [Google Scholar] [CrossRef]
  98. Capon, S.J.; Chambers, L.E.; Mac Nally, R.; Naiman, R.J.; Davies, P.; Marshall, N.; Pittock, J.; Reid, M.; Capon, T.; Douglas, M. Riparian Ecosystems in the 21st Century: Hotspots for Climate Change Adaptation? Ecosystems 2013, 16, 359–381. [Google Scholar] [CrossRef]
  99. Dwire, K.A.; Mellmann-Brown, S.; Gurrieri, J.T. Potential Effects of Climate Change on Riparian Areas, Wetlands, and Groundwater-Dependent Ecosystems in the Blue Mountains, Oregon, USA. Clim. Serv. 2018, 10, 44–52. [Google Scholar] [CrossRef]
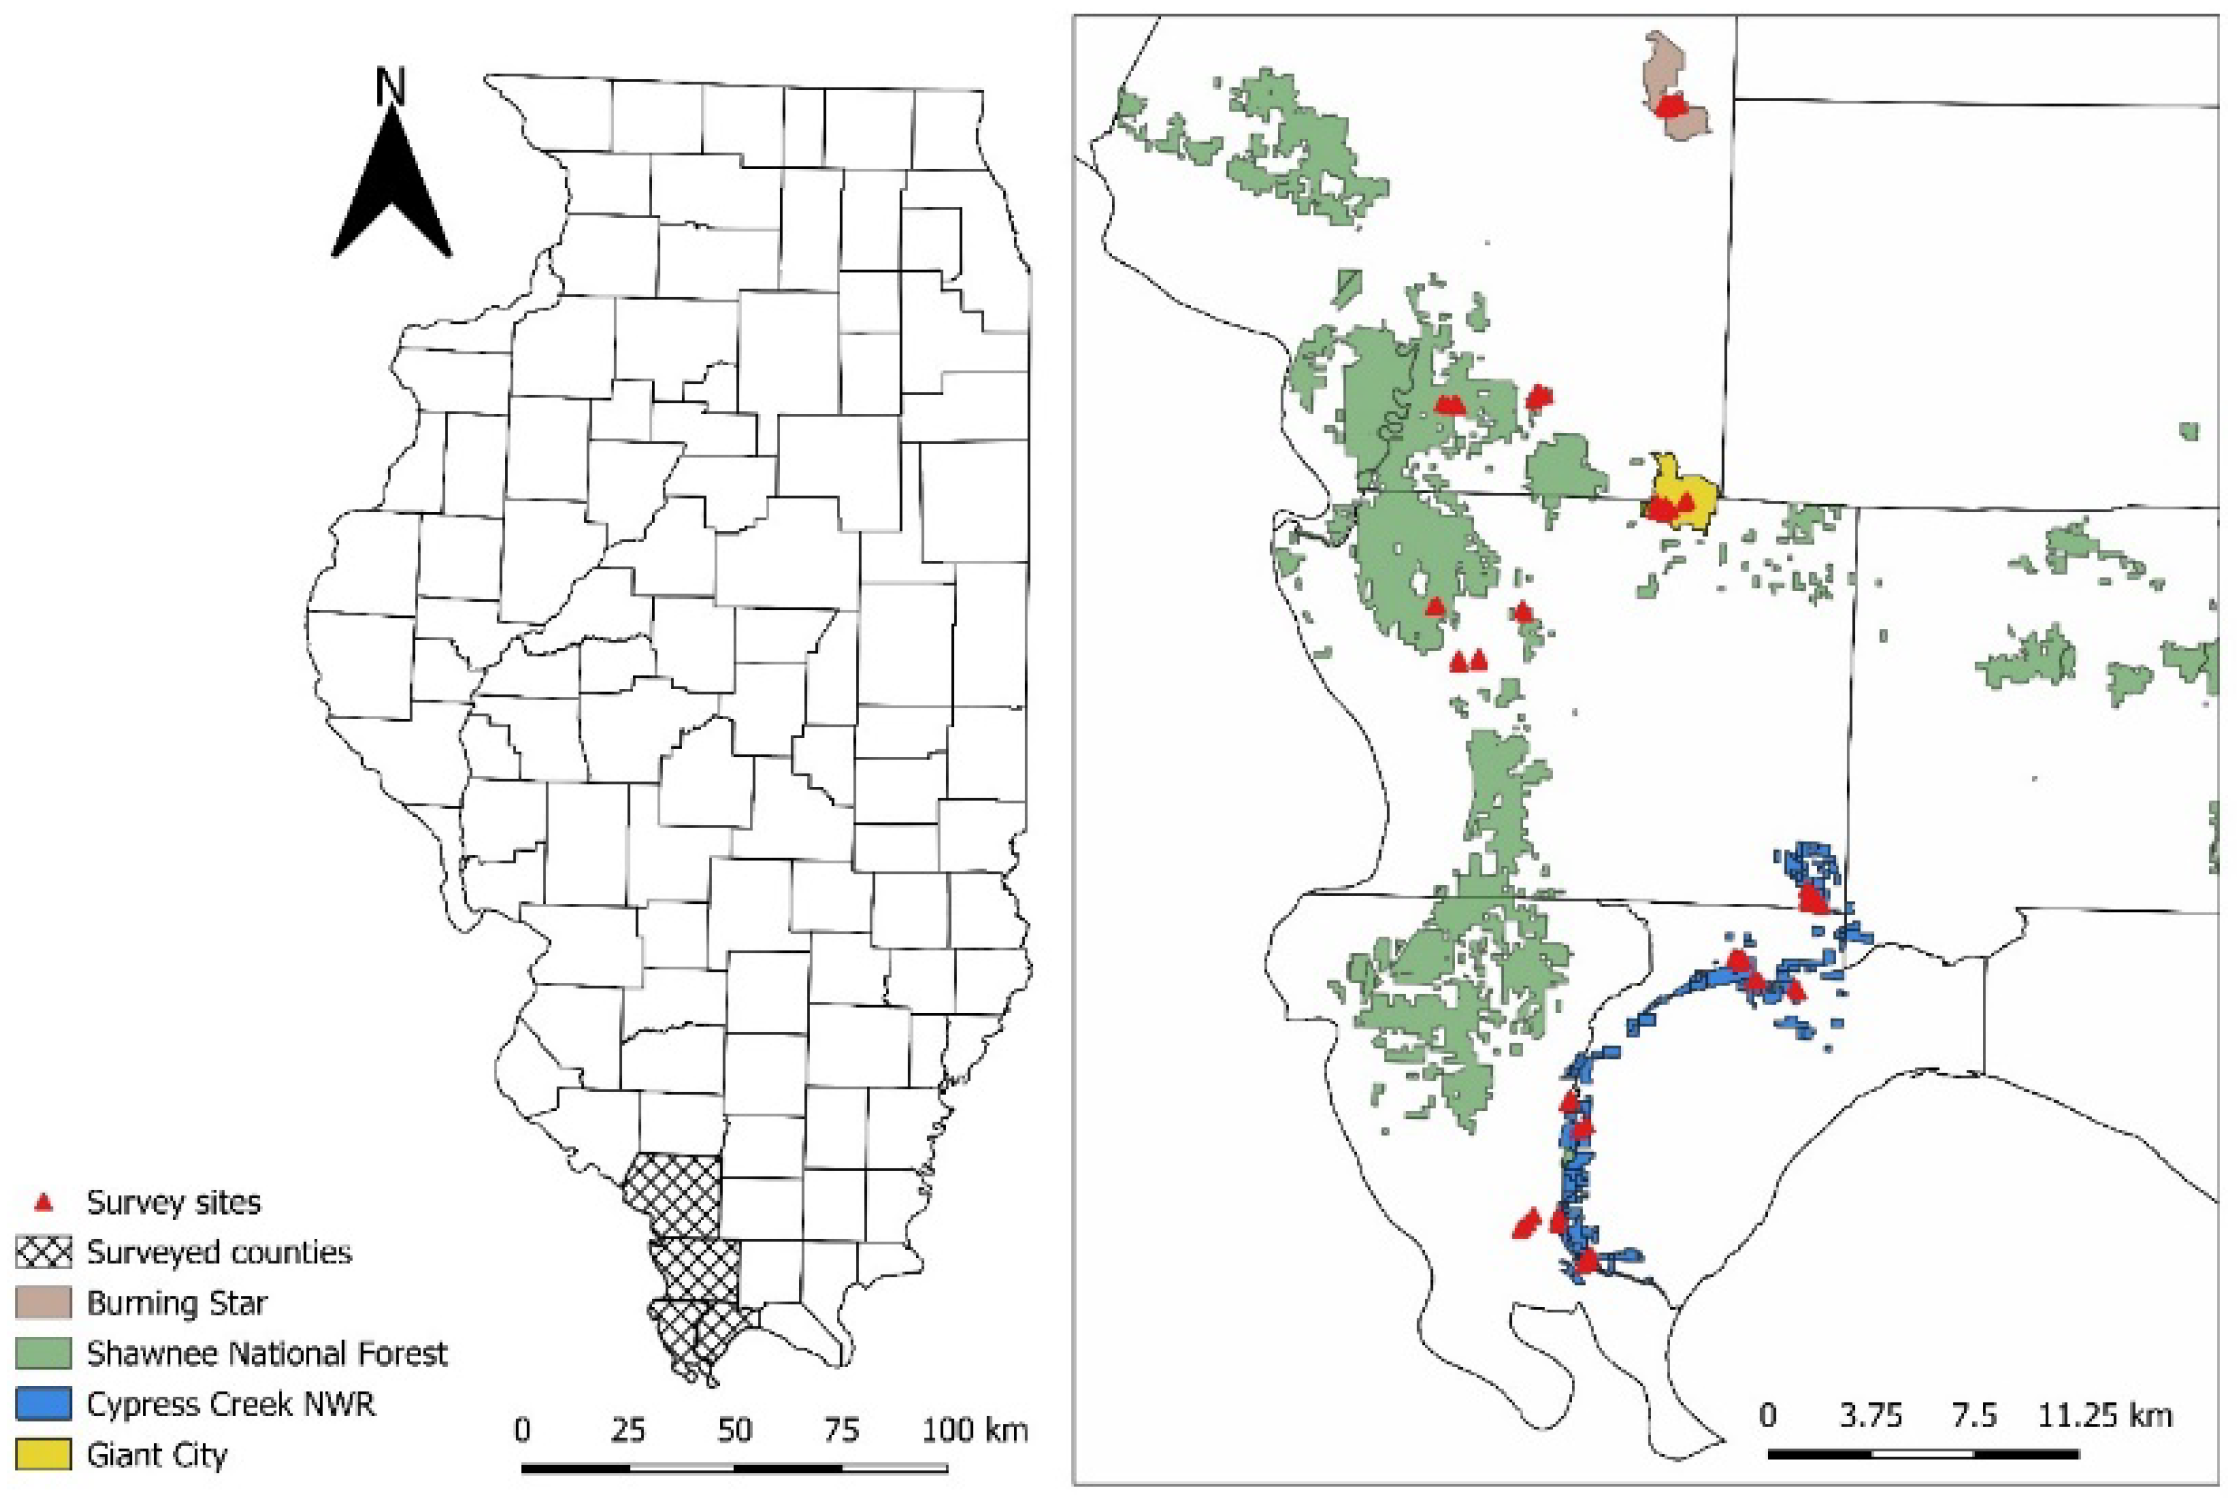
Figure 1. A map of 64 canebrake and non-canebrake locations across Jackson, Union, Alexander, and Pulaski counties in southern Illinois, USA that were surveyed during May–July 2022–2024.
Forests 17 00309 g001
Figure 2. Estimated posterior means for community effects of survey covariates on detection of all bird species (n = 75) across 100 site-years during May–July 2022–2024 in southern Illinois, USA. Coefficient of each covariate is represented by a circle, and error bars represent 95% Bayesian credible intervals.
Forests 17 00309 g002
Figure 3. Comparison between group and individual-species responses of occupancy probability to the presence of canebrake (A) and the quadratic term of canebrake density (B). Dotted lines show posterior mean of group-specific response for each nesting guild, including overstory (green), understory (blue), and ground (pink). Dots and solid lines show posterior mean and 95% Bayesian credible intervals (CRI) for each individual species (n = 78), color-coded by nesting guild. A species with CRIs that do not overlap zero is indicated by an asterisk in front of its name.
Forests 17 00309 g003
Figure 4. Estimated posterior means for guild-averaged effects of vegetation covariates on occupancy of birds of different nesting guilds, including overstory (green), understory (blue), and ground (pink) detected across 100 site-years during May–July 2022–2024 in southern Illinois, USA. Coefficient of each covariate is represented by a circle, and error bars represent 95% Bayesian credible intervals.
Forests 17 00309 g004
Table 1. Vegetation characteristics with the range, mean, and standard deviation for canebrake and non-canebrake sites across 100 site-year study sites in southern Illinois, USA, in May–July 2022–2024.
Vegetation CharacteristicCanebrakeNon-Canebrake
RangeMean (SD)RangeMean (SD)
Tree density (stems/ha)0–900428.0 (228.6)0–3000632.0 (480.8)
Sapling density (stems/ha)0–1300410.0 (335.2)0–2600828.0 (668.6)
Tree basal area (m2/plot)0–1.470.44 (0.37)0–0.890.34 (0.23)
Mean tree height (m)0–27.313.0 (5.9)0–23.813.5 (4.6)
Mean tree DBH (cm)0–53.117.5 (13.9)0–33.013.1 (7.3)
SD tree height (m)0–15.64.9 (3.6)0–19.84.8 (3.9)
SD tree DBH (cm)0–71.616.1 (13.2)0–174.614.3 (24.3)
Mean canebrake height (cm)43.0–351.0135.6 (62.9)NANA
Canebrake density (stem/m2)1.6–17.87.0 (3.5)NANA
Disclaimer/Publisher’s Note: The statements, opinions and data contained in all publications are solely those of the individual author(s) and contributor(s) and not of MDPI and/or the editor(s). MDPI and/or the editor(s) disclaim responsibility for any injury to people or property resulting from any ideas, methods, instructions or products referred to in the content.