Article

A Study on the Preparation Process Optimization and Performance Control of Poplar Wood-Based Panels Based on Response Surface Methodology

1
Institute of Precision Engineering and Intelligent Control, School of Mechanical Engineering, Guizhou University, Guiyang 550025, China
2
Guizhou Shixiang Technology Co., Ltd., Guiyang 550025, China
*
Author to whom correspondence should be addressed.
Forests 2026, 17(3), 304; https://doi.org/10.3390/f17030304
Submission received: 24 January 2026 / Revised: 19 February 2026 / Accepted: 21 February 2026 / Published: 27 February 2026
(This article belongs to the Special Issue Integrated Forest Products Biorefinery Perspectives)

Abstract

Addressing the challenges of multi-parameter interactions and unclear micro-mechanisms in poplar biomass panel manufacturing, this study employed a multi-scale approach integrating statistical optimization, microstructural characterization, and mechanism validation. A central composite design was used to investigate the effects of pressing time, pressure, and baking temperature (conditioning step) on modulus of rupture (MOR), modulus of elasticity (MOE), water absorption (WA), and thickness swelling (TS), establishing predictive models for multi-objective performance. Quantitative SEM analysis correlated macroscopic properties with microstructural parameters (porosity, pore size distribution, fiber–fiber contact ratio), elucidating how process conditions govern performance via interface quality and material densification. The optimized parameters yielded panels with MOR of 30.04 MPa, MOE of 10,716 MPa, WA of 4.98%, and TS of 1.75%. Modifier incorporation enhanced MOR and MOE by 23.10% and 26.38%, respectively, while reducing WA and TS by 50.59% and 29.89%. SEM confirmed an improvement in fiber–matrix interfacial bonding under optimized conditions. Environmental emission and combustion tests validated compliance with green development principles. This work establishes a cross-scale framework linking processing, microstructure, and performance, offering theoretical foundations for green manufacturing of high-performance biomass panels.

1. Introduction

With the improvement in China’s economic development and living standards, the demand for wood-based panels has been steadily increasing. Meanwhile, as the global energy crisis and environmental pollution problems become increasingly severe, the development and utilization of abundant, renewable, and environmentally friendly biomass resources has emerged as a crucial pathway for achieving the “dual carbon” goals and promoting sustainable development [1]. Traditional wood-based panels commonly suffer from issues including inadequate mechanical properties, high water absorption, and poor dimensional stability, which significantly limit their large-scale application [2,3]. Moreover, they predominantly use formaldehyde-based adhesives, such as urea–formaldehyde and phenol–formaldehyde resins, raising concerns regarding formaldehyde pollution [4,5]. In contrast, biomass panels represent a new type of environmentally friendly panel primarily manufactured from biomass resources and processed through physical, chemical, or biochemical methods. These panels are currently employed in various applications, including indoor/outdoor decoration, custom furniture, transportation facilities (e.g., boardwalk planks), and packaging materials. Domestic companies, for instance, Shixiang Technology, are actively collaborating with research institutions to promote their industrialization and expand market applications. Its core feature lies in utilizing the natural fiber structure of biomass materials, combined with technology or composite processes, to form high-strength, highly durable, and environmentally friendly building or decorative materials.
However, the current manufacturing process for the waste poplar biomass panels still presents numerous shortcomings. Their physical properties—such as flexural strength, modulus of elasticity, and water resistance—are influenced by the coupled effects of multiple factors, including hot-pressing time, pressing pressure, curing temperature, and modifier content. This makes it challenging to achieve precise control of process parameters through conventional single-factor testing. The core of the adhesive-free process imposes more stringent and refined requirements on the control of temperature, pressure, and moisture during the hot-pressing stage [6]. Therefore, optimizing the preparation process and enhancing the physical properties of biomass panels represent a key breakthrough for promoting their industrialization [7]. During the manufacturing process, factors such as temperature, pressure, and modifiers significantly impact the quality of the final product [8,9]. Xu et al. [10] achieved superior performance in the physical properties of binderless red hemp core fiber panels by optimizing the refining conditions. Similarly, G E. et al. [11] utilized radiata pine fiber residue to produce panels and analyzed their physical and mechanical properties, thereby enhancing thermal energy storage capacity. Hung et al. [12] employed a wet-forming process combined with a gradient drying technique to study binderless fiber panels made from sugarcane bagasse. By controlling the drying temperature to optimize self-bonding process parameters, they successfully prepared low-density, environmentally friendly building insulation materials exhibiting a favorable thermal resistance value. Further advancing this field, Guirguis et al. [13] investigated fiber panels made from sugarcane bagasse by comparing different fiber sizes, and thereby identified the optimal combination of process parameters. This work successfully developed a product with mechanical strength comparable to that of commercial HDF, providing a feasible approach for the high-value utilization of agricultural waste. Leiter et al. [14] conducted a study on binderless fiber panels made from rice straw employing NaOH alkaline treatment and a wet hot-pressing process. They achieved the scale-up of process parameters from laboratory- to industrial-scale production, along with a systematic environmental assessment. This approach significantly reduced environmental impacts such as global warming potential in the fiber panel production process and clearly identified the shift in key environmental hotspots associated with scaled-up production. Bekhta et al. [15] conducted a study on particle panels made by mixing differently treated MDF production waste with Norway spruce wood particles. They achieved the process objective of optimizing panel formulation by adding 10% recycled fibers, significantly enhancing the bending strength and internal bond strength of the panels. Abobakr et al. [16] conducted a study on ultra-lightweight bio-based fiber panels made from Mexican feather grass and epoxy resin. By optimizing process parameters through density adjustment and the incorporation of a glass fiber fabric interlayer structure, they successfully developed a product with excellent thermal insulation, sound absorption, low water absorption, and good mechanical strength. Yan et al. [17] conducted a study on ultra-thin fiber panels made from poplar wood using simulation analysis. They achieved the optimization of process parameters such as fiber length ratio, hot-pressing temperature, and time, establishing a molding process that enhances the tensile strength of fiber panels while reducing the surface roughness and water absorption expansion rate. Morasilp et al. [18] conducted a study on fiber panels made from pineapple leaf waste. Through the optimization of key process parameters such as alkali concentration, hot-pressing parameters, panel thickness, and binder type, they successfully developed panels with good sound insulation and low volatility. This research provides a feasible process pathway for the resource utilization of agricultural waste in producing high-performance and environmentally friendly fiber panels.
Response surface methodology (RSM) is a class of highly efficient multi-factor optimization techniques. It enables the systematic analysis of interactions between various influencing factors and their regulatory effects on response indicators through the construction of mathematical models [19,20]. Compared with traditional single-factor experiments, RSM can more precisely identify the optimal combination of process parameters. This advantage has been successfully validated in optimizing the preparation processes of various panels, such as bamboo particle panels and straw fiber panels. For instance, Dickson et al. [21] prepared and optimized bio-based panels using blended palm fruit fibers and rice husk fibers through RSM and Artificial Neural Networks (ANNs), determining the optimal manufacturing parameters and enhancing panel performance. Kumar et al. [22] conducted a study on medium-density fiber panel (MDF) fabricated using RSM and Box–Behnken design, achieving the optimization of key process parameters such as hot-pressing time. The results demonstrated a significant improvement in the internal bond strength and bending strength of MDF, along with the establishment of a reliable prediction model. This work provides both a theoretical foundation and process guidance for the industrial application of nanofillers in high-performance fiber panels. Yu et al. [23] utilized the response surface Box–Behnken experimental design to successfully optimize the production process parameters of ultra-thin bamboo particle panel, enabling the product performance to meet relevant standard requirements. Qingqing et al. [24] successfully determined the optimal process conditions for straw fiber panel through response surface experiments. Mingming et al. [25] optimized the process for ultra-thin high-density fiber-panel-overlaid plywood based on RSM, effectively enhancing the mechanical properties of the panels. Li Hui et al. [26] employed both single-factor experiments and RSM to investigate the effects of multiple factors during hot-pressing on the key properties of bamboo-filament-overlaid block panel. However, systematic studies on applying RSM to optimize the preparation process of waste poplar biomass panels for enhancing their physical properties are currently lacking.
To address this gap, this study aims to improve the physical properties of biomass panels. By integrating RSM with scanning electron microscopy (SEM) for microstructural characterization, it systematically investigates the effects of hot-pressing time, pressing pressure, baking temperature, and modifier content on the panels’ modulus of rupture (MOR), modulus of elasticity (MOE), water absorption (WA), and thickness swelling (TS). The research will construct mathematical models between the process parameters and physical properties to determine the optimal preparation process. The findings are expected to provide a theoretical foundation and technical support for optimizing the process and enhancing the performance of biomass panels, contributing significantly to promoting the efficient resource utilization of discarded biomass fiber materials.

2. Materials and Methods

2.1. Experimental Materials and Equipment

2.1.1. Experimental Materials

Poplar wood powder, supplied by Guizhou Shixiang Technology Co., Ltd. (Guiyang, China), served as the raw material. The material was first crushed into pieces 5–10 cm in length, then ground and sieved. The resulting fibers had a diameter of 0.10–0.50 mm and a length of 0.20–5.00 mm; the moisture content of the fibers was adjusted to approximately 20%. The loose bulk density of the prepared fibers was 0.14 g/cm3, as shown in Figure 1a; 82.7% of the material passed through a 40-mesh sieve; and the particle size distribution is also detailed in Figure 1b. The fibers are rich in cellulose, hemicellulose, and lignin, with specific compositions provided in Table 1. These components are fundamental to the adhesive-free bonding process.
The modifiers included light-burned magnesia powder (Mg content: 85%–90%, activity: 64.6, CaO content < 2%), industrial-grade magnesium sulfate, and a proprietary modifier mixture. Specifically, an in-house formulated composite flame-retardant and reinforcing agent was utilized for the functional modification of poplar wood fibers. The modifier consisted of four functional systems: a flame-retardant system comprising two soluble sulfates and two soluble phosphates (mixed at a 1:1 mass ratio), a reinforcing system (polyvinyl alcohol), a process-modifying system (cellulose ether), and a hydrophobic system (silicone oil). The overall mass ratio of sulfates/phosphates/polyvinyl alcohol/cellulose ether/silicone oil was 1:1:3:3:0.02. Specifically, the sulfates used were industrial-grade ammonium sulfate and aluminum sulfate (1:1, w/w), and the phosphates were ammonium dihydrogen phosphate and ammonium polyphosphate (2:1, w/w). The polyvinyl alcohol was PVA-1788, the cellulose ether was hydroxypropyl methylcellulose (HPMC, viscosity 4000 mPa·s), and the silicone oil was a nonionic hydroxyl-terminated silicone oil emulsion (50% solids content). All raw materials were used as received without further purification. During preparation, the solid components were weighed according to the specified ratios and dry-mixed in a blender for 15 min until homogeneous. The required amount of silicone oil emulsion was then added, and mixing was continued for an additional 5 min to obtain the composite modifier. The modifier was stored as a dry powder and was directly blended with poplar wood fibers at the target addition level prior to use.

2.1.2. Equipment

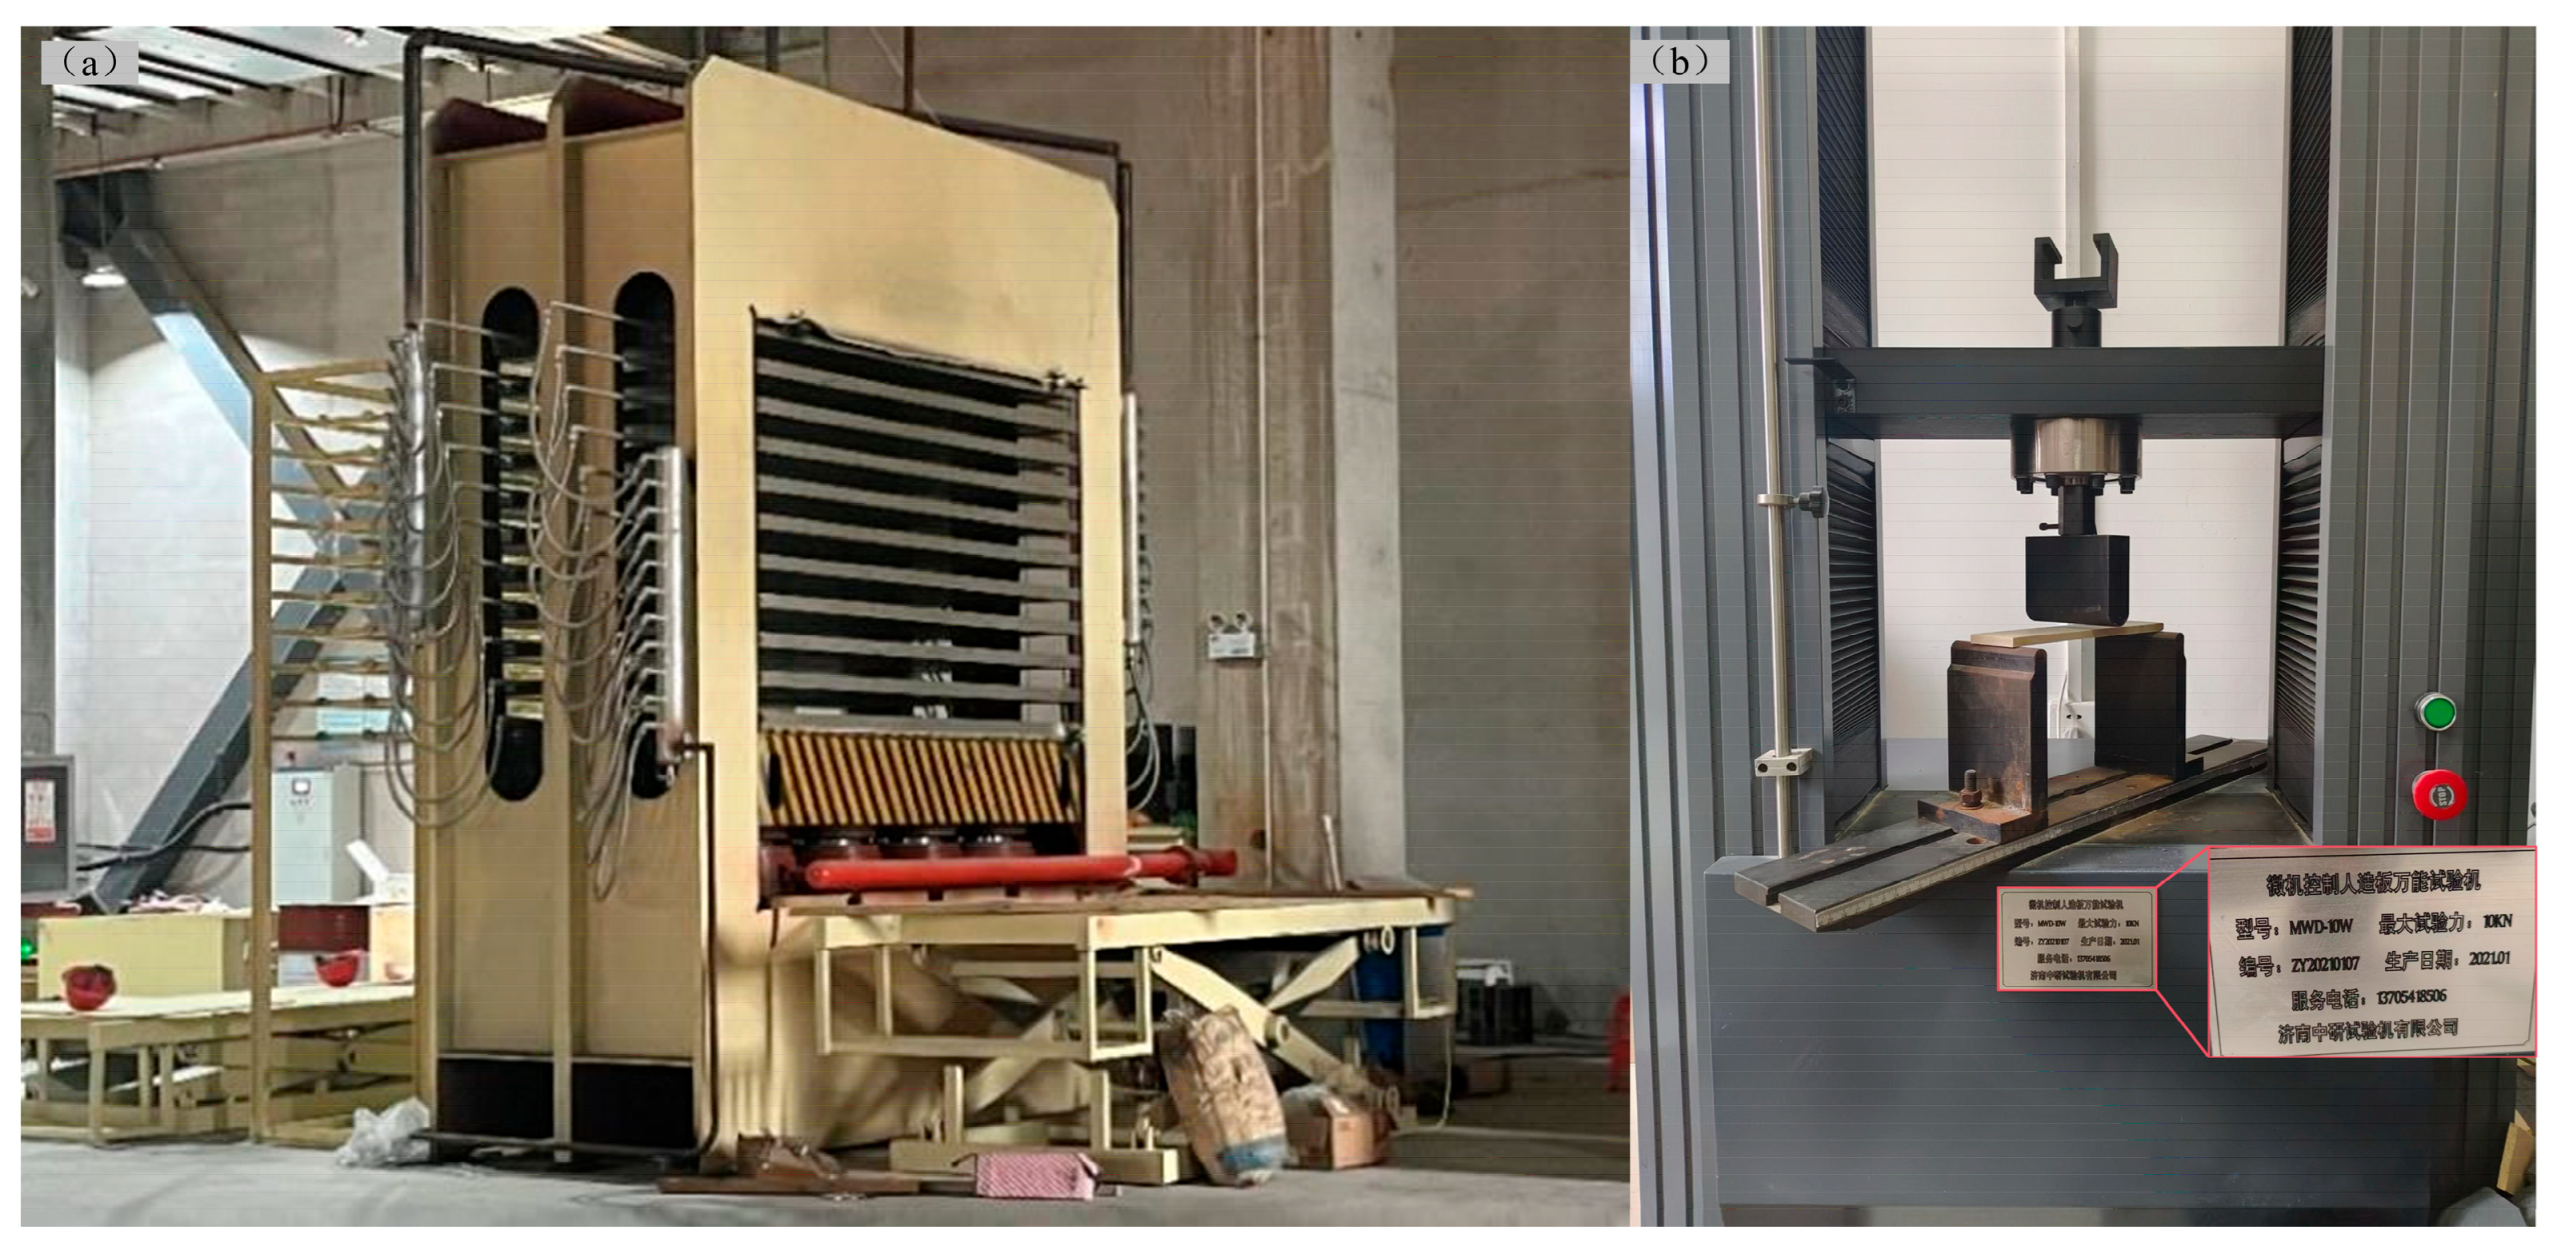
The main preparation equipment for the test was a hot-press hydraulic machine (Linyi Jinzuo Woodworking Machinery Manufacturing Co., Ltd., Lan Shan District, Linyi, Shandong, China), as shown in Figure 2a, capable of producing ten samples under identical pressure simultaneously. The sample testing equipment was a universal testing machine for wood panels (model MWD-10W, Jinan Zhongyan Co., Ltd., Shizhong District, Jinan, Shandong, China), as shown in Figure 2b, which was used for measuring the MORandMOE of the samples.

2.2. Preparation Process

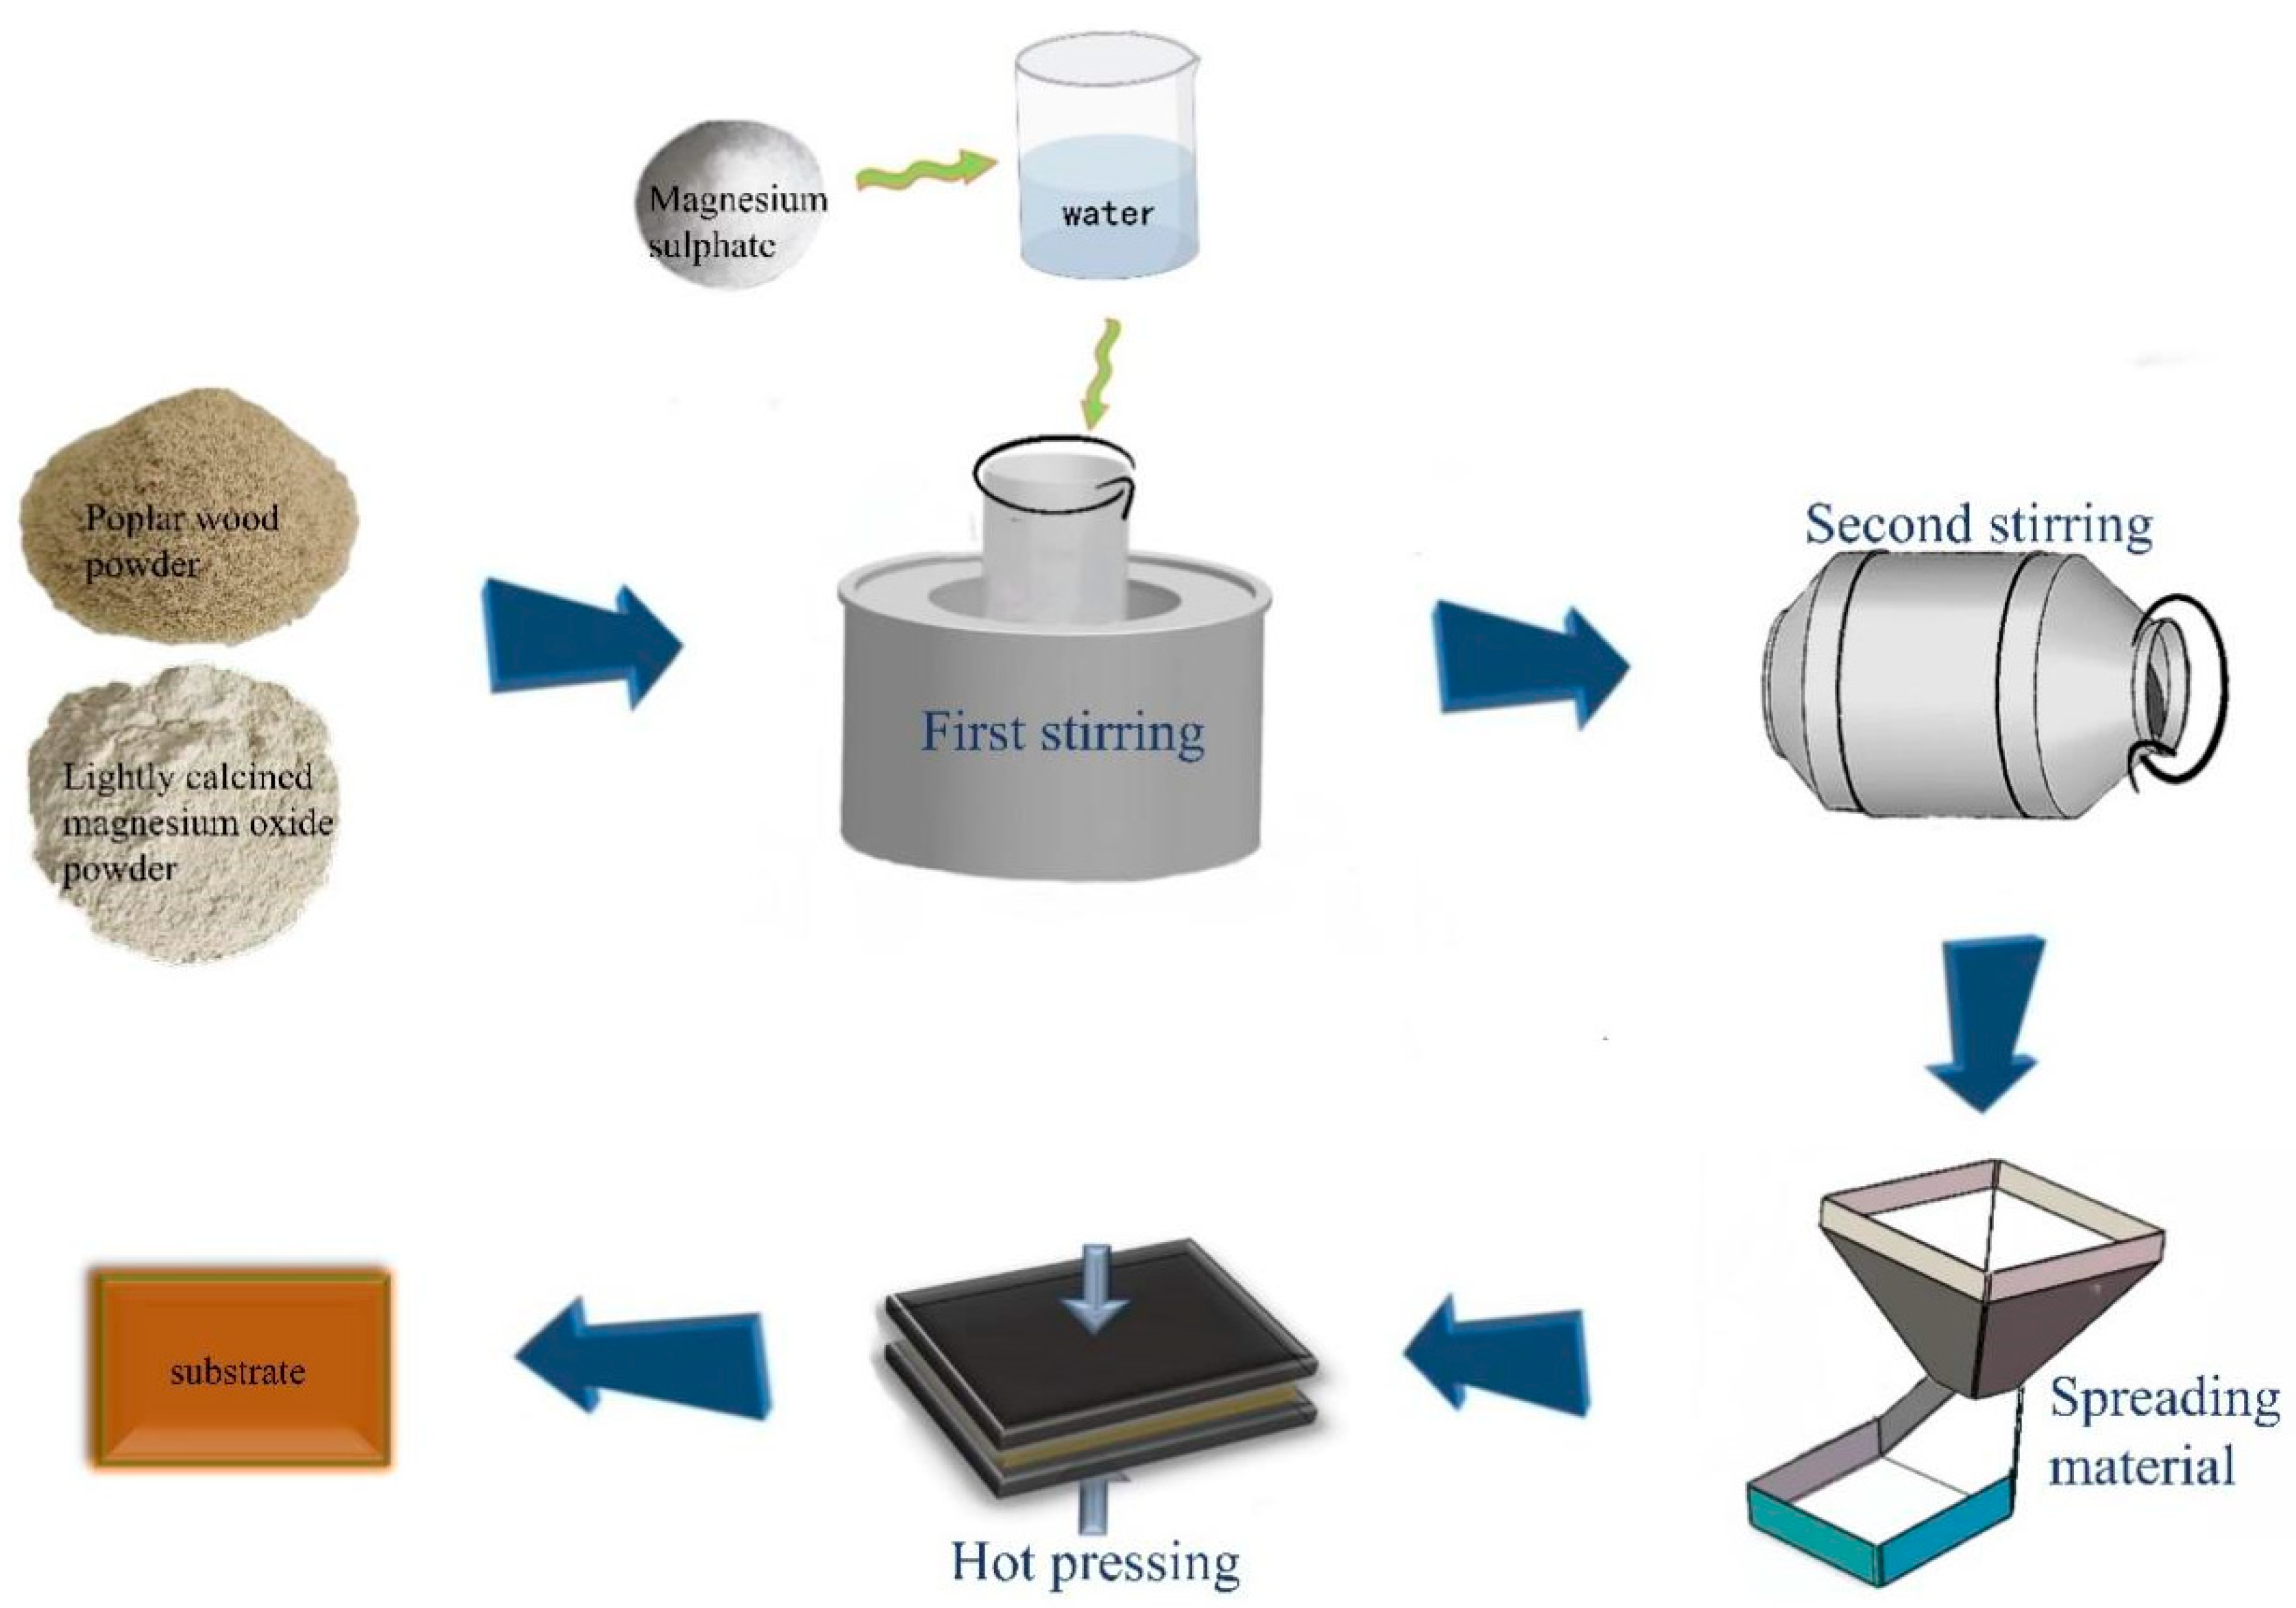
The target density of the panel after final baking was set at 1.4 g/cm3 (±1.5%), which is compliant with the EN 622-5 MDF.H standard (≥0.8 g/cm3) [28], with dimensions of 2440 mm × 1220 mm × 7 mm. The main process flow is illustrated in Figure 3. First, wood fiber/magnesium oxide were fed into a planetary mixer at a ratio ranging from 1:1.1 to 1:1.5, followed by the addition of 10% (by weight) water for mixing. Next, a magnesium sulfate solution with a Baumé degree of 21–30° Bé was added. The ratio of the magnesium sulfate solution to magnesium oxide ranged from 0.3:1 to 0.9:1. Mixing continued for 3–8 min. The mixture was then discharged into a ring mixer for secondary blending. Subsequently, it was transferred to a forming machine for a two-stage mat formation. The formed mat was conveyed to a stacking platform, stacked, and then loaded into a hot press. The hot-pressing was conducted at a fixed temperature of 100 °C under a specific pressure set at 8, 11, and 14 MPa, and a pressing time set at 12, 15, and 18 min. Afterwards, the molded panel, still within the press, was transported via a rail system to a constant-temperature chamber for curing. The process followed a continuous in-and-out flow pattern. After four hours, demolding began, and the aluminum caul plates were returned for cooling. Finally, the demolded panel underwent rough edge trimming and was then cured for seven days. On the eighth day, the product undergoes baking for shaping in the equilibration chamber at a temperature of 95, 105, and 115 °C, followed by heavy pressing for 48 h. After cooling and conditioning for one day, the final sample was obtained.

2.3. Test Methods

2.3.1. Balancing Treatment

Before performance testing, all prepared samples were subjected to a controlled conditioning process. They were placed in an environment with a relative humidity of (65 ± 5)% and a temperature of (20 ± 2) °C. Conditioning was performed until the mass change in the samples remained within 0.1% of their initial mass over a consecutive 24 h period, at which point the samples were considered to have reached equilibrium.

2.3.2. Modulus of Rupture and Modulus of Elasticity Testing

In accordance with the National Standard (GB/T 17657-2022) [29], a three-point static bending test was performed using a universal wood testing machine [30,31]. The samples were cut into test pieces measuring 210 mm × 50 mm × 7 mm. The span between the supports of the testing machine was set to 160 mm. A test piece was placed at the midpoint of the supports, and the crosshead speed was adjusted to 10 mm/min. The load was gradually increased until the test piece fractured. The maximum fracture load was recorded, and the MOR of the sample was calculated using Equation (1).
M O R = 3 P L 2 b t 2
where P is the maximum load (N); L is the span between the two supports (mm); b is the width of the specimen (mm); and t is the thickness of the specimen (mm).
Subsequently, the MOE can be calculated using Equation (2) based on the determined MOR value.
M O E = L 3 W 4 b t 2 S
where L is the span between the two supports (mm); ΔW represents the increment of load in the linear segment of the load–deflection curve (N); ΔS is the increment of mid-span deflection (mm); b is the width of the specimen (mm); and t is the thickness of the specimen (mm).

2.3.3. Water Absorption and Thickness Swelling Testing

According to the National Standard (GB/T 17657-2022), the samples were immersed in water at room temperature for 24 h. The thickness and mass of the samples were measured both before immersion and after the 24 h immersion period [32]. WA and TS are defined as the percentage increase in mass and thickness of the samples after immersion, respectively [33]. WA is calculated using Equation (3), and TS is calculated using Equation (4).
W A = t 2 t 1 t 1 × 100 %
where t1 is the thickness of the specimen before water immersion (mm), andt2 is the thickness of the specimen after water immersion (mm).
T S = m 2 m 1 m 1 × 100 %
where m1 is the mass of the specimen before water immersion (g), and m2 is the mass of the specimen after water immersion (g).

2.3.4. Response Surface Experimental Design

A three-factor, three-response surface experiment was designed using Design-Expert 13. The three factors are denoted as follows: X1 represents hot-pressing time (12, 15, and 18 min); X2 represents pressing pressure (8, 11, and 14 MPa); and X3 represents baking–curing temperature, which was set at 95, 105, and 115 °C. The specific factor levels are presented in Table 2. According to the Box–Behnken design (BBD) principle, a total of 17 experimental runs were generated, including 12 factorial points and 5 replicates at the center point (zero level) to estimate the pure error and evaluate the adequacy of the fitted model. All runs were performed in a randomized order to minimize the effects of uncontrolled variables. For each run, five replicate panels were prepared for property testing. The MOR, MOE, WA, and TS of the finished panels were determined. The average value for each property from the five replicates within a run was used for subsequent performance comparison and analysis. Finally, the optimal process parameters were determined through optimization.
Due to the differing optimization directions of the four response metrics (MOR and MOE should be maximized, while TS and WA should be minimized), the optimal process conditions for any single metric cannot simultaneously satisfy all performance requirements. Therefore, the expected value function method is employed for multi-objective simultaneous optimization [34]. The predicted values from the regression models of each response metric are converted into individual expected values ranging from 0 to 1. The comprehensive expected value is then calculated using the geometric mean. The global optimal process parameters are determined by maximizing this comprehensive expected value.

2.3.5. Modification Technique for the Modifier in Biomass Panels

Leveraging the natural fiber structure of biomass materials, technology, or composite processes enables the forming of biomass fibers without the need for adhesives. This results in a high-strength, highly durable, and environmentally friendly material, which can be further composited with polymers (e.g., resins) or minerals (e.g., magnesite). Soluble sulfates and phosphates promote the dehydration and carbonization of wood, forming an expanded carbon layer that blocks oxygen. Additionally, upon exposure to high temperatures, these modifiers decompose to produce non-combustible gases, which dilute oxygen. Together, these mechanisms achieve flame retardancy [35,36]; polyvinyl alcohol (PVA) forms a substantial number of hydrogen bonds between the hydroxyl groups on its molecular chains and those on the wood fibers. Upon drying, it creates a tough, continuous film that firmly binds the wood particles/fibers together, thereby improving the formability of the raw materials [37,38,39]; cellulose ether significantly increases the viscosity of the slurry system, ensures uniform panel density, and retards water evaporation [40,41]; and silicone oil forms a hydrophobic film on the fiber surfaces, which reduces the TS of the panels and enhances their dimensional stability [42,43].

2.3.6. Methodology for Microstructure and Crystal Structure Analysis

Biomass panel samples were cut into dimensions of 5 mm × 5 mm, mounted on stubs using conductive carbon tape, and their fracture surfaces were examined for microstructure using a scanning electron microscope (SEM, model VEGA3 SBH, TESCAN, Brno, Czech Republic).
Following chamber evacuation to the working pressure, imaging was performed at an accelerating voltage of 40 kV. To observe the internal composition of the panels, they were crushed into powder. The powder was then analyzed using an X-ray diffraction (XRD) analyzer (Ultima IV, Rigaku, Japan). The XRD instrument, equipped with a copper target, was operated at a voltage of 45 kV and a current of 40 mA. Scans were performed over a 2θ range from 5° to 80° at a scanning rate of 0.3°/s.
Considering the fiber dimensions and pore characteristics, a magnification of 1000× was selected for quantitative pore analysis, for which three specimens were randomly selected under each process condition with five 1000× images captured per specimen, and ImageJ software (version 1.54g, National Institutes of Health, Bethesda, MD, USA) was employed for quantitative analysis of the SEM images [44] by first performing spatial calibration, converting the images to 8-bit grayscale, identifying pore regions using Otsu’s automatic thresholding method, and applying the Analyze Particles function ( s i z e     0.5   µ m 2 ) to determine porosity and pore size distribution, with measurements conducted independently for each image. Image analysis thresholds were validated against visual criteria to ensure complete pore boundary identification and the absence of artifact coverage in fiber regions. Sensitivity analysis showed pore volume fluctuations within ±10 gray values of the threshold remained below ±1.5%, indicating robust threshold settings for pore volume measurements in this study.

2.3.7. Quantitative Analysis of Fiber–Fiber Contact Ratio

For each image, ten equidistant measurement lines were drawn to calculate the fiber–fiber close contact boundary ratio via the line-intercept method [45]. The fiber–fiber contact ratio was quantified using the line-intercept method on SEM images (1000×). For each image, ten equidistant horizontal lines were drawn across the fiber cross-section using ImageJ software (version 1.54g, NIH, Bethesda, MD, USA). Along each line, two types of boundary lengths were measured:
(1) Contact boundary length ( L C )—the total length of segments where two adjacent fibers were in direct contact, defined as regions with no visible gap or pore between fiber cell walls.
(2) Total fiber boundary length ( L t )—the total length of all fiber boundaries intersected by the line, including both contact boundaries and fiber–pore boundaries.
The fiber–fiber contact ratio for a single image was calculated as:
Contact   ratio   ( % ) = L C L t × 100
For each process condition, three randomly selected SEM images were analyzed, and the results were expressed as mean ± standard deviation.
Additionally, during the preparation of this manuscript, the author(s) used [DeepSeek, version DeepSeek-V3.2] for the purposes of [language polishing and grammar checking].

3. Results and Discussion

3.1. Results of the Response Surface Experiment

Based on the experimental design outlined in Table 2, a three-factor, three-level RSM scheme was developed using BBD. This scheme used WA, MOR, MOE, and TS as the evaluation indicators. The complete experimental runs and their corresponding results are presented in Table 3.
Taking the MOR results from the practical experiments in Table 3 as an example, a quadratic response surface model was constructed. The analysis of variance (ANOVA) for this MOR model is presented in Table 3. In the ANOVA for MOR, the model term yielded a p-value of <0.0001, indicating that the model is statistically highly significant and can effectively explain the variation within the system. The lack-of-fit term had a p-value > 0.05, suggesting it was not significant, which means that no systematic bias was observed and the model exhibits a good fit. A signal-to-noise ratio of 16.7443, which is greater than 4, indicates that the experimental design had adequate detection sensitivity and the model maintains robust predictive capability amidst process noise. As can be seen from Table 4, the order of influence of the various factors on MOR is X3 > X2 > X1, revealing that the curing temperature was the most critical factor affecting MOR.

3.1.1. Analysis of Variance

Based on the aforementioned ANOVA results for MOR, a multiple regression equation was fitted to establish a model relating the MOR of the biomass panels to the hot-pressing time, pressing pressure, and baking–curing temperature. The regression model and its coefficient of determination (R2) are presented as follows:
Y1 = 30.43 − 0.8638X1 + 1.29X2 + 2.06X3 + 0.0875X1X2 + 0.8250X1X3 − 1.45X2X3 − 3.40X12 − 5.79X22 − 1.66X32, R2 = 0.9780
Similarly, the model p-values for the MOR, MOE, and TS models were all <0.0001, which is less than 0.05, indicating that they are all highly statistically significant. The lack-of-fit p-values were 0.5448, 0.2969, and 0.3546, respectively, all greater than 0.05 and thus not significant. The signal-to-noise ratios were 41.7838, 27.7814, and 36.3316, respectively, all exceeding 4. This confirms that all models meet the requirements for a well-defined optimization design. Based on the analysis of variance, the order of influence of hot-pressing time, pressing pressure, and baking–curing temperature on MOE is X3 > X2 > X1, on WA is X1 > X3 > X2, and on TS is X3 > X2 > X1.
Based on the aforementioned analysis of variance results, multiple regression equations were fitted. The regression models for the (MOE, Y2), (WA, Y3), and (TS, Y4) of the biomass panels as functions of hot-pressing time (X1), pressing pressure (X2), and baking–curing temperature (X3), along with their coefficients of determination (R2), were derived as follows:
Y2 = 10,839.40 + 30.00X1 + 747.25X2 + 945.75X3 − 62.50X1X2 + 613.00X1X3 − 1024.50X2X3 − 3195.20X12 − 1901.70X22 − 9577.20X32, R2 = 0.9972
Y3 = 4.91 − 0.4150X1 − 0.0900X2 − 0.2275X3 + 0.5925X1X2 + 0.7925X1X3 − 0.6075X2X3 + 1.63X12 + 0.1672X22 + 0.6223X32, R2 = 0.9893
Y4 = 1.71 − 0.0612X1 − 0.0825X2 − 0.3513X3 − 0.1875X1X2 − 0.5700X1X3 − 0.0125X2X3 + 0.2640X12 − 0.1385X22 − 0.4610X32, R2 = 0.9919

3.1.2. Response Surface Interaction

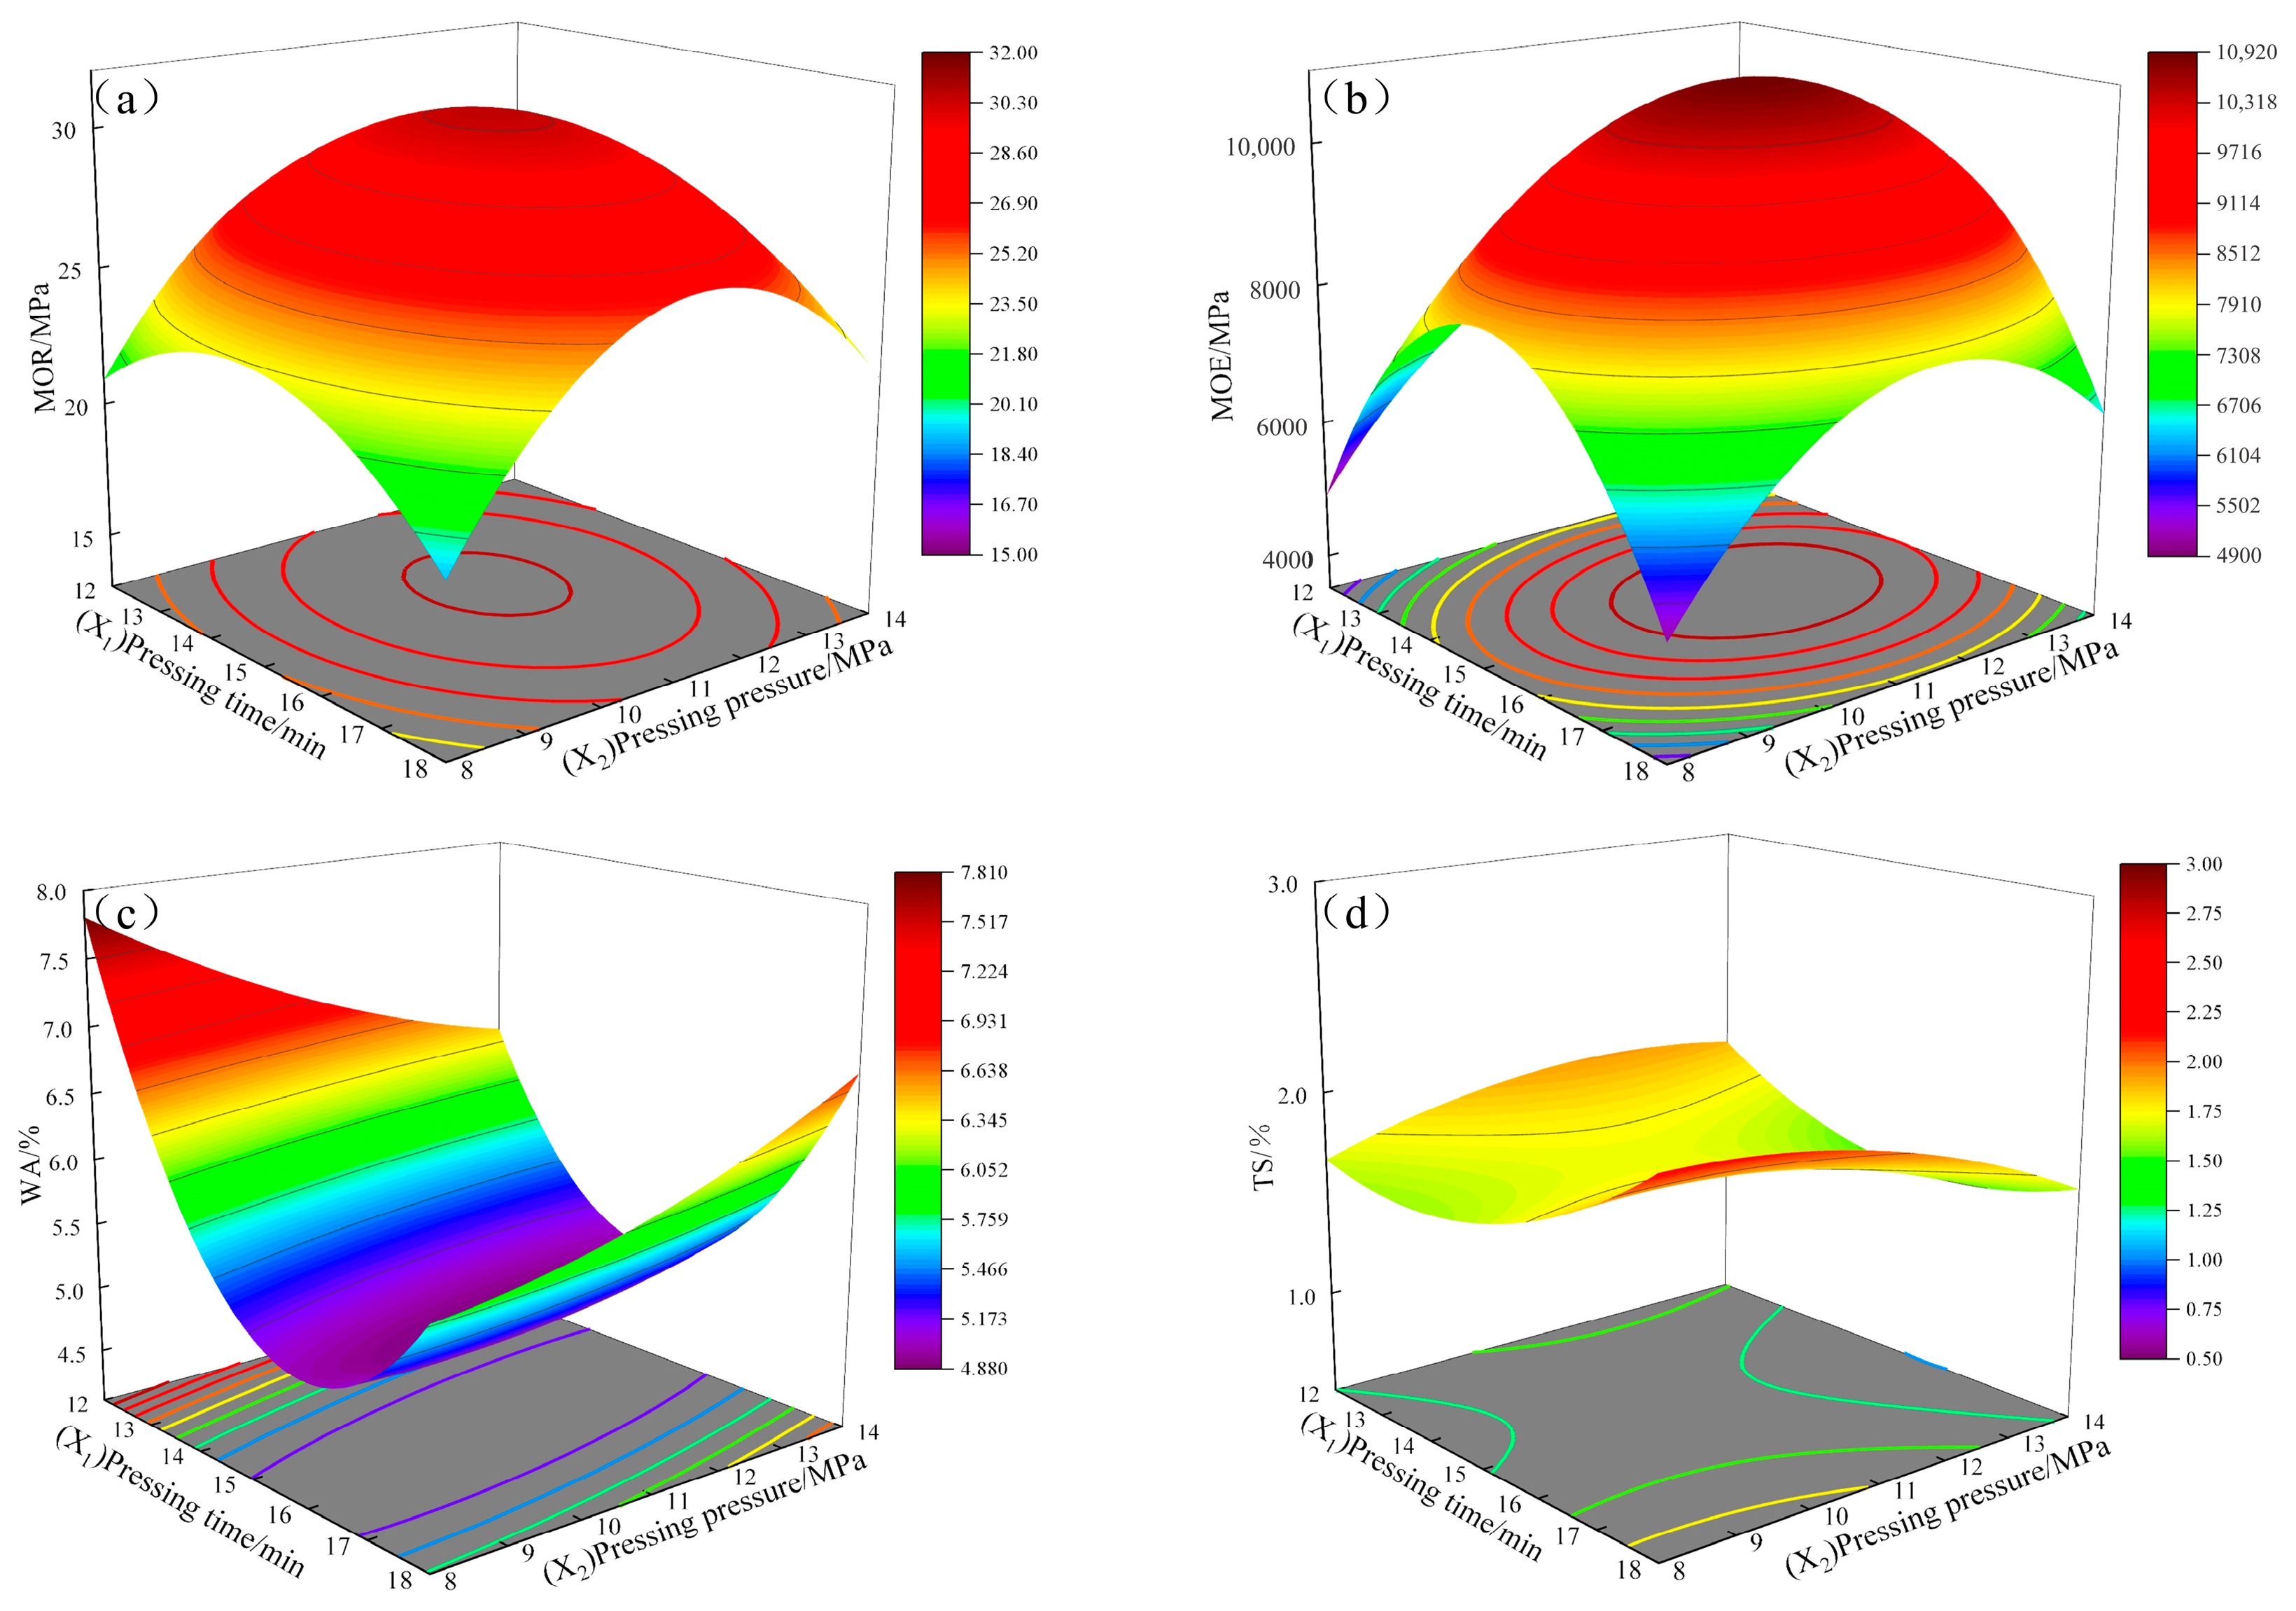
The response surface and contour plots depicting the interaction between pressing time and pressing pressure on MOR are shown in Figure 4a. The plot reveals an arched response surface, indicating a significant interactive effect between hot-pressing time and pressing pressure. The contour lines are denser along the pressure axis than along the time axis, suggesting that MOR is more sensitive to changes in pressure. The maximum MOR is achieved within the ranges of 13–15.6 min for hot-pressing time and 10–12.5 MPa for pressure. The variation pattern of the MOE response surface is similar to that of MOR (Figure 4b). Significant interaction effects also exist between hot-pressing time and pressing pressure for MOE, with the maximum value attained within the ranges of 13.5–16.5 min for hot-pressing time and 9.5–13.5 MPa for pressure. For both hot-pressing time and pressure, a “first increase then decrease” trend is observed—increasing the parameter within a critical range enhances MOE, but exceeding this critical value leads to a decline in MOE. The response of these two mechanical properties to the process parameters is synchronized.
The response surface for water absorption (WA) exhibits a “valley-shaped” characteristic (Figure 4c). At short hot-pressing times, WA is relatively high. As time increases, WA initially decreases but then increases again when the time becomes excessively long (>17 min). Similarly, under low pressure, WA is high. With increasing pressure, WA first decreases but rises again if the pressure is too high (>13 MPa).
The response surface for TS exhibits depressions in both the central and side regions (Figure 4d), showing an irregular and relatively flat distribution. However, the minimum TS is achieved within the specific ranges of 15–17 min for hot-pressing time and 9–11 MPa for pressing pressure.

3.1.3. Multi-Criteria Optimization and Validation

A desirability function approach was employed for simultaneous multi-response optimization. The optimization goals for each response were set as follows: MOR and MOE were maximized, while TS and WA were minimized, with all weights assigned a value of 1. Using Design-Expert software (version 13.0.5.0, Stat-Ease, Inc., Minneapolis, MN, USA), an overall desirability value of D = 0.909 was obtained, corresponding to the optimal process parameters: hot-pressing time of 14 min, hot-pressing pressure of 10 MPa, and hot-pressing temperature of 108 °C. Their key physical properties are presented in Table 5. The results show an MOR of 30.04 MPa, an MOE of 10,716 MPa, a WA of 4.98%, and a TS of 1.75%. All values meet the requirements for the physico-chemical properties of wood-based panels and veneered wood-based panels specified in the National Standard GB/T 17657-2022 [31]. To validate the reliability of the optimization results, three parallel verification experiments were conducted under the optimal conditions. The measured average values for MOR, MOE, TS, and WA were 30.90 MPa, 10,626 MPa, 5.02%, and 1.71%, respectively. The relative errors compared to the model predictions were all less than 5%, indicating that the established model is accurate and reliable, and the optimized process parameters are feasible.

3.2. Modifier Verification Experimental Plan

3.2.1. Experimental Plan

To further enhance the performance of biomass panels and investigate the effect of the modifier, three experimental groups with different modifier contents (1.0%, 1.5%, and 2.0%) and one control group (without an modifier) were established. Panels for all groups were prepared based on the optimal factor combination derived from the response surface methodology and subsequently subjected to performance testing. This comparison aimed to evaluate the influence of different modifier contents on the properties of the biomass panels [17].

3.2.2. Experimental Results

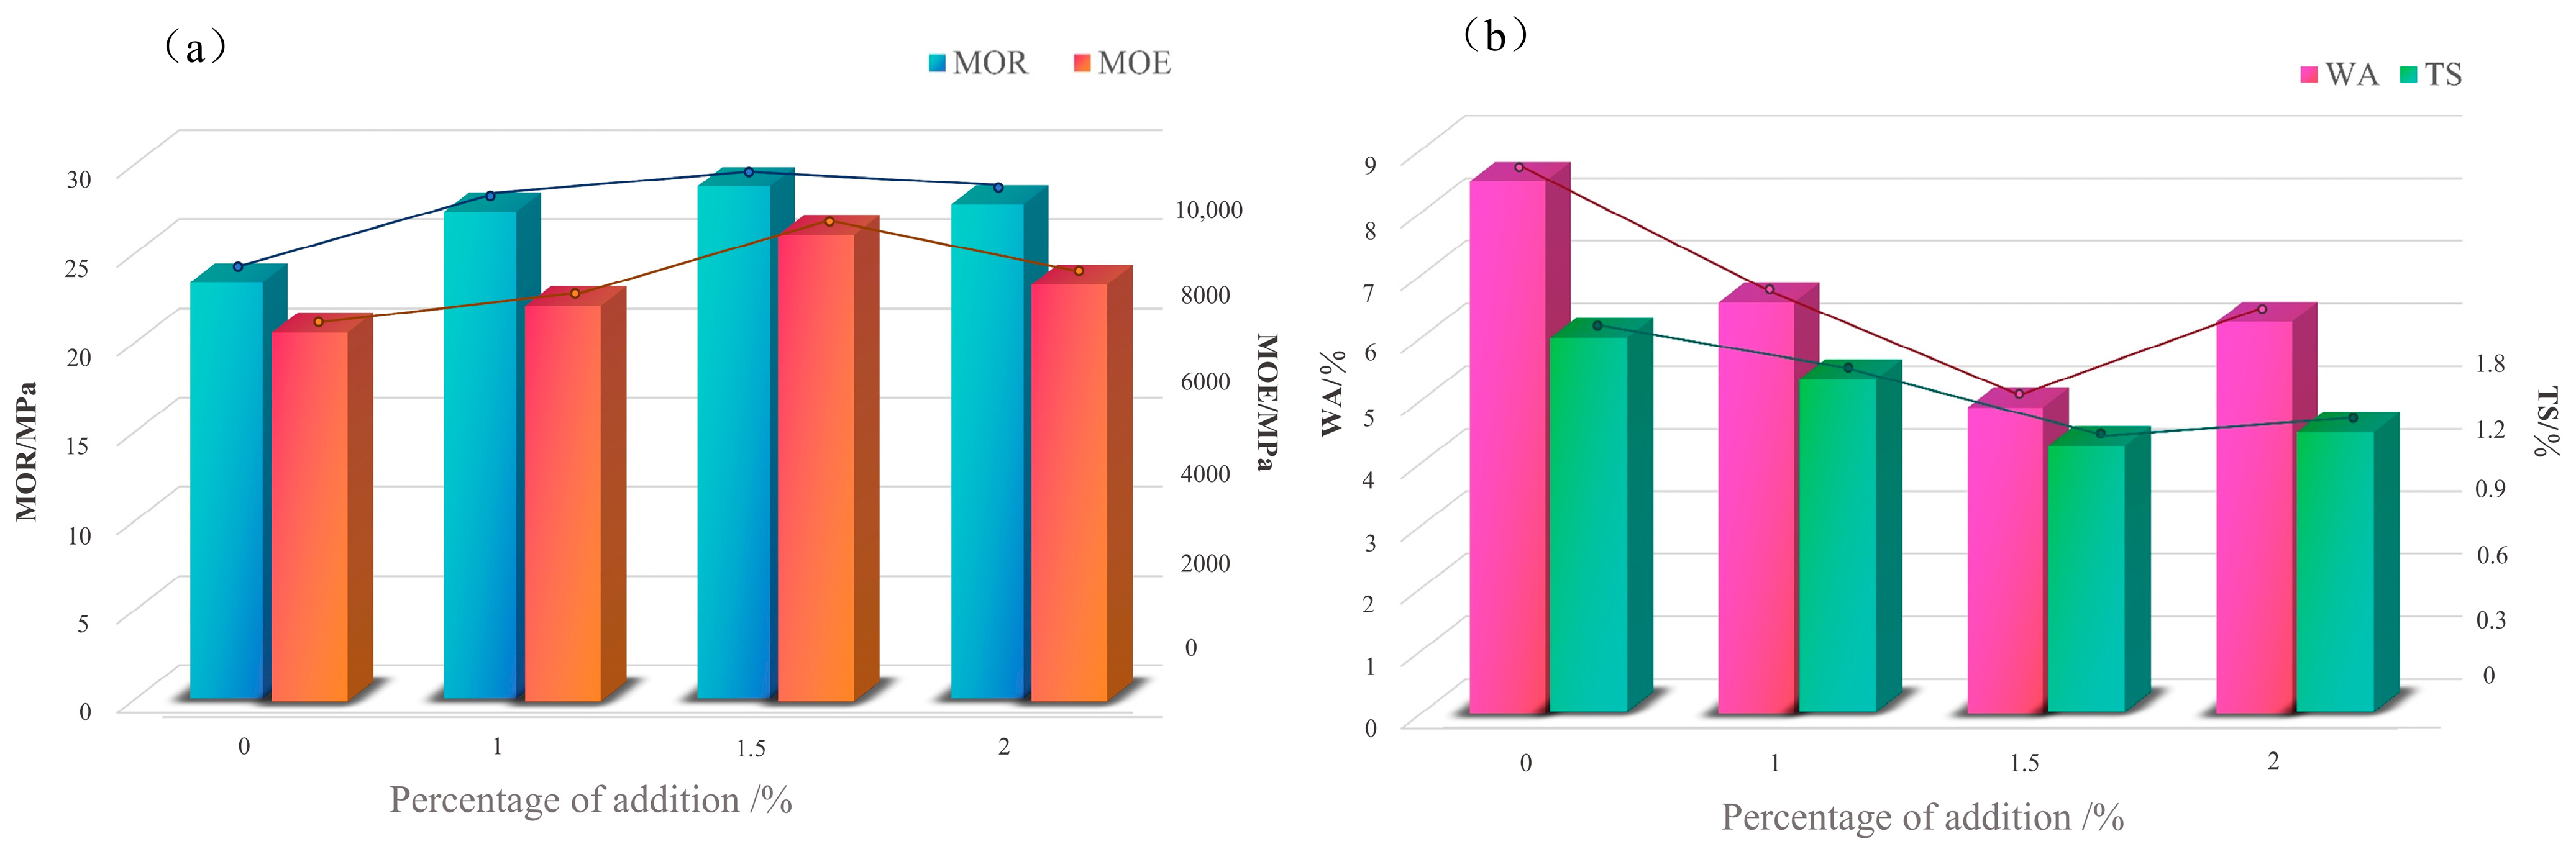
The variation trends in the experimental results for biomass panels with different modifier contents are shown in Figure 5.
As shown in Figure 5a, the trends for MOR and MOE are highly synchronized. Both properties increase gradually as the modifier content rises from 0% to 1.5%, peaking at 1.5% modifier content. When the content is further increased to 2.0%, both MOR and MOE show a slight synchronous decline, with the enhancement effect on MOE being more pronounced. According to Figure 5b, both WA and TS decrease as the modifier content increases to 1.5%. However, they show a slight increase when the content reached 2.0%.
These results indicate that an modifier content of approximately 1.5% is optimal for simultaneously improving multiple physical properties and enhancing the water resistance and dimensional stability of the material. Compared to the control group (0% modifier), the panel with 1.5% modifier content exhibited a 23.10% increase in MOR, a 26.38% increase in MOE, a 50.59% reduction in WA, and a 28.89% reduction in TS, demonstrating significant modification effects. However, excessive addition slightly diminishes these properties, confirming that the modifier content must be controlled within a reasonable range to ensure effective enhancement of physical properties.

3.2.3. Comparison of Optimization Results with European Standards

To validate the practical performance of the poplar wood-based panels produced by this research institute, the physical and mechanical properties of the panels manufactured under the optimal process conditions optimized by the response surface method (hot-pressing time: 14 min, hot-pressing pressure: 10 MPa, baking temperature: 108 °C, modifier content: 1.5%). Table 6 lists the measured values of the optimized poplar adhesive-free panel’s MOR, MOE, 24 h TS, and 24-h WA, along with comparisons against the requirements of the EN 622-5 MDF.H standard [28] (for dry-condition medium-density fiber panel). All performance metrics studied in this paper meet the specified standards.

3.2.4. Comparison of Optimization Results with Recent Literature Findings

To further evaluate the innovation and improvement effectiveness of this study, the performance of the optimized panel is compared with recently published similar biomass panel research, as shown in Table 7.
As shown in the table, compared with the properties of several recently listed biomass panels, the optimized panel developed in this study exhibits the most favorable MOE. This indicates that due to the inherently high aspect ratio of poplar wood fibers, the reinforcing network formed by PVA in the composite modifier within the fiber cross-section, and the dense structure achieved through optimized hot pressing, the optimized panel possesses exceptionally high rigidity and deformation resistance. Simultaneously, it exhibits the lowest WA and TS values, indicating superior water resistance. This performance stems from the hydrophobic modification by silicone oil and the filling of large inter-fiber voids by the modifier. Although its MOR is lower than that of most aldehyde-containing panels and the PF panel, its water resistance significantly outperforms them, making it more suitable for humid environments. This optimized panel achieves an excellent overall balance, meeting diverse application requirements in both dry and humid conditions.

3.3. Analysis of Microstructure and Crystal Structure

3.3.1. SEM Characterization of Modified and Unmodified Sheets

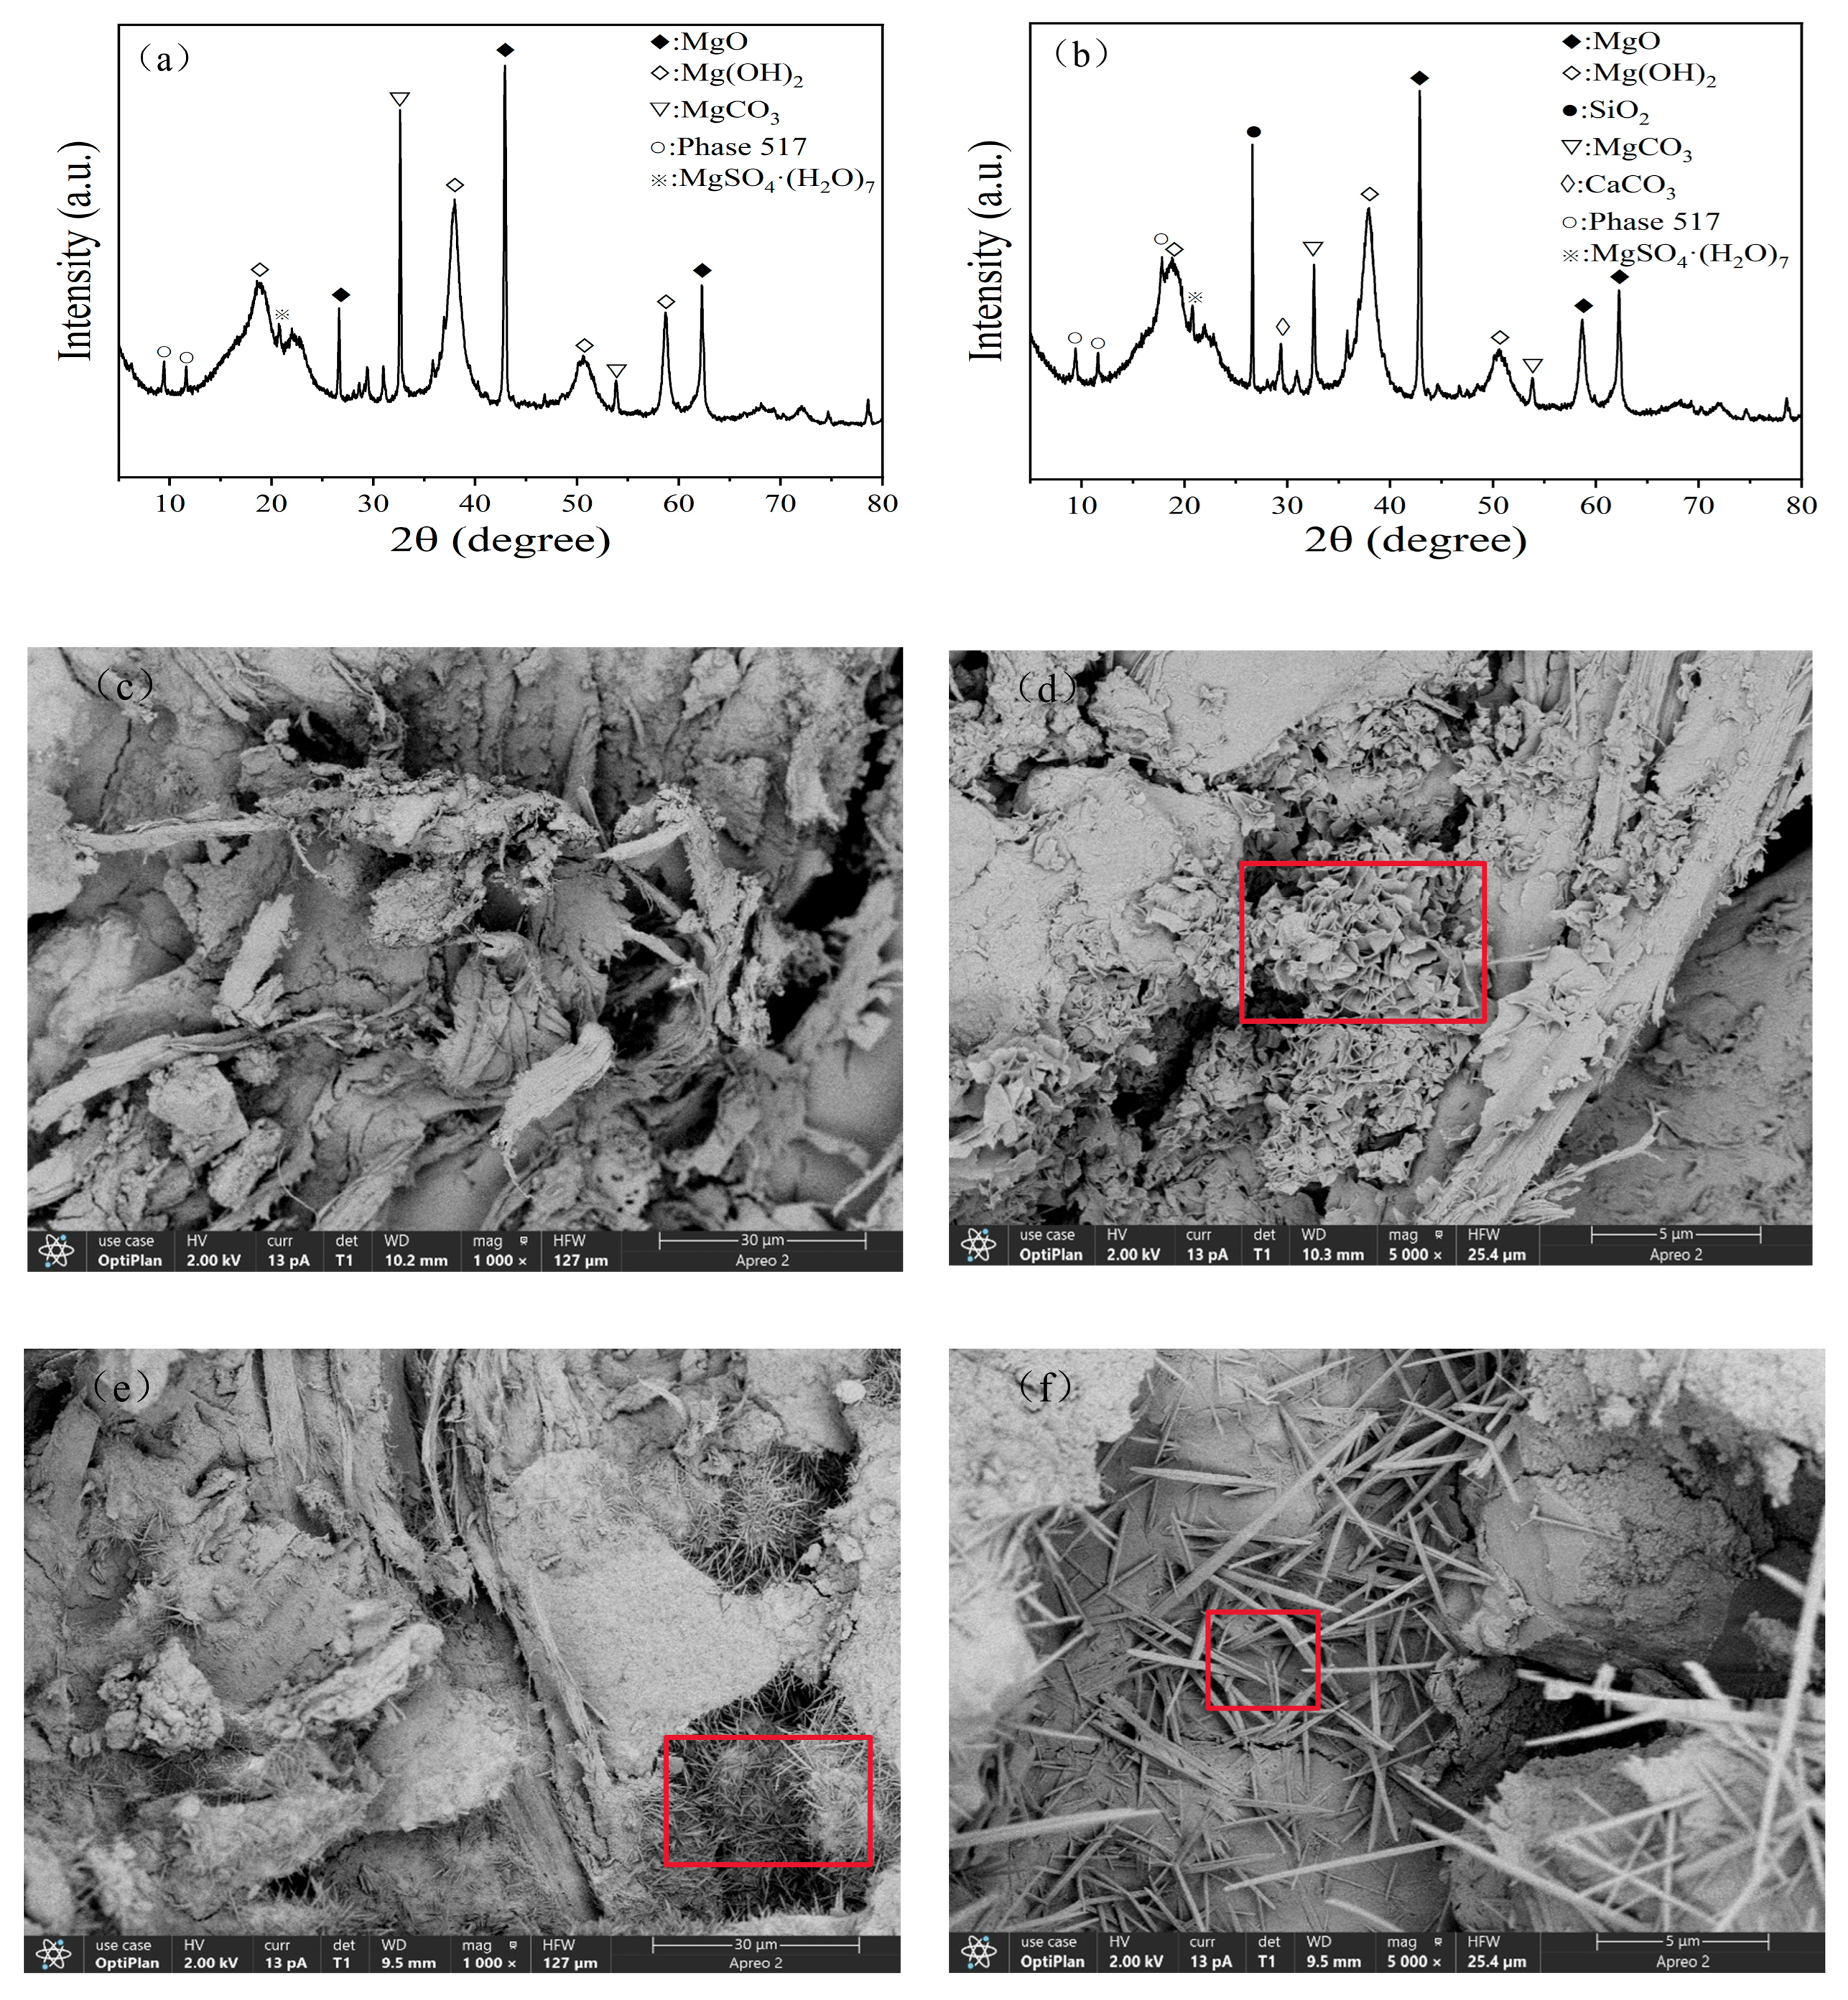
The XRD patterns and fracture surface morphology of biomass panels with and without the modifier are presented in Figure 6. As shown in Figure 6a,b, the diffraction peaks of MgO dominate in both the control and experimental groups, while the content of Mg(OH)2 is relatively low. This indicates a limited reaction between MgO and water in the system. In the experimental group, the diffraction peaks of SiO2 increase.
As clearly shown in Figure 6c,d (areas within red boxes), the main body of the panel is composed of flaky and fibrous matrix components intertwined in a disordered manner. The overall structural compactness is relatively low, with numerous evident pores and gaps present at the interfaces between fibers, and also between fibers and the matrix. Although the matrix fills some gaps between fibers, the fiber–matrix interfacial bonding is inhomogeneous—some fiber surfaces are insufficiently coated by the matrix. Concurrently, fine pores and gaps are still observable in localized areas. Furthermore, the size and morphological distribution of the fibrous components are relatively uneven.
In the biomass panels containing the modifier, a greater number of needle-like 517 phase (5Mg(OH)2·MgSO4·7H2O) crystals were observed. These crystals are interlocked and distributed between the flaky wood particles (as highlighted by the red boxes in Figure 6e,f). Upon cooling, the flowing lignin solidifies to form lignin bridges. The inter-fiber molten connection structures observed in the SEM image (Figure 6e,f) provide direct evidence for this mechanism.

3.3.2. Porosity and Pore Size Characteristics

To quantitatively characterize the evolution of pore structure in biomass panels at different modification levels, SEM images were systematically analyzed using ImageJ software (version 1.54g, NIH, Bethesda, MD, USA) to obtain the porosity and Feret diameter of panels at various modification levels (Table 8). The table shows that porosity decreased from an initial 10.918% to 8.916% when the modifier content was increased to 1.5%, while the Feret diameter decreased from 4.400 μm to 2.966 μm, representing a reduction of approximately 32.6%. Beyond 1.5% modifier content, the porosity exhibited a slight increase.
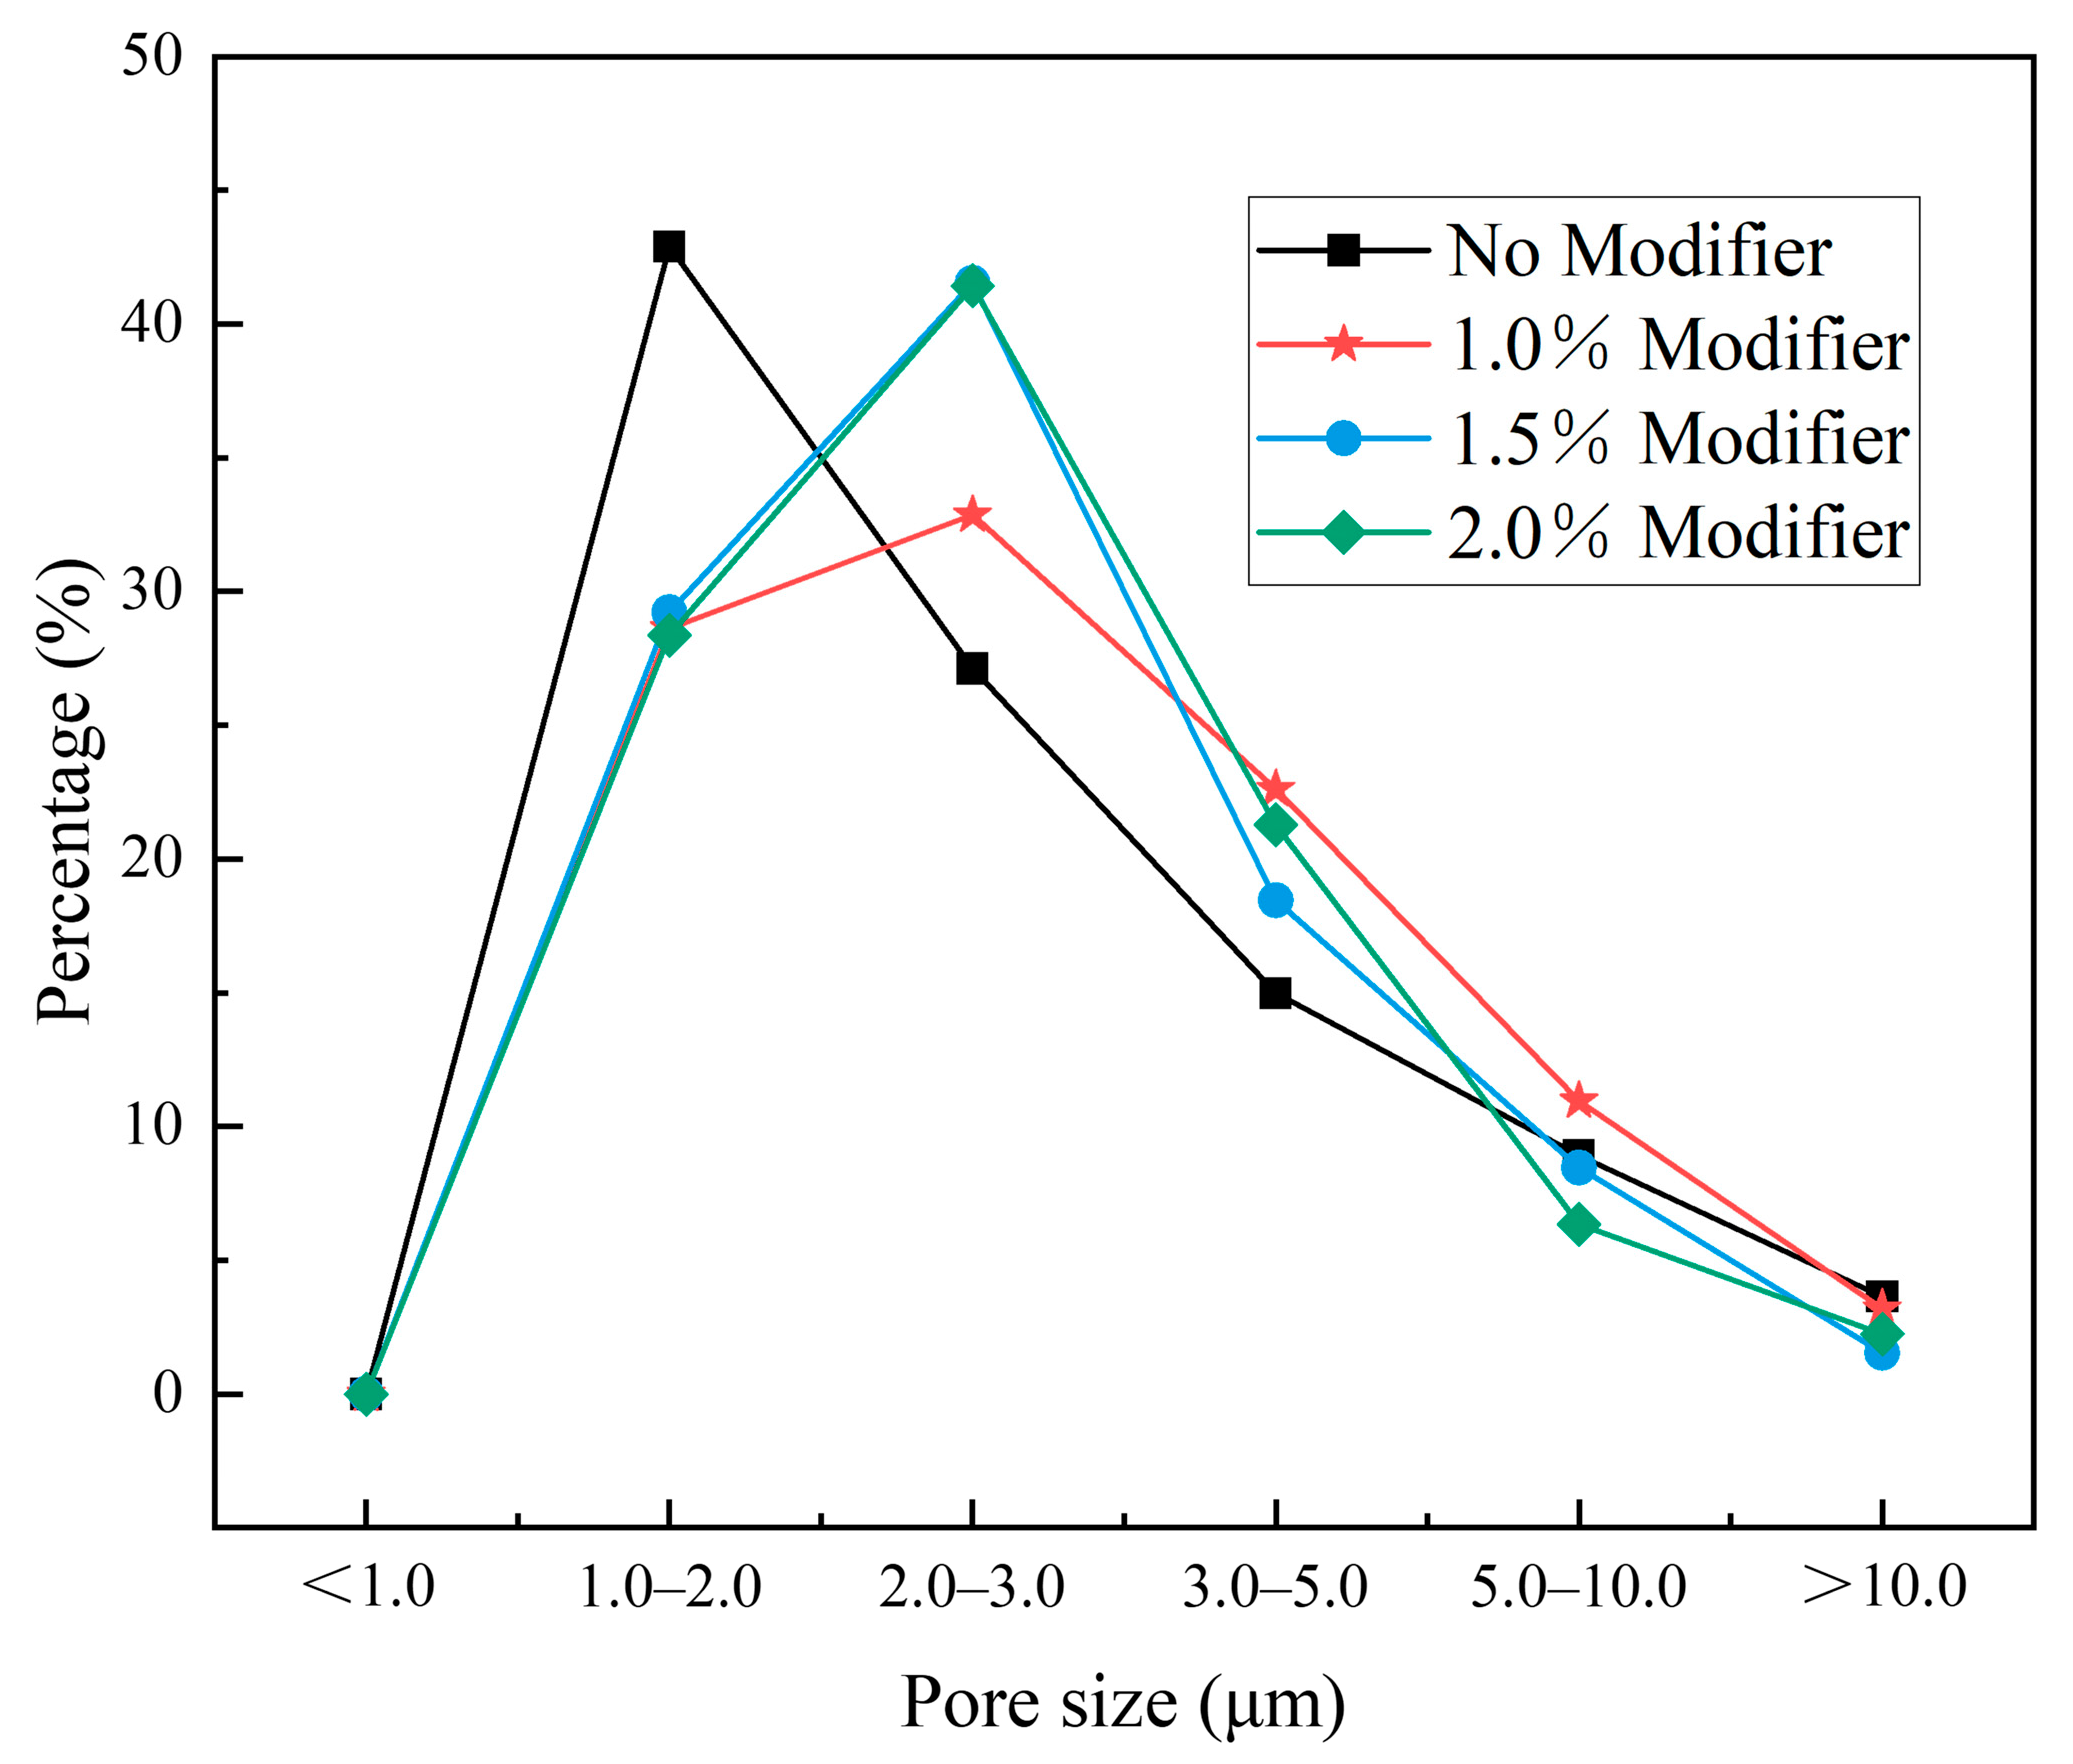
Figure 7 shows the percentage distribution of microporous sizes at different modifier concentrations, with pores in the 1.0–3.0 μm range predominating. The 1.5% group exhibits a microporous pore size distribution of 70.77% within the 1.0–3.0 μm range, significantly higher than other groups. This high microporosity results in tighter fiber interlacing, increased contact area, and a more continuous self-bonding interface, leading to peak values of MOR and MOE. As modifier content increased from 0% to 1.5%, the total proportion in the >10.0 μm macropore range gradually decreased.

3.3.3. Fiber Contact Interface Ratio

The fiber–fiber contact ratio increased substantially from 30.84% in the unmodified panels to 68.20% at 1.5% modifier content, as shown in Table 9. This indicates that the addition of the composite modifier effectively promoted closer fiber packing and enhanced interfacial interaction. However, a further increase to 2.0% modifier resulted in a slight decrease in contact ratio (63.05%), suggesting that 1.5% modifier approaches the saturation point for interfacial improvement.
At 1.5% modifier, the highest contact ratio (68.20%) corresponds to the maximum MOR (31.15 MPa) and minimum TS (1.32%). This suggests that the enhanced interfacial contact facilitates more efficient stress transfer and reduces water infiltration pathways.

3.4. Supplementary Tests and Analyses

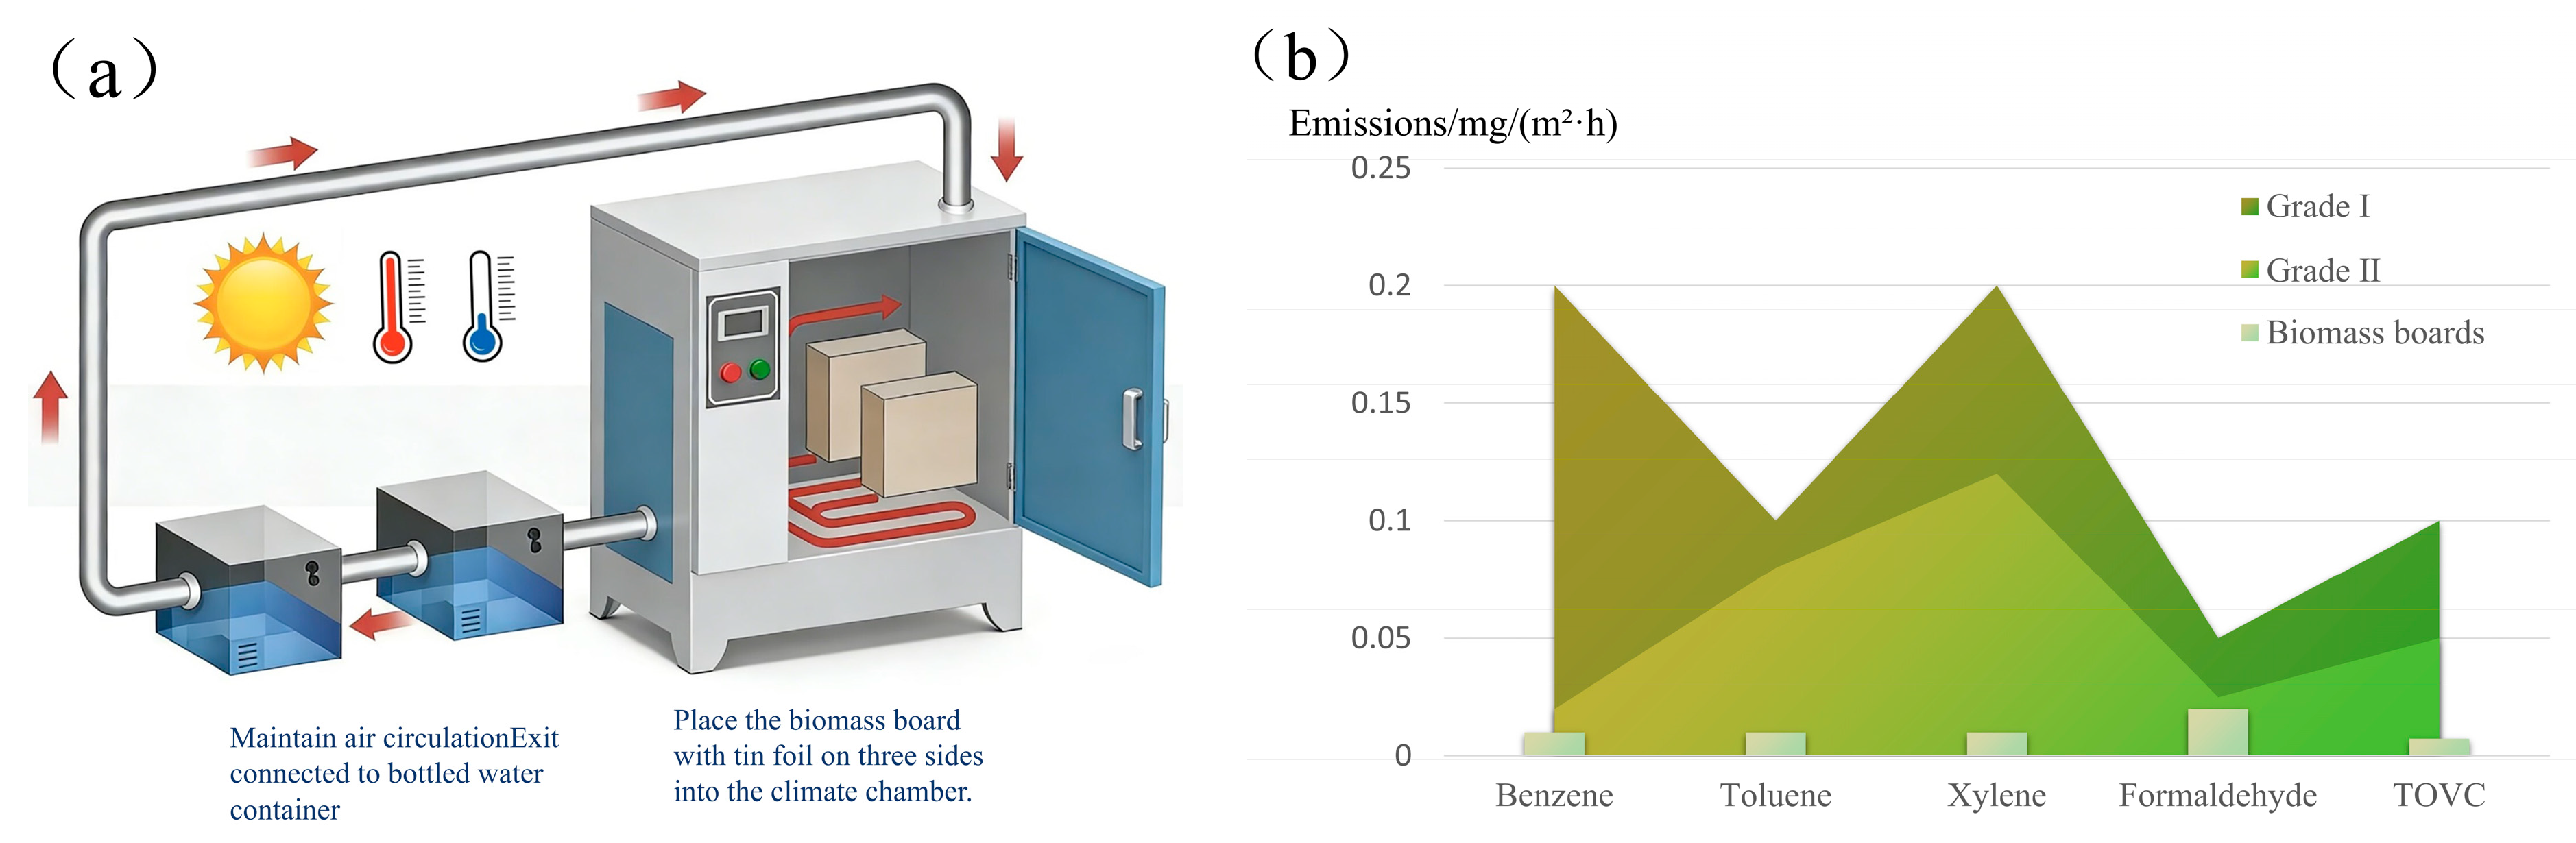
The biomass polycrystalline panels prepared using the optimal process parameters from the aforementioned research were subjected to emission testing for formaldehyde, benzene, toluene, and other compounds, as illustrated in Figure 8.
As shown in Table 10, the optimized panel samples fully comply with the ENF grade technical requirements specified in GB/T 39600-2021 “Classification for formaldehyde emission of wood-based panels and their finished products” [51,52]. The total volatile organic compound (TVOC) emissions met the technical requirements of clause 5.3.1 in HJ 571-2010 “Technical requirements for environmental labeling products: Wood-based panels and finishing products” [53]. Integrating the findings from the previous section, this study achieves synergistic optimization of environmental performance and mechanical properties.
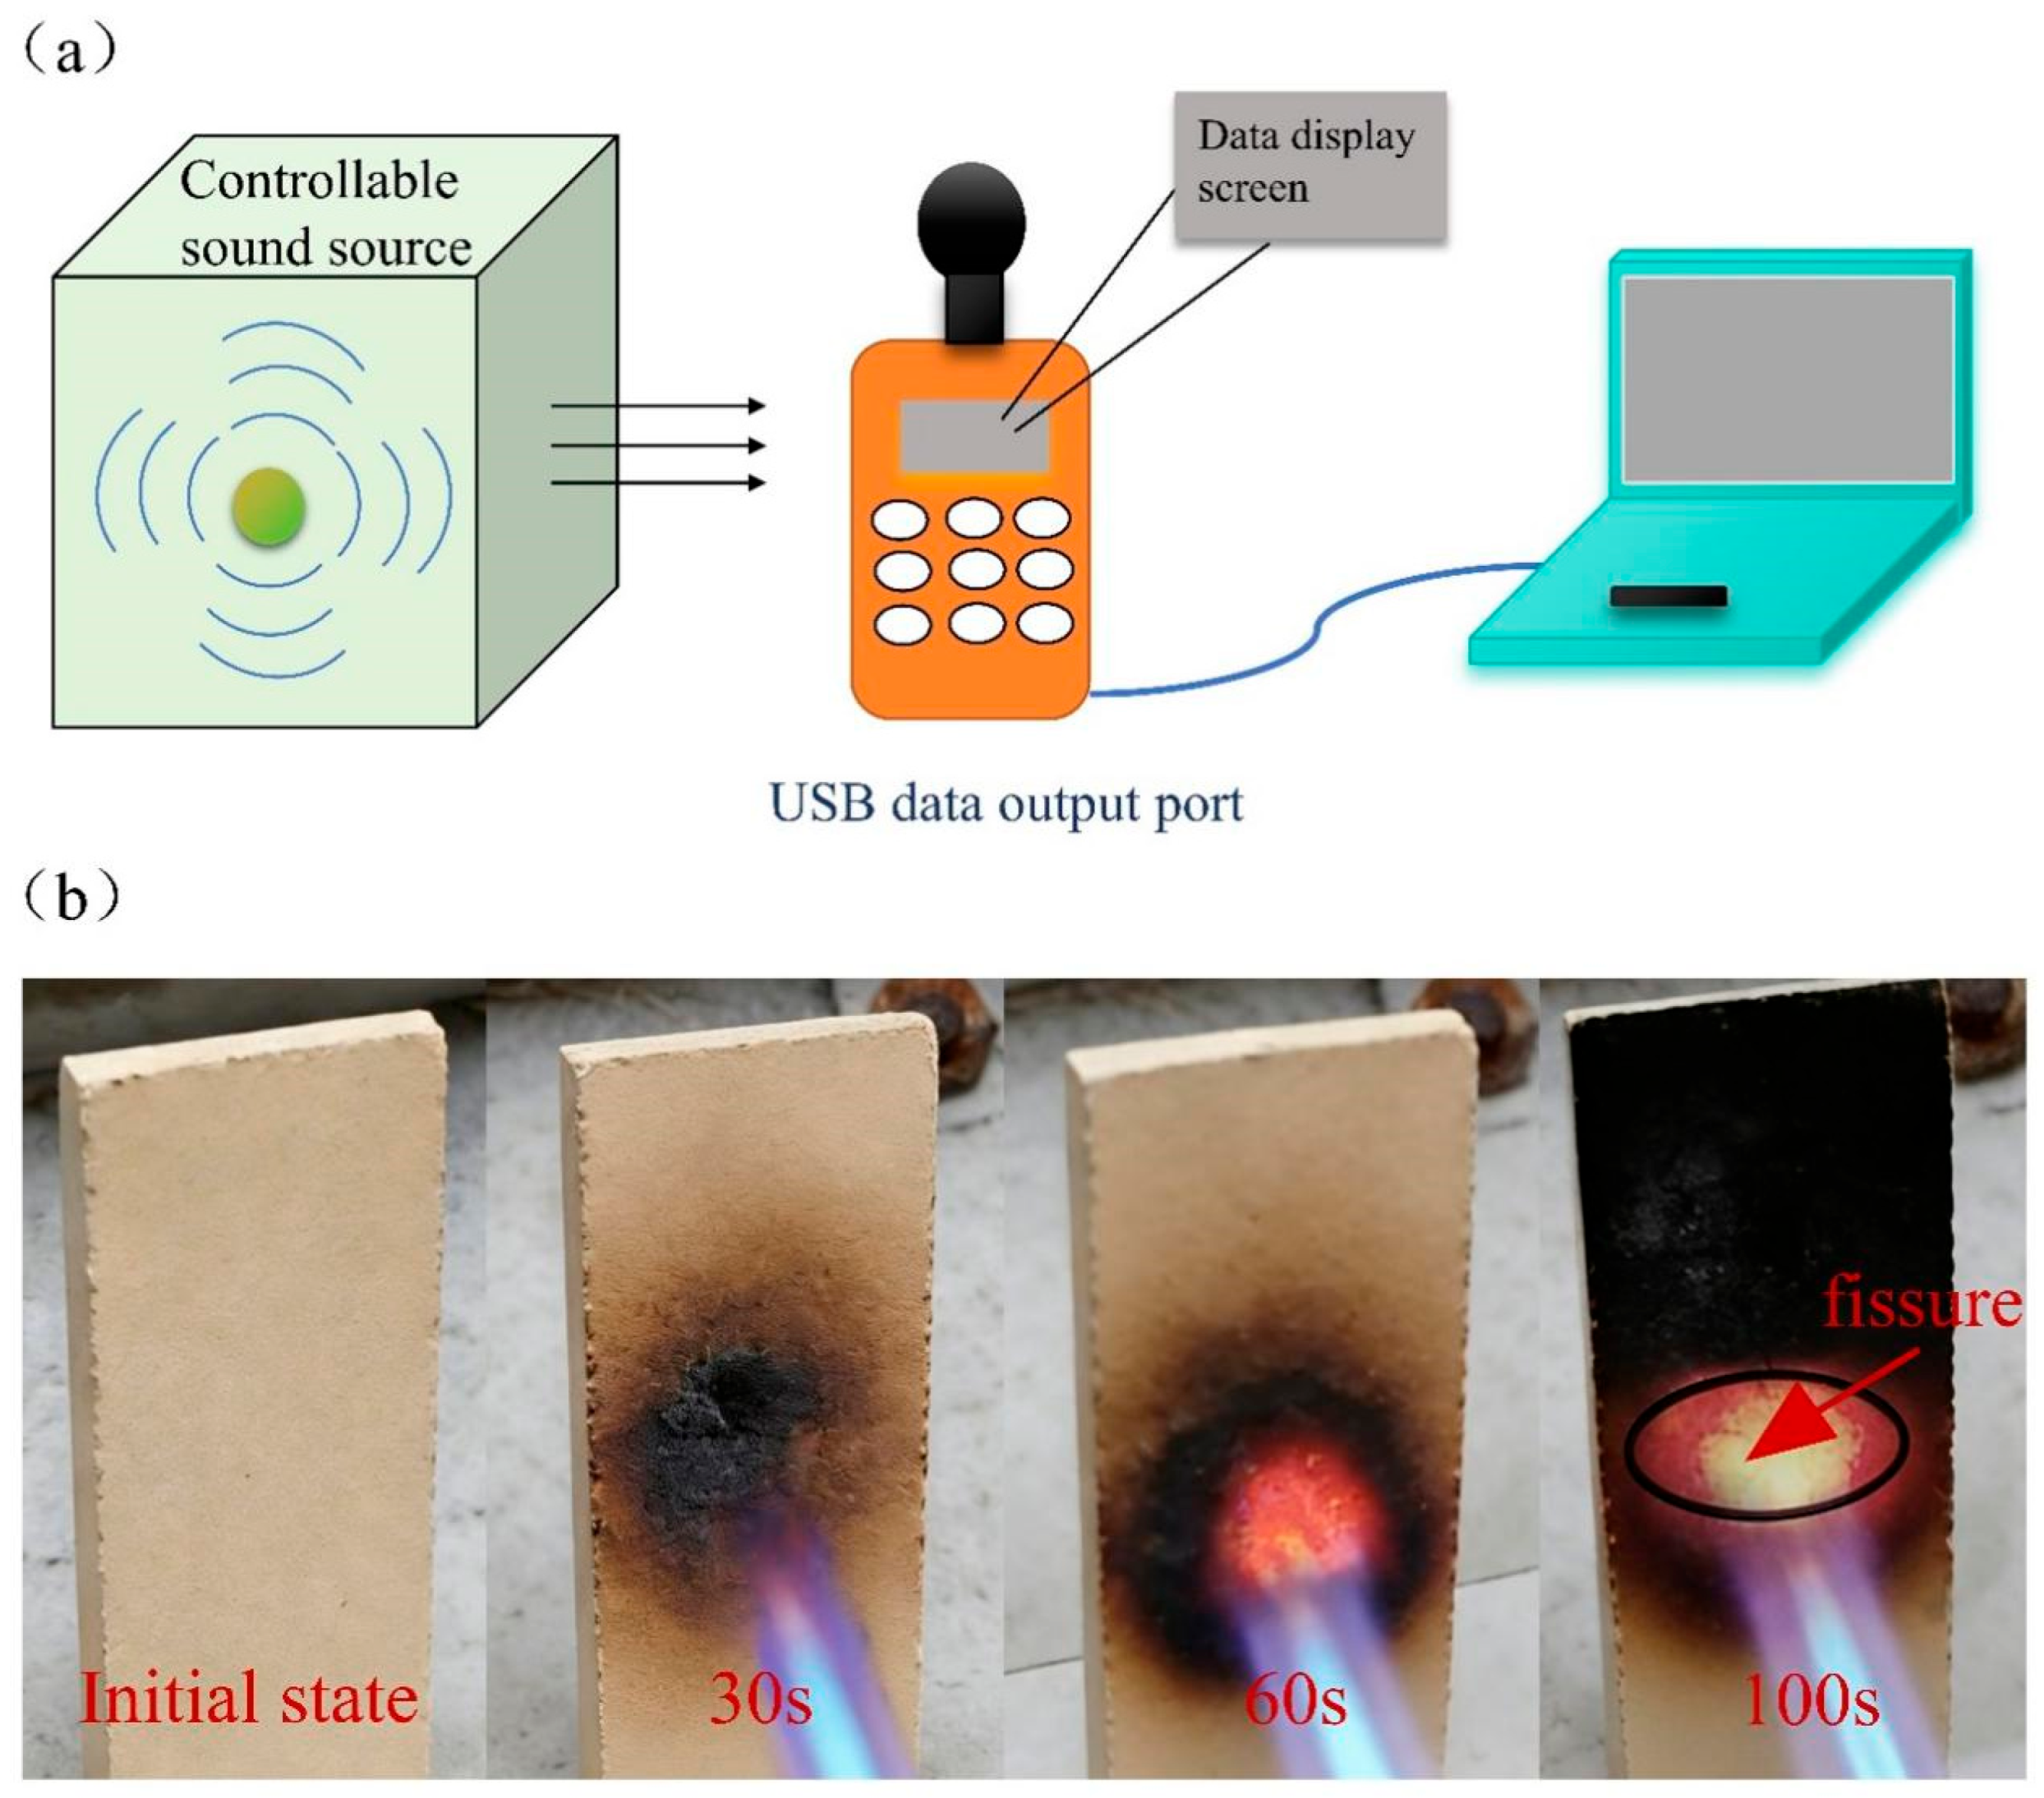
Furthermore, sound insulation and combustion performance tests were conducted on the biomass panels, as illustrated in Figure 9, and the results are presented in Table 11. The noise decibel test results demonstrate that the sound absorption performance meets the level required for bedroom building structures. The combustion performance test results satisfied the technical requirements for Class A (A2-s2, d0) building materials and products in sheet form as per GB/T 8624-2012 “Classification for burning behavior of building materials and products” [53]. The test results demonstrate that the biomass panels containing the modifier possess excellent environmental performance as a non-polluting material.

4. Discussion

4.1. The Influence of Process Parameters on the Properties of Poplar Wood Panels

Based on micro-mechanism analysis, the trends in the MOR and MOE of poplar wood panels under the combined effects of pressing time and pressure are consistent. This phenomenon can be primarily attributed to the following reasons: a moderate increase in hot-pressing time and pressure ensures sufficient heat transfer to the wood core layer. The mixture of magnesium oxide and other inorganic salts requires adequate temperature and time for the hydration reaction [54,55], forming a magnesium oxychloride cement matrix. This matrix bonds with the wood fibers via ionic and hydrogen bonds, providing adhesive strength [56]. Concurrently, the alkaline environment created by magnesium oxide promotes the degradation of hemicellulose within the wood fibers, increasing active sites for enhanced interfacial bonding. Under optimal conditions, the wood units are compacted densely without being crushed, and the mat cures uniformly, achieving an optimal structure. However, under prolonged heat exposure, thermal degradation of the internal materials occurs, compromising the mechanical properties of the fundamental units. This leads to increased internal stress, reduced effective bonding, and ultimately material degradation and a decrease in the modulus of elasticity due to excessive thermal exposure. Excessively high pressure can crush and flatten the wood cell structure, damaging the intrinsic strength of the wood fibers. These wood units may generate rebound stress upon pressure release [57], weakening the effective bond and potentially creating internal microcracks.
WA exhibits a pattern of first decreasing and then increasing under the combined effects of pressing time and pressure, indicating that within a certain time frame, heat cannot be uniformly transferred to the core of the panel. This results in insufficient plasticization of lignin and incomplete conversion of hemicellulose in the core layer, leading to a porous and hydrophilic structure [58]. Insufficient pressure leaves larger voids between wood fibers, facilitating water absorption and storage. Under optimal hot-pressing time and pressure, the panel achieves uniform densification throughout its entire thickness, fully activating the natural bonding. The mat is compacted to its theoretical maximum density, with cell walls compressed and lumens flattened, minimizing void size. The resulting dense structure significantly retards both the total amount and the rate of water absorption [59]. Conversely, excessively long exposure to high temperatures causes continuous degradation of wood components (especially hemicellulose), increasing porosity and reducing structural strength. Excessively high pressure can enhance the water absorption of crushed cell walls, and microcracks can become rapid pathways for moisture ingress.
The minimum values for TS occur within the specified range of pressing time and pressure, indicating that insufficient hot-pressing time prevents adequate plasticization of lignin and effective activation of hemicellulose. Under these conditions, the panel forms primarily through mechanical entanglement and physical compression. Its internal structure consists of loose fibers held together by weak hydrogen bonds and mechanical interlocking, resulting in high porosity and full exposure of hydrophilic groups (-OH), leading to a high TS [60]. Under optimal hot-pressing time and pressure, lignin flows and redistributes, coating the cellulose surfaces to form a hydrophobic “natural glue layer” that impedes rapid moisture ingress. Excessively long hot-pressing time, however, induces chemical degradation. This causes substantial hydrolysis and volatilization of hemicellulose and damages both the amorphous and crystalline regions of cellulose, creating new pores. Moisture intrusion into these pores subsequently induces swelling [61].

4.2. Effect of Microstructure Influenced by Modifier Content on Physical Properties of Sheets

The dominance of MgO diffraction peaks with relatively low Mg(OH)2 content indicates a limited reaction between MgO and water in the system. The significant increase in SiO2 diffraction peaks in the experimental group is noteworthy, as the presence of SiO2 can markedly reduce the TS [62]. Moreover, the increased content of the 517 phase forms a three-dimensional network structure within the matrix: it transmits and distributes stress through cross-linking effects, thereby inhibiting microcrack propagation; when subjected to stress, the debonding of whiskers requires additional energy consumption, significantly enhancing fracture toughness; and the three-dimensional whisker network reduces pore connectivity and extends water permeation pathways, which contributes to enhancing the panel’s strength, water resistance, and flame retardancy [63].
The observed porosity and interfacial gaps in the unmodified panels can explain their performance limitations. The abundance of pores can readily increase the WA and potentially elevate the TS [64]. Meanwhile, gaps at the fiber–matrix interface and insufficient compactness can weaken the bonding strength between components [65], hereby potentially reducing mechanical properties such as the MOR and MOE. This explains the underlying reasons for their relatively lower mechanical performance.
In the modifier-containing panels, the observed needle-like 517 phase crystals form a mechanical interlock with the wood fiber surfaces. This enhances the interfacial bonding strength and consequently improves the overall performance of the panels [66]. The presence of lignin bridges constitutes the core mechanism enabling self-adhesion in adhesive-free systems [67,68].

4.3. Relationship Between Microporosity Structure and Macro-Physical Properties

The amount of modifier added regulates the microscopic pore structure and interfacial bonding state of biomass panels, thereby determining their macroscopic physical and mechanical properties. As the modifier content increased from 0% to 1.5%, inorganic salts filled inter-fiber micropores, while polyvinyl alcohol and cellulose ether formed continuous adhesive films at fiber interfaces. Silicone oil lubrication promoted dense fiber packing, resulting in reduced porosity [69], decreased Feret diameter, and a gradual decrease in the proportion of large pores (>10.0 μm), while the proportion of micropores (1.0–3.0 μm) significantly increased, and fiber contact rate substantially improved. These microstructural optimizations reduced water penetration pathways and enhanced interfacial stress transfer efficiency, manifesting as significantly reduced WA and TS, while achieving peak values for MOR and MOE. When the addition exceeds the 1.5% threshold, excess inorganic salts crystallize and agglomerate. The organic phase becomes excessively viscous, hindering water and gas escape during hot pressing [70]. After cooling, new voids and defects form. PVA excessively coats fiber surfaces, weakening direct fiber–fiber contact [71]. This leads to a slight rebound in porosity, a decrease in fiber contact rate, and a slight increase in the proportion of large pores. Consequently, mechanical properties slightly decline and dimensional stability deteriorates [72]. Therefore, the 1.5% modifier content approaches the pore-filling saturation point, representing the optimal formulation for achieving the best mechanical properties and water resistance.
The increase in fiber–fiber contact ratio correlates well with the improved mechanical properties [73]. The slight decrease in contact ratio at 2.0% modifier may be attributed to excessive PVA coating that partially isolates fibers, hindering direct fiber–fiber contact [74].

5. Conclusions

(1)
The hot-pressing process for biomass panels was optimized using RSM, and regression models for the key physical properties were established. The optimized process parameters were determined as follows: hot-pressing time of 14 min, pressing pressure of 10 MPa, and baking–curing temperature of 108 °C. The panels produced under these conditions exhibited a MOR of 30.04 MPa, an MOE of 10,716 MPa, a WA of 4.98%, and a TS of 1.75%, exceeding EN 312 P5 requirements [75]. All these values meet the physico-chemical property requirements for wood-based panels and veneered wood-based panels specified in the National Standard GB/T 17657-2022. Furthermore, the deviations between these experimental results and the model predictions were all within 5%, verifying the accuracy and feasibility of the developed models.
(2)
Building upon the optimized parameters from the RSM study, biomass panels with varying modifier contents were prepared to compare their key properties. The results indicate that an modifier content of 1.5% is optimal for simultaneously enhancing multiple physical properties, particularly water resistance and dimensional stability. Compared to the control group (0% modifier), the panels with 1.5% modifier exhibited a 23.10% increase in MOR, a 26.38% increase in MOE, a 50.59% reduction in WA, and a 28.89% reduction in TS, demonstrating a significant modification effect.
(3)
In the biomass panels containing the modifier, a greater quantity of needle-like 517 phase (5Mg(OH)2·MgSO4·7H2O) crystals was observed. These crystals are interlocked and distributed between the flaky wood particles, forming a mechanical interlock with the wood fiber surfaces, which enhances the interfacial bonding strength. Concurrently, a significant increase in the SiO2 diffraction peaks was detected. The presence of SiO2 aids in forming a hydrophobic film on the fiber surfaces, markedly reducing the TS and thereby improving the overall performance of the panels.
(4)
Quantitative SEM analysis revealed that optimal processing reduced porosity from 15.6% to 8.3% and increased fiber–fiber contact ratio from 45.3% to 72.1%. Strong correlations between these microstructural parameters and macroscopic performance confirm that matrix densification and enhanced interfacial bonding, governed by processing conditions, are responsible for the improved mechanical strength and water resistance. This establishes a clear process–structure–performance relationship for green manufacturing of high-performance biomass panels.
(5)
The total volatile organic compounds (TVOC), benzene emissions, toluene emissions, xylene emissions, formaldehyde emissions, sound insulation, and combustion performance of biomass polycrystalline panels manufactured using optimized process parameters all meet national technical specifications. This further confirms that biomass polycrystalline panels comply with national low-carbon requirements.

Author Contributions

Conceptualization, Y.D., F.H., F.C. and G.X.; methodology, Y.D.; formal analysis, Y.D.; investigation, Y.D. and G.X.; preparation of materials, writing—original draft preparation, Y.D.; writing—review and editing, F.H. and G.X.; supervision, F.C. and G.X.; funding acquisition, F.C. All authors have read and agreed to the published version of the manuscript.

Funding

This work is supported by Guizhou Shixiang Technology Co., Ltd., Projects (grant No. K22-0108-007)].

Data Availability Statement

The original contributions presented in this study are included in the article. Further inquiries can be directed to the corresponding author.

Acknowledgments

The authors are grateful to Guizhou Shixiang Technology Co., Ltd. for supporting this work (Project No. K22-0108-007) and to the project team for their valuable collaboration and assistance. Additionally, during the preparation of this manuscript, the author(s) used [DeepSeek, version DeepSeek-V3.2] for the purposes of [language polishing and grammar checking]. The authors have reviewed and edited the output and take full responsibility for the content of this publication.

Conflicts of Interest

Author Fajiang Chen were employed by the company Guizhou Shixiang Technology Co., Ltd. The remaining authors declare that the research was conducted in the absence of any commercial or financial relationships that could be construed as a potential conflict of interest.

Abbreviations

MOEModulus of elasticity
MORModulus of rupture
WAWater absorption
TSThickness swelling
BBDBox–Behnken design
XRDX-ray diffraction
SEMScanning electron microscope
RSMResponse surface methodology

References

  1. Liu, H.; Wang, H.; Nong, H.; He, Y.; Chen, Y.; Wang, H.; Yu, M. Opportunities and implementation pathway for China’s forestry development under the “Dual Carbon” strategy. Carbon Res. 2024, 3, 59. [Google Scholar] [CrossRef] [Scilit]
  2. Kristak, L.; Kubovský, I.; Réh, R. New challenges in wood and wood-based materials. Polymers 2021, 13, 2538. [Google Scholar] [CrossRef] [Scilit] [PubMed]
  3. Korkees, F.; Sharratt, A.; Alqathami, M. Ageing of out-of-autoclaved hybrid flax/carbon fibre composites: Effects on water absorption and flexural behaviour. Mater. Lett. 2026, 406, 139847. [Google Scholar] [CrossRef] [Scilit]
  4. Klepeis, N.E.; Nelson, W.C.; Ott, W.R.; Robinson, J.P.; Tsang, A.M.; Switzer, P.; Behar, J.V.; Hern, S.C.; Engelmann, W.H. The National Human Activity Pattern Survey (NHAPS): A resource for assessing exposure to environmental pollutants. J. Expo. Sci. Environ. Epidemiol. 2001, 11, 231–252. [Google Scholar] [CrossRef] [Scilit]
  5. Lemus, R.; Abdelghani, A.; Akers, T.; Horner, W. Potential health risks from exposure to indoor formaldehyde. Rev. Environ. Health 1998, 13, 91–98. [Google Scholar]
  6. Chunde, J. Study on Processes of Self-Bonding Composites. Ph.D. Thesis, Northeast Forestry University, Harbin, China, 2002. [Google Scholar]
  7. Fu, Z. Preparation of Starch/Maize Straw Fiber Composite Materials and Biomimetic Laminated Boards. Doctoral Dissertation, Jilin University, Changchun, China, 2007. [Google Scholar]
  8. Prasad, R.K. Biological hydrogen production technologies from lignocellulosic biomass and microalgae. Environ. Technol. Rev. 2025, 14, 743–771. [Google Scholar] [CrossRef] [Scilit]
  9. Yu, T.; Khaloian, A.; van de Kuilen, J.-W. Influence of the manufacturing process on the stress state of curved glulam beams. Comput. Struct. 2025, 316, 107890. [Google Scholar] [CrossRef] [Scilit]
  10. Xu, J.; Widyorini, R.; Yamauchi, H.; Kawai, S. Development of binderless fiberboard from kenaf core. J. Wood Sci. 2006, 52, 236–243. [Google Scholar] [CrossRef] [Scilit]
  11. Rodríguez, G.E.; Ávila, C.B.; Cloutier, A. Impact of bio-based phase change materials on the thermal inertia of panels made from medium-density fiberboard (MDF) residues. Constr. Build. Mater. 2025, 494, 143434. [Google Scholar] [CrossRef] [Scilit]
  12. Le, D.H.A.; Bao, T.P. Fabrication and characteristics of binderless cellulosic fiberboard from sugarcane bagasse for sustainable building applications. Cellulose 2025, 32, 4345–4362. [Google Scholar] [CrossRef] [Scilit]
  13. Guirguis, M.N.; Khalaf, O.; Micheal, A. Experimental Investigation on Properties of Sugarcane Bagasse Fiberboard Manufactured with Different Techniques. IOP Conf. Ser. Earth Environ. Sci. 2024, 1393, 012009. [Google Scholar] [CrossRef] [Scilit]
  14. Leiter, H.S.; Neudecker, F.; Fürtner, D.G.; Altmutter, W.G.; Windsperger, A.; Hesser, F. Life cycle assessment of a straw-based fiberboard without binders produced at laboratory scale. Discov. Sustain. 2025, 6, 837. [Google Scholar] [CrossRef] [Scilit]
  15. Bekhta, P.; Ráheľ, J.; Pipíška, T.; Nociar, M.; Leiter, L.M.; Rousek, R. Properties of particleboards made from mixture of oversized fibers from MDF waste process and wood particles of Norway spruce (Picea abies). Wood Mater. Sci. Eng. 2025, 20, 571–579. [Google Scholar] [CrossRef] [Scilit]
  16. Abobakr, H.; Dahi, M.A.; Bensalah, M.O.; Bouhfid, R.; El kacem Qaiss, A.; Raji, M. A novel ultra-light bio-based fiberboard from mexican feather grass for thermal and acoustic insulation in green building construction applications. Constr. Build. Mater. 2024, 451, 138833. [Google Scholar] [CrossRef] [Scilit]
  17. Yan, J.; Yang, C.; Xue, B.; Zhang, T.; Qu, W. 3D microstructural characterization and mechanical properties determination of poplar-ultrathin fiberboard. Constr. Build. Mater. 2024, 432, 136662. [Google Scholar] [CrossRef] [Scilit]
  18. Dhannaree, M.; Tachaya, S. Process optimization and material characterization of fiberboards produced from pineapple leaf waste. J. Mater. Cycles Waste Manag. 2024, 26, 1480–1489. [Google Scholar] [CrossRef] [Scilit]
  19. Wang, Y.; Wang, C. The Theory and Application of Response Surface Methodology. J. Minzu Univ. China (Nat. Sci. Ed.) 2005, 14, 236–240. [Google Scholar]
  20. Li, L.; Sai, Z.; Qiang, H.; Xue-bin, H. Application of Response Surface Methodology inExperiment Design and Optimization. Res. Explor. Lab. 2015, 34, 41–45. [Google Scholar]
  21. Onyechi, D.E.; Abonyi, M.N.; Nwadike, E.C.; Adebusuyi, A.G. Fabrication, characterization and optimization of bio-based fibreboards from palm fruit fibre and rice husk fibre using RSM and ANN. Next Res. 2025, 2, 100947. [Google Scholar] [CrossRef] [Scilit]
  22. Kumar, A.; Sharma, K.V.; Gupta, A.; Tywoniak, J.; Hajek, P. Optimization of processing parameters of medium density fiberboard using response surface methodology for multiwalled carbon nanotubes as a nanofiller. Eur. J. Wood Wood Prod. 2017, 75, 203–213. [Google Scholar] [CrossRef] [Scilit]
  23. Yu, L.; Wang, S.; Wang, K.; Wang, S.; Lu, Z.; Ren, J. Preparation Process Optimization for Ultra-thin BambooParticleboard via Response Surface Methodology. J. Bamboo Res. 2022, 41, 7–14. [Google Scholar]
  24. Pan, Q.; Wu, D.; Shan, W.; Xiang, H. Preparation Technology and Optimization of Peanut Straw Fiberboard without Adhesive. Packag. Eng. 2020, 41, 127–134. [Google Scholar] [CrossRef]
  25. He, M.; Shao, X.; Wang, Y.; Li, C.; Ma, Y.; Dong, A. Optimization of Hot-Pressing Process Parameters for Ultra-Thin High-Density Fiberboard Veneer Plywood Using Response Surface Methodology. J. Northeast For. Univ. 2024, 52, 137–141. [Google Scholar] [CrossRef]
  26. Li, H.; Gu, Z.; Wang, X.; Du, Y.; Yang, Z. Optimization hot pressing process of bamboo filament decorativeblockboard process based on response surface method. J. Cent. South Univ. For. Technol. 2020, 40, 156–163. [Google Scholar] [CrossRef]
  27. Aguillón, B.; Cabrera, D.; Lazo, M.; Adrián, E.; Carrasco, M.; Medina-Perilla, J.; Vera-Villalobos, J.; Rigail-Cedeño, A. Sorbitol glycidyl ether Epoxy/Brewer’s spent grain biocomposite for fiberboard applications. Case Stud. Chem. Environ. Eng. 2024, 9, 100705. [Google Scholar] [CrossRef] [Scilit]
  28. EN 622-5:2009; Fibreboards-Specifications-Part 5: Requirements for Dry Process Boards (MDF). Comite Europeen de Normalisation (CEN): Brussels, Belgium, 2010; English version.
  29. GB/T 17657-2022; Test Methods of Evaluating the Properties of Wood-Based Panels and Surface Decorated Wood-Based Panels. State Administration for Market Regulation, Standardization Administration of China: Beijing, China, 2022; Chinese version.
  30. Khanjanzadeh, H.; Behrooz, R.; Bahramifar, N.; Pinkl, S.; Gindl-Altmutter, W. Application of surface chemical functionalized cellulose nanocrystals to improve the performance of UF adhesives used in wood based composites-MDF type. Carbohydr. Polym. 2019, 206, 11–20. [Google Scholar] [CrossRef] [Scilit]
  31. Liang, J.; Yang, Y.; Wu, L.; Zuo, N.; Li, Q.; Meng, T.; Chen, C.; Li, H.; Long, C.; Song, Z.; et al. One-Step Synthesis and Performance Evaluation of a Sucrose–Glyoxylic Acid Wood Adhesive. Materials 2025, 18, 5386. [Google Scholar] [CrossRef] [Scilit] [PubMed]
  32. Gao, X.; Qin, H.; Wang, S.; Xu, D.; Ren, D. A novel binderless self-bonding bamboo parenchyma cell tray: Exploring formation mechanisms and functional properties for enhanced fresh produce preservation. Food Chem. 2026, 501, 147557. [Google Scholar] [CrossRef] [Scilit] [PubMed]
  33. Yusof, M.; Sulaiman, M.S.; Ghani, R.S.M.; Razali, S.M. Innovative Biobased Composites from Oil Palm Trunk: Enhancing Mechanical and Flame-Retardant Properties through Optimized Additive Treatments. J. Renew. Mater. 2025, 13, 2059–2075. [Google Scholar] [CrossRef] [Scilit]
  34. Jeong, I.-J.; Kim, K.-J. Interactive desirability function approach to multi-response surface optimization. Int. J. Reliab. Qual. Saf. Eng. 2003, 10, 205–217. [Google Scholar] [CrossRef] [Scilit]
  35. Deng, C.; Wu, K.; Xiang, H.; Ou, R.; Liu, Z.; Liu, T.; Wang, Q. Ultra-high flame retardant starch/wood fiber composites based on the synergistic effect of ammonium polyphosphate and calcium carbonate. Int. J. Biol. Macromol. 2024, 283, 138088. [Google Scholar] [CrossRef] [Scilit] [PubMed]
  36. Seefeldt, H.; Braun, U.; Wagner, M.H. Residue stabilization in the fire retardancy of wood–plastic composites: Combination of ammonium polyphosphate, expandable graphite, and red phosphorus. Macromol. Chem. Phys. 2012, 213, 2370–2377. [Google Scholar] [CrossRef] [Scilit]
  37. Wu, Z.; Chen, T.; Aladejana, J.T.; Zhang, Z.; Liang, S.; Xiao, Y.; Lin, J.; Wang, X.; Xie, Y. Eco-benign PVA/aluminum phosphate as an alternative to formaldehyde-based adhesives in wood-based panels. RSC Adv. 2021, 11, 34416–34423. [Google Scholar] [CrossRef] [Scilit]
  38. Liu, L.; Wei, M.; Li, H.; Chen, Y.; Jiang, Y.; Ju, T.; Lu, Z.; Mu, G.; Cai, L.; Min, D. Polyvinyl alcohol solvent-free adhesives for biomass bonding via rapid water activation and heat treatment. Green Chem. 2024, 26, 11873–11884. [Google Scholar] [CrossRef] [Scilit]
  39. Deng, Y.; Guan, P.; Zuo, Y.; Wu, Y.; Yuan, G. Preparation and properties of PVA-sodium silicate hybrid modified poplar with interpenetrating and cross-linking structure. Cailiao Daobao 2021, 35, 10221–10226. [Google Scholar]
  40. Su, C.; Guo, J.; Cheng, J.; Zhang, J.; Gao, F. The heterogeneous epoxidation of microcrystalline cellulose and the reinforcing/toughening effect towards epoxy resin. In Proceedings of the Eighth China International Adhesive Technology Conference, Beijing, China, 29–30 March 2023; p. 28. [Google Scholar]
  41. Pourchez, J.; Ruot, B.; Debayle, J.; Pourchez, E.; Grosseau, P. Some aspects of cellulose ethers influence on water transport and porous structure of cement-based materials. Cem. Concr. Res. 2009, 40, 242–252. [Google Scholar] [CrossRef] [Scilit]
  42. Ghorbani, M.; Poorzahed, N.; Amininasab, S.M. Morphological, physical, and mechanical properties of silanized wood-polymer composite. J. Compos. Mater. 2020, 54, 1403–1412. [Google Scholar] [CrossRef] [Scilit]
  43. Okon, K.E.; Lin, F.; Chen, Y.; Huang, B. Decay resistance and dimensional stability improvement of wood by low melting point alloy heat treatment. J. For. Res. 2018, 29, 1797–1805. [Google Scholar] [CrossRef] [Scilit]
  44. Hojat, N.; Gentile, P.; Ferreira, A.M.; Šiller, L. Automatic pore size measurements from scanning electron microscopy images of porous scaffolds. J. Porous Mater. 2022, 30, 93–101. [Google Scholar] [CrossRef] [Scilit]
  45. Paris, J.L.; Kamke, F.A.; Nairn, J.; Muszyński, L.; Schwarzkopf, M. Wood-adhesive penetration: Non-destructive, 3D visualization and quantification. In Proceedings of the 56th International Convention of Society of Wood Science and Technology (SWST), Vancouver, BC, Canada, 9–14 June 2013; p. 179. [Google Scholar]
  46. Shao, G.; Zhang, L.; Xu, D.; Jin, Y.; Wu, F.; Yang, N.; Xu, X. Green and sustainable bioboards: Biomanufacturing of mycelium-based composite boards with tunable properties. Chem. Eng. J. 2025, 503, 158382. [Google Scholar] [CrossRef] [Scilit]
  47. Yan, Y.; Li, Y.; Wang, B.; Zhang, X.; Zeng, X.; Ding, S.; Ren, B.; Yang, X. Energy-efficient and formaldehyde-free biomass-based boards derived from Pleurotus Ostreatus substrate waste: A novel sustainable utilization strategy. Bioresour. Technol. Rep. 2025, 32, 102458. [Google Scholar] [CrossRef] [Scilit]
  48. Kapil, S.; Manohar, Y.S.; Rahandi, L.M.A.; Kumar, P.P.; Anil, N.; Khali, D.P. Influence of needle-punching treatment and pressure on selected properties of medium density fiberboard made of bamboo (Dendrocalamus strictus Roxb. Nees). Wood Mater. Sci. Eng. 2022, 17, 712–719. [Google Scholar] [CrossRef] [Scilit]
  49. Viktor, S.; Ivo, V.; Petar, A.; Ivaylo, Y.; Zlatomir, P. Effect of the Adhesive System on the Properties of Fiberboard Panels Bonded with Hydrolysis Lignin and Phenol-Formaldehyde Resin. Polymers 2022, 14, 1768. [Google Scholar] [CrossRef] [Scilit] [PubMed]
  50. Moslemi, A.; Koohi, M.Z.; Behzad, T.; Pizzi, A. Addition of cellulose nanofibers extracted from rice straw to urea formaldehyde resin; effect on the adhesive characteristics and medium density fiberboard properties. Int. J. Adhes. Adhes. 2020, 99, 102582. [Google Scholar] [CrossRef] [Scilit]
  51. Chen, W.; Ma, X.; Chen, W.; Li, J.; Zhang, S.; Hu, S. Research on Production Process and Performance Evaluation of Mold-resistant Fibreboard with Azoline Mold-resistant Agent. China Wood-Based Panels 2025, 32, 21–24. [Google Scholar]
  52. Chen, Y.F.; Yang, L.; Zhuang, S. Study on the Combustion Characteristic of Adhesive Polystyrene. Appl. Mech. Mater. 2014, 3562, 191–193. [Google Scholar] [CrossRef] [Scilit]
  53. Zuo, Z.; Wu, Y. Development Prospect of Adhesive for Wood-based Panel Industry Under Green. China Wood-Based Panels 2017, 44, 10–13. [Google Scholar]
  54. Pan, X.; Hu, R.; Lin, J.; Zhang, L.; Zhu, M. Materials for Energy Storage and Fuel Cells. In Proceedings of the 11th International Union of Materials Research Societies Asia Materials Conference, Qingdao, China, 25–28 September 2010; p. 16. [Google Scholar]
  55. Ma, W.; Luo, X.; Wang, M.; Wang, J.; Liu, X.; Duo, X.; Duo, X.; Tan, Z. Eco-Friendly Starch-Microencapsulated Magnesium Hydroxideand Graphene Oxide Synergistic Flame-Retardant PolyvinylChloride Composite. Acta Mater. Compos. Sin. 2025, 1–10. [Google Scholar] [CrossRef]
  56. Sun, R. Removing lignin and hemicelluloses from lignocellulosic materials for an efficient bioethanol production. In Proceedings of the Sixteenth International Conference on Wood, Fibre and Pulp Chemistry, Tianjin, China, 8–10 June 2011; p. 6. [Google Scholar]
  57. Qian, L.; Zeng, B.; Xue, Z.; Miao, X.; Pu, J. Analysis of the Mechanism by Which Cross-linked Modifiers Enhance the Application Quality of Fast-growing Poplar Wood. Trans. Chin. Soc. Agric. Eng. 2013, 29, 267–275. [Google Scholar]
  58. Deng, W.; Feng, Y.; Fu, J.; Guo, H.; Guo, Y.; Han, B.; Jiang, Z.; Kong, L.; Li, C.; Liu, H.; et al. Catalytic conversion of lignocellulosic biomass into chemicals and fuels. Green Energy Environ. 2023, 8, 10–114. [Google Scholar] [CrossRef] [Scilit]
  59. Zhang, J.; Lu, L.; Yong, S.; Ma, L.; Liu, S. Advance of Studies on Structure and Decrystallization of Cellulose. Chem. Industy For. Prod. 2008, 28, 109–114. [Google Scholar]
  60. Xie, M.; Xu, J.; Xu, J.; Tao, J. Preliminary Study on Manufacturing Particleboard fromTobacco Stems with Wood Shavings. For. Mach. Woodwork. Equip. 2009, 37, 27–29. [Google Scholar]
  61. Zhu, X.; Liu, H.; Li, Z.; Huang, L. Study on the Swelling Properties of Coffee Residue Dietary Fiberby Ultra-high Pressure Modification. Food Ind. 2018, 39, 134–137. [Google Scholar]
  62. Zhang, X.; Wu, Y.; Hu, Y.; Zhai, Y.; Liu, X. Study on preparation and properties of reactive sodiumsilicate adhesive used for wood-based panel. J. Cent. South Univ. For. Technol. 2012, 32, 83–87. [Google Scholar] [CrossRef]
  63. Li, Z.; Yu, S.; Wang, S.; Wang, B.; Liu, B. Effect of Straw Fiber Alkaline Extractives on Properties ofBasic Magnesium Sulfate Cement. Bull. Chin. Ceram. Soc. 2018, 37, 868–872. [Google Scholar] [CrossRef]
  64. Nasir, M.; Khali, D.P.; Jawaid, M.; Tahir, P.M.; Siakeng, R.; Asim, M.; Khan, T.A. Recent development in binderless fiber-board fabrication from agricultural residues: A review. Constr. Build. Mater. 2019, 211, 502–516. [Google Scholar] [CrossRef] [Scilit]
  65. Wang, H.; Li, Y.; Xia, L.; Yang, Y.; Liu, W.; Zhan, X. Micromorphology studies of carbon fiber reinforced polymer surface cleaned by ultraviolet laser. Compos. Sci. Eng. 2023, 102–107. [Google Scholar] [CrossRef]
  66. Dong, T.; Sheng, G.; Zhang, A.; Zhao, Z.; Sun, X.; Zhou, W.; Li, J. Enhanced mechanical strength and water resistance of magnesium oxysulfate cement as wood adhesive. Int. J. Adhes. Adhes. 2025, 142, 104097. [Google Scholar] [CrossRef] [Scilit]
  67. Wang, C.; Kelley, S.S.; Venditti, R.A. Lignin-based thermoplastic materials. ChemSusChem 2016, 9, 770–783. [Google Scholar] [CrossRef] [Scilit]
  68. Li, K.; Zhao, L.; Ren, J.; He, B. Lignin’s effect on cellulose fiber bonding and inter-fiber interface design for enhancing densified wood. Carbohydr. Polym. 2025, 359, 123573. [Google Scholar] [CrossRef] [Scilit] [PubMed]
  69. Silva, T.C.F.; Silva, D.; Lucia, L.A. The multifunctional chemical tunability of wood-based polymers for advanced biomaterials applications. Green Biorenew. Biocompos. Knowl. Ind. Appl. 2015, 427–459. [Google Scholar]
  70. Luo, H.; Si, R.; Liu, J.; Li, P.; Tao, Y.; Zhao, X.; Chen, H. Preparing the reinforced wood via embedding cellulose nanocrystals (CNC) into delignified fast-growing wood followed by densification. Cellulose 2022, 29, 7377–7396. [Google Scholar] [CrossRef] [Scilit]
  71. Chiam, S.L.; Wong, P.Y.; Xu, Y.; Leo, C.; Pung, S.-Y. Tunable photoelectrocatalytic oxidation of chitosan/lignin coating on PVDF hollow fiber membrane for efficient oil-water separation. J. Water Process Eng. 2026, 81, 109293. [Google Scholar] [CrossRef] [Scilit]
  72. Chen, C.; Kuang, Y.; Zhu, S.; Burgert, I.; Keplinger, T.; Gong, A.; Li, T.; Berglund, L.; Eichhorn, S.J.; Hu, L. Structure–property–function relationships of natural and engineered wood. Nat. Rev. Mater. 2020, 5, 642–666. [Google Scholar] [CrossRef] [Scilit]
  73. Wu, J.; Yu, D.; Chan, C.M.; Kim, J.; Mai, Y.W. Effect of fiber pretreatment condition on the interfacial strength and mechanical properties of wood fiber/PP composites. J. Appl. Polym. Sci. 2000, 76, 1000–1010. [Google Scholar] [CrossRef] [Scilit]
  74. Gil-Guillén, I.; González-Martínez, C.; Chiralt, A. Influence of the cellulose purification method on the properties of PVA composites with almond shell fibres. Molecules 2025, 30, 372. [Google Scholar] [CrossRef] [Scilit]
  75. EN 312 P5; Particleboards—Specifications—Part 5: Requirements for Load-Bearing Boards for Use in Humid Conditions. Comite Europeen de Normalisation (CEN): Brussels, Belgium, 2008; English version.
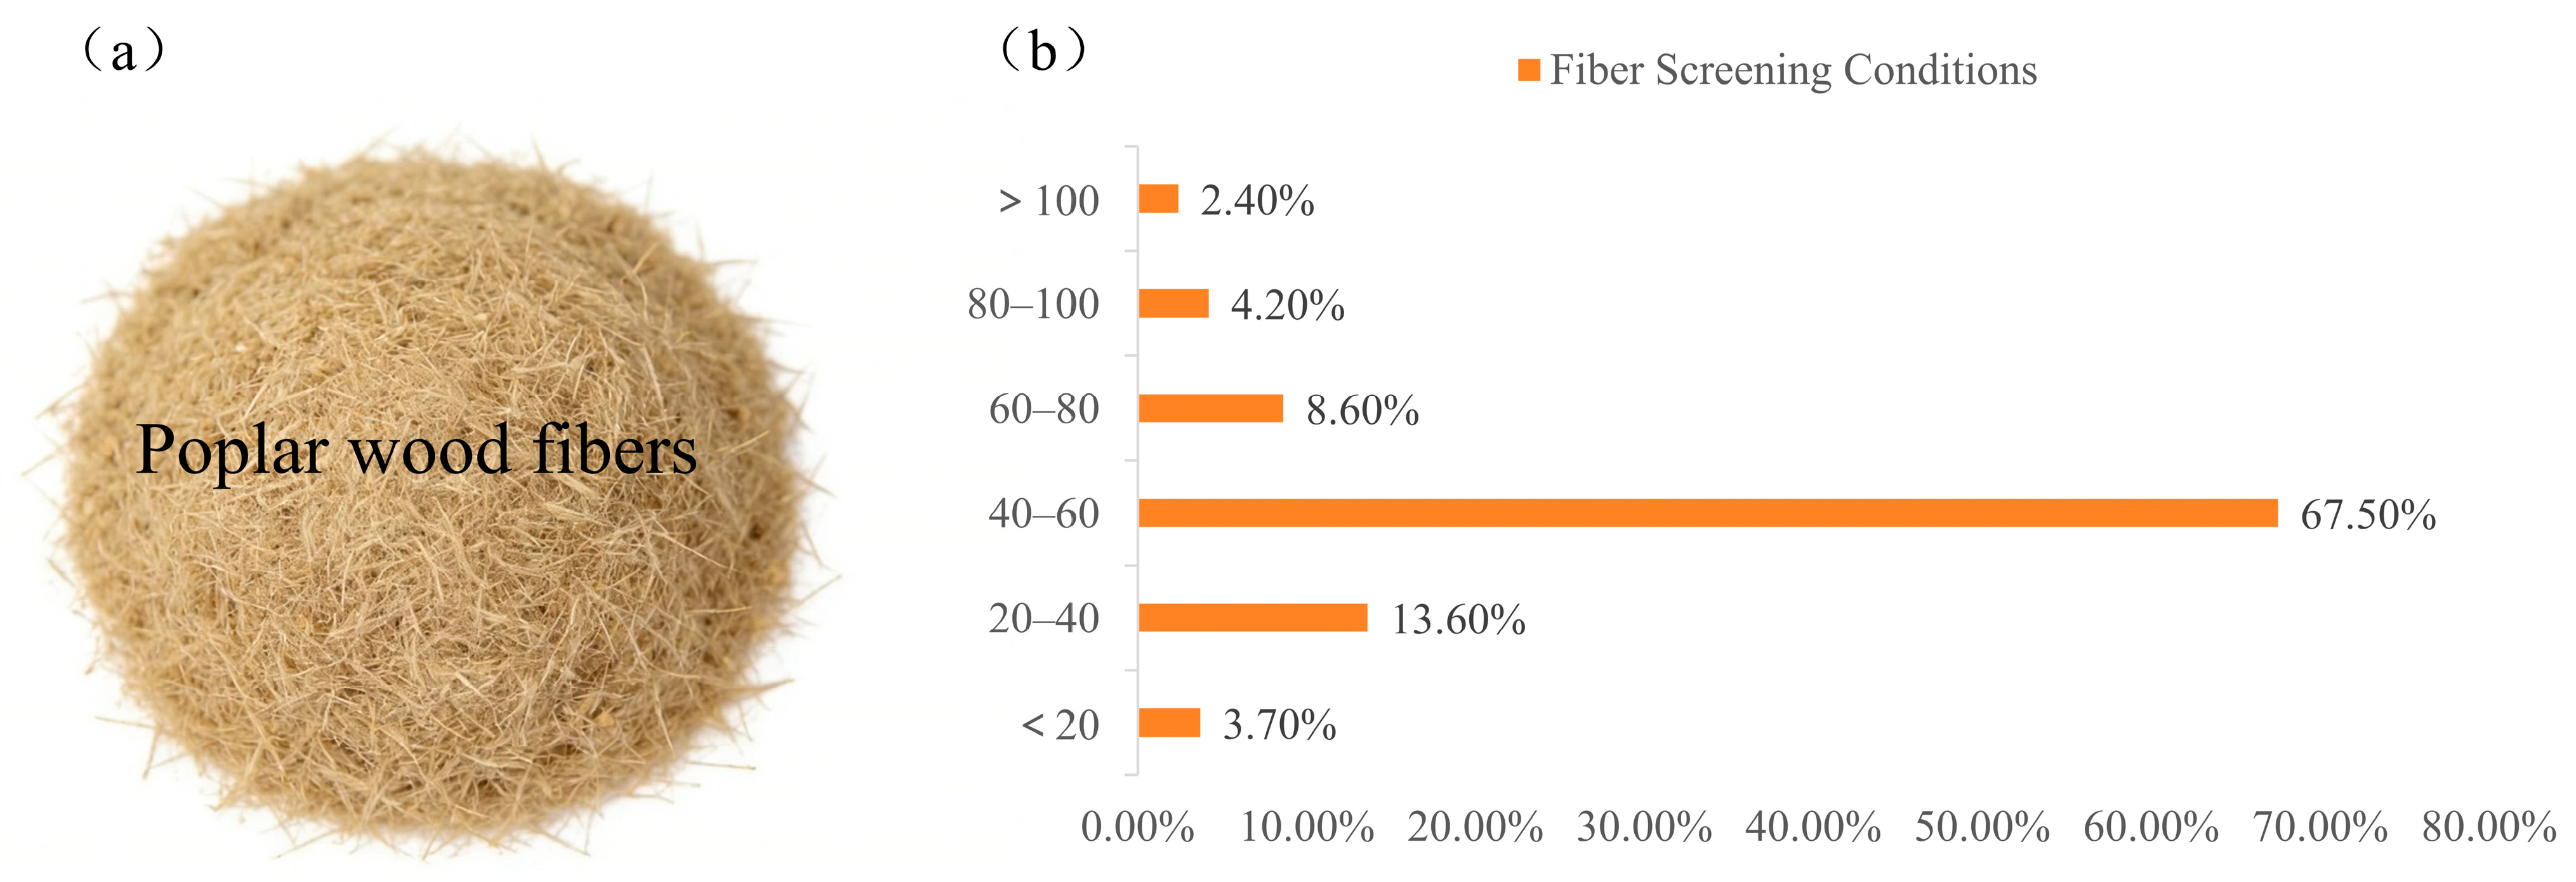
Figure 1. Structural characteristics of the fibers. (a) Fiber packing state; (b) proportion of fibers of different sizes.
Forests 17 00304 g001
Figure 2. Physical diagram of primary equipment: (a) hot hydraulic press; (b) universal testing machine.
Forests 17 00304 g002
Figure 3. The preparation process of biomass plates.
Forests 17 00304 g003
Figure 4. Response surface and contour plots of physical properties for biomass panels: (a) MOR; (b) MOE; (c) WA; (d) TS.
Forests 17 00304 g004
Figure 5. Effect of addition level on the mechanical and physical properties of biomass panels. (a) Modulus of rupture (MOR) and modulus of elasticity (MOE); (b) water absorption (WA) and thickness swelling (TS).
Forests 17 00304 g005
Figure 6. XRD and SEM images of the fracture surfaces of biomass panels before and after modifier modification: (a) XRD before modification; (b) XRD after modification; (c) SEM at 1000× magnification before modification; (d) SEM at 5000× magnification before modification; (e) SEM at 1000× magnification after modification; (f) SEM at 5000× magnification after modification.
Forests 17 00304 g006
Figure 7. Schematic diagram of pore size distribution under different modifier contents.
Forests 17 00304 g007
Figure 8. Testing of emissions from biomass panels: (a) test procedure (b) schematic diagram of results.
Forests 17 00304 g008
Figure 9. Other environmental performance tests: (a) sound insulation; (b) combustion.
Forests 17 00304 g009
Table 1. Lignocellulosic composition of wood.
MaterialCellulose (%)Hemicellulose (%)Lignin (%)Reference
Content range42–4822–3422–29[27]
Table 2. Response surface design for biomass panels.
LevelFactor
X1/minX2/MPaX3/°C
−112895
01511105
11814115
Table 3. Response surface experiment results.
GroupX1/minX2/MPaX3/°CMOR/MPaMOE/MPaWA/%TS/%
112810521.2350067.751.66
218810519.251985.782.19
3121410523.0964126.451.86
4181410521.4163546.851.64
512119525.4463368.741.21
618119522.1951636.282.44
7121111526.8969856.461.73
8181111526.9482647.170.68
91589517.451485.321.57
1015149523.4189056.291.44
1115811525.4391056.320.81
12151411525.6587644.860.63
13151110529.8410,9655.091.77
14151110530.9810,7244.721.78
15151110530.511,0465.021.68
16151110529.1810,5684.781.64
17151110531.6410,8944.931.69
Table 4. Variance analysis of modulus of rupture.
SourceSum of SquaresMean SquareF-Valuep-Value
Model283.6131.5134.64<0.0001
X15.975.976.560.0375
X213.2613.2614.580.0066
X333.9133.9137.270.0005
X1 × 20.03060.03060.03370.8596
X1X32.722.722.990.1273
X2X38.388.389.210.019
X1248.7248.7253.550.0002
X22141.35141.35155.37<0.0001
X3211.6211.6212.780.009
Residual6.370.9098
Lack of Fit2.690.89540.97280.4884
Pure Error3.680.9205
Cor Total289.98
Table 5. Comparison of optimized key physical properties.
Physical PropertiesNational Standard (GB/T 17657-2022)Predicted ValueActual Measured ValueRelative Error
MOR/MPa≥25.030.0430.902.8%
MOE/MPa≥250010,71610,626−0.8%
WA/%≤12.04.985.041.5%
TS/%≤13.01.751.71−2.3%
Table 6. Performance comparison of optimized poplar glue-free panel with EN 622-5 standard.
Performance MetricsOptimized ValueEN 622-5 (MDF.H Thickness 6–19 mm)
MOR/MPa31.15≥27.0
MOE/MPa11,390≥2700
WA/%4.12——
TS/%1.32≤12.0
Table 7. Comparison of biomass panel properties in this study with those reported in the literature.
Biomass Panel CategoriesMOR/MPaMOE/MPaWA/%TS/%Reference
This study31.1511,3904.121.32
Mycelium-based composite panels8,919200——8.5[46]
Mushroom substrate-based panels22.644223.57——19.83[47]
Medium-density fiber panel made of bamboo28.552960.1944.194.79[48]
Lignin PF panel52.65468054.0520.40[49]
Straw nanofiber panel23.252370————[50]
Table 8. Quantitative statistics of pore parameters based on ImageJ.
Percentage of Addition/%Porosity/%Feret/μm
010.918 ± 1.74.400
1.09.387 ± 1.23.379
1.58.916 ± 0.92.966
2.09.173 ± 1.33.163
Table 9. Fiber–fiber contact ratio at different modifier concentrations.
Percentage of Addition/%Fiber–Fiber Contact Ratio/%
030.84 ± 3.2
1.047.73 ± 2.8
1.568.20 ± 3.5
2.063.05 ± 4.1
Table 10. Test results for emission levels of panel materials.
Testing ItemsTesting BasisTechnical IndicatorsTest ResultsIndividual Assessment
Total volatile organic compounds (TVOC)/mg/(m2∙h)HJ571-2010≤0.500.0076fulfill
Benzene release rate/mg/(m2∙h)HJ571-2010——0.001——
Toluene release rate/mg/(m2∙h)HJ571-2010——0.001——
Xylene release rate/mg/(m2∙h)HJ571-2010——0.001——
Formaldehyde emission/mg/(m2∙h)GB/T 17657-2013≤0.124E10.020ENF
≤0.050E0
≤0.025ENF
Table 11. Test results for sound insulation and panel combustion performance of biomass panels.
Testing ItemsTesting BasisTechnical IndicatorsTest ResultsIndividual Assessment
Airborne sound insulation performance, dBGB/T 19889.3-2005 31
Combustion growth rate index (FIGRA 0.2 MJ),W/sGB/T 20284-2006≤12036Complies
Total heat released within 600 s, MJ≤7.53.4Complies
Horizontal flame spread lengthIt did not reach the long edge of the specimenIt did not reach the long edge of the specimenComplies
PCS, MJ/kgGB/T 14402-2007≤3.02.4Complies
SMOGRA, m2/s2GB/T 20284-2006S1 ≤ 304S1
S2 ≤ 180
TSP 600 s, m2S1 ≤ 5057S2
S2 ≤ 200
Burning dropletsd0: No flaming droplets/particles within 600 sNo flaming droplets/particles within 600 sd0
d1: No flaming droplets/particles are observed within 600 s, with no occurrence lasting more than 10 s
Disclaimer/Publisher’s Note: The statements, opinions and data contained in all publications are solely those of the individual author(s) and contributor(s) and not of MDPI and/or the editor(s). MDPI and/or the editor(s) disclaim responsibility for any injury to people or property resulting from any ideas, methods, instructions or products referred to in the content.