1. Introduction
Forests constitute a vital component of the global carbon cycle, serving as major reservoirs of terrestrial biomass and playing an essential role in climate regulation [
1]. Accurate estimation of aboveground biomass (AGB) is therefore fundamental for quantifying forest carbon stocks, assessing ecosystem productivity, evaluating the impacts of climate change, and supporting sustainable forest management.
In regional AGB mapping, field-based surveys conducted at the plot scale have traditionally served as the primary data source, with biomass derived through allometric equations and statistical modeling [
2]. To overcome the spatial limitations of field inventories, satellite remote sensing (RS) offers a powerful alternative, enabling systematic, large-scale, and repeatable observations [
3]. Optical sensors—such as those onboard Sentinel-2 and Landsat—have been widely employed for AGB retrieval using vegetation indices like the Normalized Difference Vegetation Index (NDVI) [
4,
5,
6]. Additionally, coarse-resolution sensors like MODIS provide frequent temporal coverage, supporting large-area monitoring [
7,
8,
9]. However, optical RS is fundamentally constrained by cloud cover and solar illumination conditions, which often lead to data gaps and reduced estimation accuracy, particularly in persistently cloudy regions [
10,
11,
12].
In contrast, Synthetic Aperture Radar (SAR) systems acquire data independently of weather and daylight, offering all-weather observational capability. SAR backscatter contains information related to forest structure, moisture, and biomass, making it valuable for AGB modeling. Both C-band (e.g., Sentinel-1) and L-band (e.g., ALOS PALSAR) sensors have been utilized for regional-scale biomass estimation [
13,
14]. Nevertheless, a well-known limitation persists: in medium-to-high biomass forests, SAR backscatter tends to saturate, leading to underestimation of AGB. Similarly, optical vegetation indices also saturate at high canopy densities, thereby constraining the accuracy of biomass retrieval across structurally complex forests.
Recent advances in RS have highlighted the potential of data fusion to overcome the limitations of individual sensors [
15]. In particular, the integration of optical, SAR, and LiDAR (Laser Imaging, Detection, and Ranging) data can significantly improve AGB estimation by capitalizing on their complementary strengths: optical data provide spectral information related to vegetation vigor, SAR contributes information on canopy structure and moisture, and LiDAR delivers direct measurements of canopy height and vertical structure [
16,
17,
18]. Spaceborne LiDAR missions such as ICESat-2 and GEDI have further enhanced the feasibility of large-scale canopy height mapping, which can be used to constrain AGB models [
19,
20,
21,
22,
23,
24]. Despite these developments, a critical challenge remains: current approaches often lack a unified framework that effectively harmonizes multi-sensor data streams for spatially continuous, large-scale, and temporally consistent AGB retrieval.
Despite the precision of spaceborne LiDAR missions like ICESat-2, current approaches often lack a unified framework to harmonize these sparse data streams into spatially continuous maps while accounting for interspecific biophysical differences. Most models apply a single biomass–height relationship across all types, neglecting that distinct forest compositions require specific allometric considerations to achieve ecological realism and overcome signal saturation.
Moreover, AGB models developed from in situ data alone are prone to overfitting and limited spatial generalizability. Multisource RS can mitigate this issue by providing a richer feature space that captures diverse aspects of forest structure and composition. Machine learning algorithms—including Linear Regression (LR), Support Vector Regression (SVR), K-Nearest Neighbors (KNN), and Random Forest (RF)—have been increasingly adopted to identify predictive features and model AGB across complex landscapes [
25]. However, a key shortfall in many existing studies is the treatment of forests as homogeneous entities, neglecting interspecific differences in biophysical and structural traits [
26,
27]. Forest stands often comprise multiple species with distinct allometric and spectral characteristics, yet most regression models apply a single relationship across all forest types, introducing substantial uncertainty and bias in AGB estimates. Consequently, there is a pressing need for a unified framework that not only harmonizes optical, SAR, and LiDAR data streams but also explicitly incorporates forest-type specific information to enable spatially continuous and ecologically realistic AGB mapping.
While previous research has established the utility of optical, SAR, and LiDAR data for AGB estimation, a persistent shortfall is the treatment of forest landscapes as homogeneous entities during the inversion process. By failing to account for interspecific differences in canopy structure and spectral response, existing models often introduce substantial bias in mixed forest regions. This study moves beyond simple data concatenation by developing a framework that prioritizes ecological realism through forest-type differentiation, thereby mitigating the uncertainties common in generic regional-scale assessments.
Forests are critical terrestrial carbon sinks, yet their capacity for biomass accumulation is increasingly threatened by intensifying fire regimes. Fire disturbances trigger immediate carbon emissions and can fundamentally alter long-term forest successional trajectories, leading to persistent declines in AGB. In boreal ecosystems like Northeast China, these disturbances create complex spatio-temporal patterns of carbon loss that challenge sustainable forest management [
28,
29,
30]. Quantifying the specific impact of fires on AGB is therefore essential for evaluating forest resilience and carbon cycle stability. This study addresses this need by integrating multi-source RS data to analyze fire-induced AGB dynamics, providing a scientific basis for post-fire restoration and regional carbon accounting.
Building upon established remote sensing methodologies, this study evaluates whether the systematic integration of forest-type differentiation can further refine carbon stock monitoring accuracy and extend the sensitivity of multi-sensor signals in high-biomass regions. This research is addresses three primary questions:
- (1)
Temporal Trends in AGB: Changes in AGB across northern forests during 2013–2020 are analyzed to identify trends over time.
- (2)
Regression Algorithm Evaluation: The performance of various regression algorithms is assessed, demonstrating that incorporating forest-type models significantly improves AGB estimation accuracy.
- (3)
Impact of Forest Fires on AGB: The influence of forest fires on AGB is examined using statistical yearbook data and Global Fire Emissions Database Version 4 (GFED4) data. Our results indicate that increased fire frequency and intensity during 2016–2018 substantially reduced the cumulative AGB accumulation, underscoring the vulnerability of forest carbon stocks to disturbance regimes.
2. Study Area and Research Data
2.1. Study Area
The study area is located in the Northeast China region, encompassing a representative section of the cold-temperate humid forest zone. Geographically, it covers an expansive forested landscape with a mean elevation exceeding 1000 m above sea level. The terrain is predominantly gentle, characterized by rolling hills and plains, where over 80% of the slopes exhibit gradients of 15° or less. The local relief generally ranges between 100 and 300 m. The total study area is approximately 85,000 km2. In addition, the area experiences distinct seasonal variations. The mean annual temperature is approximately −5.3 °C, with a relatively short frost-free period averaging 90 days from mid-June to early September. The annual frozen period extends beyond 210 days, and the region is underlain by discontinuous permafrost. Precipitation is concentrated during the summer months, with the rainy season typically occurring in July and August. The region is dominated by forest ecosystems, with a canopy coverage reaching approximately 75%. The forest composition primarily comprises key boreal and temperate types, including Larix gmelinii, Pinus sylvestris and Betula platyphylla, with Populus davidiana as a common secondary species. This diverse forest structure and species distribution make the area an ideal representative site for investigating aboveground biomass dynamics in northern Eurasian forests.
The presence of the Inner Mongolia Daxing’anling Forest Ecosystem National Field Scientific Observation and Research Station within the study area provides critical infrastructural support. The station has facilitated the collection of extensive and long-term in situ measurement datasets, which offer essential ground truth information for calibrating and validating RS-based models. A detailed description of the RS data sources and the corresponding field measurement campaigns used in this study is provided in the following section.
2.2. Multisource RS Data
- (1)
SAR data
This study utilizes C-band SAR data acquired by the Sentinel-1. The primary SAR dataset is derived from the European Space Agency’s Sentinel-1 mission, which was initiated in 2014 and provides systematic, global C-band observations. For the period from 2016 to 2020, we employed Sentinel-1 Interferometric Wide Swath (IW) Ground Range Detected (GRD) products. These data feature a spatial resolution of 10 m, a revisit cycle of 12 days, and are acquired in dual-polarization (VV + VH) mode with a swath width of approximately 250 km, ensuring consistent coverage of the study area in Northeast China (
Table 1). The C-band microwave signals are sensitive to forest structure and moisture, enabling the retrieval of backscatter information from both the canopy and underlying ground surface, which is valuable for forest monitoring applications including biomass estimation.
Specifically, Radarsat-2 Fine Quad-Polarization (FQ18) data were acquired for 2013. These data provide fully polarimetric measurements (HH, HV, VH, VV) with an incidence angle of 37.56°, offering complementary structural information for forest classification and AGB modeling during the initial phase of the study period.
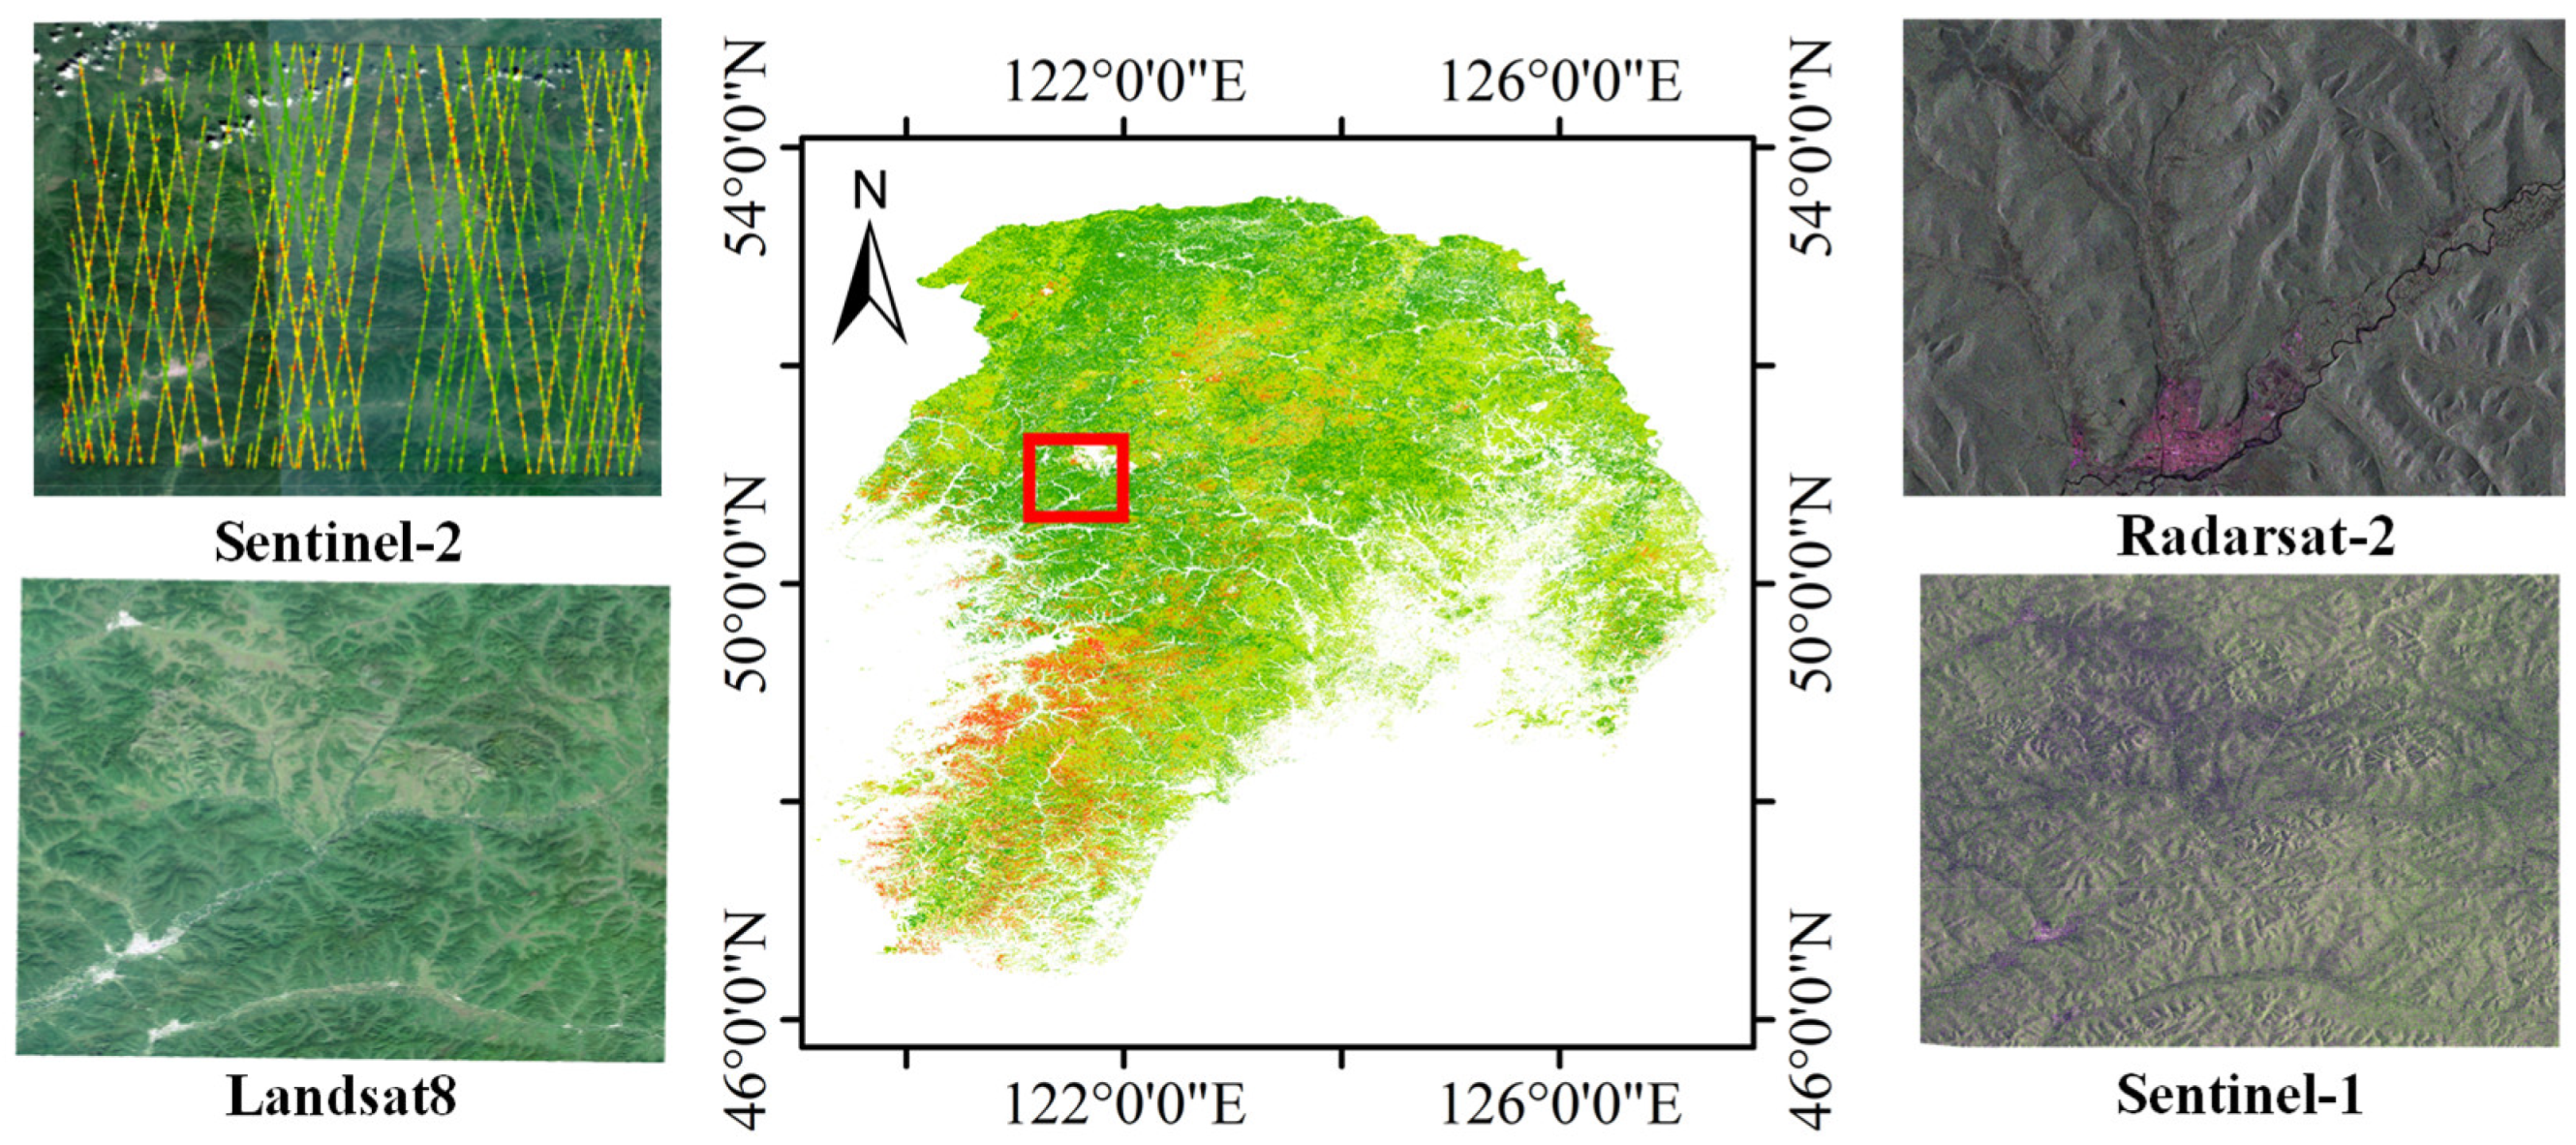
Figure 1 presents representative sample images from both the Sentinel-1 and Radarsat-2 datasets used in this analysis.
- (2)
Optical data
This study employs multi-spectral imagery from the Sentinel-2 and Landsat 8 satellites for AGB modeling. Detailed specifications of the utilized data are provided in
Table 2. For the initial phase of the analysis (2013–2016), Landsat 8 Operational Land Imager (OLI) data were used, as Sentinel-2 imagery was not yet operationally available. These Level-1 terrain-corrected (L1T) scenes were acquired from the USGS EarthExplorer platform. Six spectral bands—spanning the visible blue to shortwave infrared (SWIR) regions—were utilized at their native spatial resolution of 30 m.
Following the launches of Sentinel-2A (2015) and Sentinel-2B (2017), Sentinel-2 Multi-Spectral Instrument (MSI) data were used for the period 2016–2020 (excluding 2015 due to data unavailability over the study area). Sentinel-2 offers enhanced observational capabilities, including a improved revisit frequency (5 days with both satellites) and higher spatial resolution (10–20 m across 13 spectral bands). Its systematic acquisition and compatibility with Sentinel-1 SAR data within the Sentinel Application Platform (SNAP) facilitate integrated analysis. For consistency in the AGB retrieval workflow, spectral bands from Sentinel-2 were selected to closely match the central wavelengths of the corresponding Landsat 8 bands. All optical data were subsequently resampled to a uniform 10 m grid to align with the spatial resolution of the Sentinel-1 SAR imagery.
- (3)
ICESat-2 altimetry data
Canopy height information was derived from the Ice, Cloud, and Land Elevation Satellite-2 (ICESat-2) mission. Specifically, the ATLAS/ICESat-2 L3A Land and Vegetation Height product (ATL08, Version 006) was used to estimate canopy cover and height. Data in HDF5 format were downloaded for the study area from the NASA National Snow and Ice Data Center Distributed Active Archive Center (NSIDC DAAC). To capture the period of maximum foliar development, ATL08 data acquired during the peak growing season (June to August) were selected. This ensures that the derived canopy height metrics correspond to the full-leaf condition, providing a stable and ecologically representative basis for AGB estimation. A total of 80 satellite tracks, comprising 1242 individual segments, were processed (
Table 3). Their spatial distribution over the study area, superimposed on a Sentinel-2 base map, is illustrated in
Figure 1. Within the core experimental area highlighted in
Figure 1, 46 tracks yielding over 100,000 geolocated photon measurements were extracted. The nominal across-track spacing is approximately 2.76 km, with an along-track sampling distance of 50 m. To generate a continuous canopy height field, the point-based ATL08 height estimates were aggregated using a nearest-neighbor interpolation method onto a regular 500 m grid.
2.3. In Situ Measurement
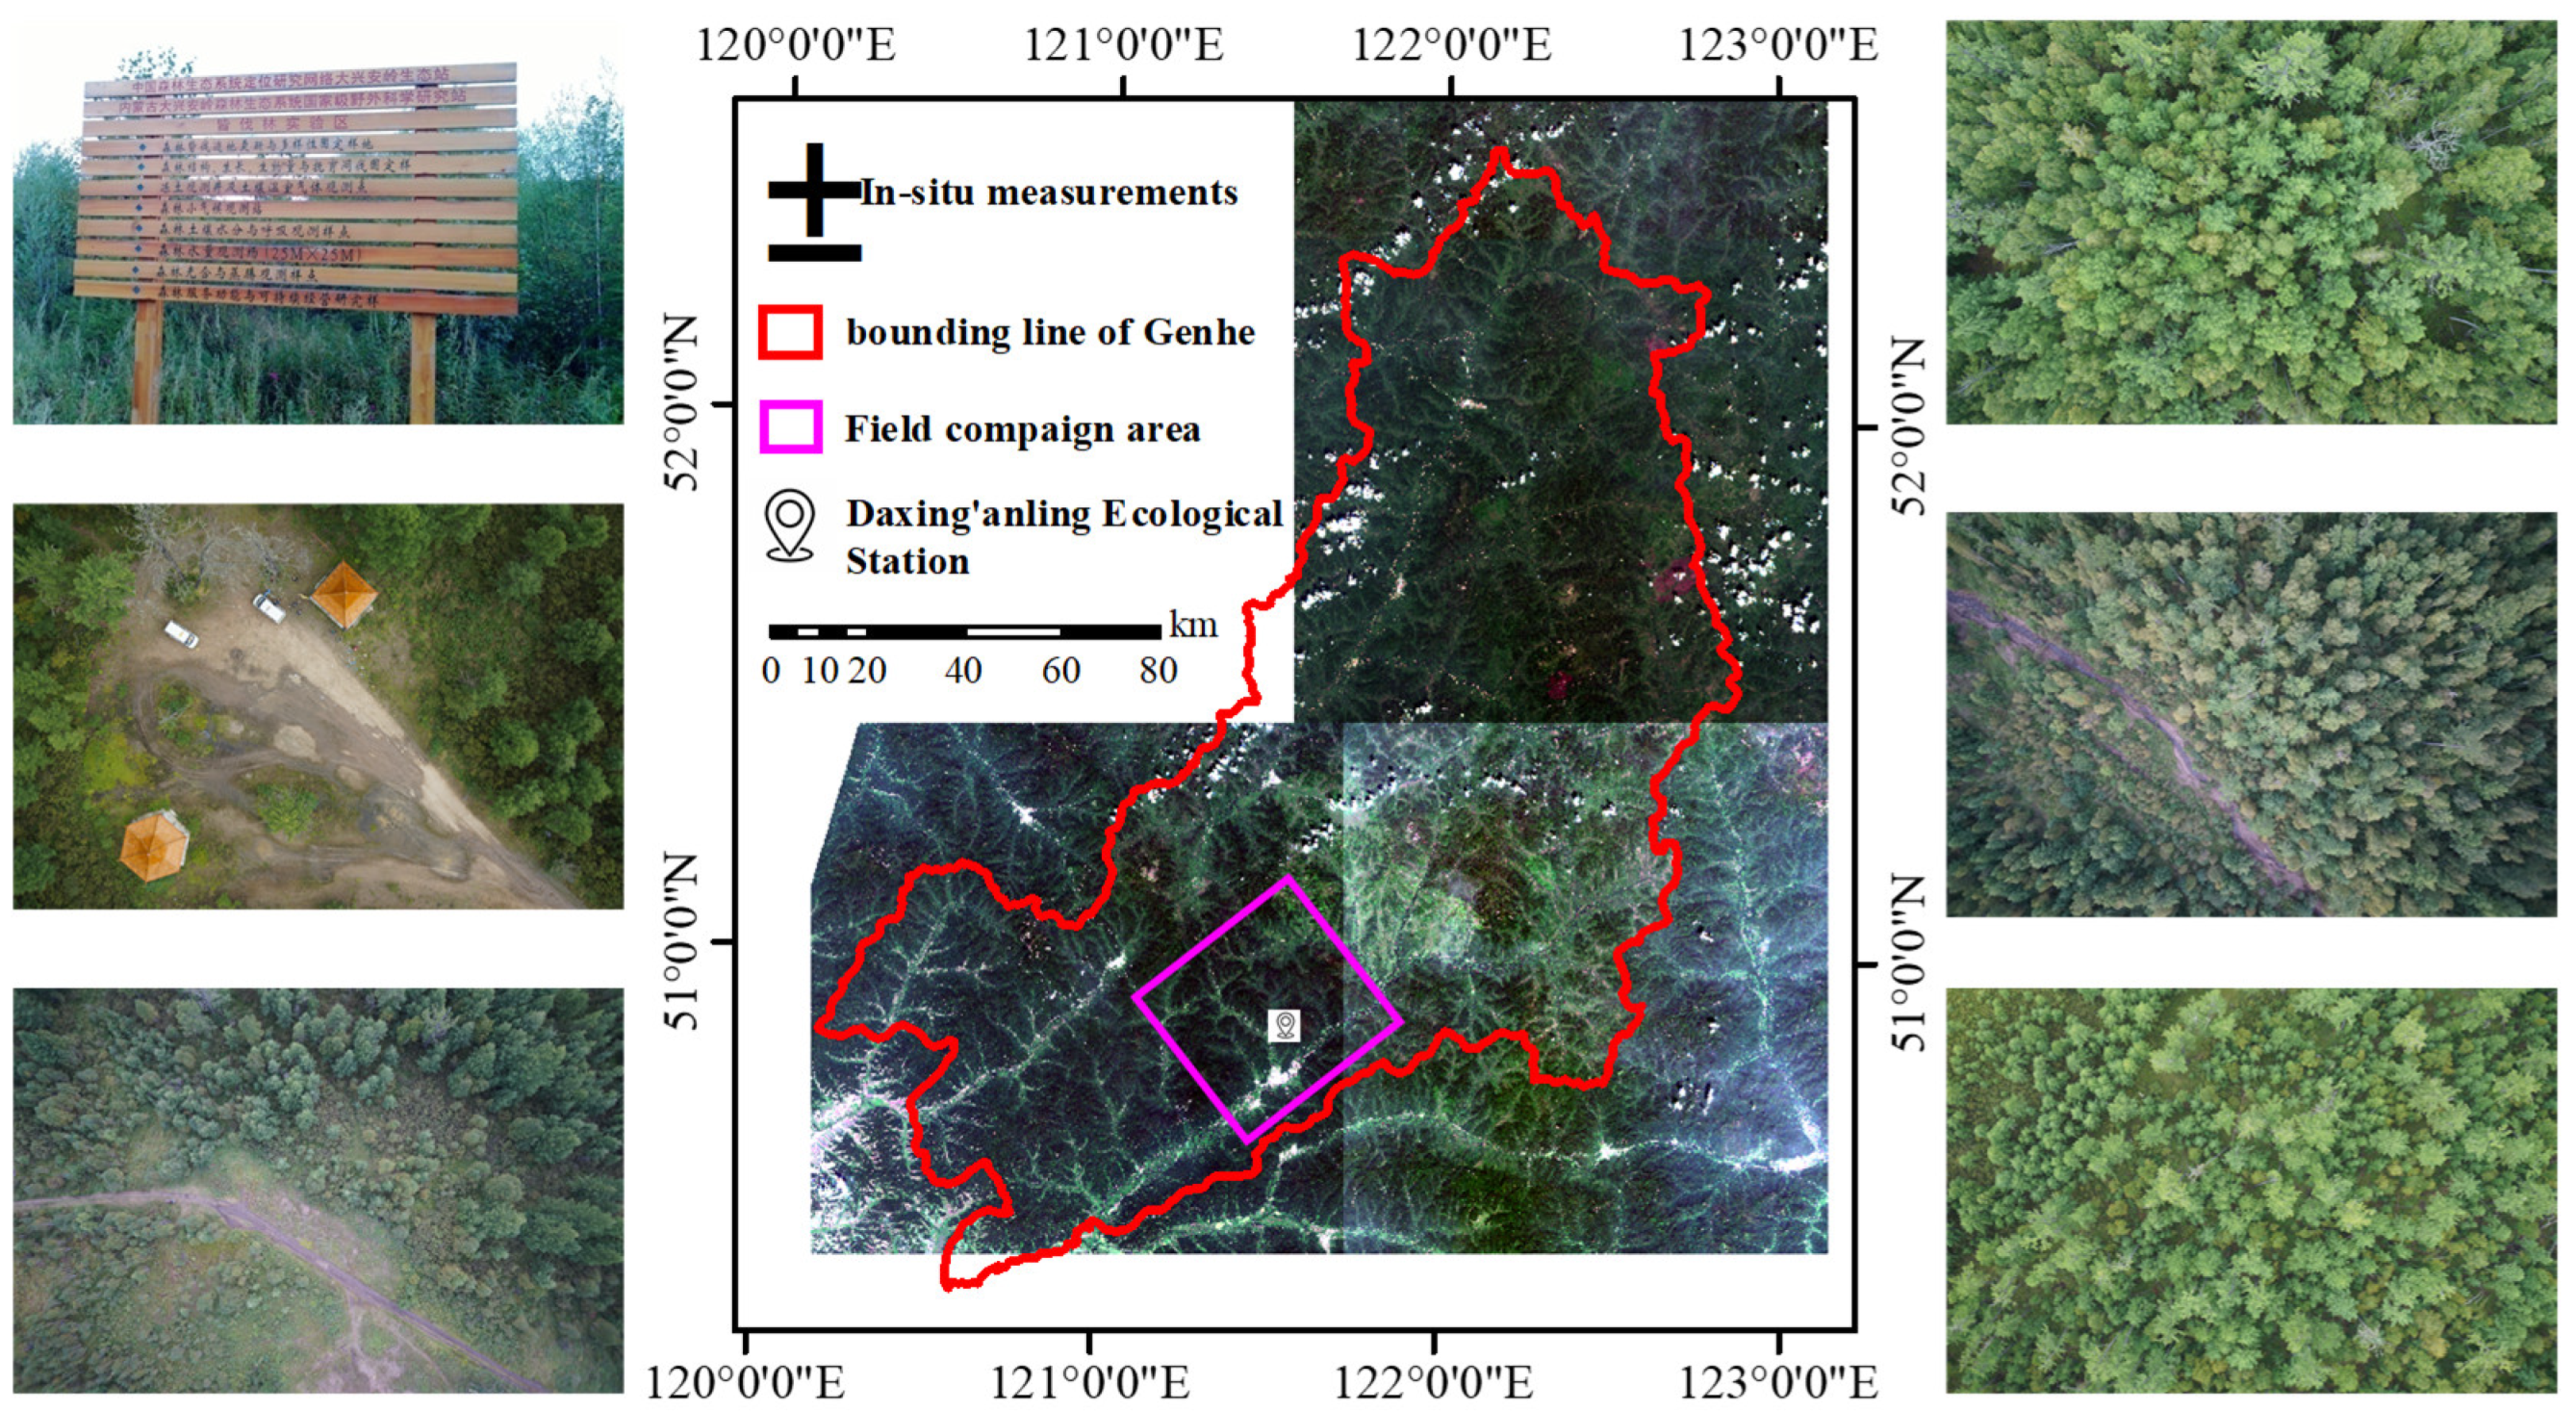
In situ measurements were conducted during the peak growing season (August) of 2013 and 2016 within the forested landscape surrounding the Daxing’anling Forest Ecosystem National Observation and Research Station, located near Genhe in Inner Mongolia, China (
Figure 2). The station is situated in the northern Daxing’anling Mountains, a representative cold-temperate forest zone, approximately 15 km from Genhe at an average elevation of 800–1000 m. As one of China’s primary long-termonitoring sites for boreal forest ecosystems, it provides an established precedure for systematic ground data collection. Across the two campaigns, a total of 40 permanent sample plots were established, each configured as a 45 m × 45 m square. To ensure rigorous sampling and spatial representativeness, each main plot was subdivided into nine non-overlapping 15 m × 15 m subplots, resulting in 360 geo-referenced measurement points for model calibration and validation.
At each plot center, precise geographic coordinates were recorded using a high-accuracy Global Positioning System (GPS) receiver (Leica GS10: Leica Geosystems AG, Heerbrugg, Switzerland). Within every subplot, all trees with a diameter at breast height (DBH) exceeding 1.2 cm were systematically inventoried. For each individual tree, forest type, key structural parameters—including DBH (measured using a diameter tape) and tree height (obtained using a laser hypsometer (Laser Ace 3D: Leica Geosystems AG, Heerbrugg, Switzerland))—were documented. These measurements form the basis for calculating individual tree biomass via forest-type specific allometric equations, which were then aggregated to derive plot-level (AGB). Prior to analysis, each 45 m × 45 m plot was assigned a forest type classification based on compositional dominance. If coniferous or broadleaf types accounted for more than 80% of the total basal area within a plot, the plot was classified as pure coniferous or pure broadleaf forest, respectively. Plots not meeting this dominance threshold were classified as mixed forest. This classification scheme supports the development of forest-type specific AGB retrieval models outlined in the methodology.
3. Method
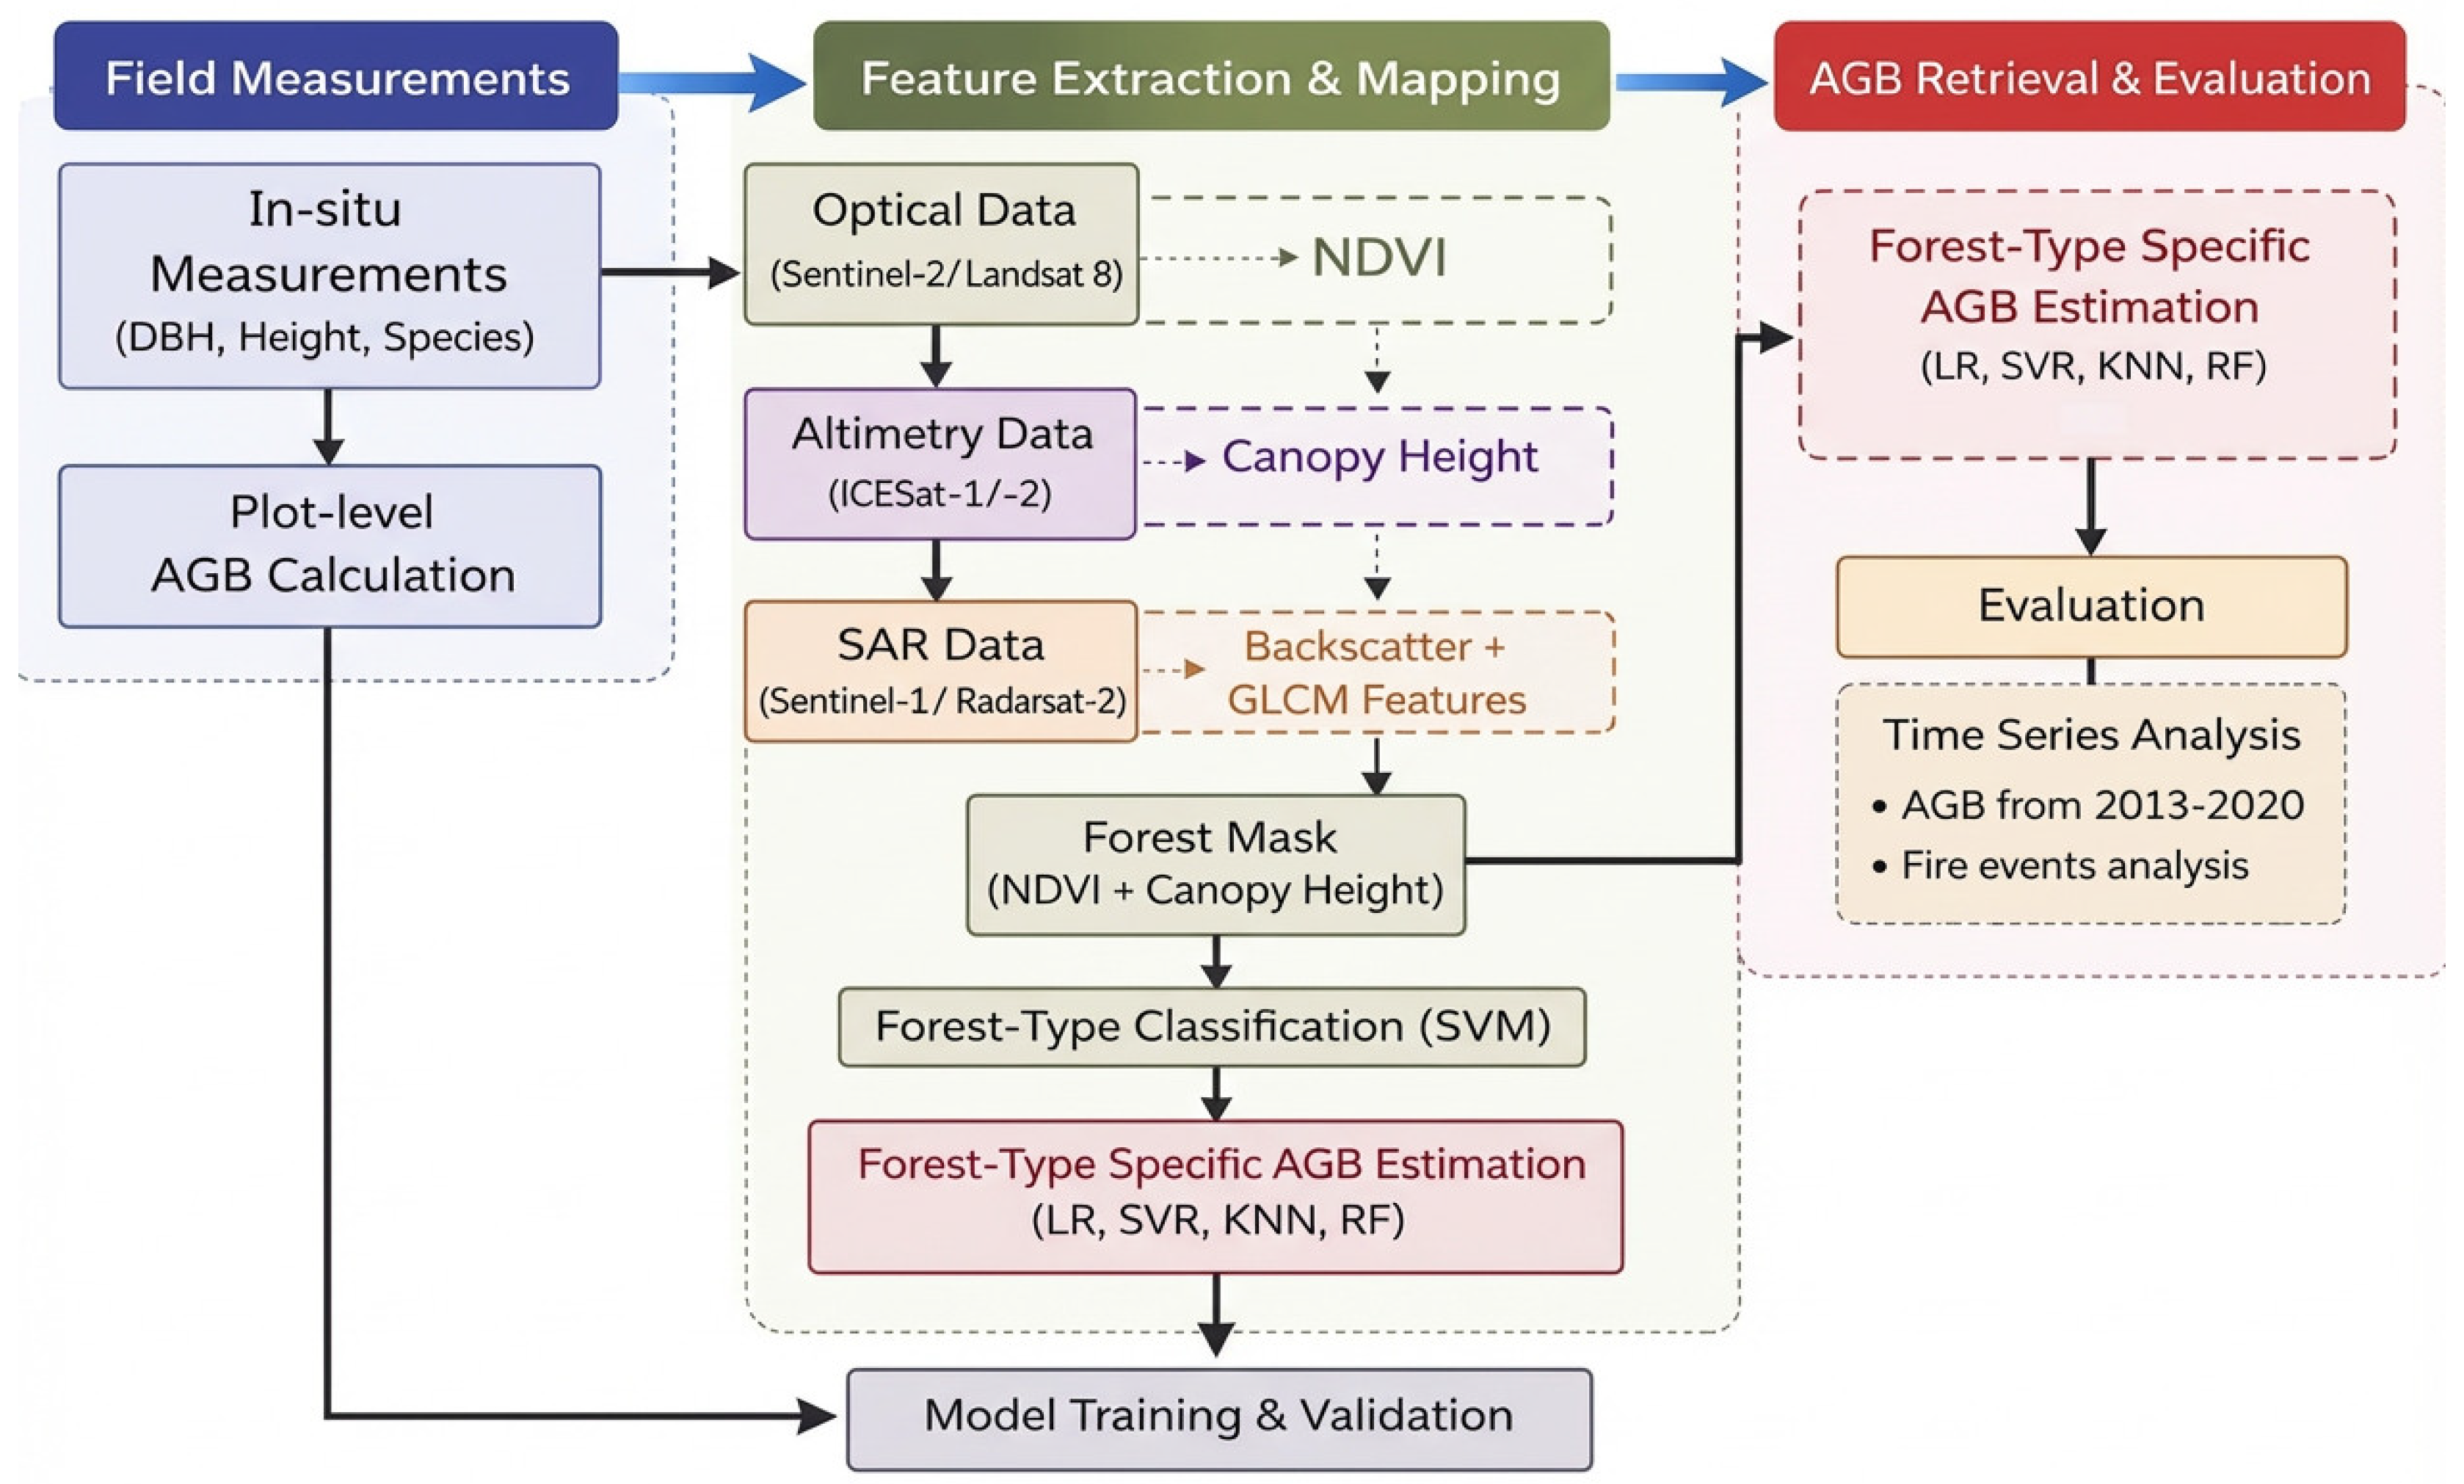
The framework of AGB estimation in this study is shown in
Figure 3. We propose a three-step-based method by using the fusion of Optical, SAR and Altimetry data including forest extraction using optical and Altimetry data, forest-type classification from SAR imagery, and regression-based method using the above mentioned dataset for AGB estimation at 1 km grid scale. First, vegetated areas are delineated using NDVI from optical imagery, and forests with an average diameter at breast height (DBH) > 1.2 m are identified using a Canopy Height Model derived from altimetry data. A Support Vector Machine classifier with a Radial Basis Function (RBF) kernel is then applied to separate coniferous and broadleaf forests; regions where neither type exceeds 80% dominance are classified as mixed forest. Species-specific Support Vector Regression models are subsequently trained and applied to estimate AGB, with final biomass computed as the sum of contributions from each forest type. The detailed procedure of the algorithm is given in the following sections.
3.1. NDVI for Extracting Forest
The NDVI) is a widely established metric for quantifying vegetation status and vigor, leveraging the differential reflectance of plant canopies in the red and near-infrared spectral regions [
31]. Vegetation typically exhibits strong chlorophyll absorption in the red band and high reflectance in the near-infrared band, making NDVI a robust and sensitive indicator for distinguishing vegetated from non-vegetated surfaces. In this study, NDVI was employed to mask vegetated areas prior to forest biomass estimation. It was calculated using surface reflectance values from the optical satellite imagery with the standard formula:
where NIR and RED represent the surface reflectance in the near-infrared and red bands, respectively [
32,
33]. As described in
Section 2, all the optical data used in this study were acquired during the peak foliar period (summer months) when vegetation NDVI values are characteristically high, maximizing the spectral contrast with non-vegetated features (e.g., soil, water, built-up areas). A threshold value of NDVI > 0.55 was applied to classify a pixel as vegetated [
34,
35]. To mitigate biases between different sensors, we utilized Level-1 terrain-corrected (L1T) products for Landsat 8 and Top-of-Atmosphere/Bottom-of-Atmosphere products for Sentinel-2. We performed cross-calibration by selecting Sentinel-2 spectral bands that closely match the central wavelengths of Landsat 8. All optical data were resampled to a uniform 10 m grid.
To specifically isolate forest areas for aboveground biomass (AGB) retrieval, further discrimination was necessary to exclude other high-NDVI land cover types such as grassland and cropland. This was achieved by integrating canopy height information. Pixels initially identified as vegetation were subsequently filtered using a canopy height model derived from LiDAR or ICESat-1/2 altimetry data. Only vegetated pixels with a canopy height exceeding 1.2 m were retained and classified as forest, ensuring the analysis focused exclusively on tree-dominated ecosystems.
3.2. Forest Type Classification
To support forest-type specific AGB modeling, forests within the study area were classified into two dominant functional types: coniferous and broadleaf. This distinction is critical because the spectral, backscatter, and structural characteristics of these groups differ substantially, influencing their relationship with remotely sensed signals. For instance, broadleaf forests typically exhibit higher canopy density and near-infrared reflectance during the leaf-on season, coupled with lower radar penetration depth. These traits undergo marked seasonal variation, especially during leaf-off periods, which can indirectly affect AGB retrieval stability. In contrast, coniferous forests generally demonstrate more stable backscatter and reflectance properties throughout the year due to their perennial canopy. Conventional AGB inversion models that do not account for such interspecific differences often introduce significant estimation bias. Therefore, in this study, forest pixels identified via NDVI and canopy height thresholds were first classified into different types (coniferous and broadleaf). Forest-type specific regression models were then developed to relate RS metrics to AGB, with the total forest AGB computed as the sum of the estimates derived separately for coniferous and broadleaf fractions.
Forest-type classification was performed using a Support Vector Machine (SVM) classifier with a RBF kernel. The classifier was trained on a set of discriminative features derived from multi-source RS data to capture the characteristic differences between coniferous and broadleaf forests. The feature set included the following: (1) surface reflectance from optical bands (Sentinel-2/Landsat 8); (2) backscatter coefficients (VV, VH) from SAR data (Sentinel-1/Radarsat-2); and (3) textural metrics calculated from a Gray-Level Co-occurrence Matrix (GLCM). For the transition from Radarsat-2 (2013) to Sentinel-1 (2016–2020), we converted all data to backscatter coefficient in dB. We applied rigorous radiometric terrain correction and speckle filtering to ensure that structural features remained comparable across different acquisition geometries. The GLCM quantifies the spatial relationship of pixel intensities by calculating the frequency of specific gray-level pairs occurring at a given distance and orientation within an image. From the GLCM, six statistical textural features were extracted: mean, standard deviation, energy, contrast, homogeneity, and entropy. Their respective calculations are provided in Equations (2)–(7).
where
is the second-order statistical probability between two gray level
and
is mean value and
is the corresponding standard deviation of different cells. the window size is 16, the separated distance
is 8, the number of steps is 16, and the gray level
is 32 [
36].
The SVM model was then optimized by minimizing the loss function (epsilon-insensitive loss) and maximizing the coefficient of determination (R2) during training, using the validation subset. The same optimized SVM model, when augmented with canopy height metrics from ICESat-2, was subsequently employed to aid in the final AGB regression modeling, ensuring a consistent methodological basis between the classification and retrieval stages.
3.3. Forest AGB Estimation
The AGB retrieval was performed using a machine learning approach that integrated multi-source RS predictors. These predictors included the following: spectral reflectance and the NDVI derived from optical imagery (Sentinel-2/Landsat 8), backscatter coefficients from SAR data (Sentinel-1/Radarsat-2), and a suite of textural features calculated from the GLCM applied to both optical and SAR datasets, as defined in Equations (2)–(7). All predictor variables were spatially resampled and aligned to a consistent 1 km grid, which corresponded to the resolution of the aggregated ICESat-2 canopy height data used as an auxiliary input.
To account for forest compositional heterogeneity, a forest-type aware modeling strategy was implemented. For each 1 km grid cell, the fractional coverage of the dominant type (coniferous or broadleaf) was calculated based on the prior forest-type classification map. If the dominance of the majority types was less than 80%, the grid cell was treated as a mixed forest. In such cases, two separate regression models—one for coniferous and one for broadleaf components—were applied using their respective spectral and structural features within the cell. The total AGB for the mixed grid was then computed as the sum of the outputs from these two forest-types specific models. Grids where one type exceeded the 80% dominance threshold were modeled using a single regression model corresponding to that pure forest type.
Four distinct machine learning regression algorithms were evaluated to identify the optimal approach for AGB estimation: LR, SVR, KNN, and RF. For the LR model, a stepwise selection procedure was employed to construct a parsimonious linear relationship between AGB and the RS predictors [
37,
38]. Variables were iteratively added or removed based on the Akaike Information Criterion (AIC) to identify the most effective feature subset. The SVR model was optimized via a grid search to determine the best combination of hyperparameters (e.g., regularization parameter C and kernel coefficient gamma); details of feature extraction and model construction are provided in
Section 3.2. The KNN algorithm, which performs a local non-linear fit, estimated AGB for a target pixel as the distance-weighted average of the AGB values from its K nearest neighbors in the feature space. The RF algorithm, an ensemble learning method, operated by constructing multiple decision trees via bootstrap sampling of the training data (i.e., bagging) and aggregating their predictions to produce a robust final estimate.
The performance of these four algorithms was systematically validated during the AGB retrieval scheme. Specifically, 80% of the field-measured plot-level AGB data were randomly selected for model training, while the remaining 20% were reserved for independent validation. The optimal model, determined by the highest predictive accuracy on the validation set, was subsequently applied to generate wall-to-wall AGB maps for the entire study area spanning the period from 2013 to 2020. We use the machine learning algorithm for AGB retrieval by integration the following parameters including reflectance from Optical data, Backscatter coefficient from SAR data, NDVI from optical data, GLCM from the two different types of data using the equation given in (2)–(7), these input data will be resampled to 1 km grid matched with ICESat-2 canopy height. In addition, we also calculate the mixing index of the forest within 1 km grid, if the coverage of the majority types within the grid is less than 0.8, we will construct two regression models independently, and the final AGB is the sum of the two forest types. Otherwise, a single regression model is conducted to treat the grid as a pure area with only one type.
3.4. Accuracy Assessment
The predictive performance of each regression model was rigorously evaluated using the remian 20% subset of field-measured plots, which were not involved in the model training process. Two standard statistical metrics—the coefficient of determination (R2) and the root mean square error (RMSE, in Mg/ha)—were employed to quantify estimation accuracy and to identify the optimal model for generating the multi-temporal AGB series.
The R
2 was calculated to assess the proportion of variance in the measured AGB explained by the model. The RMSE was computed to evaluate the average magnitude of the estimation errors, providing an absolute measure of model precision. The formulas for these metrics are given in Equations (8) and (9).
where
and
represent the estimated AGB, observed AGB, and the mean of the observed AGB, respectively. Here, N is the number of the training sample.
4. Results and Analysis
4.1. AGB Estimation Result and Validation
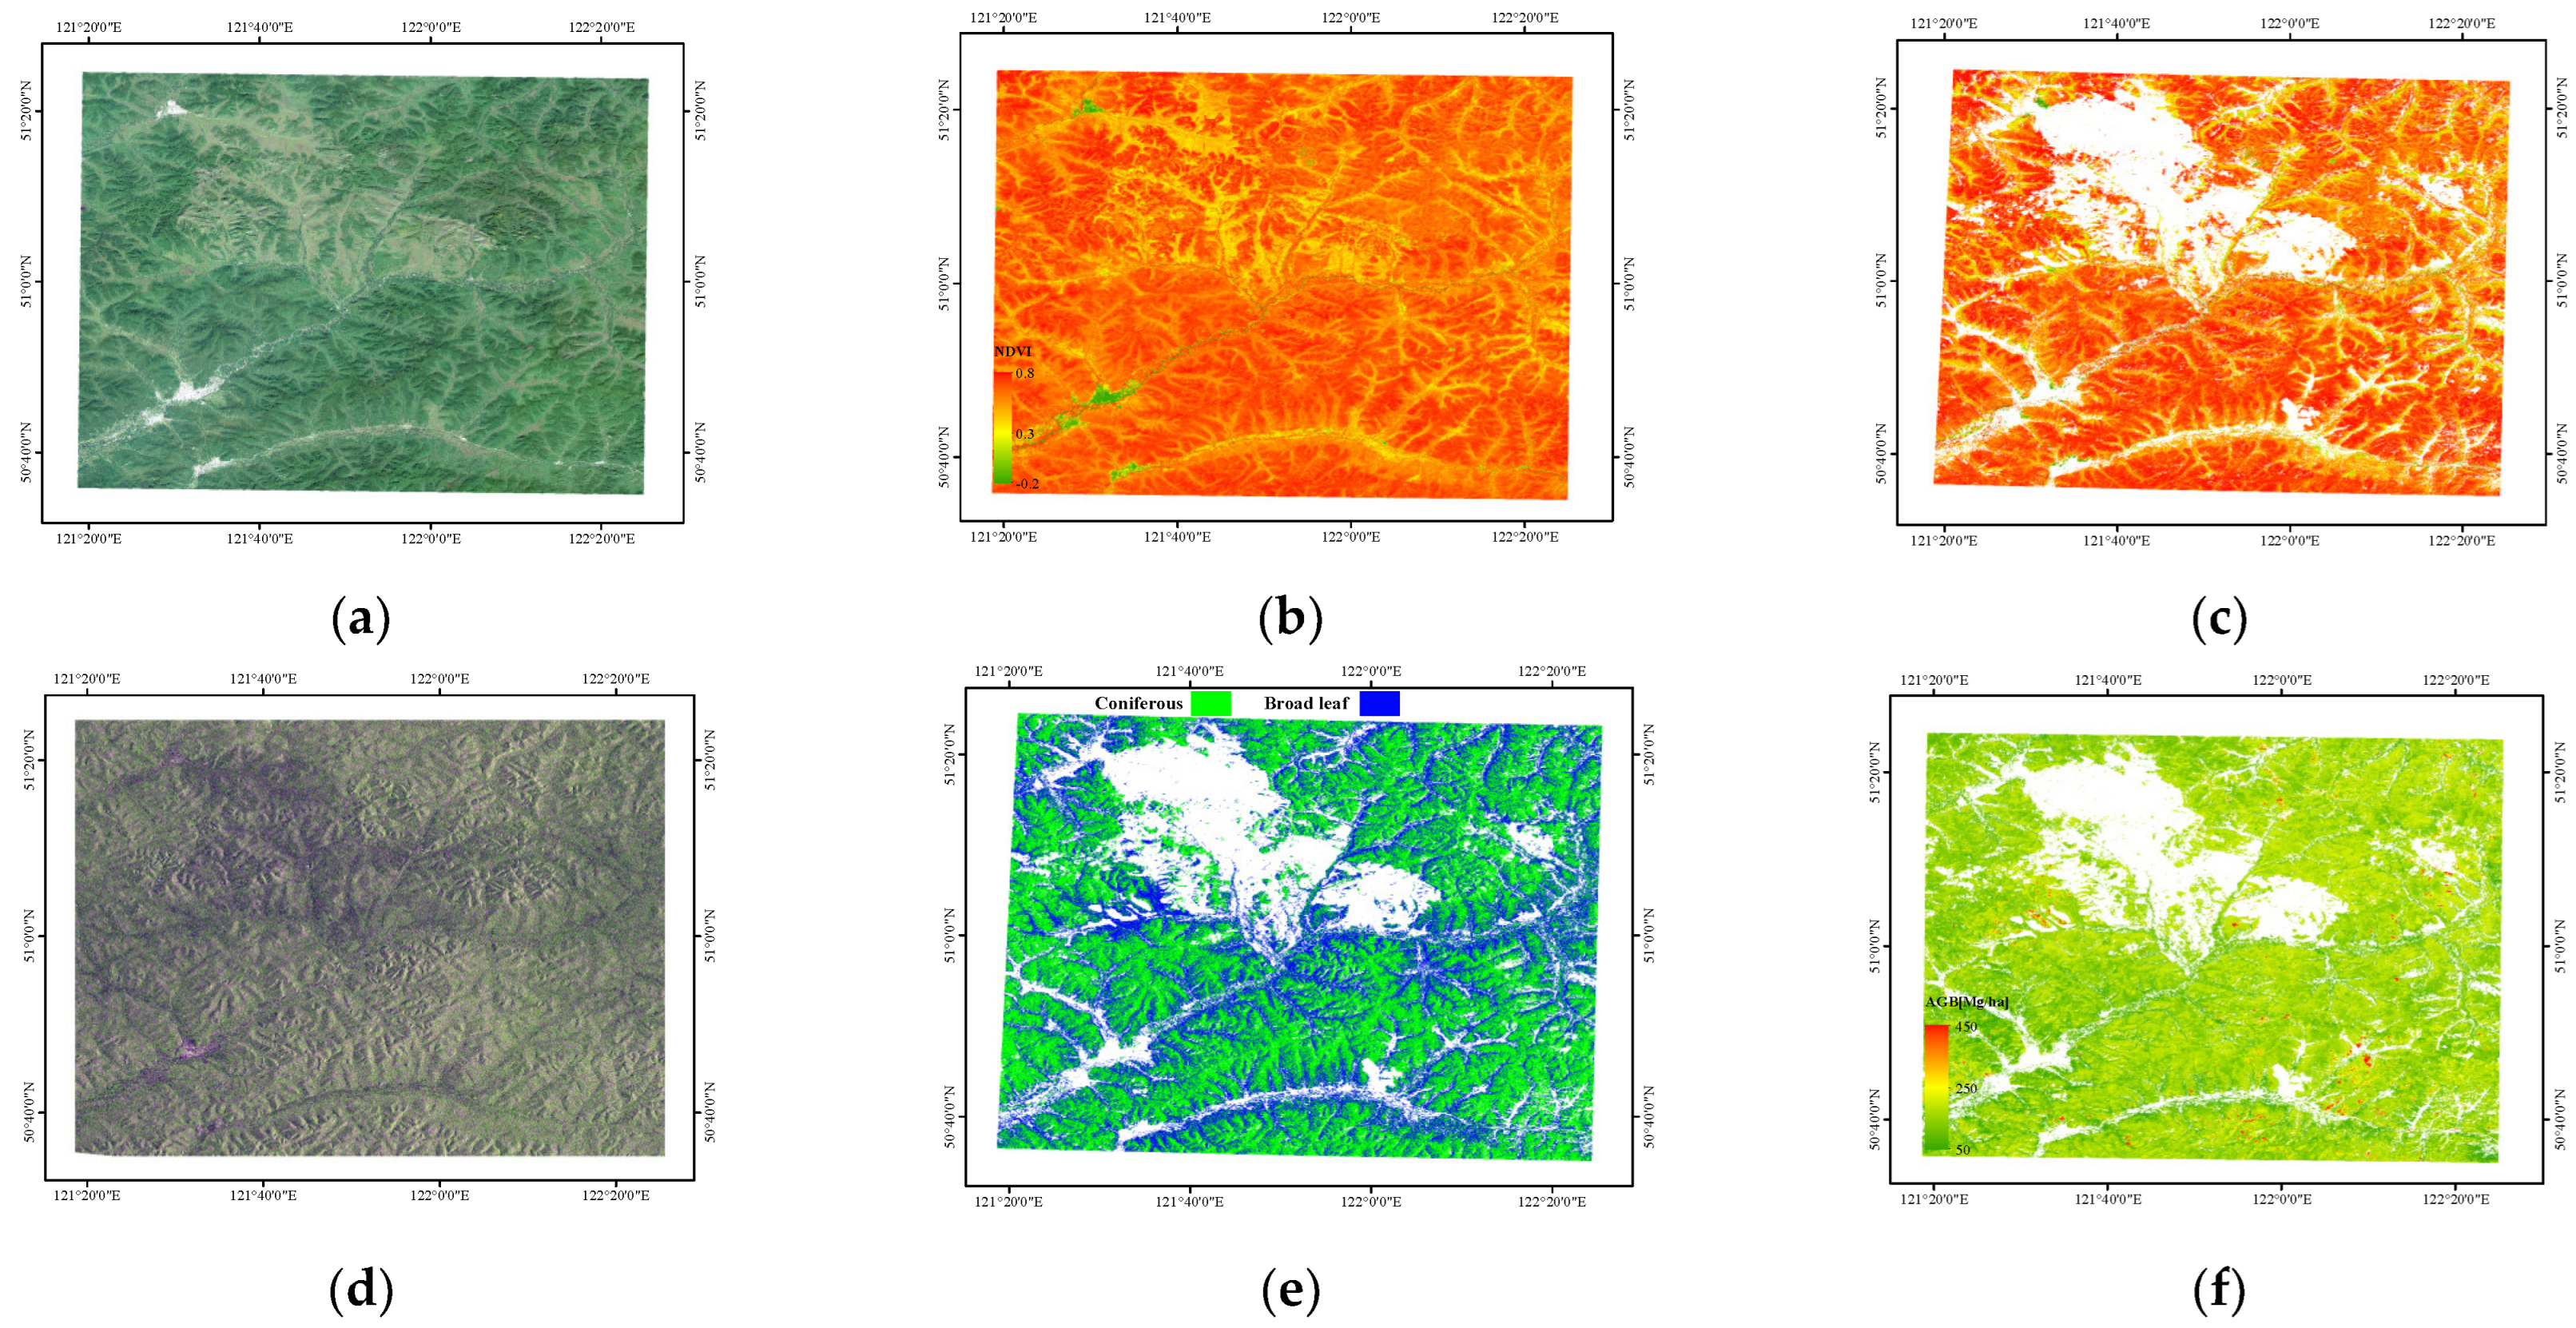
A sample AGB estimation result from 2016 is presented for an area located approximately 3.6 km northwest of the Daxing’anling Ecological Station, see in
Figure 4. Both RS data and field measurements were acquired in August, corresponding to the period of full foliar development. After excluding non-forest vegetation (grassland and shrubs) using a canopy height threshold, the forest cover within this region was 83.27%. Field records indicate that the forest in the sample area is dominated by two species: Larix gmelinii (coniferous) and Betula platyphylla (broadleaf). Larix gmelinii represents the majority species, accounting for 71.31% of the forested area, whereas Betula platyphylla is primarily distributed along roadsides at relatively lower elevations. The AGB estimated using the SVR method was 167.76 Mg/ha, which is slightly lower than the field-measured value of 174.23 Mg/ha, corresponding to a mean relative deviation of 9.46% and a RMSE of 16.47 Mg/ha. The coefficient of determination (R
2) between estimated and measured AGB was 0.79, indicating good agreement. In terms of forest-type specific contributions, the mean AGB for coniferous forests was 107.36 Mg/ha (64% of the total estimated AGB), while broadleaf forests accounted for 60.4 Mg/ha.
Areas with AGB exceeding 300 mg/ha were predominantly located in the southeastern part of the study region, where broadleaf species accounted for 32.75% of the forest cover. According to the CHM and corresponding field measurements, the mean tree height in these high-biomass areas was 12.07 m, which was greater than that observed in the central of 10.32 m and northeastern 11.26 m zones. The spatial variation in AGB was therefore primarily attributable to differences in tree height and the proportion of broadleaf type.
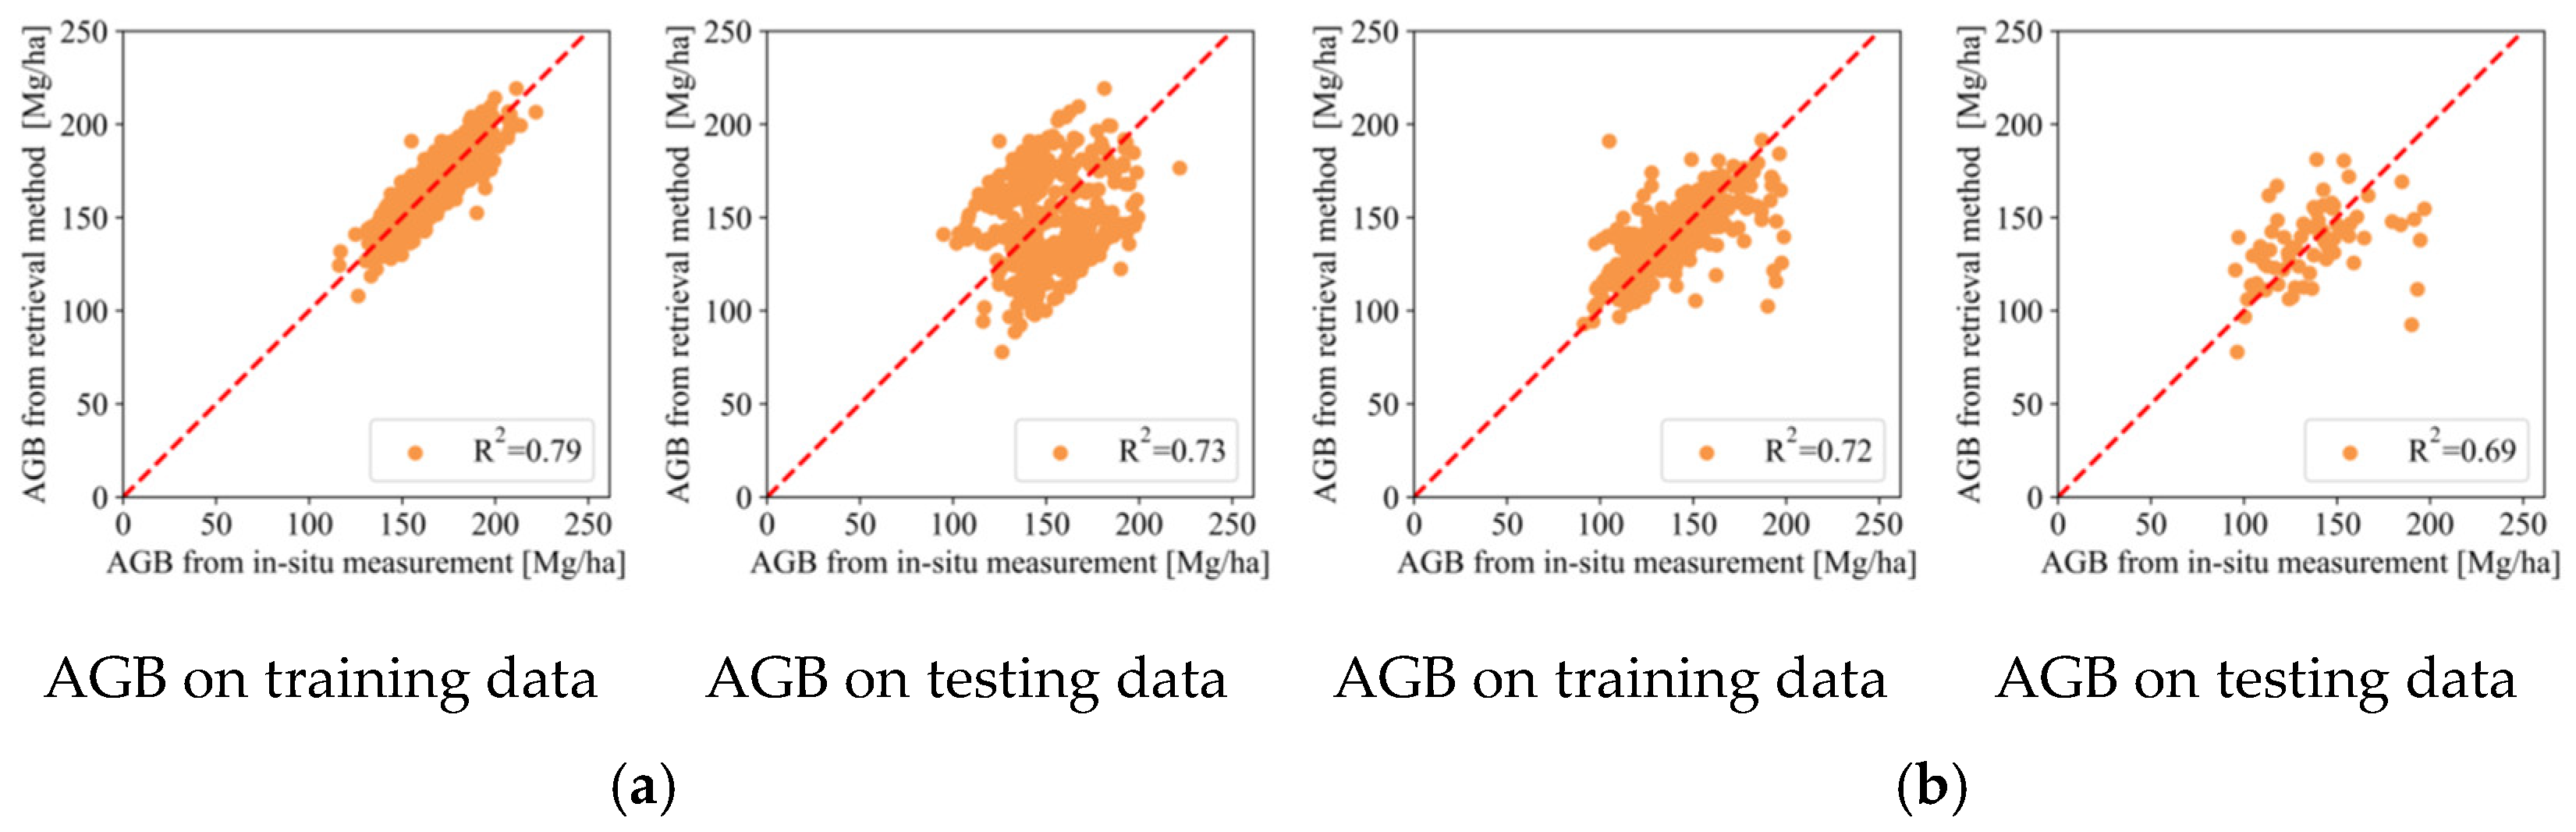
The performance of the forest-type specific AGB retrieval method was evaluated against a conventional non-classified approach using both training and testing datasets (
Figure 5,
Table 4). The forest-type specific method, implemented with SVR, yielded an AGB estimate of 184.62 Mg/ha on the training data, with a R
2 of 0.79 relative to field measurements. When applied to the independent testing data, it produced an AGB of 171.32 Mg/ha with the R
2 of 0.73. In contrast, the non-classified SVR model obtained an AGB of 167.44 Mg/ha and the R
2 of 0.72 on the training data. Its performance declined on the testing data, where the R
2 fell below 0.7. The results in
Table 4 confirm that treating the forest as a single entity ignores the distinct backscatter and spectral signatures of boreal species, leading to a 14% higher RMSE compared to our forest-type specific approach. This step is particularly vital in mixed forests where AGB is computed as the sum of disparate type-specific contributions, thereby providing a more ecologically realistic representation of carbon storage.
4.2. Comparison of Different Methods
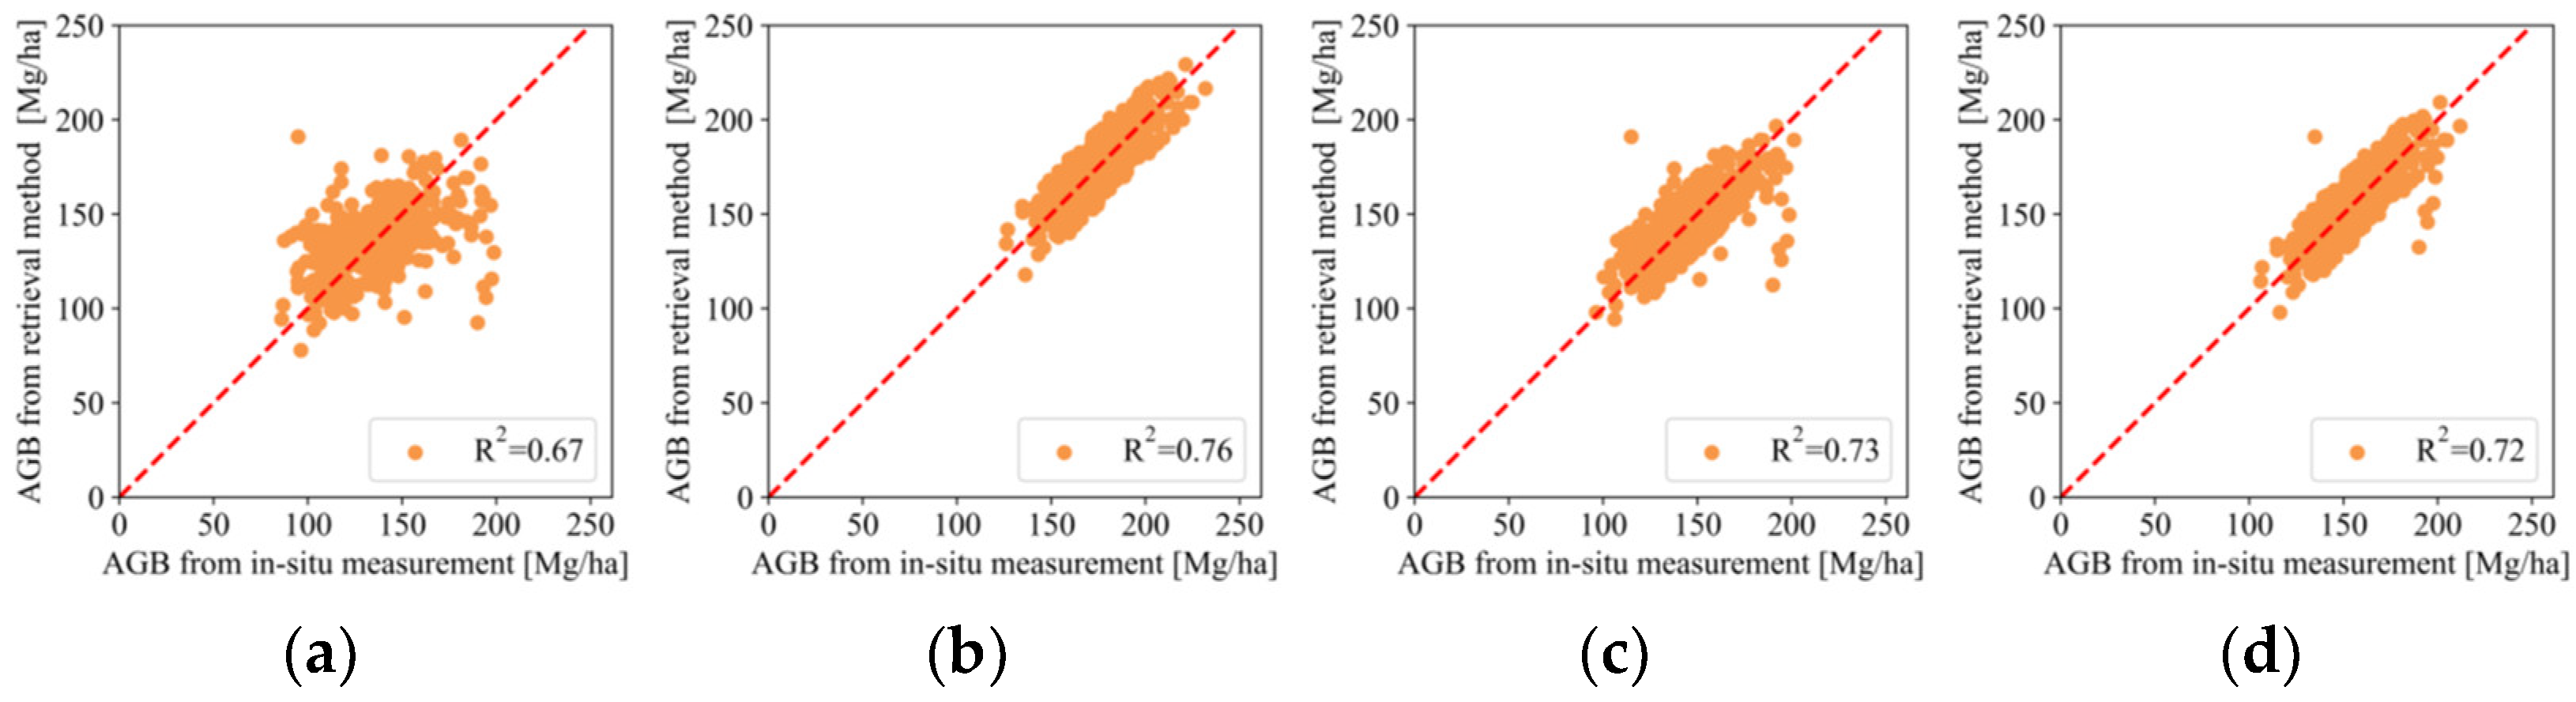
To identify the optimal model for AGB retrieval and subsequent time-series analysis, four regression algorithms—LR, SVR, KNN, and RF—were evaluated using the independent test dataset. The comparative results are presented in
Figure 6 and
Table 5. With the exception of LR, the other three models achieved a coefficient of determination (R
2) greater than 0.7. The SVR algorithm delivered the best performance, yielding an AGB estimate of 210.71 Mg/ha with a RMSE of 18.48 Mg/ha. The RF method produced a comparable AGB estimate to SVR but exhibited a higher RMSE, indicating greater estimation uncertainty. The KNN algorithm tended to overestimate AGB, although its RMSE was lower than that of RF. The superior performance of SVR suggests its higher robustness against potential overfitting and its efficacy in capturing the complex, non-linear relationships inherent in the multisource feature space, compared to the ensemble-based RF which might be more sensitive to feature noise. Consequently, the SVR model was selected for generating the final AGB maps and conducting the time-series analysis.
4.3. Uncertainty and Error Propagation
To demonstrate that the transitions from Radarsat-2 to Sentinel-1 and Landsat-8 to Sentinel-2 did not introduce artificial biomass trends, we have added a quantitative cross-calibration assessment, (
Table 6). For the 2016 overlap period, we performed a direct pixel-to-pixel comparison of backscatter (
) and NDVI values across the study area. The results show high radiometric alignment, with a coefficient of determination (R
2) of 0.88 for SAR backscatter and 0.92 for optical NDVI after cross-calibration.
In addition, the accuracy of regional AGB retrieval is inherently influenced by the propagation of errors from multiple stages, ranging from field-level measurements to the final machine learning inversion. In this study, we performed a systematic uncertainty analysis to quantify the impact of different error sources on AGB estimates (
Table 7).
We implemented an analytical error propagation approach based on a first-order Taylor series expansion. Each stage of the retrieval pipeline, field data collection, multi-sensor fusion, and machine learning inversion, was treated as an independent source of variance. The total uncertainty in the 1 km AGB product
was calculated as the square root of the sum of the squares of individual relative errors:
where
accounts for both individual tree measurement error (2.35 ± 0.87%) and the variability introduced by species-specific allometric equations (6.42 ± 1.27%). While individual tree measurements (DBH and height) are highly precise with an error of less than 3%, the inherent variability in biomass-to-volume ratios across different forest stands introduces a moderate uncertainty buffer. Furthermore, the transition from discrete sample plots to a wall-to-wall 1 km continuous grid contributes a scaling error of 3.88 ± 1.03%. This is primarily attributed to the spatial mismatch between small-scale plot observations and the aggregated signal of medium-resolution satellite pixels, a challenge we mitigated by using a nested sampling design that enhances the spatial representativeness of our training data.
Beyond the systematic errors, we further investigated the residual distribution to assess the model’s performance across different biomass levels. The inversion error of the SVR model (9.46 ± 2.03%) represents the final stage of uncertainty, which encompasses the limitations of the machine learning algorithm in capturing the extreme ends of the biomass spectrum. Specifically, a slight underestimation was observed in high-biomass regions (>200 Mg/ha), a phenomenon commonly linked to the saturation effect of SAR backscatter and optical vegetation indices. However, by explicitly incorporating forest-type stratification and ICESat-2 vertical structural parameters, we successfully mitigated the “homogeneity bias” prevalent in non-stratified models. This structural integration provided a critical constraint on the SVR model, reducing the final RMSE from 24.57 Mg/ha to 21.05 Mg/ha.
Furthermore, our uncertainty analysis explicitly incorporates a “Radiometric Consistency” error of 4.22 ± 0.64%, which encompasses the residual bias between sensors. Because this sensor-induced variance is significantly lower than the observed 20% regional biomass increase and the 11.27% sub-regional decline. The transition from Radarsat-2 (used in 2013) to Sentinel-1 (2016–2020) was managed by converting all SAR data to a common backscatter coefficient (dB) and applying rigorous radiometric terrain correction to ensure structural comparability across geometries. Similarly, Sentinel-2 spectral bands were selected to match the central wavelengths of Landsat-8. we are confident that the reported trajectories reflect real biophysical changes rather than technical artifacts.
Finally, the spatial heterogeneity of uncertainty was analyzed. Higher relative errors were primarily concentrated in forest edges and areas with complex topography, where terrain-induced geometric distortion in SAR data and shadowing effects in optical imagery are more pronounced. In contrast, the interior of the coniferous and broadleaf stands exhibited high stability, with mean relative deviations consistently below 8%. This comprehensive and quantified error evaluation provides a transparent assessment of our product’s reliability, demonstrating that the proposed multi-source fusion framework is robust enough for long-term carbon monitoring and regional-scale ecological assessments in complex boreal landscapes.
4.4. Time Series of AGB in the North East of China
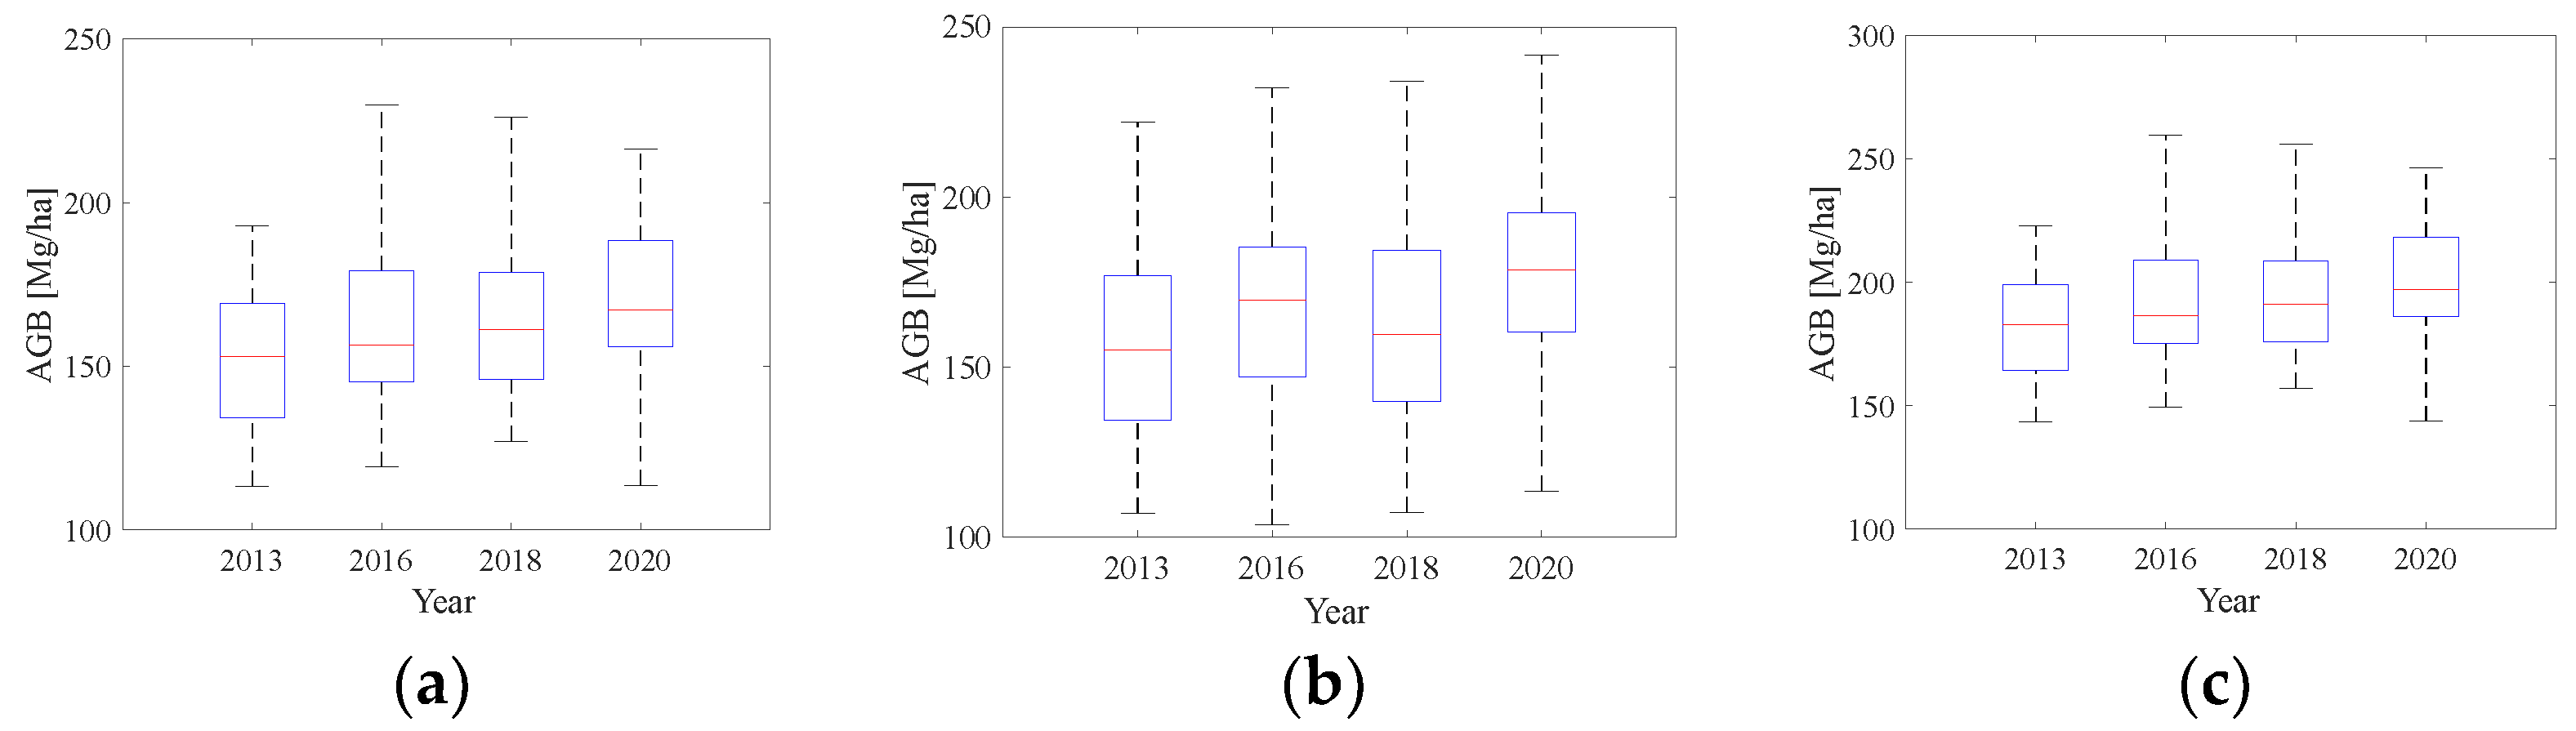
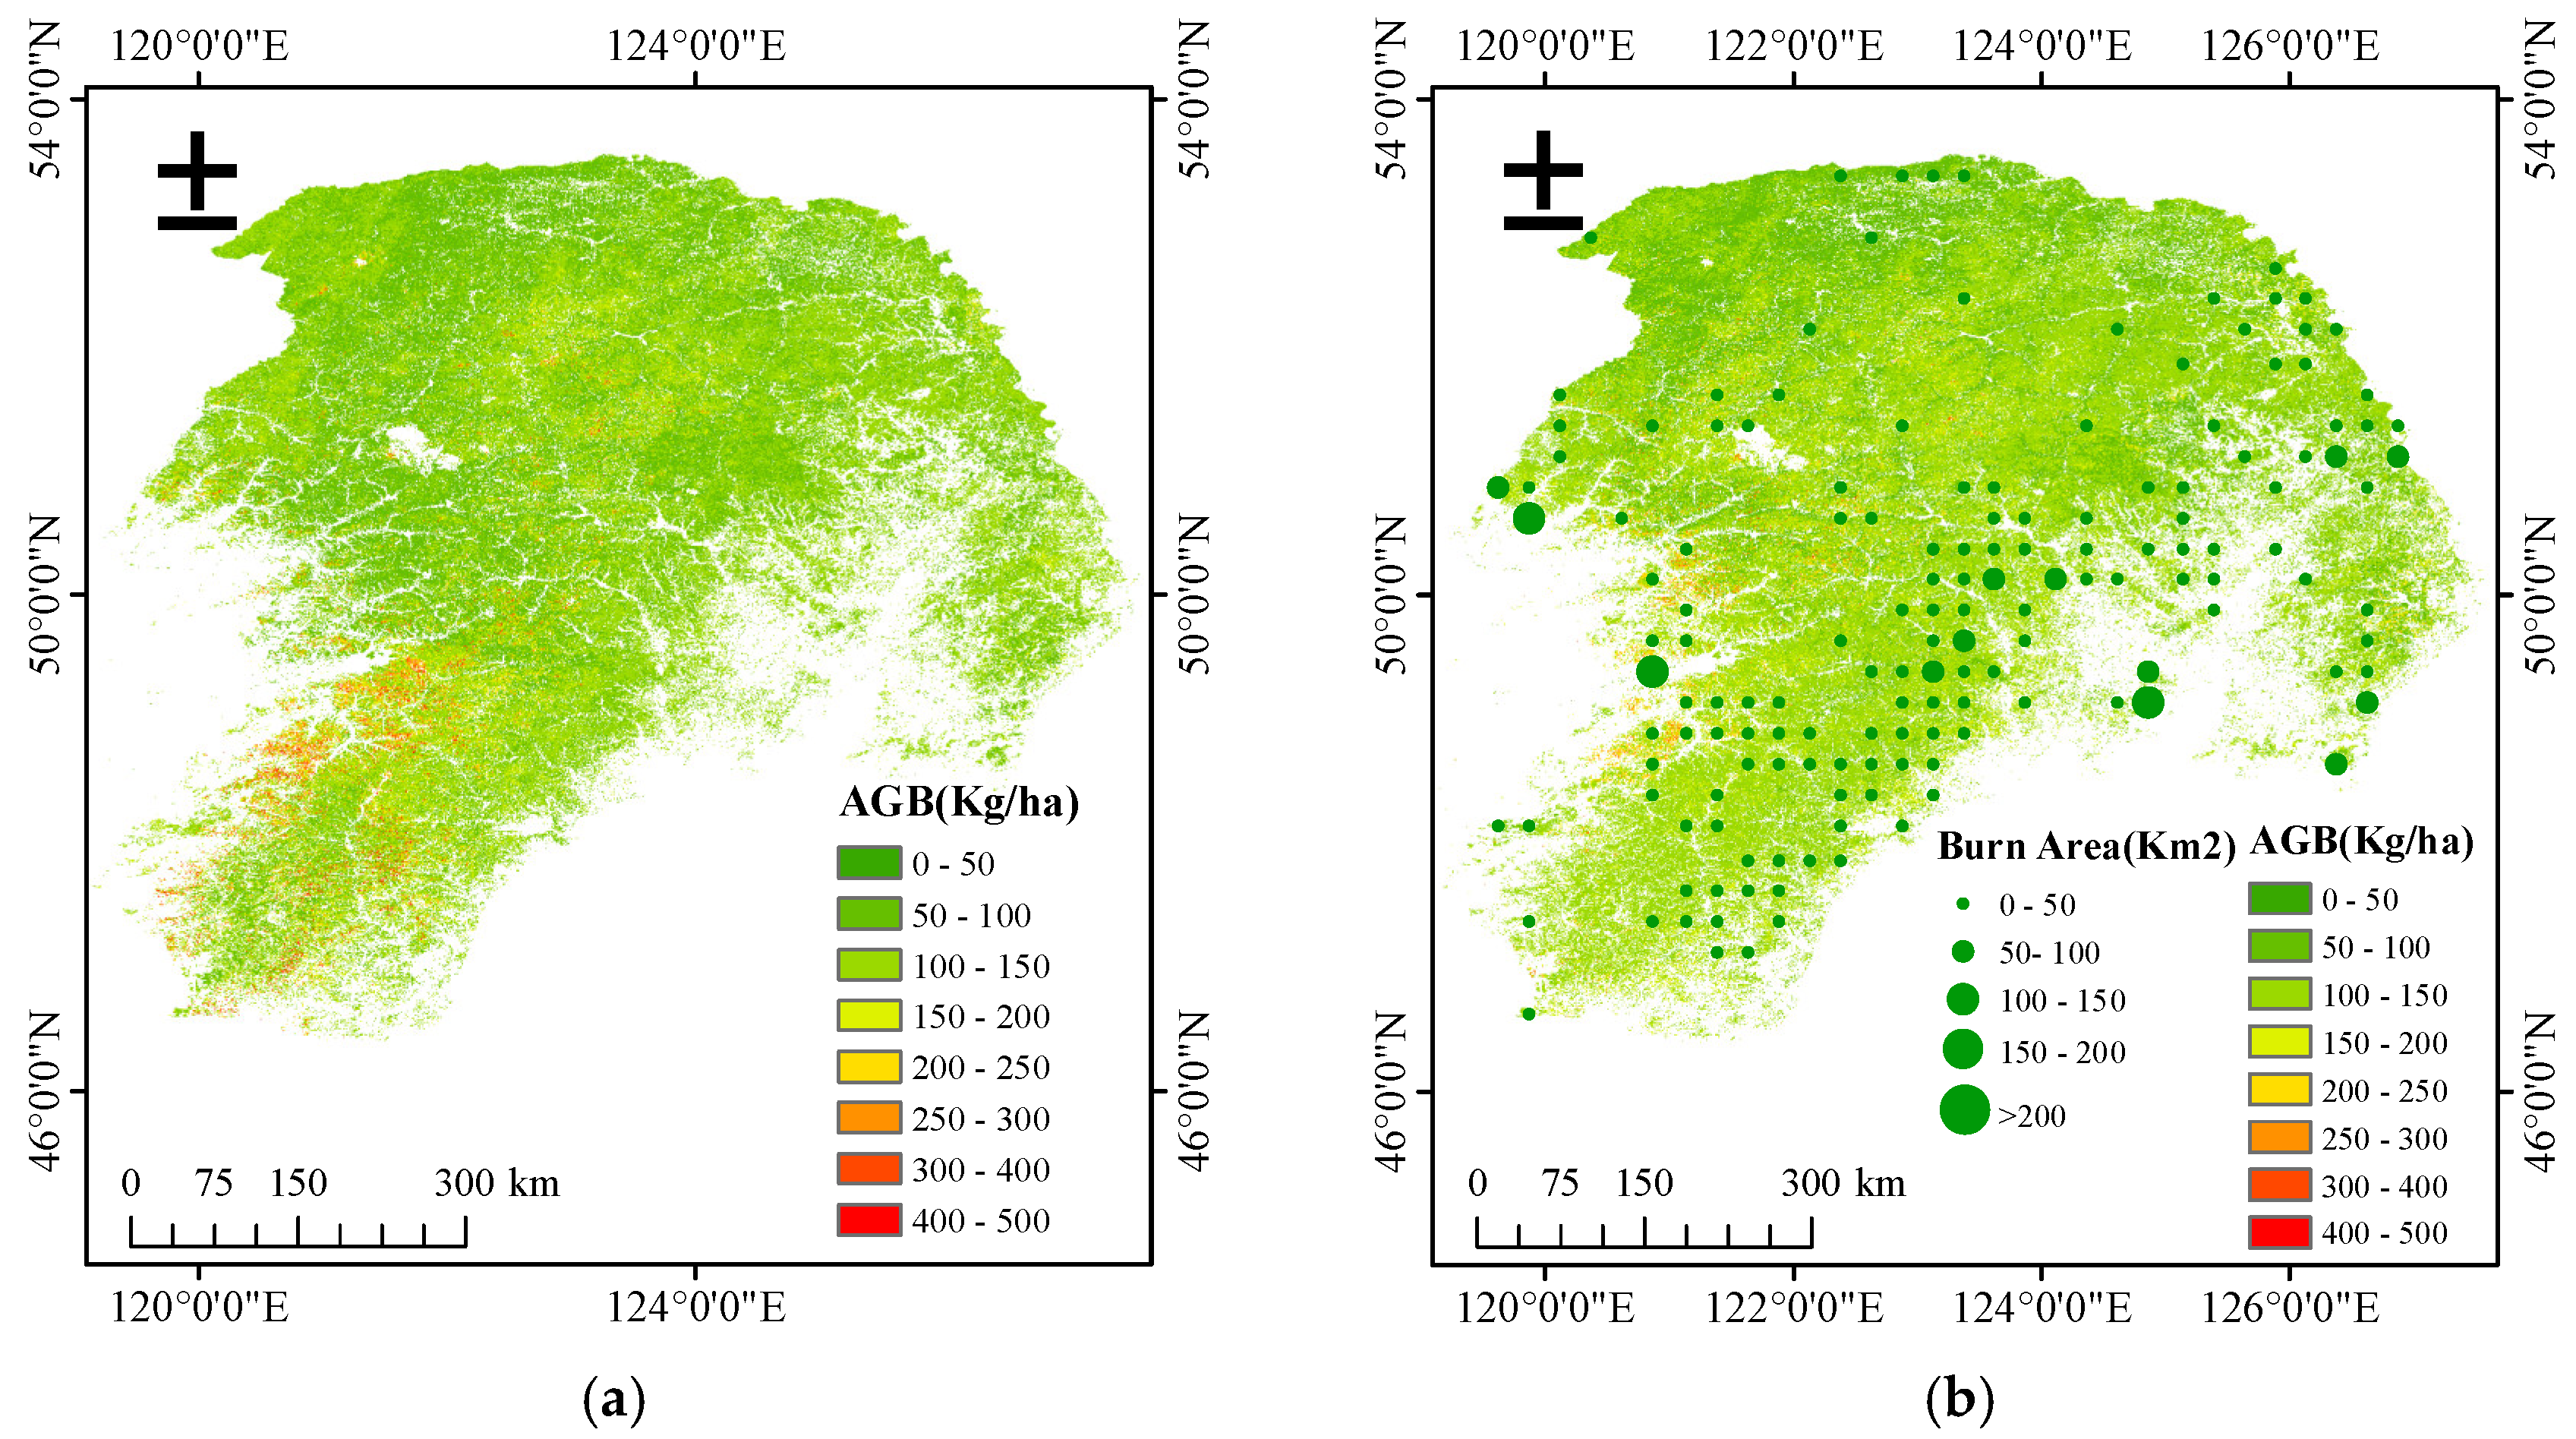
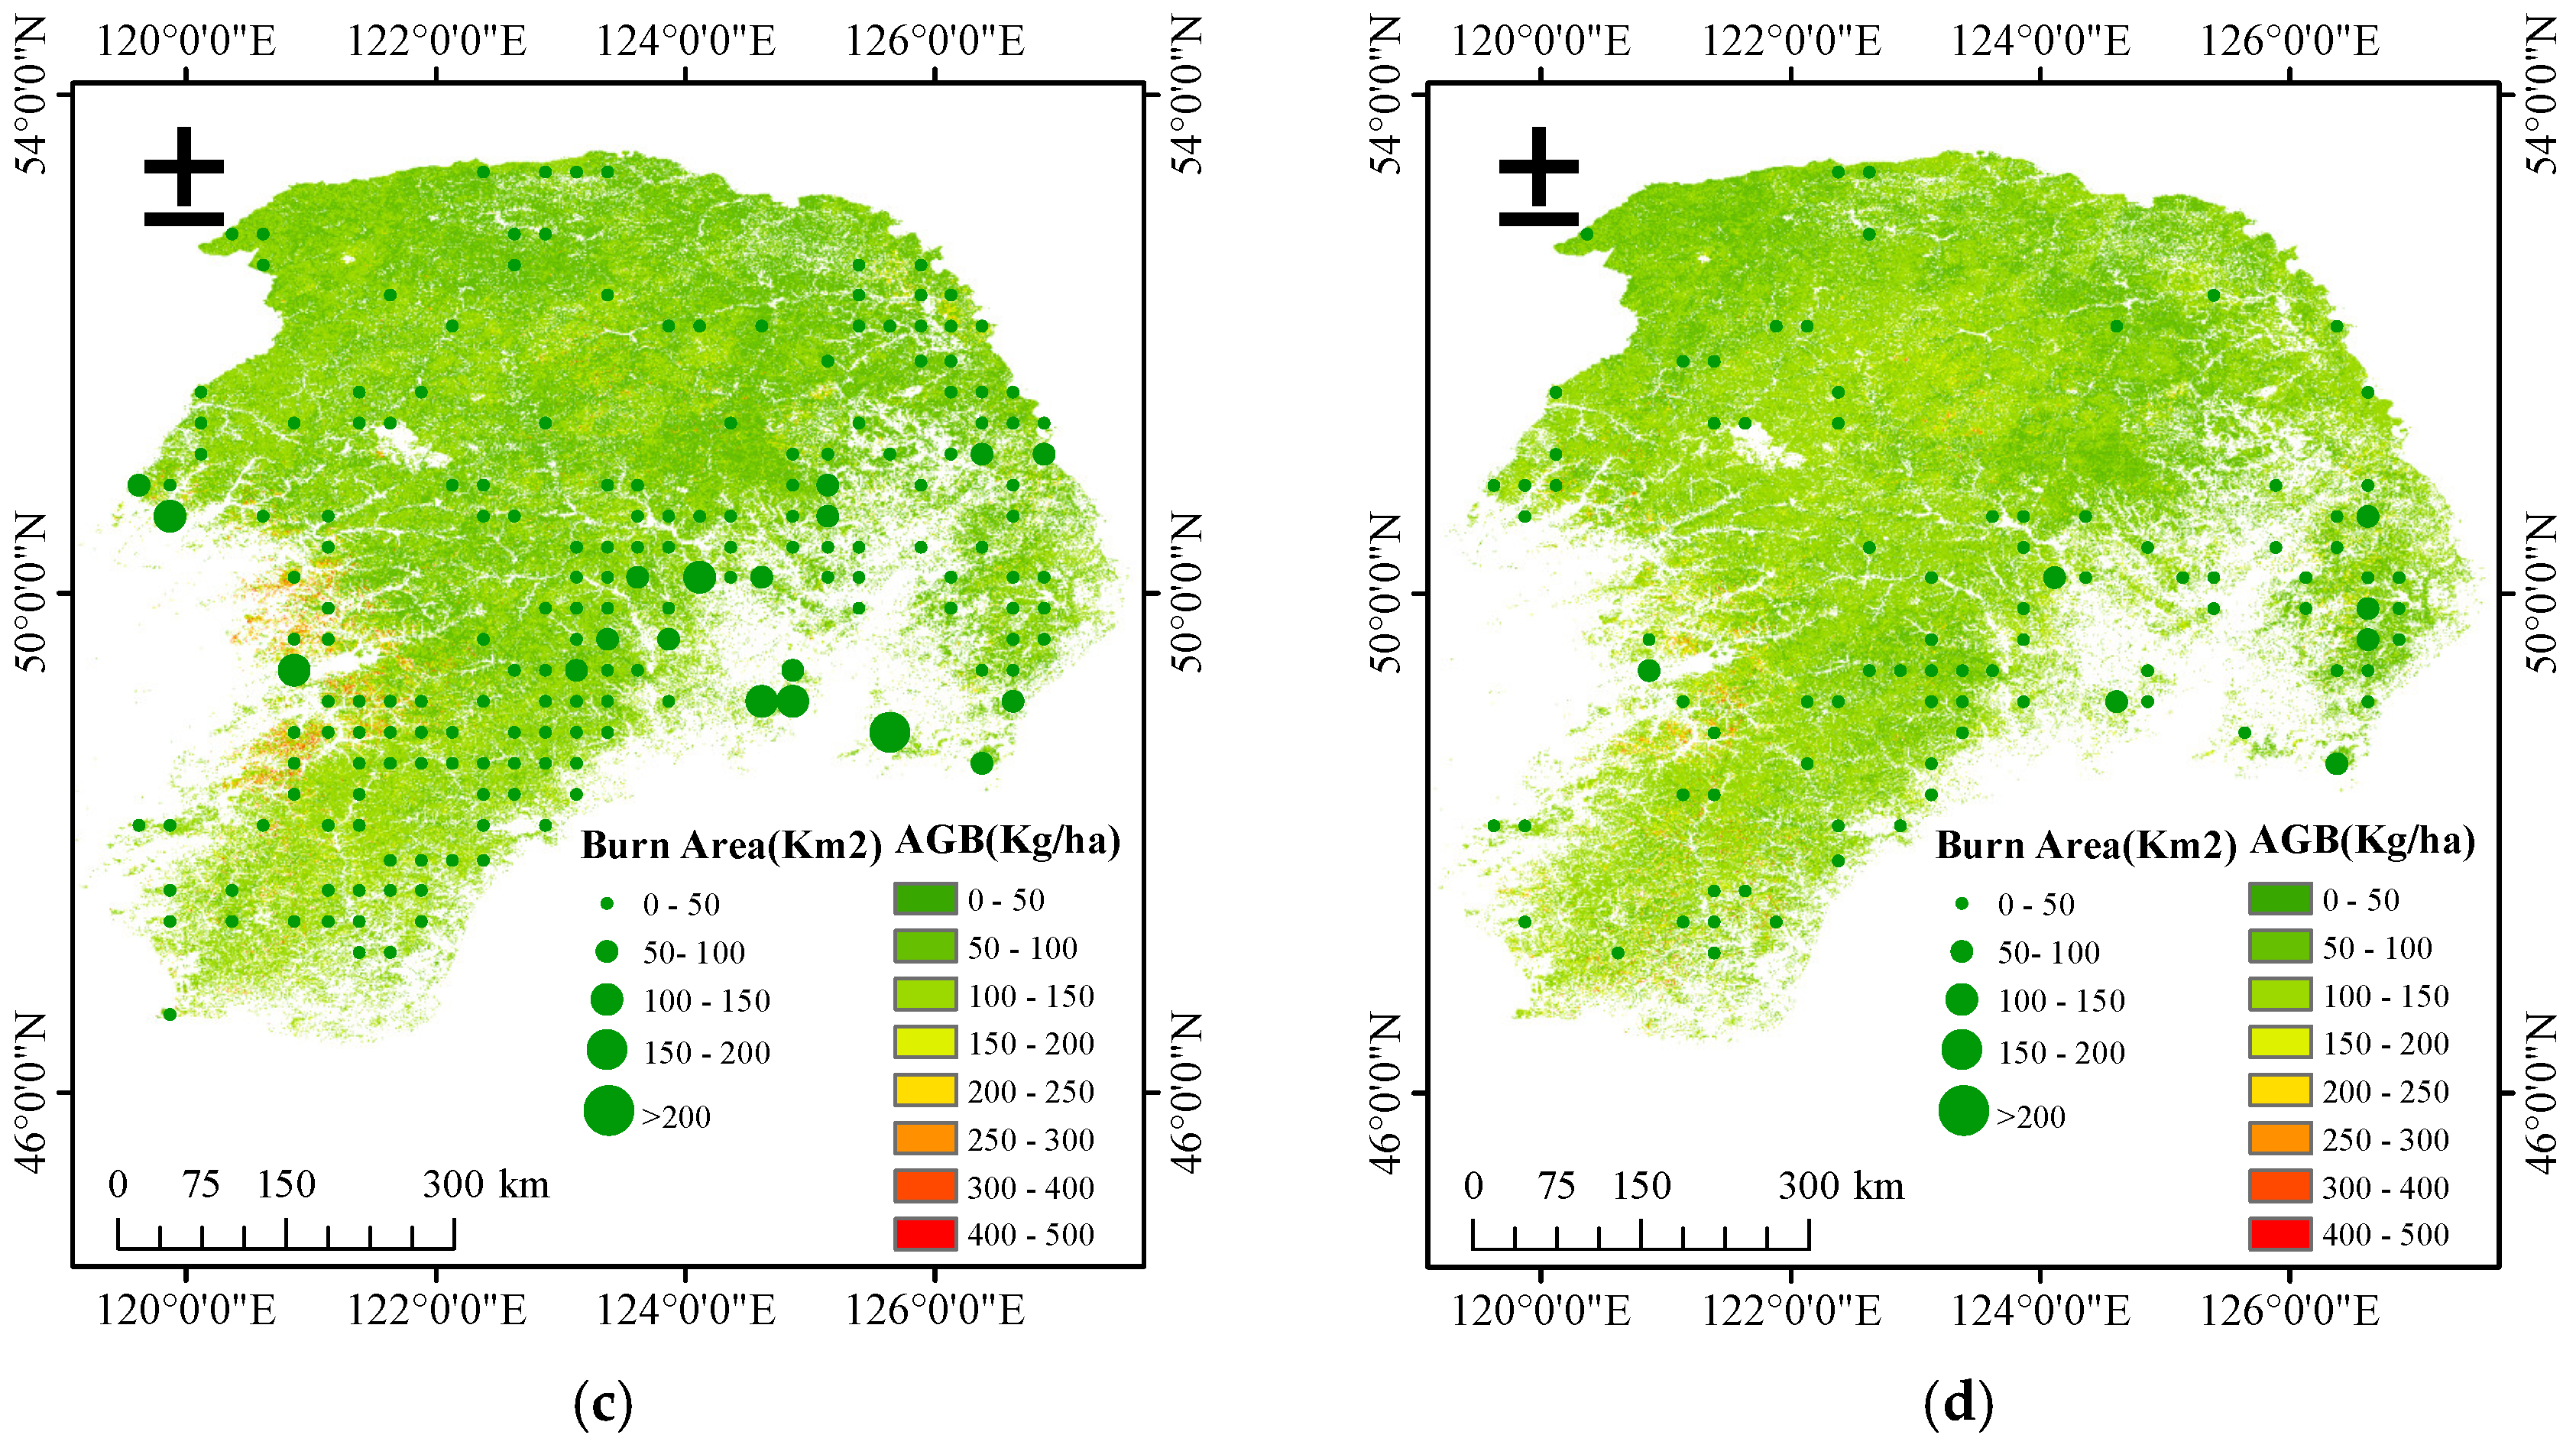
Figure 7a–c present the biomass inversion results for the entire region, the southwestern sub-region, and the southeastern sub-region, respectively. The data reveal a pronounced net increase in regional biomass of over 20% from 2013 to 2020, rising from 157 to 192 Mg/ha. This overall upward trajectory aligns with documented large-scale greening and forest recovery trends, which are widely attributed to afforestation initiatives and climate change effects. However, a critical divergence emerges when examining sub-regional dynamics. The accumulation rate was notably higher from 2013 to 2016 than from 2018 to 2020, punctuated by a distinct growth plateau from 2016 to 2018 where the increase was marginal at only 2.85%. In contrast to the sustained high growth in the southeast, where biomass surpassed 200 Mg/ha by 2020, the southwestern sub-region experienced a marked decline of 11.27% between 2016 and 2018. This sub-regional contrast underscores that the net positive trend is not a uniform response but the aggregate outcome of divergent processes. Substantial evidence from related studies indicates that the extensive northeast forest fire event in 2016 likely served as a primary catalyst for this reduction. To elucidate the impact of such disturbances Burned areas for the corresponding years, derived from the GFED4 obtained via the Global Fire Atlas, are overlaid as points in
Figure 8b–d and
Table 8.
The observed biomass trajectory between 2013 and 2020, characterized by a net increase punctuated by a sub-regional growth plateau (2016–2018), requires a nuanced causal interpretation. While forest carbon dynamics are influenced by various factors, our analysis suggests a hierarchy dominated by episodic fire disturbance. In this region, carbon sequestration is typically a gradual process driven by persistent factors such as afforestation and
fertilization [
39]. These drivers result in monotonic growth trends and cannot account for the abrupt 11.27% biomass decline observed in southwestern sectors. In contrast, fire disturbance in Northeast China is stochastic and pulse-like [
40]. Our data reveals a clear synchronicity between the biomass plateau and a tripling of the burned area from 8799 ha (2013–2016) to 25,546 ha (2017–2018), while fundamental drivers like temperature and precipitation remained relatively stable. This divergence provides strong objective evidence that intensified fire regimes acted as the primary overriding factor during the plateau years.
5. Conclusions
This study developed a multi-source RS framework for AGB estimation in the cold-temperature forests of Northeast China by s integrating optical, SAR, and spaceborne altimetry data. The primary contribution of this work is the practical application of a stratified modeling strategy that accounts for functional forest differences. Our results demonstrate that this integration provides a robust tool for tracking carbon resilience in complex boreal landscapes under varying disturbance regimes While the optimized SVR model achieved high statistical accuracy with an R2 of 0.76 and a mean relative deviation below 10%, the reliability of these metrics is closely tied to the regional biophysical characteristics and requires critical interpretation.
Our results demonstrate that the forest-type aware modeling strategy significantly enhanced estimation accuracy. The optimized SVR model, trained on features encompassing spectral reflectance, SAR backscatter, and GLCM-based textural metrics, achieved an R2 of 0.76 and an RMSE of 18.48 Mg/ha against independent field validation data, with a mean relative deviation below 10%. This performance represents a marked improvement over both the non-classified counterpart (R2 < 0.70) and other evaluated algorithms (LR, KNN, RF). Notably, while RF yielded a comparable mean AGB, its higher RMSE indicated greater predictive uncertainty, underscoring SVR’s superior robustness in handling the complex, non-linear relationships between multi-sensor features and biomass in heterogeneous forests. This finding indicate that by using species-specific allometric considerations and ICESat-2 vertical structural parameters, our framework treats forests as biophysically distinct entities rather than a homogeneous green blanket. This approach allows the SVR model to better calibrate the relationship between backscatter/reflectance and biomass, effectively pushing the signal saturation ceiling further in high-density broadleaf sectors.
The uncertainty analysis reveals that while the integrated model offers significant improvements over non-stratified models, several inherent limitations must be acknowledged. We find that species-specific allometric equations contribute a 6.42 ± 1.27% error highlights that even with high-resolution remote sensing, the fundamental biological variability in biomass-to-volume ratios remains a significant “uncertainty floor.” Second, the 1 km aggregation scale, while necessary to ensure altimetry data stability, generalizes fine-scale canopy heterogeneity and may be influenced by residual sensor biases during the transition from Radarsat-2 to Sentinel-1. Furthermore, spatial auto-correlation at forest edges and in complex topography continues to pose challenges for high-fidelity mapping.
The analysis of the AGB time series (2013–2020) revealed a nuanced picture of forest carbon dynamics in Northeast China. The data reveals that while regional greening is occurring due to afforestation and climate-driven recovery, these gains are highly vulnerable to stochastic disturbance events. The significant growth plateau observed between 2016 and 2018, where AGB accumulation slowed and even declined by 11.27% in southwestern sub-regions, is directly attributable to the tripling of burned area recorded during that period. This suggests that in boreal China, intensified fire regimes can temporarily override carbon sequestration efforts, acting as a primary driver of carbon instability.
This work reinforces the importance of incorporating functional and structural forest characteristics, such as canopy height and species composition, into regional carbon mapping in the Northeast area of China. Our findings suggest that these variables are critical for optimizing the performance of retrieval models and addressing known limitations like signal saturation. Practically, the presented framework offers a scalable, reproducible, and cost-effective tool for operational forest carbon monitoring and reporting. It delivers critical capabilities for jurisdictions pursuing natural climate solutions—enabling precise tracking of carbon stock changes, evaluating the efficacy of restoration and conservation projects, and quantifying carbon losses from disturbances like wildfires, thereby providing actionable science for climate change mitigation and sustainable forest management.