Article

Changes in Forest Hydrology and Biogeochemistry Following a Simulated Tree Mortality Event of Southern Pine Beetle: A Case Study


by
Courtney M. Siegert
1,*,
Heidi J. Renninger
1,
Nicole J. Hornslein
1,2,
Padmanava Dash
3,
John J. Riggins
4 and
Natalie A. Clay
5
1
Department of Forestry, Mississippi State University, Mississippi State, MS 39762, USA
2
Cooperative Institute for Research in Environmental Sciences, University of Colorado Boulder, Boulder, CO 80309, USA
3
Department of Geosciences, Mississippi State University, Mississippi State, MS 39762, USA
4
Department of Forest Engineering, Resources & Management, Oregon State University, Corvallis, OR 97331, USA
5
Department of Entomology & Plant Pathology, University of Arkansas, Fayetteville, AR 72701, USA
*
Author to whom correspondence should be addressed.
Forests 2026, 17(2), 211; https://doi.org/10.3390/f17020211
Submission received: 12 December 2025 / Revised: 29 January 2026 / Accepted: 2 February 2026 / Published: 4 February 2026
(This article belongs to the Special Issue Effects of Disturbance on Forest Hydrology)

Abstract

Southern pine beetle infestations impact ecosystems throughout the southeastern US. Our understanding of hydrologic and biogeochemical impacts on ecosystem structure and function is largely guided by severe outbreaks occurring in the western US. A simulated mortality experiment was conducted on loblolly pine trees via girdling with and without blue-stain fungi inoculation to mimic a small-scale infestation. We measured whole-tree water use, canopy-derived hydrologic and biogeochemical fluxes, soil moisture, and soil respiration for two years following treatments to quantify the impacts of tree mortality on water, carbon, and nitrogen cycles. In the second year of our study, a significant drought occurred, subjecting study trees to a secondary stressor. We found that compared to control trees, girdled trees exhibited reduced water uptake within 6 months and succumbed to mortality within 18 months. We found that by the time trees reached the gray phase of attack, stemflow was 1.7-times lower in girdled trees compared to control trees. Stemflow from girdled trees had up to 7.2-times higher concentrations of ammonium and 2.8-times higher concentrations of total nitrogen. Although stemflow carbon concentrations were indistinguishable between treatments, total carbon flux in stemflow was 2.0-times greater in non-girdled trees (p = 0.030). Finally, even though soil moisture and respiration were not different between treatments, it was not possible to isolate the response of these to mortality versus drought. Our results present the connection between bark beetle outbreaks and the initial impacts on forest biogeochemistry. Changes in the distribution of canopy-derived water inputs, coupled with altered carbon and nitrogen fluxes, serve as hot spots around bark beetle-killed trees. Further research is necessary to understand whether these isolated hot spots may prime the system, alter microbial and invertebrate communities, and lead to changes in decomposition processes at larger scales.

1. Introduction

Widespread tree mortality from insect outbreaks in forested ecosystems are common disturbance event in many parts of the world [1,2,3,4]. Bark beetle infestations occur in forests globally and result in a predictable sequence of mortality, first undergoing the “green-attack” phase, where the trees are infested but still maintain green needles, then the “red-attack” phase, where needle death occurs, followed by the “gray-attack” phase, where needles drop and leave a bare canopy [5]. These phases have differing impacts on forest hydrological and soil biogeochemical processes [6]. For example, Bearup et al. [7] showed that a decline in transpiration following a bark beetle outbreak in the western US led to a 30% increase in groundwater recharge. In contrast, Edburg et al. [5] proposed a framework in which more open forests following mortality would lead to a smaller snow pack and degraded water quality. Understanding both of these outcomes is critical, as bark beetle impacts on water resources determine forest management strategies [8,9,10]. Much of what we know about how bark beetle outbreaks impact forest ecology is derived from the western US and northern Europe. However, in western and northern forest ecosystems, vegetation dynamics that govern regeneration and forest recovery are slower processes compared to eastern US forests, so ecosystem responses may differ among regions. Although the southeastern US has large expanses of pine forests and plantations that are regularly attacked by pine beetles [11,12,13], we understand very little about the ecological consequences of bark beetle attacks in this region.
In the southeastern US, the southern pine beetle (Dendroctonus frontalis Zimm.) is a native bark beetle that attacks many species of southern pine, with the most common being loblolly pine (Pinus taeda L.) due to the species’ widespread use in plantation forestry. Southern pine beetles are one of the most aggressive bark beetles, and are capable of killing a vast number of trees quickly [11,12,14]. Tree death may be accelerated via ophiostomatoid fungi, which are vectored by the southern pine beetle [15,16]. These fungi, commonly referred to as “blue-stain” fungi due to the discoloration the fungi cause to wood [15], colonize the vascular system and restrict plant water uptake, hastening tree mortality [17,18]. Additionally, subterranean termites are often preferentially attracted to wood inhabited by blue-stain fungi [19,20,21]. Together, these processes may lead to faster decomposition rates and nutrient cycling in southeastern US forests attacked by bark beetles [22,23].
Southern pine beetle outbreaks across the southeastern US can cause more than $100 million in timber losses, damaging more than one billion cubic feet of valuable timber [24,25]. While much attention has been given to forest management and outbreak reduction/mitigation [26,27,28,29], less has been given towards changes in the ecological structure and function of these impacted forests [2,30,31,32], especially in the southeastern US [22]. In healthy and well-managed forests, southern pine beetles attack and kill trees at endemic population levels that result in consistent low-density tree mortality [26,33]. However, the ecological, hydrological, and biogeochemical impacts of endemic bark beetle tree mortality are far less understood.
Bark-beetle-attacked forests undergo changes that impact biogeochemical cycling. Bark beetle disturbance leads to large influxes of fresh needles to the forest floor, which is coupled with fine root mortality and turnover [34,35,36]. These serve as sources of mobile carbon and nitrogen that can accelerate mineralization and increase the availability of these key nutrients [35,37]. Moreover, rates of plant uptake of nitrogen and base cations decline with tree mortality, ultimately resulting in greater availability of these nutrients in soil [38]. Despite our growing understanding of belowground responses to bark-beetle-caused tree mortality [6], far less is known about how mortality impacts the biogeochemistry of canopy-derived pathways, particularly stemflow, which serves as a highly localized input of water and nutrients to individual trees, and throughfall, which serves as a more dispersed input.
Bark-beetle-attacked forests undergo changes in forest structure that impact hydrologic cycling through changes in aboveground biomass, leaf area, and canopy structure during tree mortality. For example, throughfall, as a hydrologic input, scales with the leaf area index [39]. Consequently, as foliage dies, the capacity of tree crowns to intercept rainwater decreases, leading to an increase in throughfall. Increased throughfall may lead to greater moisture availability in soils for vegetation and microbial communities, but the reduction in crown area may also increase net radiation and evaporation [40,41]. Another hydrological change caused by tree mortality is in the quantity and quality of stemflow. The ecological significance of stemflow is often overlooked [42,43,44,45] as it is generally less than 5% of the volumetric input at the watershed scale [46,47]. However, stemflow can contribute a large proportion of the nutrient flux to forest soils, which is deposited directly around tree boles and individual root systems [48,49,50]. In particular, stemflow has been shown to increase in the dormant season when deciduous trees are defoliated, and more of the stem is exposed to direct precipitation [51,52,53]. This same process may occur in bark-beetle-killed forests, as needles die and drop to the forest floor. Changes in hydrologic processes such as these can have large impacts on forest ecosystem function in bark beetle outbreak areas, but there is a notable knowledge gap in this area.
Given the extent of loblolly pine silviculture in the southeastern US and the potential impact of southern pine beetle on this ecosystem and associated industry, the paucity of studies in the region connecting insect disturbance and changes to ecohydrologic and biogeochemical cycles is striking. As such, the objective of this study was to quantify changes in hydrologic and biogeochemical cycles from trees undergoing mortality in a simulated bark beetle attack in the southeastern US. We hypothesized that simulated bark-beetle-killed trees would create biogeochemical hotspots near their trunk as they undergo mortality due to (1) increased soil moisture from reductions in plant water uptake and increased stemflow production and (2) enhanced canopy-derived inputs of carbon and nitrogen. Outcomes of this study will better inform our understanding of hydrology and biogeochemical processes following bark beetle outbreaks in the southeastern US. This knowledge can be used to refine models for water resource management, to understand the role of bark beetles in carbon and nutrient cycles, and to provide empirical evidence to support forest management activities following outbreaks, all of which are notably lacking in the southeastern US.

2. Materials and Methods

2.1. Study Site

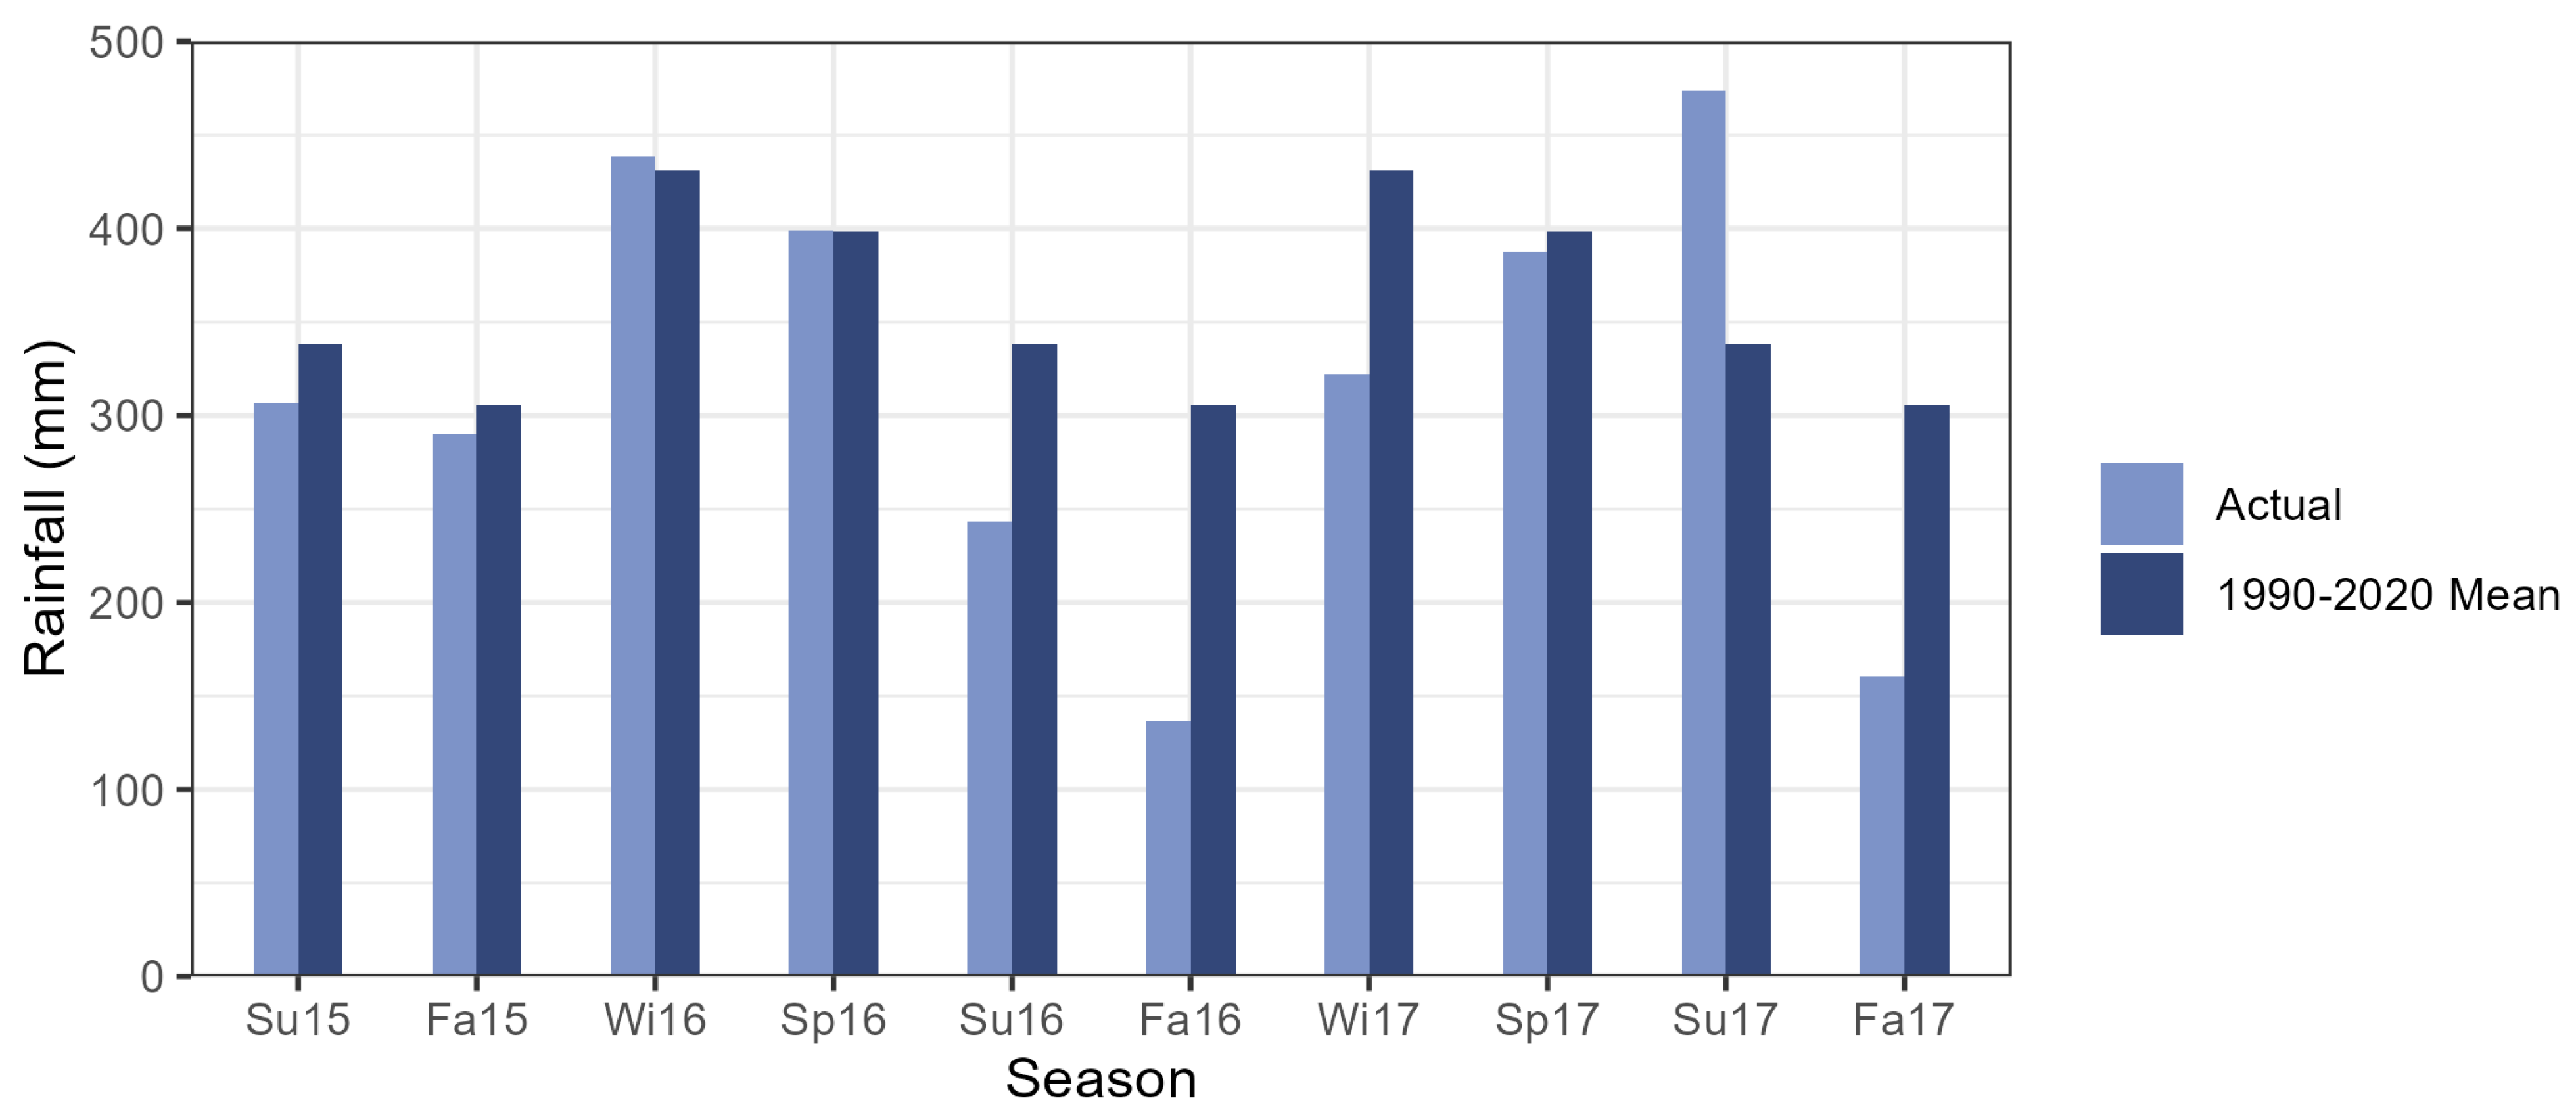
The study was conducted in a 60-year-old loblolly pine stand in central Mississippi (33.2639° N, 88.8884° W). The overstory basal area (trees with diameter at breast height; DBH) was 21.1 m2 ha−1 with 130 trees ha−1 dominated by loblolly pine. The midstory had a basal area of 11.8 m2 ha−1 with 1664 trees ha−1 dominated by sweetgum (Liquidambar styraciflua L.), red maple (Acer rubrum L.), winged elm (Ulmus alata Michx.), and oak species (Quercus spp.). The soil on this site is classified as somewhat poorly drained Urbo silt loam with slow permeability found on nearly level landscapes around streams that drain uplands in the Southern Coastal Plain physiographic region [54]. Average temperatures in summer (June, July, and August) and winter (December, January, and February) are 27.1 °C and 7.6 °C, respectively (30-year mean 1990–2020; [55]). Total annual rainfall is 1473 mm, which falls fairly evenly throughout the year [55]. During the study period, particularly from Summer 2016 to Winter 2017, an extreme drought (level D3 on 15 November 2016; [56]) was observed throughout the southeastern US, resulting in significant reductions in rainfall (Figure 1).

2.2. Study Design and Treatments

A field study was established in the summer of 2015 to simulate a bark beetle attack and mortality event by girdling loblolly pine trees to sever phloem and cambium tissue [57] (Figure 2). Fifteen canopy-dominant loblolly pine trees were selected around a centrally located data logger and randomly allocated to three different treatments: (1) five trees were girdled and received inoculations of blue-stain fungus (Ophiostoma minus (Hedgc.) Syd. & P. Syd.), (2) five trees were girdled and inoculated with agar as negative controls, and (3) five trees were not girdled and received no inoculations as controls (see Figure 1a,b for site layout and Figure 1c for girdling treatment illustration in Siegert et al. [58],). Fungal inoculations were implemented to further assess the role blue-stain fungi play in controlling rates of tree mortality. Cell stock of previously identified cultures of O. minus was available from prior studies (see [19,20,21]) for use in this study. Pure strains of the fungus were cultured on malt extract agar. Once the fungi were vigorously growing, three 0.5 cm diameter plugs were taken from each Petri dish and were inoculated into the sapwood of the trees using an arch punch just above the girdling. Between trees, tools were flame sterilized to avoid cross-contamination.

2.3. Sapflow Measurements

On all 15 study trees, 2 cm long sapflow probes were installed to measure tree water use following the heat dissipation method [59], which estimates sapflow rates from the temperature deficit between an upper heated and lower reference probe, as described in Hornslein et al. [60]. Sapflow probes were installed radially into the outermost sapwood tissue, positioned above the stem girdle and approximately 1 m above ground level. Probes were covered by reflective insulation and connected to a CR1000 datalogger and AM16/32B multiplexer (Campbell Scientific Inc., Logan, UT, USA) powered by deep-cycle batteries and a solar panel located in a nearby canopy gap. Measurements were recorded every 30 s and averaged over 30 min increments. These raw millivolt temperature data were imported into the BaseLiner software program version 3.0.8 (Duke University, Durham, NC, USA) to calculate sapflow velocities (g m−2 sapwood area s−1) based on the empirical equation developed by [59]. To scale measurements to the tree level, sapwood depths were calculated from DBH measurements and an allometric equation from Blanche et al. [61]. In addition, radial decreases in sapflow velocity with depth were accounted for using data from Ford et al. [62]. Sapflow was monitored in trees until the cessation of flow in girdled trees in late 2016.

2.4. Stemflow, Throughfall, and Precipitation Quantity and Quality

All 15 focal trees were outfitted with stemflow collars constructed from 2.5 cm inner diameter polyethylene tubing cut longitudinally and placed around the trunk of each tree above the girdled location, sapflow probes, and an inoculation site (see Figure 1c in Siegert et al. [58] for stemflow collar illustration). Stemflow collars were sealed around the tree trunk with silicone caulk and held in place with aluminum nails. Collars drained into 20 L polyethylene bins. Because trees designated for girdling were randomly selected from the 15 focal trees, there was limited ability to isolate the effect of girdling on throughfall. Therefore, throughfall samples were not utilized to isolate the effects of girdling, but instead served as net measurements of stand-level changes in throughfall quantity and quality. As such, net throughfall was measured with five 1 L polyethylene containers fitted with 20.3 cm diameter funnels. Open precipitation was measured with 1 L polyethylene containers fitted with 20.3 cm diameter funnels placed in a clearing 250 m south of the study plot. Stemflow and throughfall volume were measured directly from the sample collectors. Precipitation quantity was measured with a tipping bucket rain gauge (RG3-M, Onset, Inc., Bourne, MA, USA), located adjacent to the open precipitation collector. Water samples for chemical analysis were collected from open precipitation, stemflow, and throughfall containers within 24 h of the end of a storm event. Water samples were filtered through a 0.45 μm membrane and stored at 4 °C until chemical analysis. Sample collection began in fall 2015 and continued through fall 2017. The data presented herein build upon preliminary data reported by Siegert et al. [58].
Water samples from stemflow, throughfall, and rainfall were analyzed for carbon and nitrogen. Dissolved organic carbon (DOC) was analyzed on a DR5000 UV-Vis Spectrophotometer (Hach Company, Loveland, CO, USA) with the Low-Range Total Organic Carbon Test kit (Hach Company, Loveland, CO, USA). Colored dissolved organic matter (CDOM) absorbance was measured using a Lambda 850 UV-Vis Spectrophotometer (PerkinElmer, Waltham, MA, USA). After ultrapure water correction and a correction for baseline fluctuations of the absorbance spectra, the absorption coefficient (a254), a metric that describes the aromaticity of DOM, was calculated by
a 254 = 2.303 × A ( λ ) l
where A ( λ ) = the absorbance at 254 nm, l = the cell path length of the instrument, set to 0.01 m [63]. The specific UV absorbance (SUVA) describes compound aromaticity and was standardized for the concentration of DOC in the sample by
S U V A 254 = a 254 [ D O C ]
where [DOC] = the concentration of dissolved organic carbon in the sample [64].
Dissolved nitrogen species [total nitrogen (TN), organic nitrogen (ON), nitrate ( N O 3 –N), and ammonium ( N H 4 + –N)] were analyzed on a Bran+Luebbe Auto Analyzer 3 (SEAL Analytical, Mequon, WI, USA). N O 3 –N was determined using cadmium reduction methods. N H 4 + –N was determined using phenate methods. TN was determined using microwave digestion in which all ON forms of nitrogen are converted to N O 3 –N, then analyzed using cadmium reduction methods. ON was calculated as
O N = T N N O 3 1 + N H 4 + 3
All laboratory methods followed QA/QC protocols, including standards, blanks, and duplicate testing.

2.5. Soil Moisture and Respiration

Soil moisture and respiration were measured around each of the 15 individual trees, beginning in spring 2016. A circular grid with concentric rings of three 0.5 m intervals split into six sample quadrants was established around each tree for soil sampling and respiration measurements. To isolate the soil for respiration, a 20 cm inner diameter polyvinyl chloride (PVC) pipe cut to a length of 10 cm was installed permanently into the soil profile at the center point of each of the three concentric distance quadrants. Installation locations were randomly generated, but these locations remained fixed throughout the study to limit disturbance of the soil and root profile. Each tree had a total of three respiration collars randomly located around the tree base: one at a distance of 0.5 m, one at a distance of 1.0 m, and one at a distance of 1.5 m (see Figure 1c in Siegert et al. [58] for respiration collar placement). Respiration was measured monthly with a LI8100A Soil Automated Flux Analyzer (Li-Cor, Inc., Lincoln, NE, USA) outfitted with a 20 cm survey chamber along with a volumetric water content sensor (ECH2O model EC-5, Decagon Devices, Inc., Pullman, WA, USA) and soil temperature thermistor probe (Li-Cor, Inc., Lincoln, NE, USA). Respiration data were adjusted based on the average measured depth of each PVC collar.

2.6. Data Analysis and Statistics

All measurements were aggregated to the seasonal scale (Fall: September–November; Winter: December–February; Spring: March–May; Summer: June–August) to provide a common baseline comparison across continuous measurements (sapflow), discrete event-level measurements (stemflow, throughfall, and precipitation), and discrete seasonal measurements (soil moisture and respiration).
We evaluated treatment differences over time using a linear mixed-effects model that accounted for the repeated measurements of response variables in the data. For each response variable (e.g., sapflow, soil moisture, stemflow, throughfall, soil respiration), we fit a mixed model with girdling treatment (girdled vs. control), season, and their interaction (treatment × season) as fixed effects and individual tree as the random effect that was repeatedly sampled. Mixed-effects modeling was conducted using the ‘lmer’ function in the lme4 package [65] in R statistical software, version 4.4.2 [66]. Differences between treatment groups and season were then evaluated using estimated marginal means with the ‘emmeans’ function in the emmeans package [67]. Model-adjusted means and standard errors are reported in summary tables.

3. Results

Two years following a simulated bark beetle attack, all girdled trees had shed their needles and died. Four of the five control trees were healthy and had fully foliated canopies, while one of the control trees succumbed to mortality for unknown and unidentifiable reasons. For this reason, this tree was omitted from further analysis.

3.1. Plant Water Uptake, Canopy-Derived Hydrologic Inputs, and Soil Moisture

Throughout the study, sapflow data indicated no differences between trees inoculated with blue-stain fungi versus those inoculated with agar as controls, leading us to assume that the blue-stain inoculations were either unsuccessful or did not affect tree water use and the mortality process (see [60] for further details and statistical analyses). Therefore, the results presented here separate the treatments into control (i.e., non-girdled) and girdled.
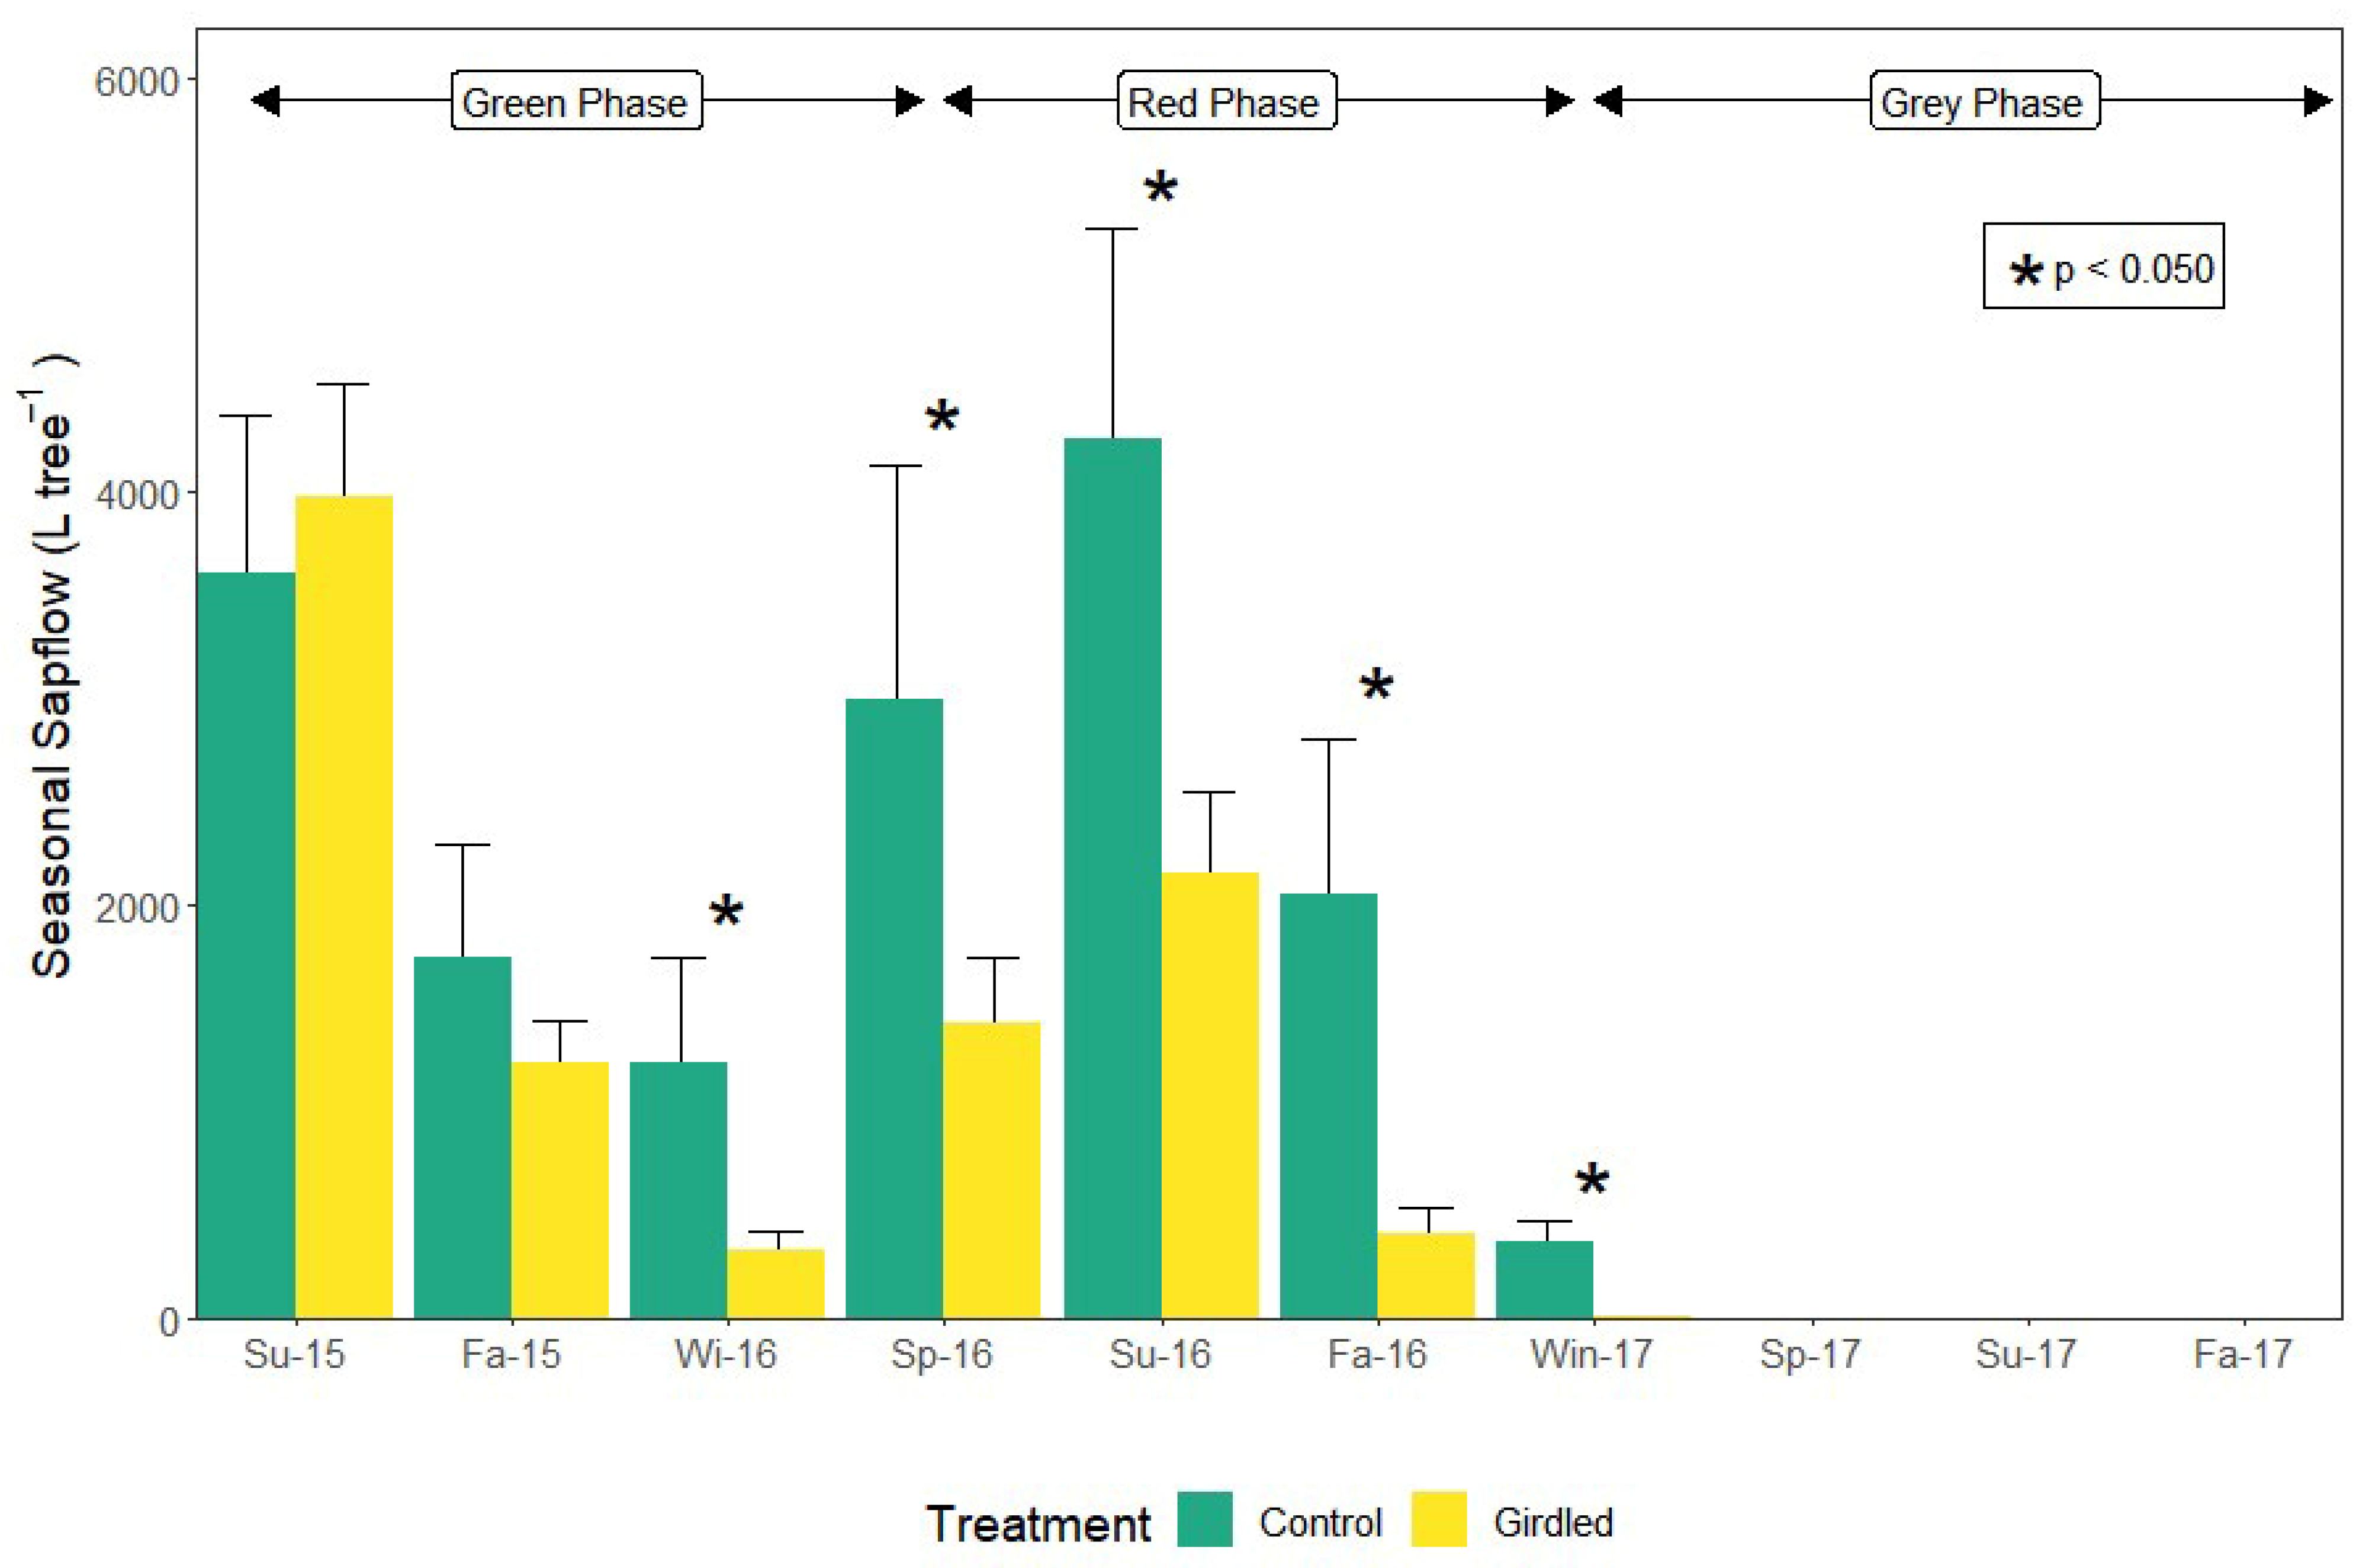
Sapflow rates were not statistically different between control and girdled pines during the growing season immediately following the girdling treatment (Summer and Fall 2015). Girdled pines began to exhibit significantly lower sapflow rates in December of 2015 and maintained lower sapflow for the remainder of the study (p < 0.050, Figure 3). By the end of the second growing season following girdling, all girdled trees ceased sapflow and measurements were no longer recorded [60].
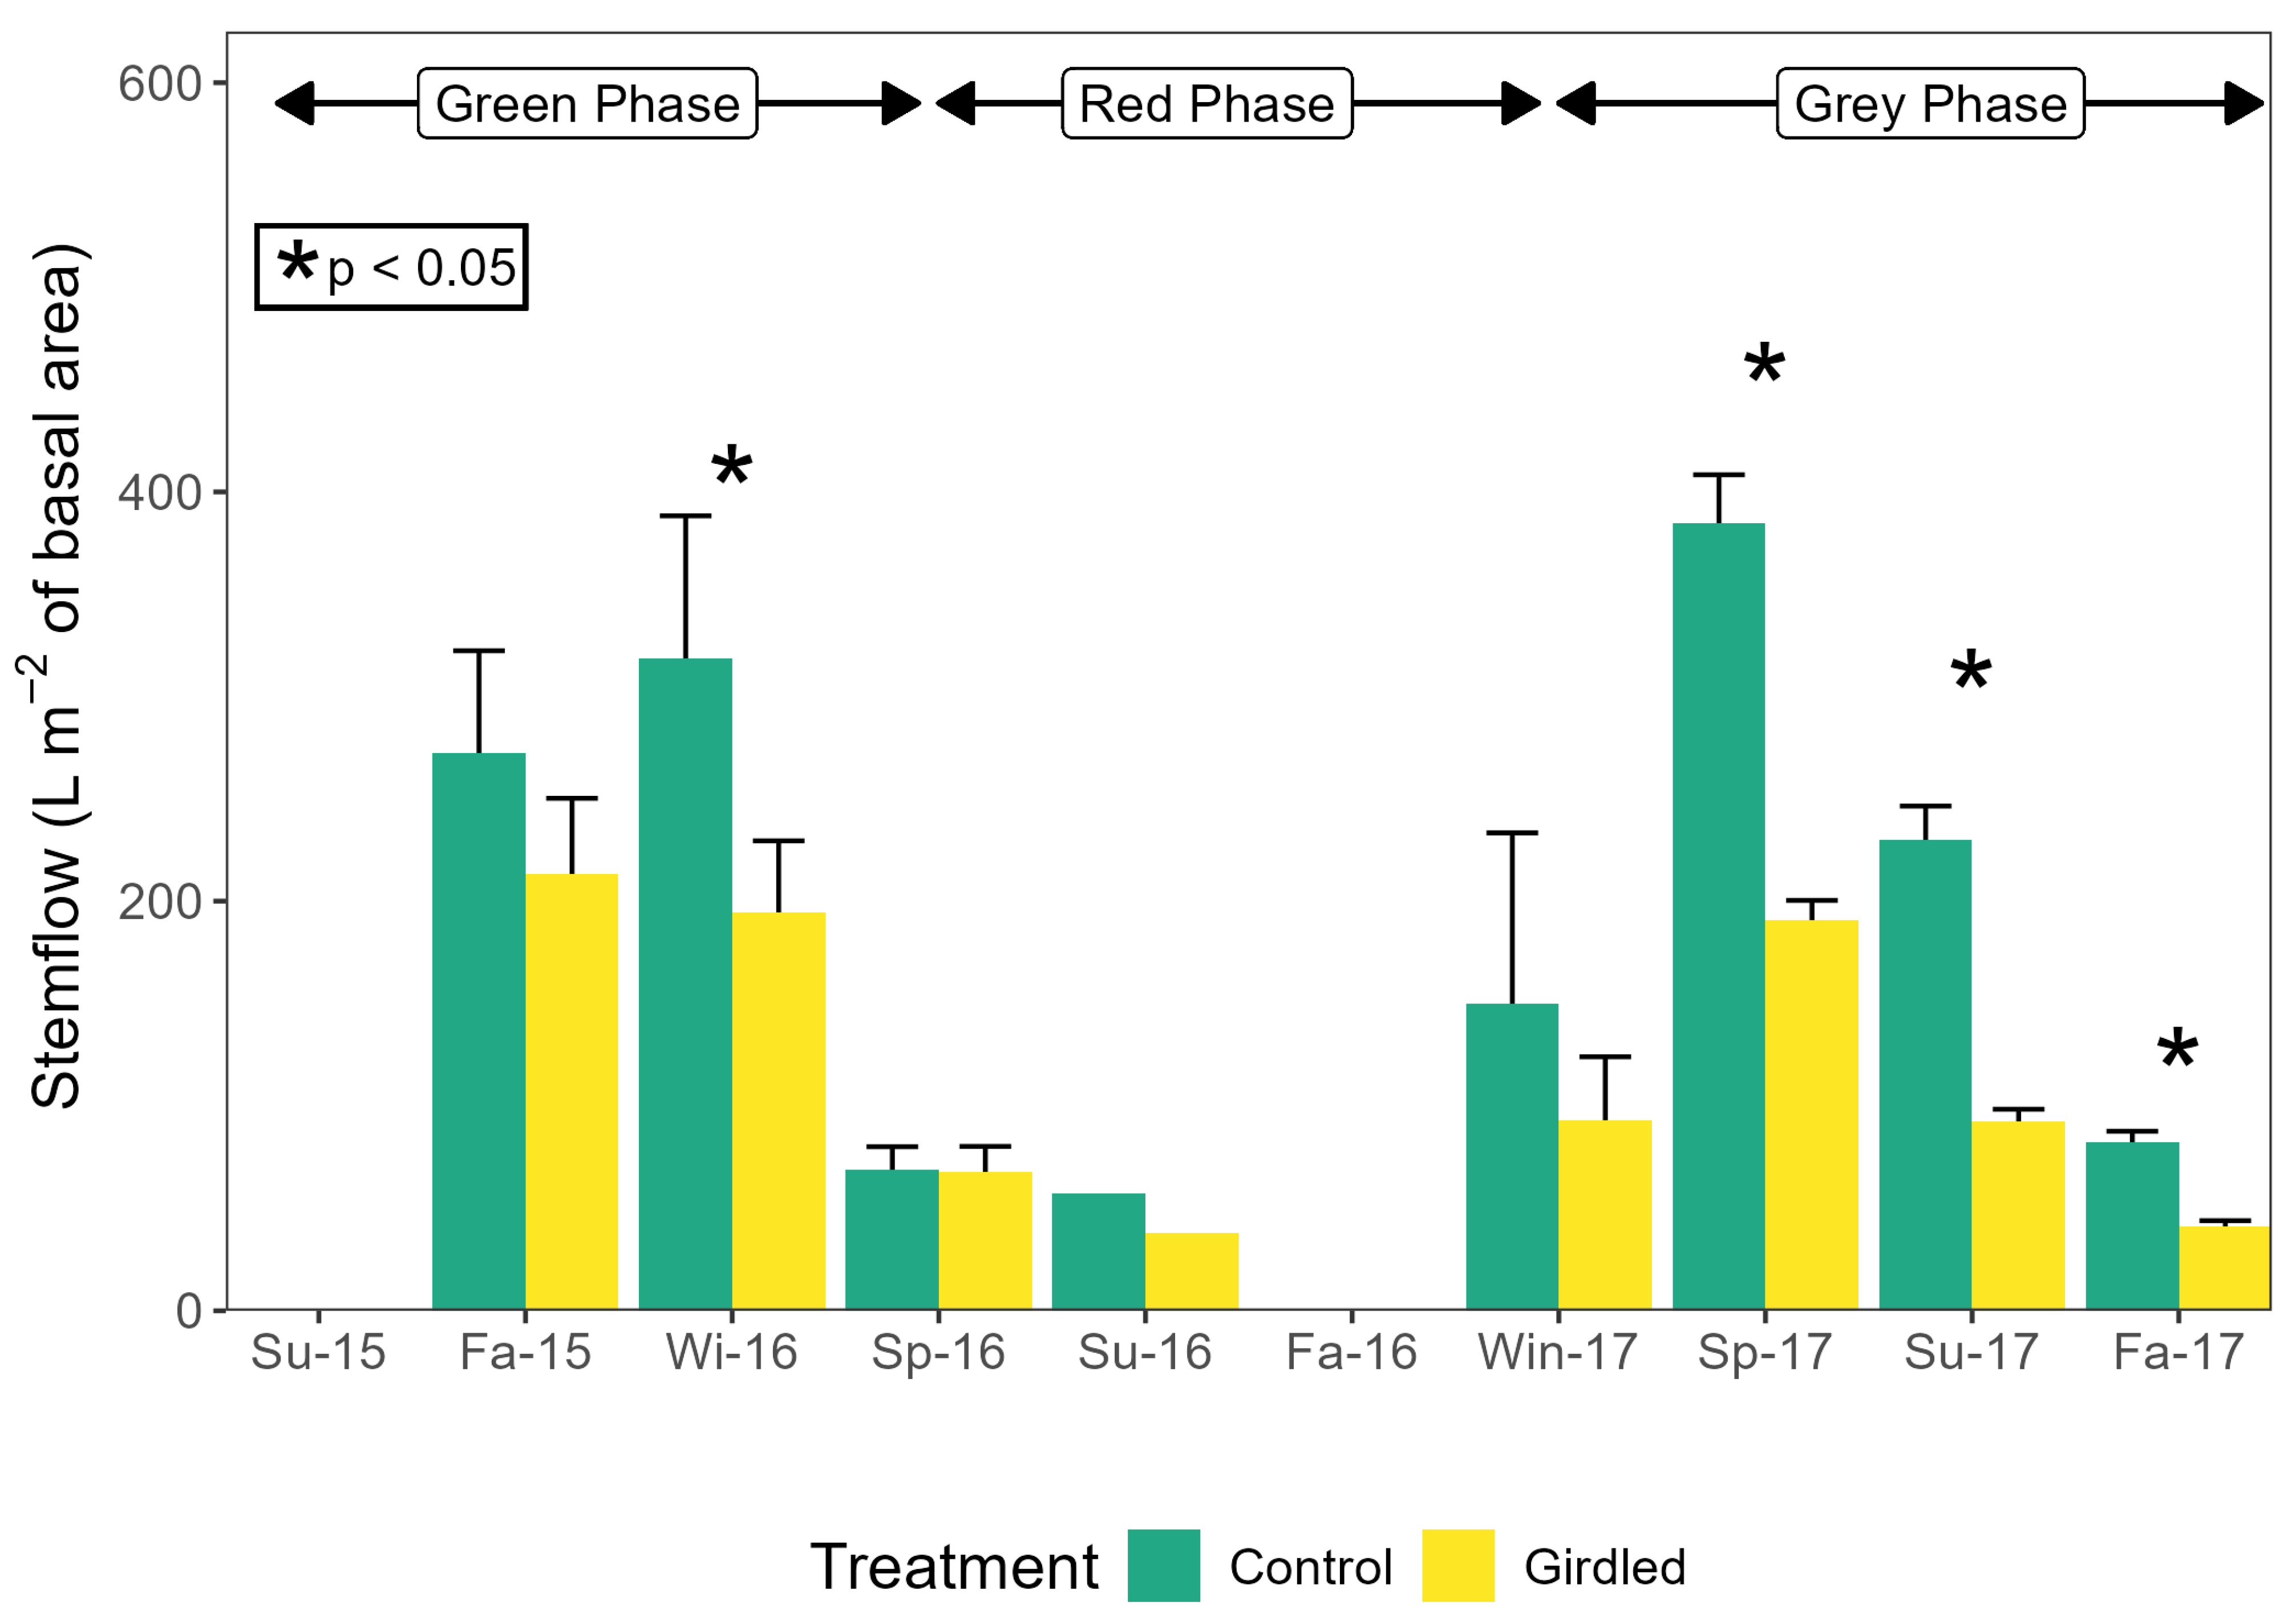
Throughout the study, 30 storm events were sampled. Stemflow production remained largely unchanged between treatments through the first year and a half of the study, with the exception of minor differences observed in Winter 2016, when control trees had 1.6-times more stemflow than girdled trees (318 L m−2 vs. 194 L m−2, p = 0.029) (Figure 4). Then, in Spring 2017, with the onset of the gray phase, differences in stemflow volumetric flux increased and remained consistent for the remainder of the study period, with control trees generating ~50% more stemflow than girdled trees (p < 0.050). Over the entire study, control trees generated 1.7-times more stemflow than girdled trees (1563 ± 260 L m−2 vs. 930 ± 134 L m−2; p < 0.001).
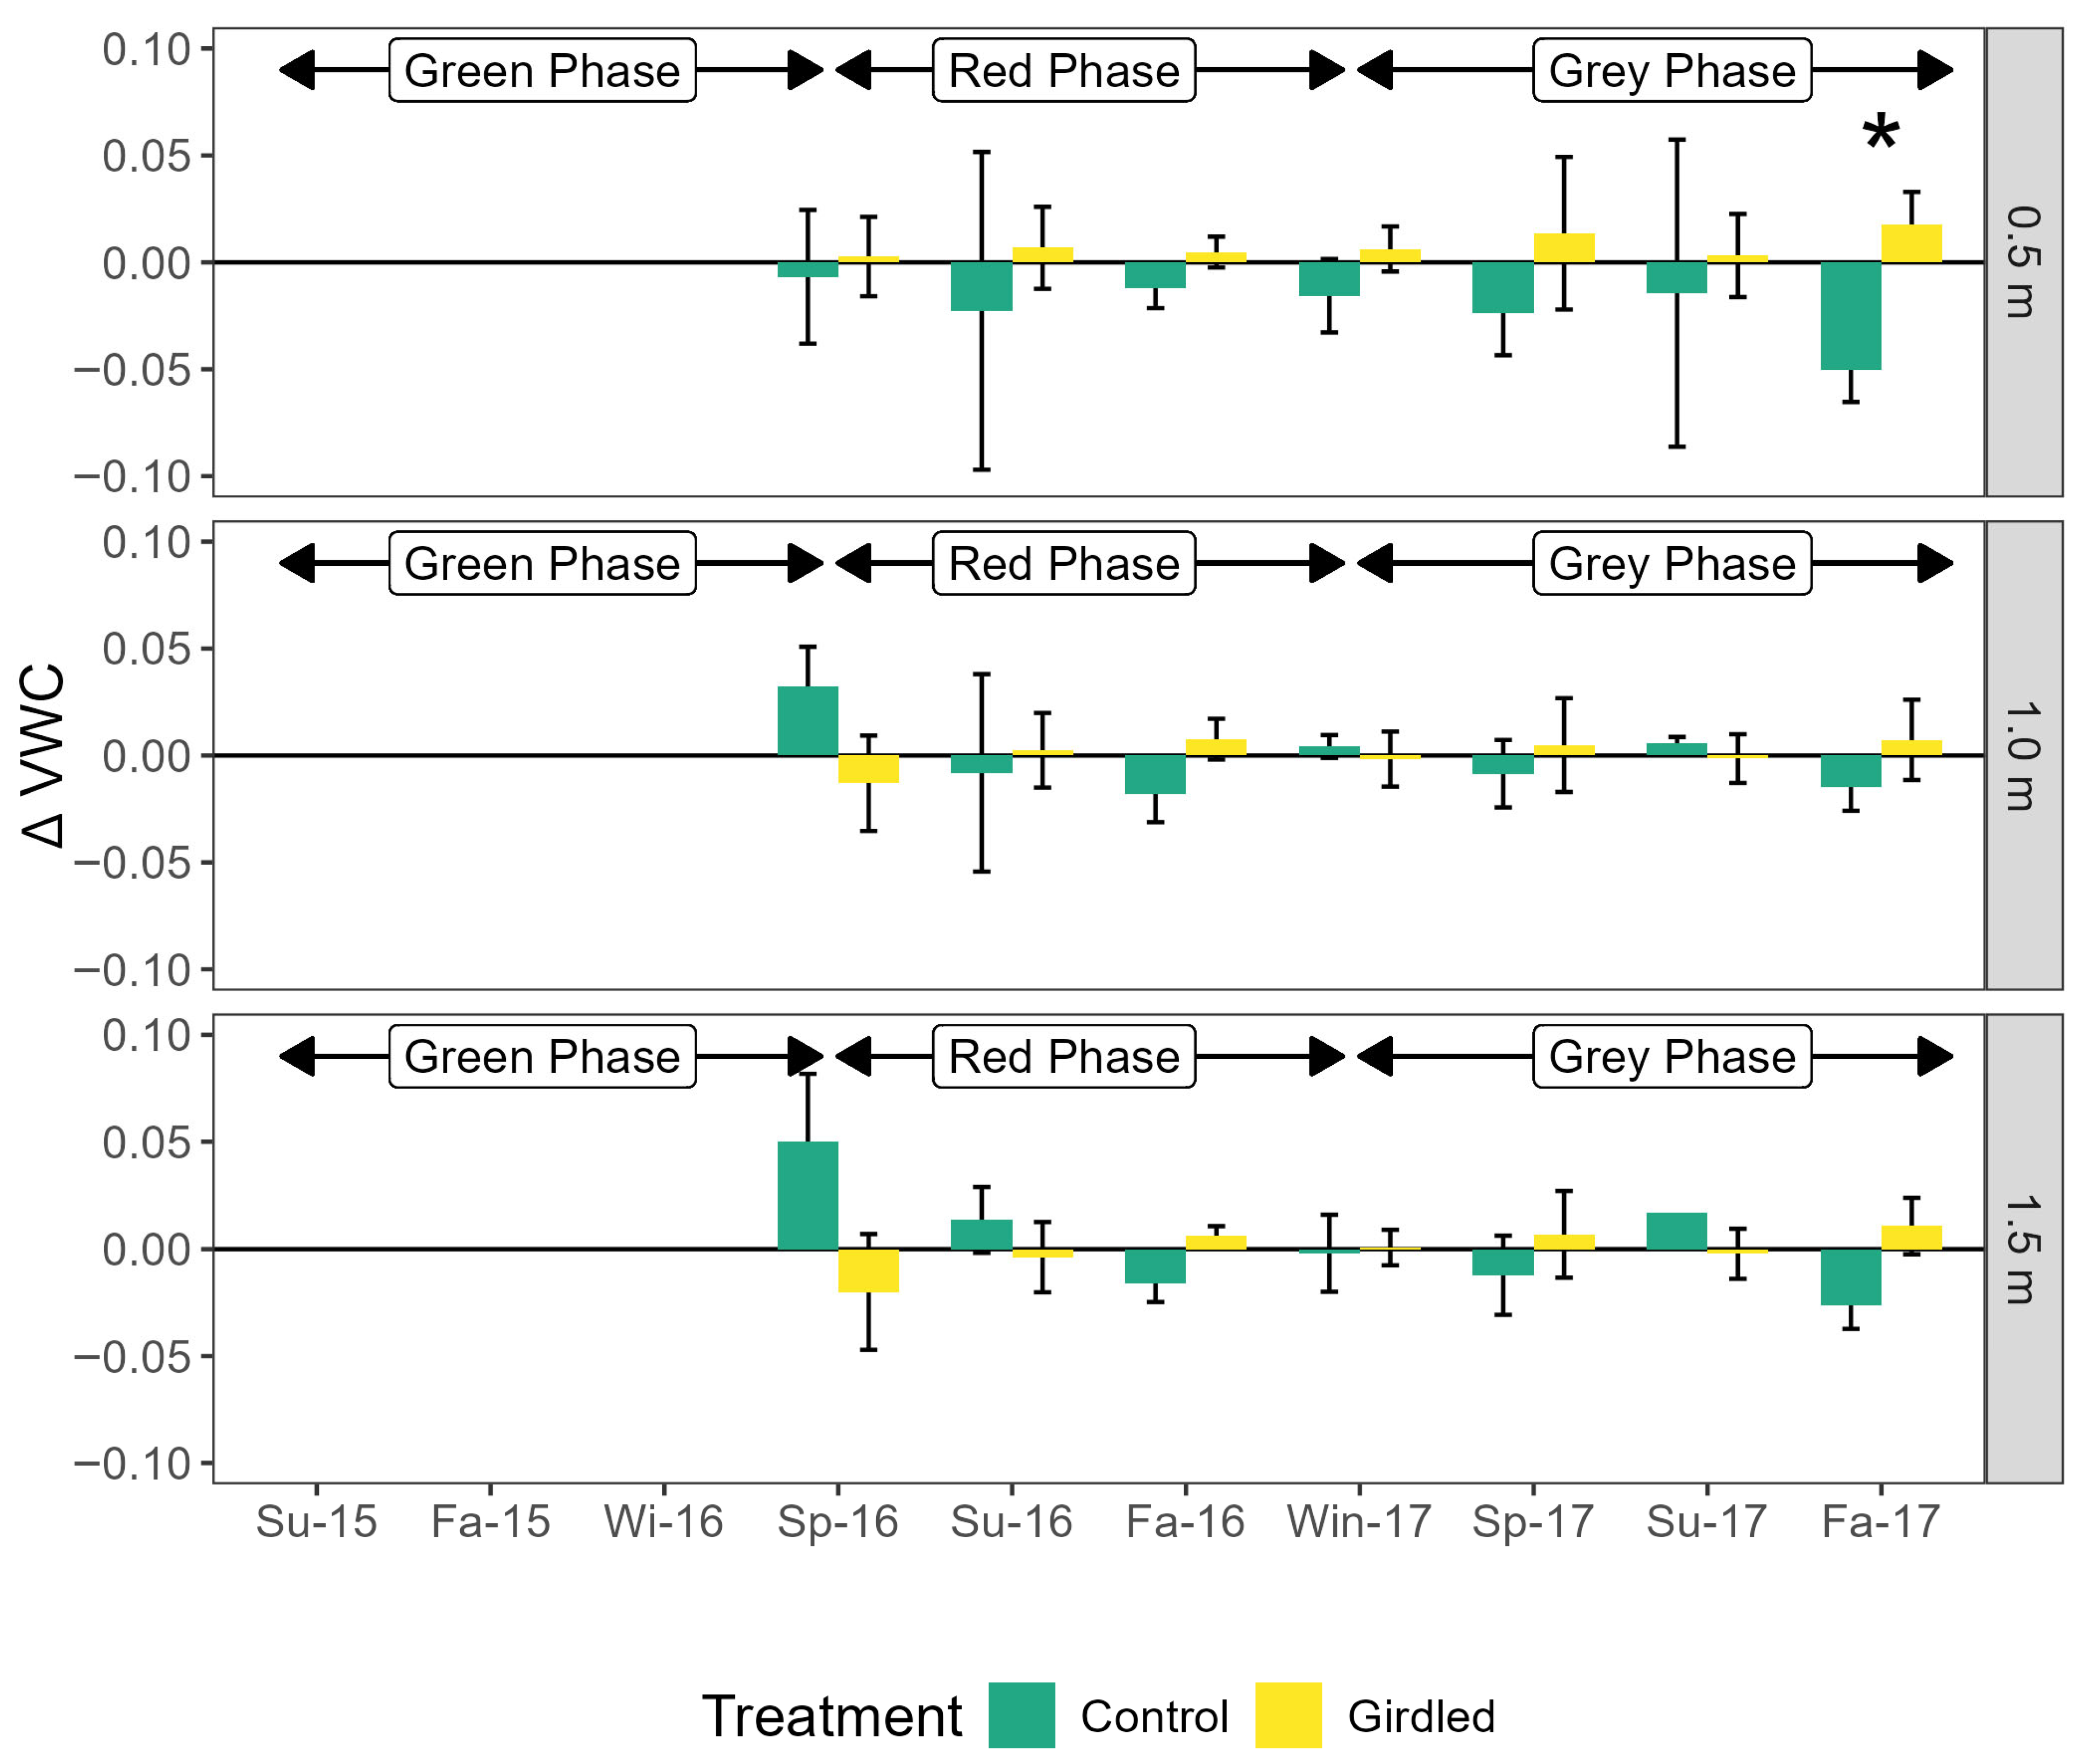
Soil volumetric water content was slightly higher in soils surrounding girdled trees than around control trees (0.268 ± 0.007 vs. 0.246 ± 0.012, p < 0.001). Across all sampling periods, soil volumetric water content was not different among the three different distances from the tree bole (p = 0.421). When evaluated within each season, soils around control trees were generally drier than average, while soils around girdled trees were generally wetter than average (Figure 5). However, it was not until late in the gray phase in Fall 2017 that soils around girdled trees were significantly wetter than soils around control trees. In particular, soils closest to tree boles (0.5 m distance) around girdled trees were 14% wetter (0.272 ± 0.012 vs. 0.232 ± 0.020, p = 0.021) while there were still no differences in soil moisture between treatments farther away from tree boles (1.0 m: p = 0.437; 1.5 m: p = 0.099) (Figure 5).

3.2. Canopy-Derived Biogeochemical Inputs and Soil Respiration

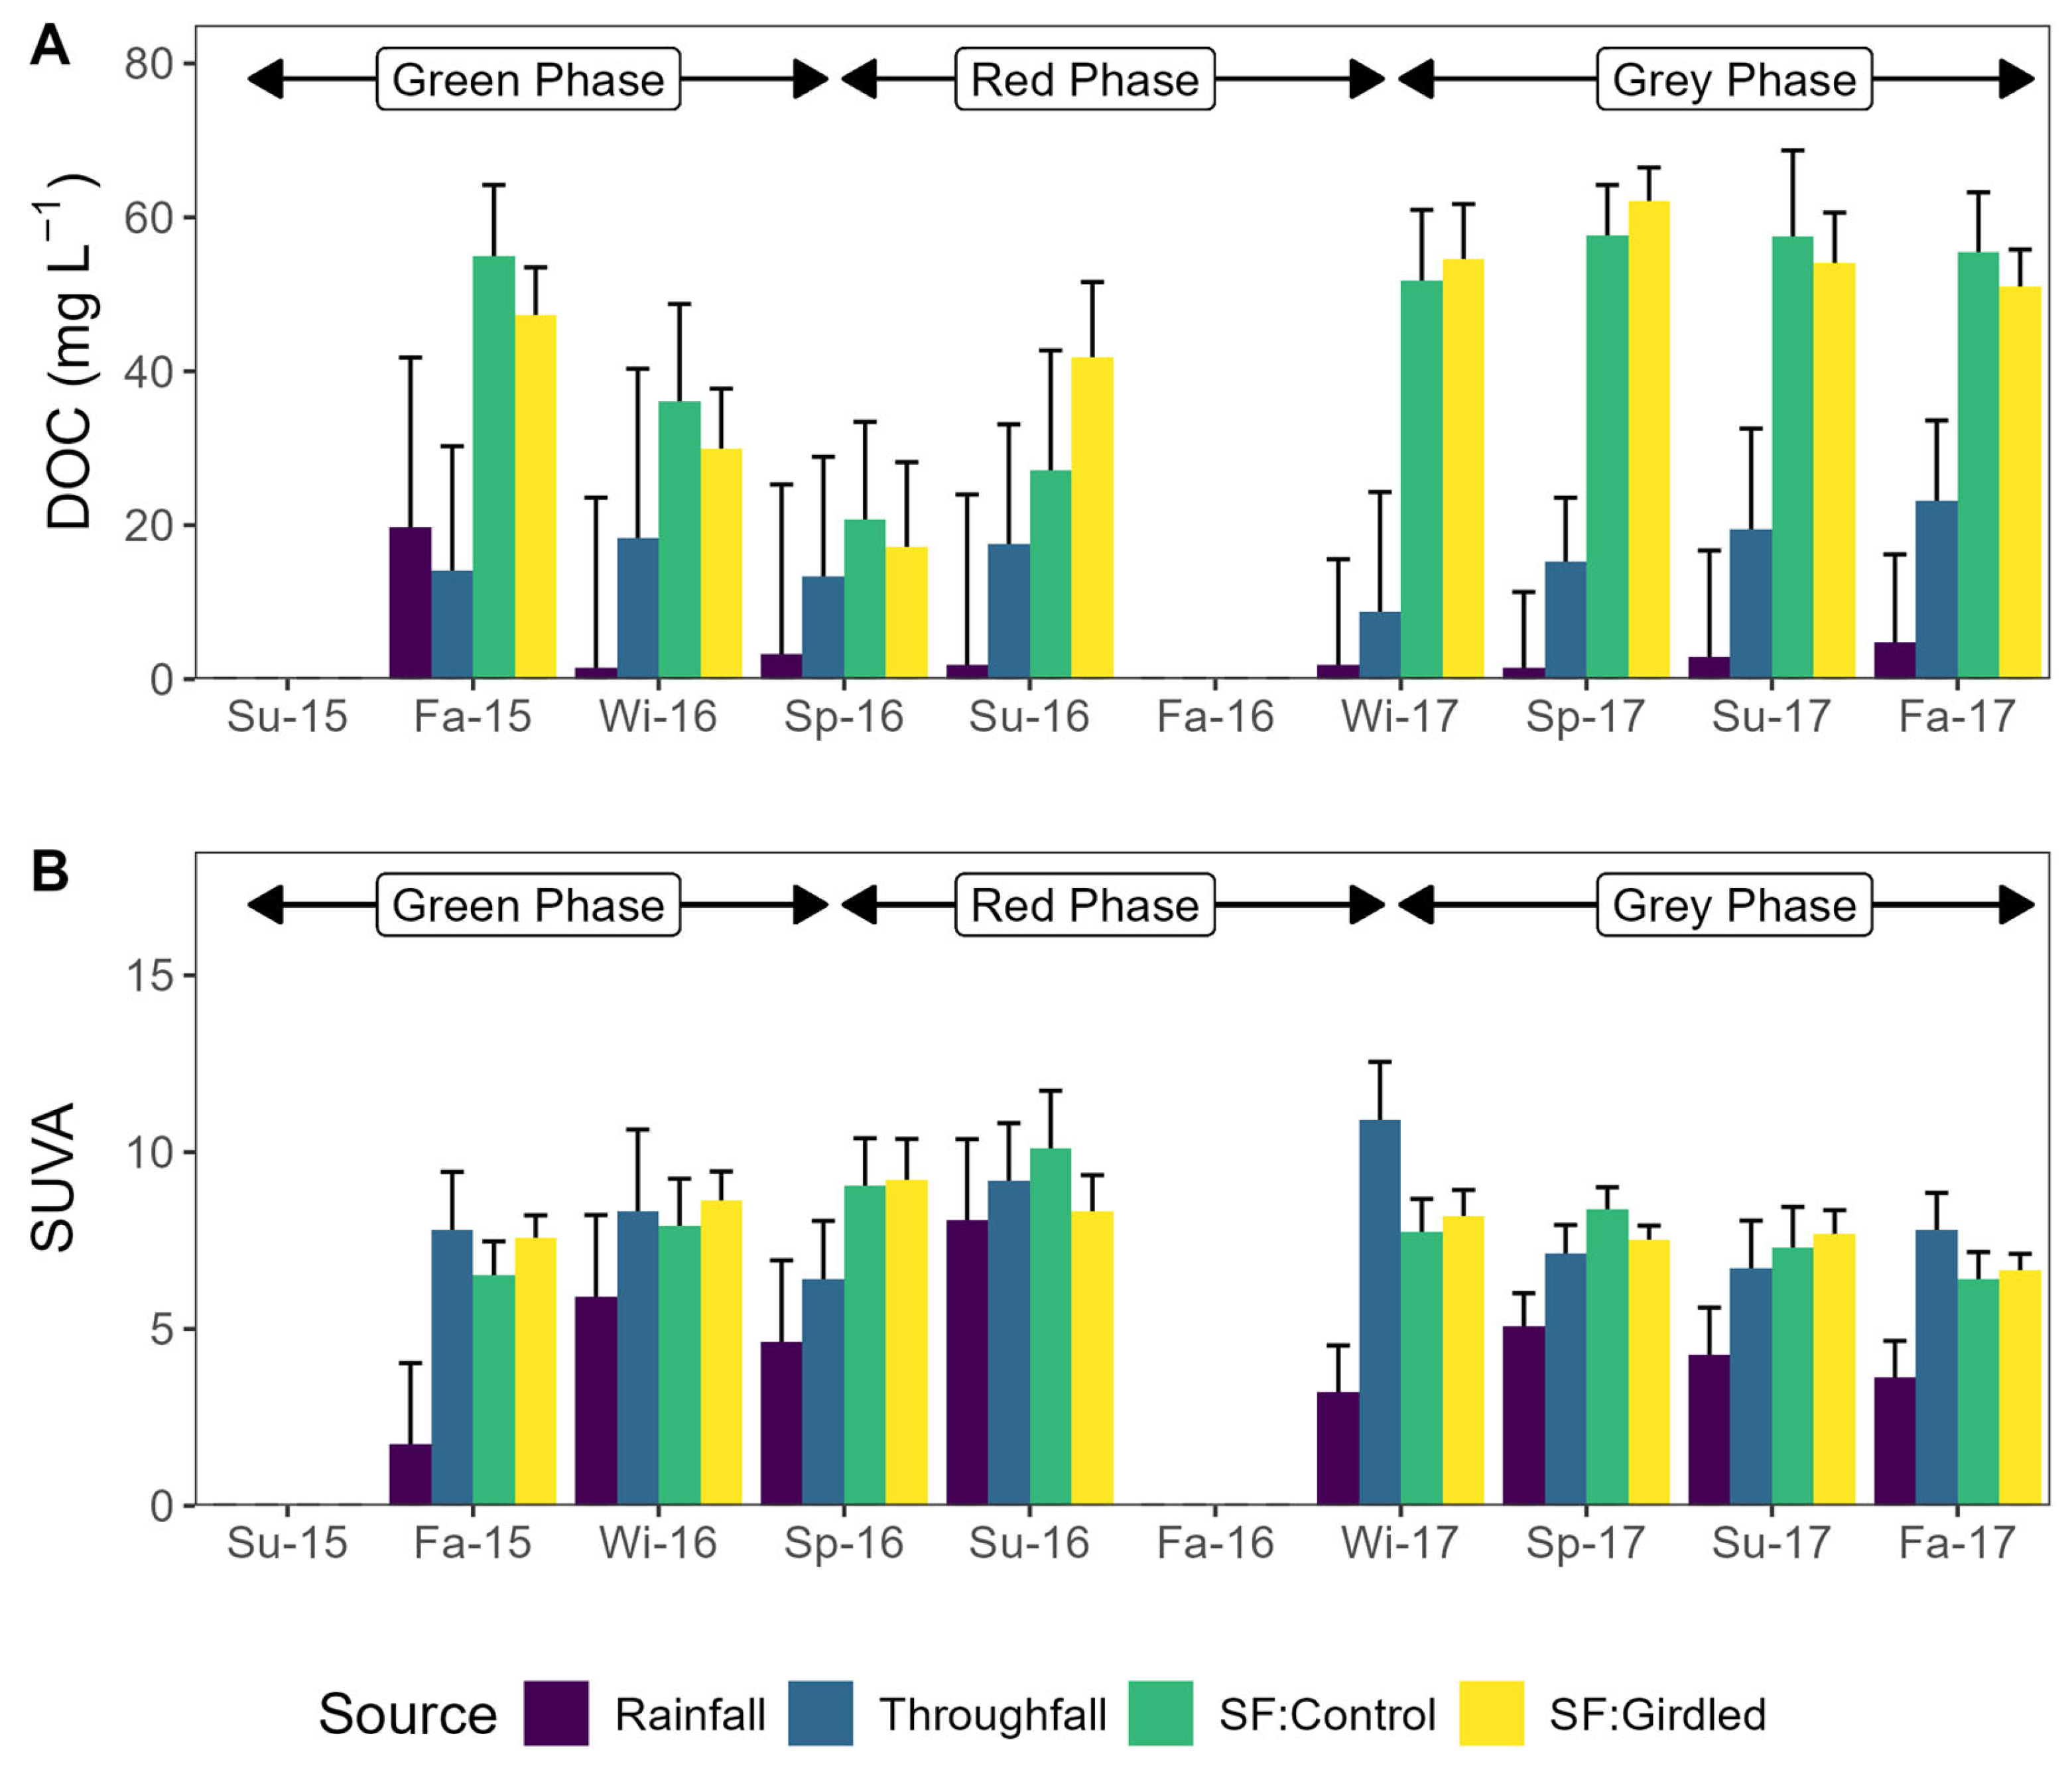
Stemflow dissolved organic carbon concentrations were 9.5-times higher than rainfall and 2.7-times higher than throughfall (Table 1). However, there was no significant difference in stemflow DOC between healthy trees and girdled trees throughout any period of measurement in the study (Figure 6A). The quality of dissolved carbon was also different in hydrologic pathways. SUVA values were approximately 2.6-times greater in both throughfall and stemflow compared to rainfall, indicating higher aromaticity (Table 1). However, there were no differences in SUVA in stemflow between control and girdled trees throughout the study (Figure 6B).
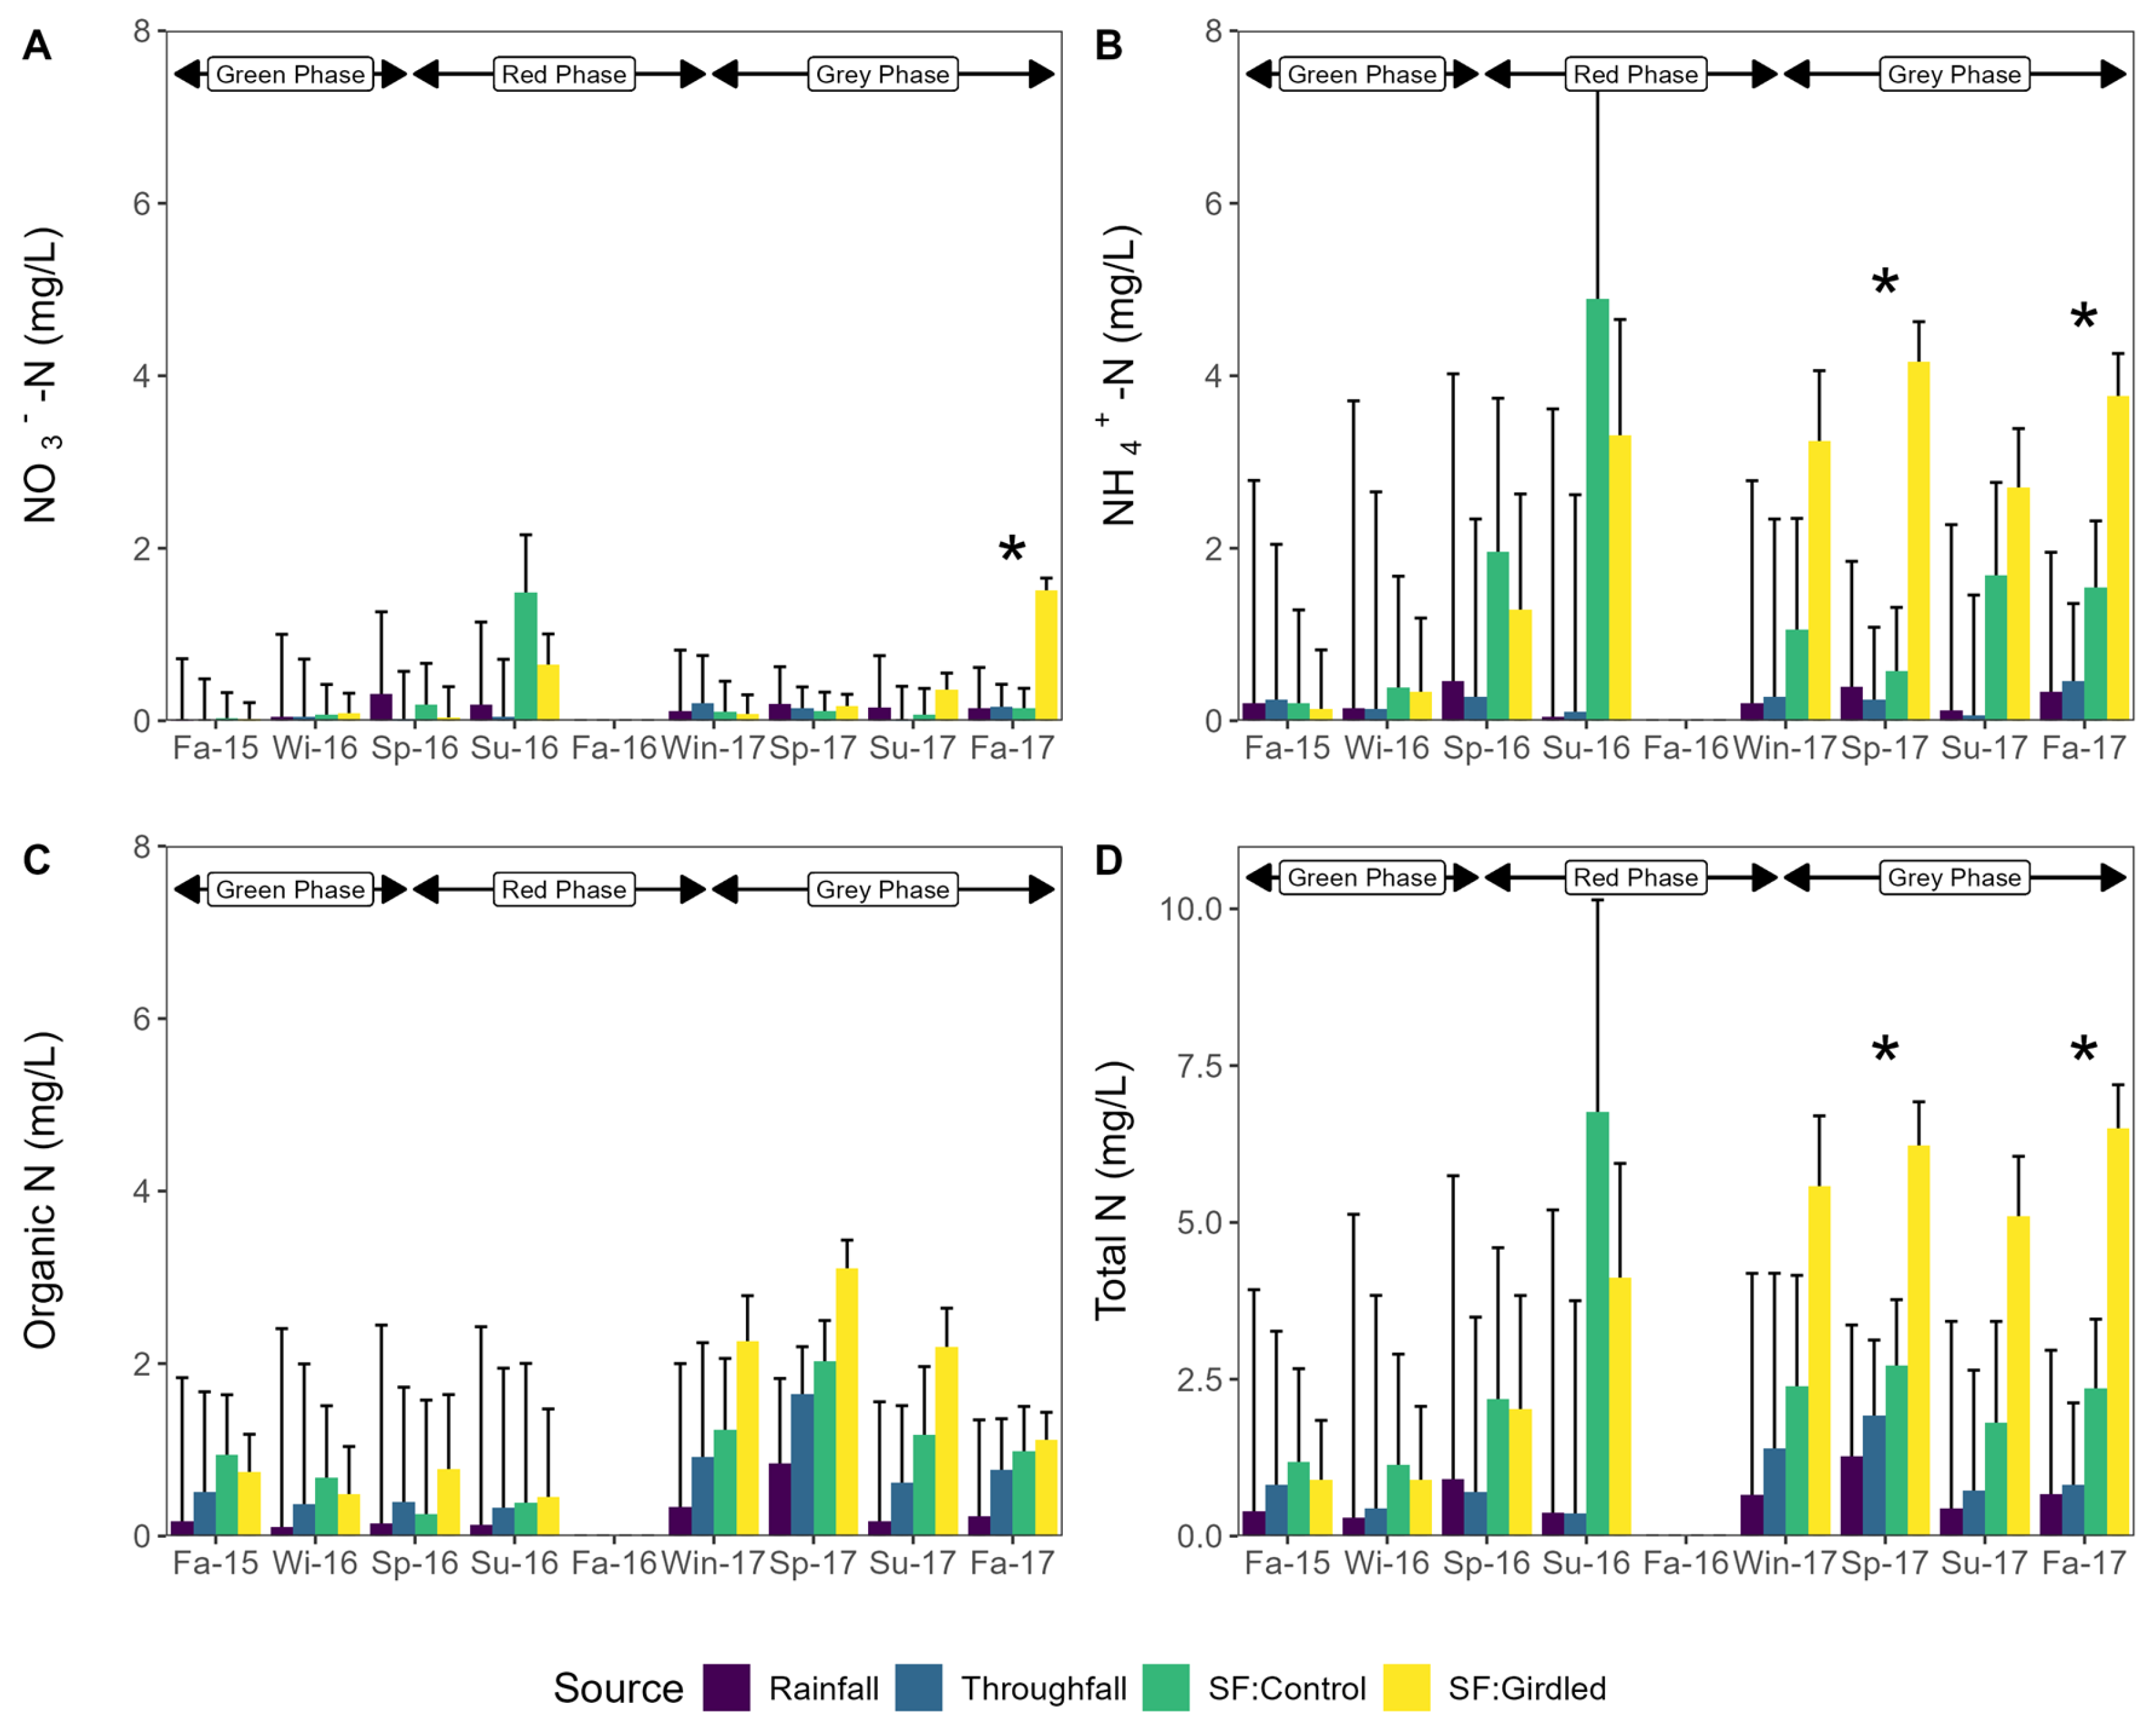
Nitrogen concentrations in stemflow and throughfall when pooled across time were not statistically different than rainfall in this study (Table 1). However, differences in stemflow nitrogen concentrations were observed between girdled and control trees once the trees entered the gray phase (Figure 7). This was largely driven by differences in N H 4 + –N concentrations that led to differences in total nitrogen flux. In particular, by the gray phase, N H 4 + –N and TN concentrations of stemflow collected in this phase were 2.4–7.2-times and 2.3–2.8-times higher in stemflow from girdled trees compared to control trees, respectively (Figure 7B,D). N O 3 –N concentrations were also 10.1-times higher in stemflow from girdled trees compared to control trees by the end of the study (Figure 7A). No differences in organic nitrogen concentrations were observed in stemflow across treatments at any point in the study (Figure 7C). Interestingly, organic nitrogen concentrations across all hydrologic pathways, including throughfall and stemflow, exhibited a modest increase (p = 0.066) following the prolonged drought at the end of 2016.
Total nutrient fluxes were calculated from nutrient concentrations with stemflow volume inputs between control and girdled trees (Table 2). Total DOC flux accumulated by the end of the study was 2.0-times greater in control trees compared to girdled trees (p = 0.030). This was largely driven by the greater total volume of stemflow generated by control trees. However, there were no differences among girdling treatments for any of the cumulative nitrogen fluxes among treatments. Instead, the greater nitrogen concentrations in stemflow from girdled trees were offset by the greater volume of stemflow from control trees.
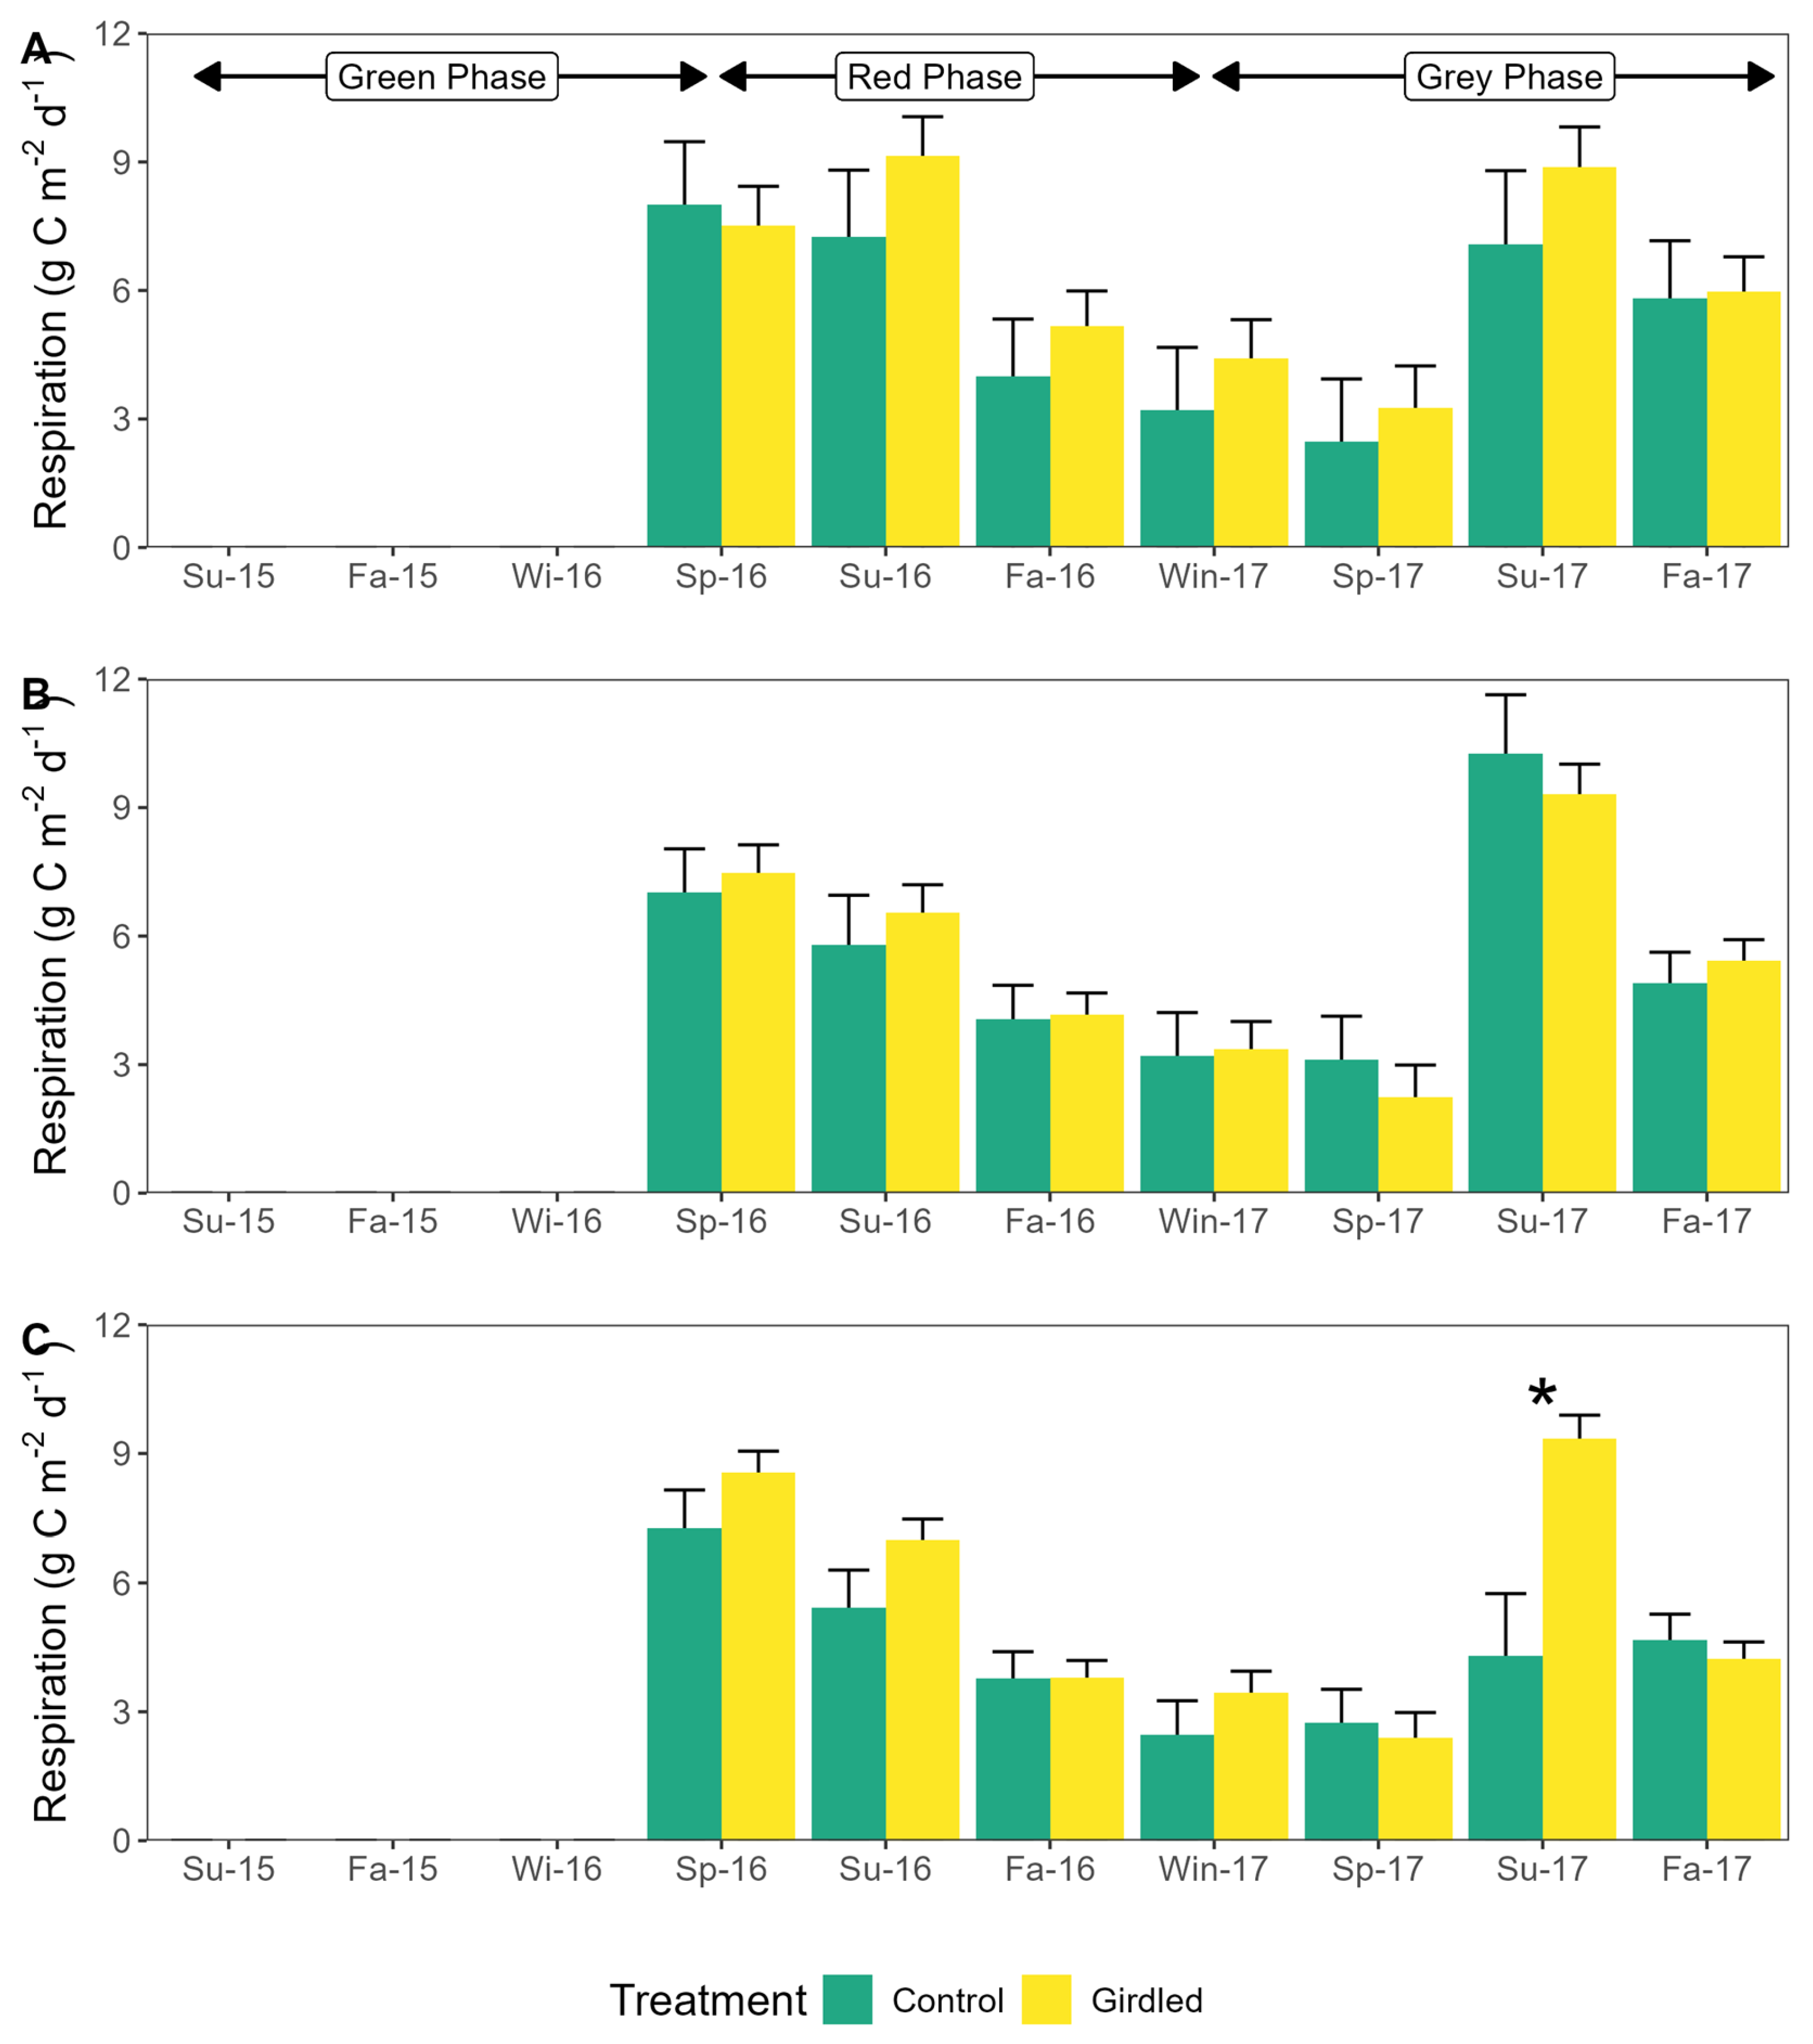
Lastly, there were no effects of distance from the tree bole (p = 0.134) or girdling treatment (p = 0.384) on soil respiration. Instead, differences in respiration were dominated by seasonality (p < 0.001). Only in the third growing season did differences appear in which soils at 1.5 m away from tree stems that were girdled were 2.2 times greater (p = 0.002, Figure 8C).

4. Discussion

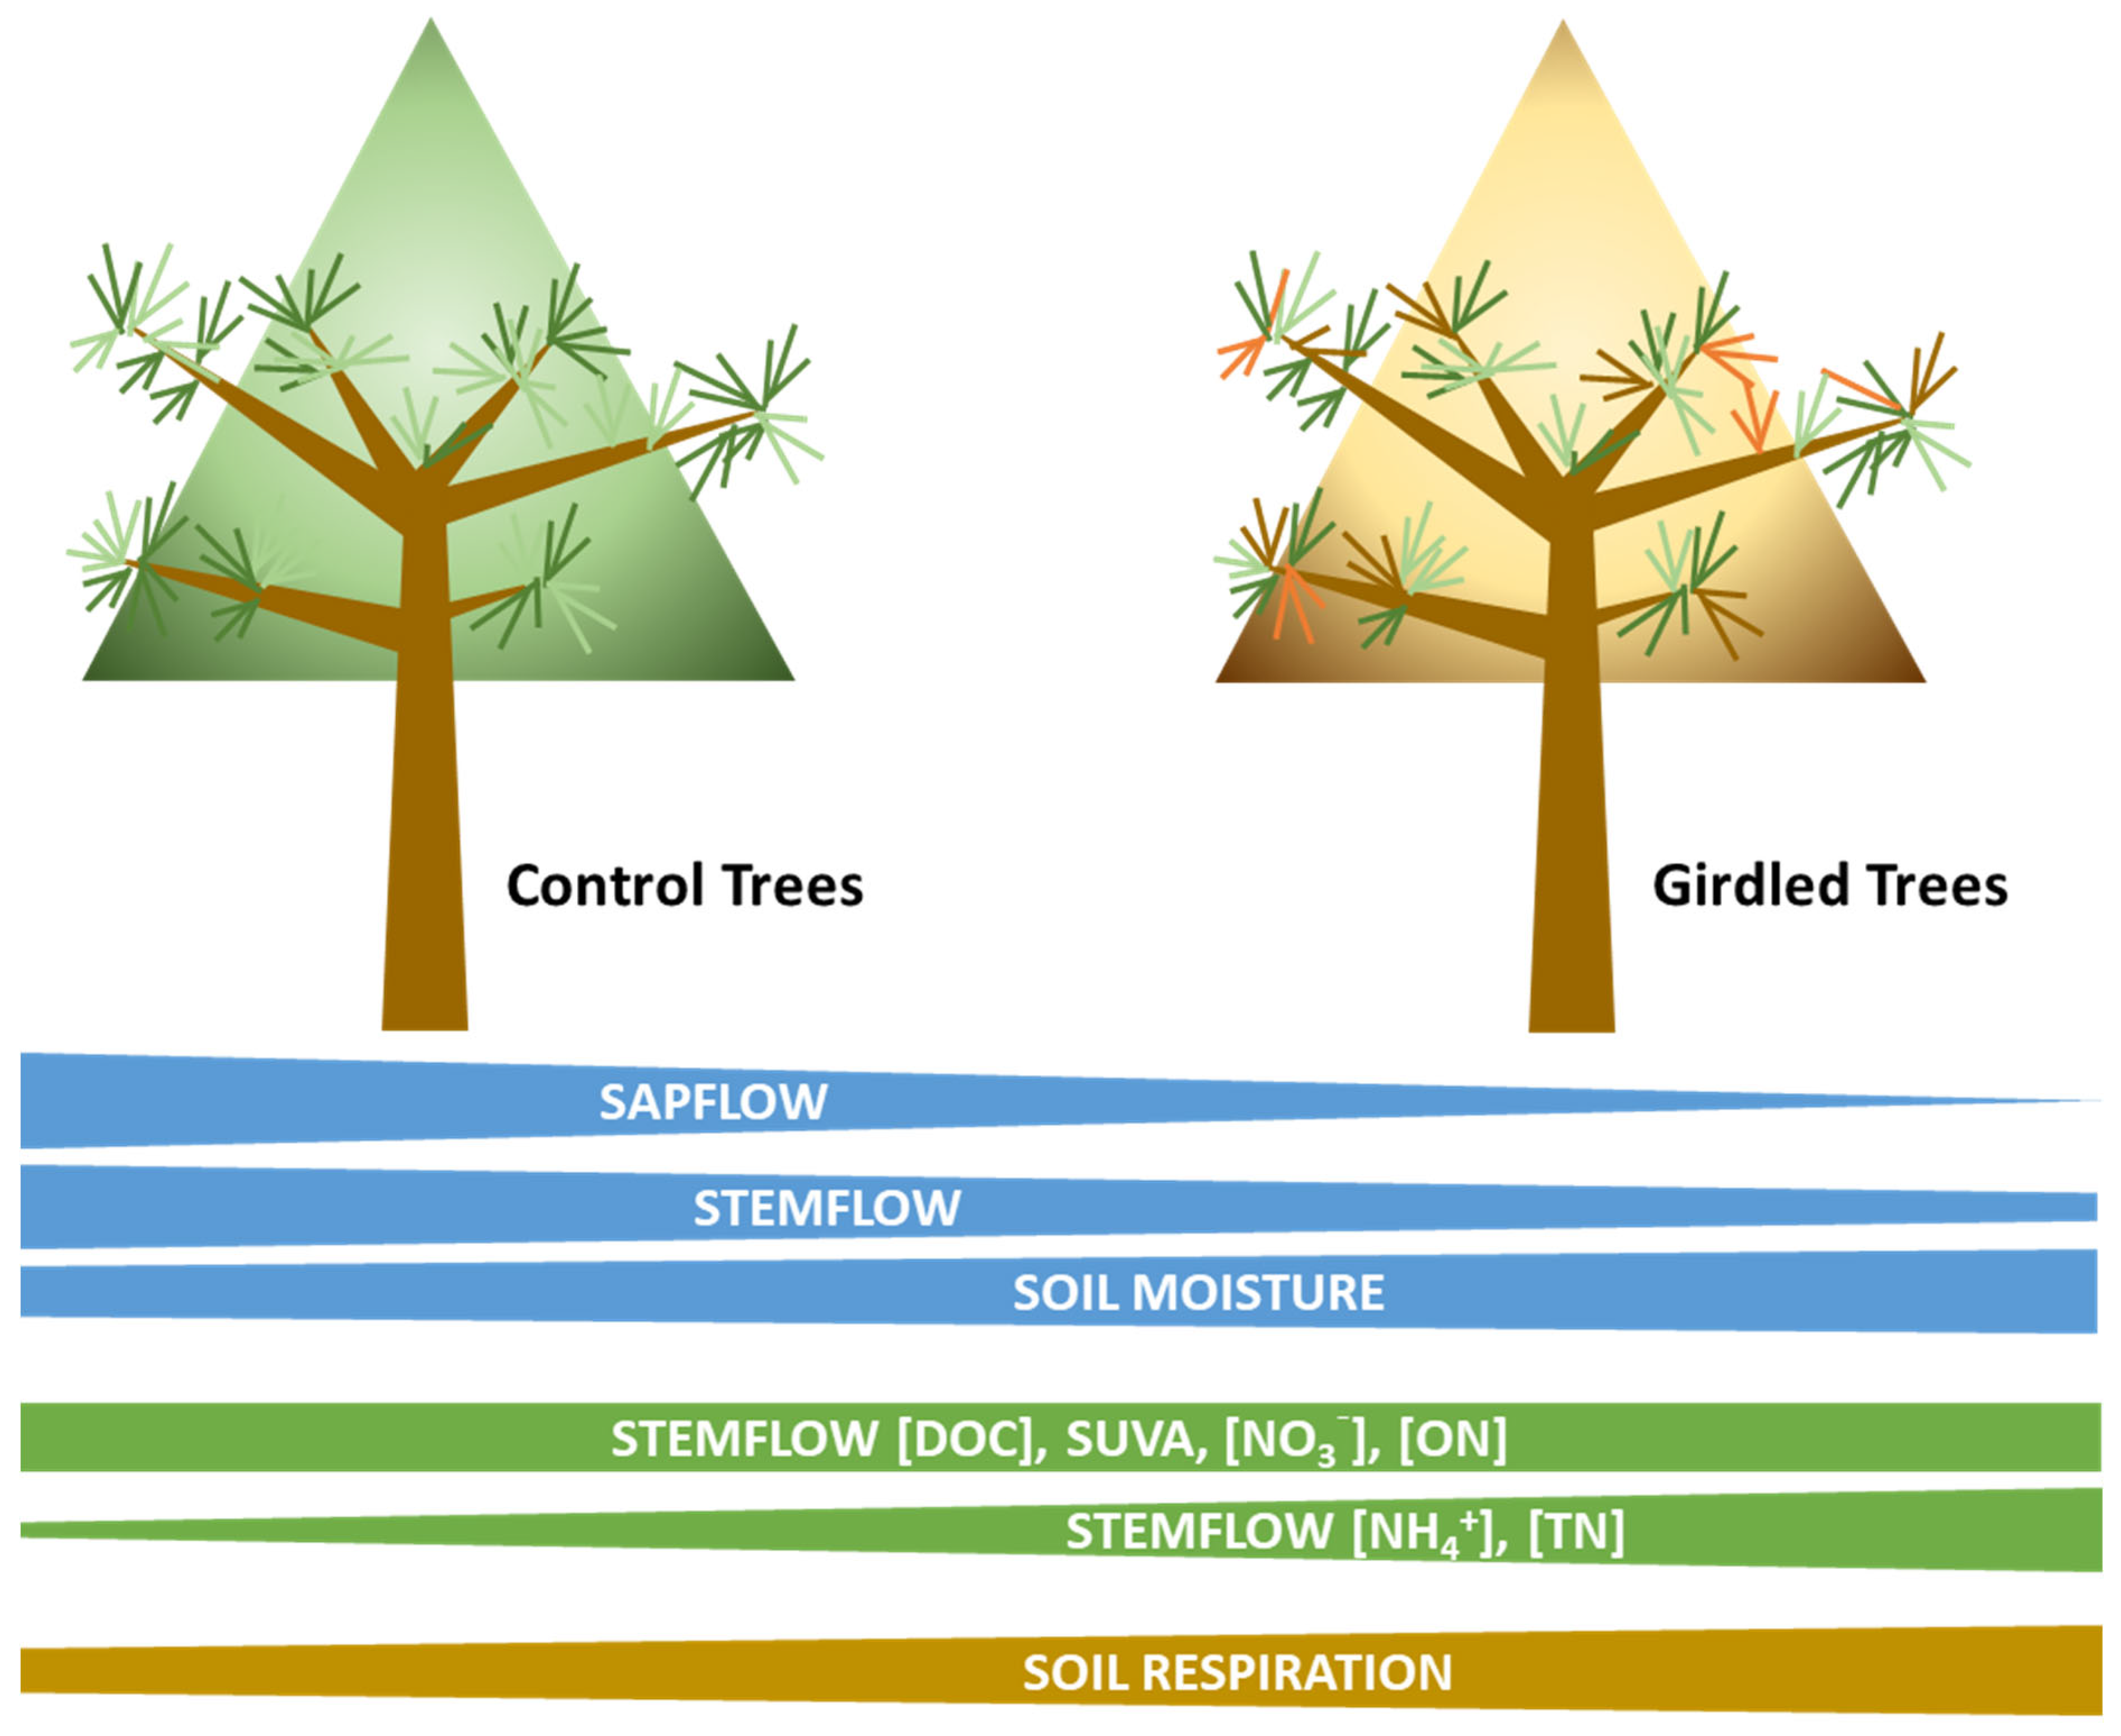
Bark beetles impact forests around the world, but their impact on ecological processes remains relatively understudied, particularly in the southeastern US [6]. In this study, we sought to quantify changes in hydrologic and soil processes using a simulated bark beetle attack by girdling trees, inoculation with blue-stain fungi, and comparing them to ungirdled healthy trees. We found that hydrologic and biogeochemical cycles were altered in girdled trees compared to non-girdled trees, but that blue-stain inoculation had no impact (Figure 9). Contrary to our predictions, we found limited differences in soil moisture between treatments throughout the first two years of the study, and stemflow actually decreased 1.7 times relative to control trees by the end of two years (Figure 4). Importantly, we found disconnects between the quality and quantity of stemflow with regard to carbon and nitrogen. In particular, greater stemflow nitrogen concentrations were negated by lower volumes of stemflow in girdled trees, while unchanged stemflow carbon concentrations resulted in lower total carbon fluxes as a result of lower volumes of stemflow in girdled trees.
These results suggest that changes in hydrologic and biogeochemical fluxes from bark-beetle-attacked trees are not evident in early stages of attack (e.g., green or red) but become apparent only after the trees transition to the gray phase. As trees die, water uptake and transpiration cease [31,60], yet stand regeneration following insect outbreaks may offset or even dwarf these reductions in water use [68,69]. The hydrologic response may be further altered by the presence of blue-stain fungi. Bark beetles vector these fungi, where they colonize sapwood and lead to rapid restriction in tree water uptake [70,71]. In our study, we did not detect a response in water uptake across fungal inoculation treatments, so it remains unknown whether the blue-stain fungi inoculation was unsuccessful or whether the act of girdling dominated the physiological trajectory of our experiment. However, evidence suggests that the net effect of tree mortality on water availability and watershed discharge also depends on interacting factors of death and regrowth [42,72].
Delayed hydrological and biogeochemical flux changes have similarly been observed in other conifer forests in North America and Europe [36,68,73,74,75], wherein the greatest effects are most strongly manifested in the gray phase. However, the rate at which attacked trees reach the gray phase in conifer forests in the eastern US is faster; 2 years in our study, compared to 4–10+ years elsewhere [68]. A confounding factor in our study was the significant drought that occurred one year after the girdling treatment, when trees had begun entering the red phase. No rainfall occurred during this critical period of mortality, and therefore left a gap in our understanding of canopy-derived fluxes in the red phase. As droughts become more common, forests may exhibit similar levels of stress compared to bark beetle attacks, impacting hydrology and the biogeochemical fluxes delivered to the forest floor. In the positive feedback cycle where droughts may increase bark beetle activity by increasing tree stress [76,77], even greater long-term impacts on forest biogeochemistry are likely to be observed.
Across broad landscapes, reductions in water uptake and transpiration, coupled with reductions in canopy interception of incident rainfall, lead to increased water availability, streamflow [68,78,79], and groundwater [7] in bark-beetle-attacked watersheds. We observed a decrease in sapflow during the initial stage of mortality (i.e., red phase), with a complete cessation of water transport by the end of the second growing season post-treatment, when trees entered the gray stage. However, we expected to see an increase in stemflow following mortality and needle loss. In general, stemflow increases as crown area increases [80], but more stemflow is generally observed during leafless canopy phases in deciduous trees because stems have a greater probability of intercepting rainfall and generating stemflow when foliar surfaces are absent [51]. In contrast, pines generate less stemflow than deciduous trees, so the loss of even a meager canopy likely impacted canopy contributions to stemflow generation [81]. In the one known study of stemflow and tree mortality, Frost and Levia [82] found that dead trees had 60-times less stemflow than living counterparts among hardwood species. Bark morphology of loblolly pine is complex, with bark plates layered on top of one another, resulting in higher porosity [83,84] that may be accessible to rainwater for bark water storage. Thus, as canopy foliage diminishes, rainwater access to bark water storage locations increases, which may further limit stemflow production. Additionally, we observed sawdust generation from secondary attacks on dead trees, which would suggest stems were becoming more porous and absorbing more incident rainwater. Therefore, a reduction in stemflow on bark-beetle-attacked trees may actually reduce biogeochemical inputs to soil and serve to inhibit decomposition around bark-beetle-attacked trees. In particular, while we observed no net change in nitrogen flux, we observed a decrease in total DOC fluxes from girdled trees, suggesting a reduction in carbon-based food sources for soil microbes [85,86]. This trend, coupled with lower soil moisture around girdled trees, is likely to further reduce soil microbial activity, impacting nutrient cycling and slowing rates of decomposition [87,88]. Further research is warranted to better understand decomposition trajectories of standing dead trees.
In this study, while there were no differences in stemflow C concentrations or the degree of C lability/recalcitrance, the reduction in total stemflow water from girdled trees resulted in a decrease in net C flux in stemflow. However, we did not observe any definitive response in soil respiration, suggesting that additional substrates beyond stemflow inputs are reaching soils and supporting microbial respiration throughout mortality. For example, fine roots and their mycorrhizal fungal associates release labile C into soil [89], whereby the death of trees and, subsequently, fine root systems halt this input of easily accessible carbon [90]. In our study, fine roots likely experienced mortality and turnover as a result of both tree mortality [91] and drought stress. This may have provided increased carbon for decomposer microbes, leading to an increase in their abundance and activity. Additionally, the turnover of fine roots may transfer nitrogen to the microbial soil biomass [92]. Alternatively, increased microbial stress could have also caused increased respiration, leading to the lack of differences between treatments. Regardless, at these time and spatial scales, CO2 flux from soils under simulated bark beetle attack did not differ from controls, suggesting that small bark beetle attacks are unlikely to have significant impacts on soil respiration rates.
Surprisingly, there were limited effects on soil moisture between girdling treatments despite the observed decrease in plant water uptake and decrease in stemflow associated with girdled trees. This suggests that the magnitude of these processes occurring simultaneously is roughly equivalent, leading to no net change in soil moisture between treatments. Additionally, throughfall volumes are likely higher in girdled trees, allowing for more precipitation to reach soils below trees. Alternatively, the small spatial extent of our study may have impeded any changes in soil moisture as the remaining healthy trees in the vicinity continued to transpire and provide shading [69], which could also moderate soil moisture. The role of drought experienced during the second year of the study also confounds our soil moisture response. However, the lack of change to soil moisture has been observed in other studies where the degree of tree mortality was manipulated, suggesting changes in water demand, canopy water partitioning, and energy availability offset any changes in soil moisture [93].

5. Conclusions

This study examined how small-scale bark beetle outbreak spots in the southeastern US impact ecological processes throughout tree mortality by simulating bark beetle attack with girdling treatments. The largest differences between control and girdled trees occurred once trees entered the gray phase. Few studies examine both short- and long-term impacts of bark beetles on ecological processes, and these data are particularly scarce from the southeastern US. Southern pine beetles are increasing their range into New England states [94] and continue to have massive outbreaks in Central America and in poorly managed forests in the southeastern US [28]. Understanding how bark-beetle-killed trees impact forest ecosystems is thus increasingly important.
By chance, this study also incorporated the impacts of drought on hydrologic and biogeochemical processes post-bark-beetle attack. A four-month extreme drought had negative impacts on canopy-derived C and N transport and soil moisture, rendering responses of control trees similar to bark-beetle-attacked trees and possibly masking the effect of mortality. Directly, climate change is facilitating range expansion of bark beetles [2], while indirectly, climate change is increasing the frequency and intensity of droughts [95,96], which further facilitates tree susceptibility to attack from some bark beetles [97]. Yet the interaction between drought and bark-beetle-derived tree mortality on ecological processes has received little attention in the eastern US. Our results suggest that droughts may increase the negative impacts of bark beetle attacks by rendering non-attacked trees similar to bark-beetle-killed trees even one year post drought.
Our understanding of the impacts of pine beetle outbreaks on ecosystem structure and function is largely guided by research based on the devastating outbreaks occurring in the western US. Smaller spots of southern pine beetle activity are common in the southeastern US, particularly in recent years due to what is hypothesized to be better forest management practices, although large outbreaks in forests with limited management are currently ongoing. Thus, this study provides realistic and needed data on ecological processes at two years and smaller spatial scales. Given the widespread impact of the southern pine beetle on forest ecosystems throughout the southeastern US, it is critical for management and planning activities to understand the role of these disturbances.

Supplementary Materials

The following supporting information can be downloaded at: https://www.mdpi.com/article/10.3390/f17020211/s1.

Author Contributions

Conceptualization, C.M.S., H.J.R., J.J.R. and N.A.C.; methodology, C.M.S., H.J.R., J.J.R. and N.A.C.; formal analysis, C.M.S.; investigation, C.M.S., H.J.R. and N.J.H.; resources, C.M.S. and P.D.; writing—original draft preparation, C.M.S.; writing—review and editing, C.M.S., H.J.R., N.J.H., P.D., J.J.R. and N.A.C. All authors have read and agreed to the published version of the manuscript.

Funding

This work is a contribution of the Forest and Wildlife Research Center and the Mississippi Agricultural and Forestry Experiment Station, Mississippi State University. This work was funded through the National Science Foundation (DEB #1660346) and supported by the National Institute of Food and Agriculture, United States Department of Agriculture, Mclntire Stennis capacity grant #MISZ-069390 and Hatch project #311330. Any opinions, findings, conclusions, or recommendations expressed in this publication are those of the authors and do not necessarily reflect the views of the United States Department of Agriculture.

Data Availability Statement

The original contributions presented in this study are included in the Supplementary Materials. Further inquiries can be directed to the corresponding author.

Acknowledgments

The authors would like to thank A.A. Sasith Karunarathna, Juliet Tang, Brent Chaney, Mercedes Siegle-Gaither, and Jacob Landfield for field and laboratory support. We would also like to thank Misty Booth, at the John W. Starr Memorial Forest, where this work was conducted.

Conflicts of Interest

J.R. is an inventor on a patent involving blue-stain fungi in baiting methods for termites (US9924706B2). The author and his institution may financially benefit from this patent.

References

  1. Peltonen, M.; Liebhold, A.M.; Bjørnstad, O.N.; Williams, D.W. Spatial Synchrony in Forest Insect Outbreaks: Roles of Regional Stochasticity and Dispersal. Ecology 2002, 83, 3120–3129. [Google Scholar] [CrossRef]
  2. Kurz, W.A.; Dymond, C.C.; Stinson, G.; Rampley, G.J.; Neilson, E.T.; Carroll, A.L.; Ebata, T.; Safranyik, L. Mountain Pine Beetle and Forest Carbon Feedback to Climate Change. Nature 2008, 452, 987–990. [Google Scholar] [CrossRef] [PubMed]
  3. Heliasz, M.; Johansson, T.; Lindroth, A.; Mölder, M.; Mastepanov, M.; Friborg, T.; Callaghan, T.V.; Christensen, T.R. Quantification of C Uptake in Subarctic Birch Forest after Setback by an Extreme Insect Outbreak. Geophys. Res. Lett. 2011, 38, L01704. [Google Scholar] [CrossRef]
  4. Mikkelson, K.M.; Lozupone, C.A.; Sharp, J.O. Altered Edaphic Parameters Couple to Shifts in Terrestrial Bacterial Community Structure Associated with Insect-Induced Tree Mortality. Soil Biol. Biochem. 2016, 95, 19–29. [Google Scholar] [CrossRef]
  5. Edburg, S.L.; Hicke, J.A.; Brooks, P.D.; Pendall, E.G.; Ewers, B.E.; Norton, U.; Gochis, D.; Gutmann, E.D.; Meddens, A.J. Cascading Impacts of Bark Beetle-Caused Tree Mortality on Coupled Biogeophysical and Biogeochemical Processes. Front. Ecol. Environ. 2012, 10, 416–424. [Google Scholar] [CrossRef]
  6. Siegert, C.; Clay, N.; Pace, K.; Vissa, S.; Hofstetter, R.W.; Leverón, O.; Riggins, J.J. Bark Beetle-Driven Community and Biogeochemical Impacts in Forest Ecosystems: A Review. Ann. Entomol. Soc. Am. 2024, 117, 163–183. [Google Scholar] [CrossRef]
  7. Bearup, L.A.; Maxwell, R.M.; Clow, D.W.; McCray, J.E. Hydrological Effects of Forest Transpiration Loss in Bark Beetle-Impacted Watersheds. Nat. Clim. Change 2014, 4, 481–486. [Google Scholar] [CrossRef]
  8. Morris, J.L.; Cottrell, S.; Fettig, C.J.; Hansen, W.D.; Sherriff, R.L.; Carter, V.A.; Clear, J.L.; Clement, J.; DeRose, R.J.; Hicke, J.A.; et al. Managing Bark Beetle Impacts on Ecosystems and Society: Priority Questions to Motivate Future Research. J. Appl. Ecol. 2017, 54, 750–760. [Google Scholar] [CrossRef]
  9. Hlásny, T.; König, L.; Krokene, P.; Lindner, M.; Montagné-Huck, C.; Müller, J.; Qin, H.; Raffa, K.F.; Schelhaas, M.-J.; Svoboda, M.; et al. Bark Beetle Outbreaks in Europe: State of Knowledge and Ways Forward for Management. Curr. For. Rep. 2021, 7, 138–165. [Google Scholar] [CrossRef]
  10. Singh, V.V.; Naseer, A.; Mogilicherla, K.; Trubin, A.; Zabihi, K.; Roy, A.; Jakuš, R.; Erbilgin, N. Understanding Bark Beetle Outbreaks: Exploring the Impact of Changing Temperature Regimes, Droughts, Forest Structure, and Prospects for Future Forest Pest Management. Rev. Environ. Sci. Bio/Technol. 2024, 23, 257–290. [Google Scholar] [CrossRef]
  11. Coulson, R.N.; Klepzig, K. Southern Pine Beetle II; General Technical Report SRS-140; Southern Research Station, Forest Service, U.S. Department of Agriculture: Asheville, NC, USA, 2011; Volume 140, 512p.
  12. Clarke, S.R.; Riggins, J.J.; Stephen, F.M. Forest Management and Southern Pine Beetle Outbreaks: A Historical Perspective. For. Sci. 2016, 62, 166–180. [Google Scholar] [CrossRef]
  13. Potter, K.M.; Conkling, B.L. Forest Health Monitoring: National Status, Trends, and Analysis 2014. In General Technical Report SRS-209; Southern Research Station, Forest Service, U.S. Department of Agriculture: Asheville, NC, USA, 2015; Volume 209, 190p. [Google Scholar] [CrossRef]
  14. Asaro, C.; Nowak, J.T.; Elledge, A. Why Have Southern Pine Beetle Outbreaks Declined in the Southeastern U.S. with the Expansion of Intensive Pine Silviculture? A Brief Review of Hypotheses. For. Ecol. Manag. 2017, 391, 338–348. [Google Scholar] [CrossRef]
  15. Francke-Grosmann, H. Ectosymbiosis in Wood-Inhabiting Insects. In Associations of Invertebrates, Birds, Ruminants, and Other Biota; Henry, S.M., Ed.; Academic Press: Cambridge, MA, USA, 1967; pp. 141–205. [Google Scholar]
  16. Spatafora, J.W.; Blackwell, M. The Polyphyletic Origins of Ophiostomatoid Fungi. Mycol. Res. 1994, 98, 1–9. [Google Scholar] [CrossRef]
  17. Six, D.L.; Wingfield, M.J. The Role of Phytopathogenicity in Bark Beetle–Fungus Symbioses: A Challenge to the Classic Paradigm. Annu. Rev. Entomol. 2011, 56, 255–272. [Google Scholar] [CrossRef] [PubMed]
  18. Zaman, R.; May, C.; Ullah, A.; Erbilgin, N. Bark Beetles Utilize Ophiostomatoid Fungi to Circumvent Host Tree Defenses. Metabolites 2023, 13, 239. [Google Scholar] [CrossRef]
  19. Little, N.S.; Blount, N.A.; Londo, A.J.; Kitchens, S.C.; Schultz, T.P.; McConnell, T.E.; Riggins, J.J. Preference of Formosan Subterranean Termites for Blue-Stained Southern Yellow Pine Sapwood. J. Econ. Entomol. 2012, 105, 1640–1644. [Google Scholar] [CrossRef] [PubMed]
  20. Clay, N.A.; Little, N.; Riggins, J.J. Inoculation of Ophiostomatoid Fungi in Loblolly Pine Trees Increases the Presence of Subterranean Termites in Fungal Lesions. Arthropod-Plant Interact. 2017, 11, 213–219. [Google Scholar] [CrossRef]
  21. Clay, N.A.; Siegert, C.; Tang, J.D.; Little, N.S.; Eckhardt, L.G.; Riggins, J.J. Termite Presence and Feeding on Loblolly Pine Wood Differs among Four Root-Infecting Bluestain (Ophiostomatoid) Fungal Species. Environ. Entomol. 2021, 50, 1118–1126. [Google Scholar] [CrossRef]
  22. Siegert, C.M.; Clay, N.A.; Tang, J.D.; Garrigues, L.G.; Riggins, J.J. Indirect Effects of Bark Beetle-Generated Dead Wood on Biogeochemical and Decomposition Processes in a Pine Forest. Oecologia 2018, 188, 1209–1226. [Google Scholar] [CrossRef]
  23. Clay, N.A.; Tang, J.D.; Siegert, C.M.; Thomason, J.T.; Benedetto, N.; Day, D.; Pace, K.; Leverón, O.; Hofstetter, R.W.; Riggins, J.J. Decomposition of Bark Beetle-Attacked Trees after Mortality Varies across Forests. For. Ecol. Manag. 2024, 553, 121636. [Google Scholar] [CrossRef]
  24. Pye, J.M.; Holmes, T.P.; Prestemon, J.P.; Wear, D.N. Economic impacts of the southern pine beetle. In Southern Pine Beetle II; General Technical Report SRS-140; Coulson, R.N., Klepzig, K.D., Eds.; Southern Research Station, Forest Service, U.S. Department of Agriculture: Asheville, NC, USA, 2011; Volume 140, pp. 213–222. [Google Scholar]
  25. Crosby, M.K.; McConnell, T.E.; Holderieath, J.J.; Meeker, J.R.; Steiner, C.A.; Strom, B.L.; Johnson, C. Tracking the Extent and Impacts of a Southern Pine Beetle (Dendroctonus frontalis) Outbreak in the Bienville National Forest. Forests 2023, 14, 22. [Google Scholar] [CrossRef]
  26. Schowalter, T.D.; Coulson, R.N.; Crossley, D.A. Role of Southern Pine Beetle and Fire in Maintenance of Structure and Function of the Southeastern Coniferous Forest. Environ. Entomol. 1981, 10, 821–825. [Google Scholar] [CrossRef]
  27. Clarke, S. Implications of Population Phases on the Integrated Pest Management of the Southern Pine Beetle, Dendroctonus frontalis. J. Integr. Pest Manag. 2012, 3, F1–F7. [Google Scholar] [CrossRef]
  28. Nowak, J.T.; Meeker, J.R.; Coyle, D.R.; Steiner, C.A.; Brownie, C. Southern Pine Beetle Infestations in Relation to Forest Stand Conditions, Previous Thinning, and Prescribed Burning: Evaluation of the Southern Pine Beetle Prevention Program. J. For. 2015, 113, 454–462. [Google Scholar] [CrossRef]
  29. Dodds, K.J.; Aoki, C.F.; Arango-Velez, A.; Cancelliere, J.; D’Amato, A.W.; DiGirolomo, M.F.; Rabaglia, R.J. Expansion of Southern Pine Beetle into Northeastern Forests: Management and Impact of a Primary Bark Beetle in a New Region. J. For. 2018, 116, 178–191. [Google Scholar] [CrossRef]
  30. Xiong, Y.; D’Atri, J.J.; Fu, S.; Xia, H.; Seastedt, T.R. Rapid Soil Organic Matter Loss from Forest Dieback in a Subalpine Coniferous Ecosystem. Soil Biol. Biochem. 2011, 43, 2450–2456. [Google Scholar] [CrossRef]
  31. Hubbard, R.M.; Rhoades, C.C.; Elder, K.; Negron, J. Changes in Transpiration and Foliage Growth in Lodgepole Pine Trees Following Mountain Pine Beetle Attack and Mechanical Girdling. For. Ecol. Manag. 2013, 289, 312–317. [Google Scholar] [CrossRef]
  32. Mikkelson, K.M.; Bearup, L.A.; Maxwell, R.M.; Stednick, J.D.; McCray, J.E.; Sharp, J.O. Bark Beetle Infestation Impacts on Nutrient Cycling, Water Quality and Interdependent Hydrological Effects. Biogeochemistry 2013, 115, 1–21. [Google Scholar] [CrossRef]
  33. Gomez, D.F.; Sathyapala, S.; Hulcr, J. Towards Sustainable Forest Management in Central America: Review of Southern Pine Beetle (Dendroctonus frontalis Zimmermann) Outbreaks, Their Causes, and Solutions. Forests 2020, 11, 173. [Google Scholar] [CrossRef]
  34. Bright, B.C.; Hicke, J.A.; Meddens, A.J.H. Effects of Bark Beetle-Caused Tree Mortality on Biogeochemical and Biogeophysical MODIS Products. J. Geophys. Res. Biogeosci. 2013, 118, 974–982. [Google Scholar] [CrossRef]
  35. Morehouse, K.; Johns, T.; Kaye, J.; Kaye, M. Carbon and Nitrogen Cycling Immediately Following Bark Beetle Outbreaks in Southwestern Ponderosa Pine Forests. For. Ecol. Manag. 2008, 255, 2698–2708. [Google Scholar] [CrossRef]
  36. Kopáček, J.; Čapek, P.; Choma, M.; Cudlín, P.; Kaňa, J.; Kopáček, M.; Porcal, P.; Šantrůčková, H.; Tahovská, K.; Turek, J. Long-Term Changes in Soil Composition in Unmanaged Central European Mountain Spruce Forests after Decreased Acidic Deposition and a Bark Beetle Outbreak. Catena 2023, 222, 106839. [Google Scholar] [CrossRef]
  37. Griffin, J.M.; Turner, M.G.; Simard, M. Nitrogen Cycling Following Mountain Pine Beetle Disturbance in Lodgepole Pine Forests of Greater Yellowstone. For. Ecol. Manag. 2011, 261, 1077–1089. [Google Scholar] [CrossRef]
  38. Kaňa, J.; Kopáček, J.; Tahovská, K.; Šantrůčková, H. Tree Dieback and Related Changes in Nitrogen Dynamics Modify the Concentrations and Proportions of Cations on Soil Sorption Complex. Ecol. Indic. 2019, 97, 319–328. [Google Scholar] [CrossRef]
  39. Levia, D.F.; Frost, E.E. Variability of Throughfall Volume and Solute Inputs in Wooded Ecosystems. Prog. Phys. Geogr. 2006, 30, 605–632. [Google Scholar] [CrossRef]
  40. Sun, G.; Noormets, A.; Gavazzi, M.J.; McNulty, S.G.; Chen, J.; Domec, J.-C.; King, J.S.; Amatya, D.M.; Skaggs, R.W. Energy and Water Balance of Two Contrasting Loblolly Pine Plantations on the Lower Coastal Plain of North Carolina, USA. For. Ecol. Manag. 2010, 259, 1299–1310. [Google Scholar] [CrossRef]
  41. Ruzol, R.; Staudhammer, C.L.; Younger, S.; Aubrey, D.P.; Loescher, H.W.; Jackson, C.R.; Starr, G. Water Use in a Young Pinus Taeda Bioenergy Plantation: Effect of Intensive Management on Stand Evapotranspiration. Ecosphere 2022, 13, e4100. [Google Scholar] [CrossRef]
  42. Bearup, L.A.; Maxwell, R.M.; McCray, J.E. Hillslope Response to Insect-Induced Land-Cover Change: An Integrated Model of End-Member Mixing. Ecohydrology 2016, 9, 195–203. [Google Scholar] [CrossRef]
  43. Kowalska, A.; Astel, A.; Boczoń, A.; Polkowska, Z.; Polkowska, Ż. Atmospheric Deposition in Coniferous and Deciduous Tree Stands in Poland. Atmos. Environ. 2016, 133, 145–155. [Google Scholar] [CrossRef]
  44. Limpert, K.; Siegert, C. Interspecific Differences in Canopy-Derived Water, Carbon, and Nitrogen in Upland Oak-Hickory Forest. Forests 2019, 10, 1121. [Google Scholar] [CrossRef]
  45. Moslehi, M.; Habashi, H.; Khormali, F.; Ahmadi, A.; Brunner, I.; Zimmermann, S. Base Cation Dynamics in Rainfall, Throughfall, Litterflow and Soil Solution under Oriental Beech (Fagus orientalis Lipsky) Trees in Northern Iran. Ann. For. Sci. 2019, 76, 55. [Google Scholar] [CrossRef]
  46. Park, A.; Cameron, J.L. The Influence of Canopy Traits on Throughfall and Stemflow in Five Tropical Trees Growing in a Panamanian Plantation. For. Ecol. Manag. 2008, 255, 1915–1925. [Google Scholar] [CrossRef]
  47. Oyarzún, C.E.; Godoy, R.; Staelens, J.; Donoso, P.J.; Verhoest, N.E.C. Seasonal and Annual Throughfall and Stemflow in Andean Temperate Rainforests. Hydrol. Process. 2011, 25, 623–633. [Google Scholar] [CrossRef]
  48. Macinnis-Ng, C.M.O.; Flores, E.E.; Müller, H.; Schwendenmann, L. Rainfall Partitioning into Throughfall and Stemflow and Associated Nutrient Fluxes: Land Use Impacts in a Lower Montane Tropical Region of Panama. Biogeochemistry 2012, 111, 661–676. [Google Scholar] [CrossRef]
  49. Grundmann, M.H.; Molnar, P.; Floriancic, M.G. Quantification of Enrichment Processes in Throughfall and Stemflow in a Mixed Temperate Forest. Hydrol. Process. 2024, 38, e15224. [Google Scholar] [CrossRef]
  50. Lima, M.T.; Tonello, K.C.; Bramorski, J.; De Arruda, M.M.; Matus, G.N. Overview of Studies on Stemflow Chemistry Effect on Soil: Systematic Review of the Literature. Rev. Bras. Ciênc. Ambient. 2022, 57, 148–157. [Google Scholar] [CrossRef]
  51. Siegert, C.M.; Levia, D.F. Seasonal and Meteorological Effects on Differential Stemflow Funneling Ratios for Two Deciduous Tree Species. J. Hydrol. 2014, 519, 446–454. [Google Scholar] [CrossRef]
  52. Brown, J.H.; Barker, A.C. An Analysis of Throughfall and Stemflow in Mixed Oak Stands. Water Resour. Res. 1970, 6, 316–323. [Google Scholar] [CrossRef]
  53. Ptatscheck, C.; Milne, P.C.; Traunspurger, W. Is Stemflow a Vector for the Transport of Small Metazoans from Tree Surfaces down to Soil? BMC Ecol. 2018, 18, 43. [Google Scholar] [CrossRef] [PubMed]
  54. Soil Survey Staff, Natural Resources Conservation Service, United States Department of Agriculture. Web Soil Survey. Available online: https://websoilsurvey.nrcs.usda.gov/ (accessed on 28 January 2026).
  55. National Oceanic and Atmospheric Administration. NOAA National Centers for Environmental Information U.S. Climate Normals (1991–2020); National Oceanic and Atmospheric Administration: Silver Spring, MD, USA, 2021.
  56. National Drought Mitigation Center, U.S. Department of Agriculture & National Oceanic and Atmospheric Administration. U.S. Drought Monitor (Weekly Drought Map/Data); National Drought Mitigation Center, U.S. Department of Agriculture: Lincoln, NE, USA; National Oceanic and Atmospheric Administration: Silver Spring, MD, USA, 2025.
  57. Davis, J.C.; Shannon, J.P.; Bolton, N.W.; Kolka, R.K.; Pypker, T.G. Vegetation Responses to Simulated Emerald Ash Borer Infestation in Fraxinus nigra Dominated Wetlands of Upper Michigan, USA. Can. J. For. Res. 2017, 47, 319–330. [Google Scholar] [CrossRef]
  58. Siegert, C.M.; Renninger, H.J.; Karunarathna, A.A.; Riggins, J.J.; Clay, N.A.; Tang, J.D.; Hornslein, N.; Chaney, B.L. Biogeochemical Hotspots around Bark-Beetle Killed Trees. In Proceedings of the 19th Biennial Southern Silvicultural Research Conference; Kirschman, J., Ed.; e-General Technical Report SRS-234; Southern Research Station, Forest Service, U.S. Department of Agriculture: Blacksburg, VA, USA, 2018; pp. 73–81. [Google Scholar]
  59. Granier, A. Evaluation of Transpiration in a Douglas-Fir Stand by Means of Sap Flow Measurements. Tree Physiol. 1987, 3, 309–320. [Google Scholar] [CrossRef]
  60. Hornslein, N.J.; Siegert, C.M.; Renninger, H.J. Changes in Physiological Functioning in Loblolly Pine Trees Undergoing Bark Beetle Simulated Mortality. For. Sci. 2018, 65, 312–323. [Google Scholar] [CrossRef]
  61. Blanche, C.A.; Nebeker, T.E.; Schmitt, J.J.; Hodges, J.D. Techniques for Distinguishing the Sapwood-Heartwood Boundary in Living Loblolly Pine (Pinus taeda L.). For. Sci. 1984, 30, 756–760. [Google Scholar] [CrossRef]
  62. Ford, C.R.; McGuire, M.A.; Mitchell, R.J.; Teskey, R.O. Assessing Variation in the Radial Profile of Sap Flux Density in Pinus Species and Its Effect on Daily Water Use. Tree Physiol. 2004, 24, 241–249. [Google Scholar] [CrossRef]
  63. Green, S.A.; Blough, N.V. Optical Absorption and Fluorescence Properties of Chromophoric Dissolved Organic Matter in Natural Waters. Limnol. Oceanogr. 1994, 39, 1903–1916. [Google Scholar] [CrossRef]
  64. Weishaar, J.L.; Aiken, G.R.; Bergamaschi, B.A.; Fram, M.S.; Fujii, R.; Mopper, K. Evaluation of Specific Ultraviolet Absorbance as an Indicator of the Chemical Composition and Reactivity of Dissolved Organic Carbon. Environ. Sci. Technol. 2003, 37, 4702–4708. [Google Scholar] [CrossRef] [PubMed]
  65. Bates, D.; Maechler, M.; Bolker, B.; Walker, S. R Package, version 1.1-7; Lme4: Linear Mixed-Effects Models Using Eigen and S4; The R Foundation: Vienna, Austria, 2014.
  66. R Core Team. A Language and Environment for Statistical Computing; R Foundation for Statistical Computing: Vienna, Austria, 2024; Volume 2, Available online: https://www.R-project.org (accessed on 4 September 2025).
  67. Lenth, R.; Singmann, H.; Love, J.; Buerkner, P.; Herve, M. Emmeans: Estimated Marginal Means, Aka Least-Squares Means; Comprehensive R Archive Network: Vienna, Austria, 2019. [Google Scholar]
  68. Pugh, E.; Gordon, E. A Conceptual Model of Water Yield Effects from Beetle-Induced Tree Death in Snow-Dominated Lodgepole Pine Forests. Hydrol. Process. 2013, 27, 2048–2060. [Google Scholar] [CrossRef]
  69. Hornslein, N.J.; Siegert, C.; Renninger, H.J. Physiological Response of Mid-Canopy Sweetgum Trees to Overstory Loblolly Pine Mortality. Trees 2019, 33, 139–151. [Google Scholar] [CrossRef]
  70. Paine, T.D.; Stephen, F.M. Fungi Associated with the Southern Pine Beetle: Avoidance of Induced Defense Response in Loblolly Pine. Oecologia 1987, 74, 377–379. [Google Scholar] [CrossRef]
  71. Ballard, R.G.; Walsh, M.A.; Cole, W.E. The Penetration and Growth of Blue-Stain Fungi in the Sapwood of Lodgepole Pine Attacked by Mountain Pine Beetle. Can. J. Bot. 1984, 62, 1724–1729. [Google Scholar] [CrossRef]
  72. Helie, J.F.; Peters, D.L.; Tattrie, K.R.; Gibson, J.J. Review and Synthesis of Potential Hydrologic Impacts of Mountain Pine Beetle and Related Harvesting Activities in British Columbia; Water & Climate Impacts Research Center, National Water Research Institute of Environment Canada: Victoria, BC, Canada, 2005; p. 26. [Google Scholar]
  73. Oulehle, F.; Růžek, M.; Tahovská, K.; Bárta, J.; Myška, O. Carbon and Nitrogen Pools and Fluxes in Adjacent Mature Norway Spruce and European Beech Forests. Forests 2016, 7, 282. [Google Scholar] [CrossRef]
  74. Su, Y.; Langhammer, J.; Jarsjö, J. Geochemical Responses of Forested Catchments to Bark Beetle Infestation: Evidence from High Frequency in-Stream Electrical Conductivity Monitoring. J. Hydrol. 2017, 550, 635–649. [Google Scholar] [CrossRef]
  75. Boggs Lynch, L.A.; Norton, U.; van Diepen, L.T.A. Legacy of Bark Beetles (Dendroctonus spp.) on Soil Carbon and Nitrogen Cycling Seven Years after Forest Infestation. For. Ecol. Manag. 2021, 489, 119064. [Google Scholar] [CrossRef]
  76. Raffa, K.F.; Aukema, B.H.; Bentz, B.J.; Carroll, A.L.; Hicke, J.A.; Turner, M.G.; Romme, W.H. Cross-Scale Drivers of Natural Disturbances Prone to Anthropogenic Amplification: The Dynamics of Bark Beetle Eruptions. BioScience 2008, 58, 501–517. [Google Scholar] [CrossRef]
  77. Kalkstein, L.S. Effects of Climatic Stress upon Outbreaks of the Southern Pine Beetle. Environ. Entomol. 1976, 5, 653–658. [Google Scholar] [CrossRef]
  78. Mikkelson, K.M.; Maxwell, R.M.; Ferguson, I.; Stednick, J.D.; McCray, J.E.; Sharp, J.O. Mountain Pine Beetle Infestation Impacts: Modeling Water and Energy Budgets at the Hill-Slope Scale. Ecohydrology 2013, 6, 64–72. [Google Scholar] [CrossRef]
  79. Bethlahmy, N. More Streamflow after a Bark Beetle Epidemic. J. Hydrol. 1974, 23, 185–189. [Google Scholar] [CrossRef]
  80. Ford, E.D.; Deans, J.D. The Effects of Canopy Structure on Stemflow, Throughfall and Interception Loss in a Young Sitka Spruce Plantation. J. Appl. Ecol. 1978, 15, 905–917. [Google Scholar] [CrossRef]
  81. Bialkowski, R.; Buttle, J.M. Stemflow and Throughfall Contributions to Soil Water Recharge under Trees with Differing Branch Architectures. Hydrol. Process. 2015, 29, 4068–4082. [Google Scholar] [CrossRef]
  82. Frost, E.E.; Levia, D.F. Hydrologic Variation of Stemflow Yield across Co-Occurring Dominant Canopy Trees of Varying Mortality. Ecohydrology 2014, 7, 760–770. [Google Scholar] [CrossRef]
  83. Ilek, A.; Siegert, C.M.; Wade, A. Hygroscopic Contributions to Bark Water Storage and Controls Exerted by Internal Bark Structure over Water Vapor Absorption. Trees 2021, 35, 831–843. [Google Scholar] [CrossRef]
  84. Siegert, C.; Ilek, A.; Wade, A.; Schweitzer, C. Changes in Bark Properties and Hydrology Following Prescribed Fire in Pinus Taeda and Quercus Montana. Hydrol. Process. 2023, 37, e14799. [Google Scholar] [CrossRef]
  85. Verdonschot, R.C.M.; Febria, C.M.; Williams, D.D. Fluxes of Dissolved Organic Carbon, Other Nutrients and Microbial Communities in a Water-Filled Treehole Ecosystem. Hydrobiologia 2008, 596, 17–30. [Google Scholar] [CrossRef]
  86. Van Stan, J.T.; Stubbins, A. Tree-DOM: Dissolved Organic Matter in Throughfall and Stemflow. Limnol. Oceanogr. Lett. 2018, 3, 199–214. [Google Scholar] [CrossRef]
  87. Progar, R.A.; Schowalter, T.D.; Freitag, C.M.; Morrell, J.J. Respiration from Coarse Woody Debris as Affected by Moisture and Saprotroph Functional Diversity in Western Oregon. Oecologia 2000, 124, 426–431. [Google Scholar] [CrossRef] [PubMed]
  88. A’Bear, A.D.; Jones, T.H.; Kandeler, E.; Boddy, L. Interactive Effects of Temperature and Soil Moisture on Fungal-Mediated Wood Decomposition and Extracellular Enzyme Activity. Soil Biol. Biochem. 2014, 70, 151–158. [Google Scholar] [CrossRef]
  89. Weintraub, M.N.; Scott-Denton, L.E.; Schmidt, S.K.; Monson, R.K. The Effects of Tree Rhizodeposition on Soil Exoenzyme Activity, Dissolved Organic Carbon, and Nutrient Availability in a Subalpine Forest Ecosystem. Oecologia 2007, 154, 327–338. [Google Scholar] [CrossRef] [PubMed]
  90. Högberg, M.N.; Högberg, P. Extramatrical Ectomycorrhizal Mycelium Contributes One-Third of Microbial Biomass and Produces, Together with Associated Roots, Half the Dissolved Organic Carbon in a Forest Soil. New Phytol. 2002, 154, 791–795. [Google Scholar] [CrossRef]
  91. Kaiser, C.; Koranda, M.; Kitzler, B.; Fuchslueger, L.; Schnecker, J.; Schweiger, P.; Rasche, F.; Zechmeister-Boltenstern, S.; Sessitsch, A.; Richter, A. Belowground Carbon Allocation by Trees Drives Seasonal Patterns of Extracellular Enzyme Activities by Altering Microbial Community Composition in a Beech Forest Soil. New Phytol. 2010, 187, 843–858. [Google Scholar] [CrossRef]
  92. McClaugherty, C.A.; Aber, J.D.; Melillo, J.M. Decomposition Dynamics of Fine Roots in Forested Ecosystems. Oikos 1984, 42, 378. [Google Scholar] [CrossRef]
  93. Robertson, W.M.; Robinett, M.; McCullough, D.G. Soil Moisture Response to White Ash Mortality Following Emerald Ash Borer Invasion. Environ. Earth Sci. 2018, 77, 356. [Google Scholar] [CrossRef]
  94. Lesk, C.; Coffel, E.; D’Amato, A.W.; Dodds, K.; Horton, R. Threats to North American Forests from Southern Pine Beetle with Warming Winters. Nat. Clim. Change 2017, 7, 713–717. [Google Scholar] [CrossRef]
  95. Dale, V.H.; Joyce, L.A.; McNulty, S.; Neilson, R.P.; Ayres, M.P.; Flannigan, M.D.; Hanson, P.J.; Irland, L.C.; Lugo, A.E.; Peterson, C.J.; et al. Climate Change and Forest Disturbances: Climate Change Can Affect Forests by Altering the Frequency, Intensity, Duration, and Timing of Fire, Drought, Introduced Species, Insect and Pathogen Outbreaks, Hurricanes, Windstorms, Ice Storms, or Landslides. BioScience 2001, 51, 723–734. [Google Scholar] [CrossRef]
  96. Strzepek, K.; Yohe, G.; Neumann, J.; Boehlert, B. Characterizing Changes in Drought Risk for the United States from Climate Change. Environ. Res. Lett. 2010, 5, 44012. [Google Scholar] [CrossRef]
  97. Bentz, B.J.; Régnière, J.; Fettig, C.J.; Hansen, E.M.; Hayes, J.L.; Hicke, J.A.; Kelsey, R.G.; Negrón, J.F.; Seybold, S.J. Climate Change and Bark Beetles of the Western United States and Canada: Direct and Indirect Effects. BioScience 2010, 60, 602–613. [Google Scholar] [CrossRef]
Figure 1. Actual observed precipitation and 30-year normal (1990–2020) precipitation for the study site (33.2671, −88.8834) from publicly available U.S. Climate Normals (1991–2020) [55].
Forests 17 00211 g001
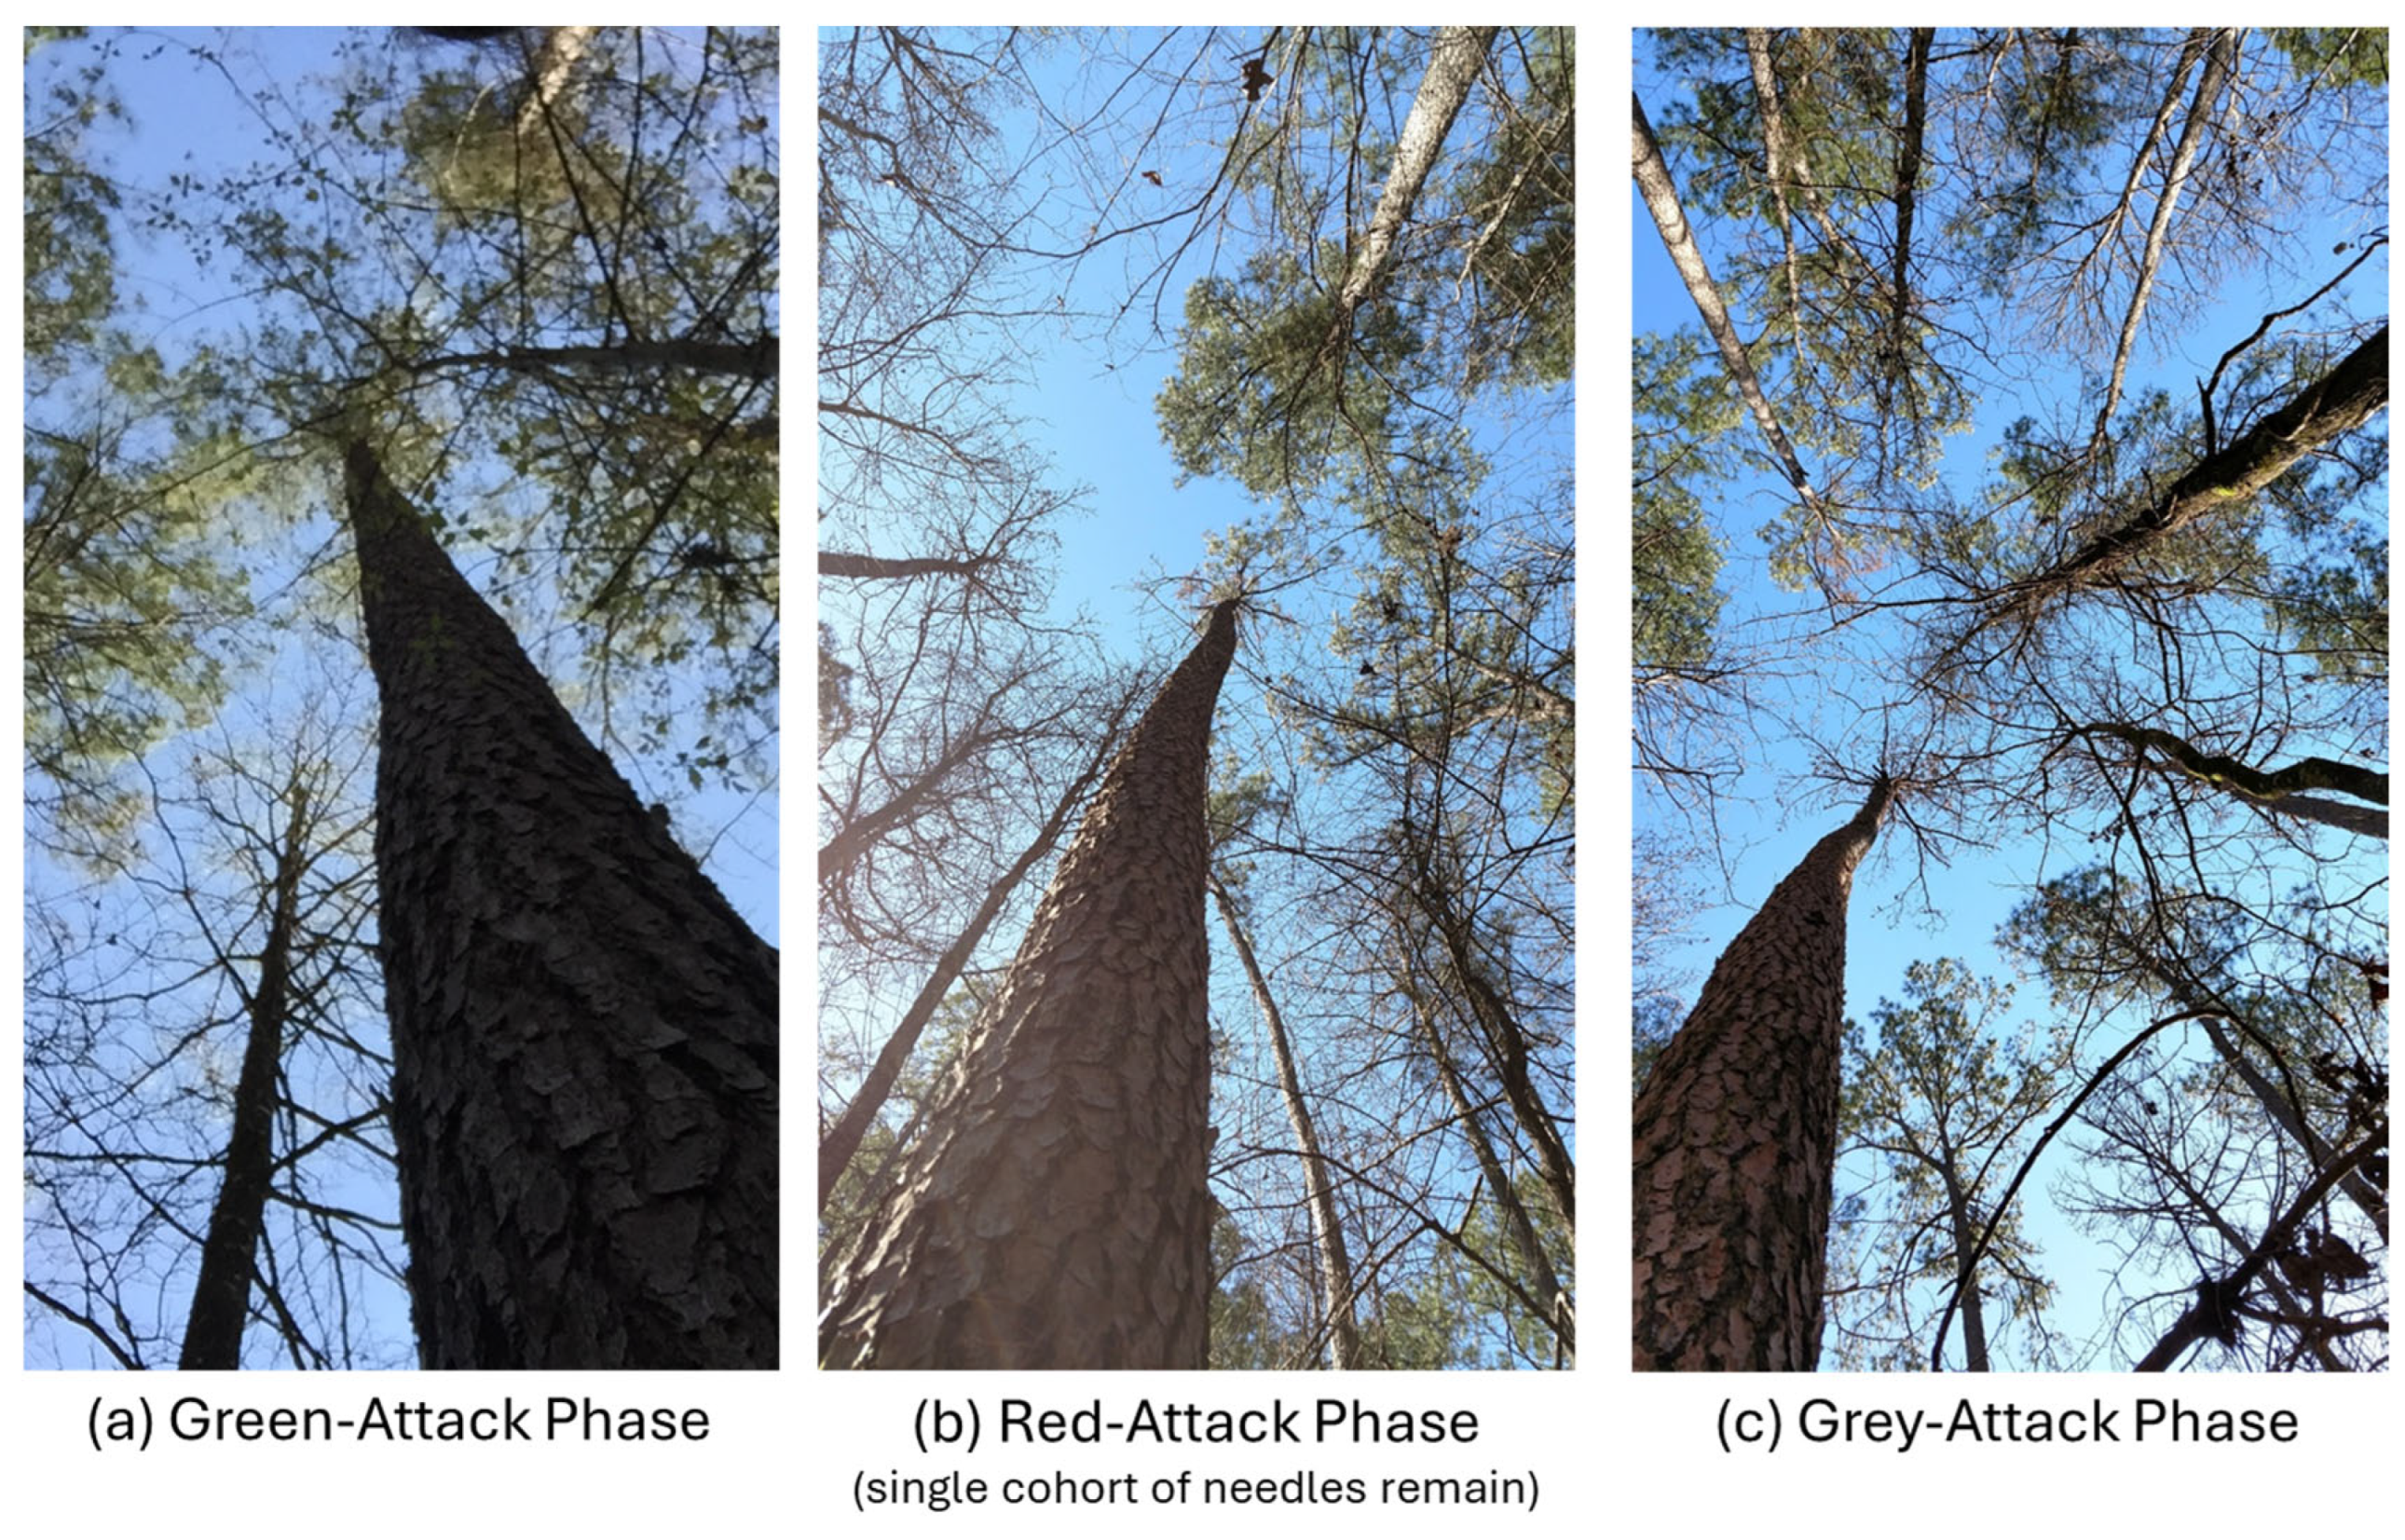
Figure 2. Study trees across each phase of simulated bark beetle attack, including (a) green-attack phase, where trees are infested but still maintain green needles, (b) red-attack phase, where needle death occurs, and (c) gray-attack phase, where needles drop and leave a bare canopy [5].
Forests 17 00211 g002
Figure 3. Mean seasonal differences in sapflow in L per tree between treatments with standard error bars. Seasonal labels on the x-axis are labeled with seasonal abbreviations and year (Su: Summer; Fa: Fall; Wi: Winter; Sp: Spring). Differences in sapflow between treatments within each season are denoted by “*”. Data collection ceased after Winter 2017 because no sapflow was produced from girdled trees after Fall 2016. Green phase: trees infested but still maintain green needles; red phase: needle death; gray phase: needles drop and bare canopy [5].
Forests 17 00211 g003
Figure 4. Mean seasonal stemflow volumetric flux per square meter of basal area between treatments with standard error bars. Seasonal labels on the x-axis are labeled with seasonal abbreviations and year (Su: Summer; Fa: Fall; Wi: Winter; Sp: Spring). Differences in stemflow between treatments within each season are denoted by “*”. Note: no rain occurred in Summer 2015 or Fall 2016. Green phase: trees infested but still maintain green needles; red phase: needle death; gray phase: needles drop and bare canopy [5].
Forests 17 00211 g004
Figure 5. Seasonal volumetric water content (VWC) deviation from overall season mean between treatments with standard error bars at 0.5 m, 1.0 m, and 1.5 m distances from tree boles. Positive values indicate soils are wetter than average, and negative values indicate soils are drier than average. Seasonal labels on the x-axis are labeled with seasonal abbreviations and year (Su: Summer; Fa: Fall; Wi: Winter; Sp: Spring). Differences in VWC between treatments within each season are denoted by “*”. Volumetric water content measurements began in Spring 2016 along with soil respiration. Green phase: trees infested but still maintain green needles; red phase: needle death; gray phase: needles drop and bare canopy [5].
Forests 17 00211 g005
Figure 6. Estimated marginal mean seasonal (A) dissolved organic carbon (DOC) concentrations and (B) specific UV absorbance (SUVA) in rainfall, throughfall, and stemflow from control and girdled trees with standard error bars. Seasonal labels on the x-axis are labeled with seasonal abbreviations and year (Su: Summer; Fa: Fall; Wi: Winter; Sp: Spring). Note: no rain occurred in Summer 2015 or Fall 2016. Green phase: trees infested but still maintain green needles; red phase: needle death; gray phase: needles drop and bare canopy [5].
Forests 17 00211 g006
Figure 7. Mean seasonal (A) nitrate ( N O 3 –N) concentration, (B) ammonium ( N H 4 + –N) concentration, (C) organic nitrogen concentration, and (D) total nitrogen concentration in rainfall, throughfall, and stemflow (control and girdled trees) with standard error bars. Labels on the x-axis are seasonal abbreviations and year (Su: Summer; Fa: Fall; Wi: Winter; Sp: Spring). Differences in stemflow concentrations between treatments within each season are denoted by “*”. Note: no rain occurred in Summer 2015 or Fall 2016. Green phase: trees infested but still maintain green needles; red phase: needle death; gray phase: needles drop and bare canopy [5].
Forests 17 00211 g007
Figure 8. Mean seasonal soil respiration across all three distances from tree boles: 0.5 m (A), 1.0 m (B), 1.5 m (C), with standard error bars. Seasonal labels on the x-axis are labeled with seasonal abbreviations and year (Su: Summer; Fa: Fall; Wi: Winter; Sp: Spring). Respiration measurements began in Spring 2016. Differences in respiration between treatments within each season are denoted by “*”. Green phase: trees infested but still maintain green needles; red phase: needle death; gray phase: needles drop and bare canopy [5].
Forests 17 00211 g008
Figure 9. Summary of impacts to water (blue bars), stemflow chemistry (green bars), and soil respiration (brown bars) of simulated bark beetle mortality using girdling compared to ungirdled, control trees. Brackets around nutrients denote concentrations.
Forests 17 00211 g009
Table 1. Estimated marginal means ± standard error of chemical concentrations in rainfall, throughfall, and stemflow from linear mixed-effects model comparing hydrologic pathway among treatments, season, and their interaction. Letters denote statistical differences for each solute within the four hydrological pathways of PG—precipitation; TF—throughfall; SF: Control—stemflow from control trees; SF: girdled—stemflow from girdled trees. Significant p-values are denoted in bold.
Solute Concentration (mg/L)p-Value
PGTFSF:
Control
SF:
Girdled
TreatmentSeasonTreatment × Season
DOC4.67 ± 8.69 a16.23 ± 6.31 a44.76 ± 3.27 b45.16 ± 4.92 b<0.0010.2140.873
SUVA4.57 ± 0.64 a7.93 ± 0.40 b7.97 ± 0.27 b8.04 ± 0.55 b<0.0010.0720.802
N O 3 –N0.15 ± 0.38 a0.08 ± 0.24 a0.28 ± 0.19 a0.36 ± 0.12 a0.7260.2990.001
N H 4 + –N0.24 ± 1.22 a0.23 ± 0.78 a1.54 ± 0.62 a2.37 ± 0.39 a0.0670.8450.635
ON0.27 ± 0.78 a0.69 ± 0.50 a1.29 ± 0.12 a1.75 ± 0.17 a0.3890.0660.998
TN0.63 ± 1.79 a0.90 ± 1.13 a2.57 ± 0.92 a3.92 ± 0.58 a0.0700.5960.743
Table 2. Mean ± standard error of cumulative chemical fluxes in stemflow across girdling treatments in mg of flux standardized per one square meter of basal area. Significant p-values are denoted in bold.
Control TreesGirdled Treesp-Value
DOC (mg m−2 BA)69,669 ± 22,46834,249 ± 33700.030
N O 3 –N (mg m−2 BA)154 ± 50161 ± 620.913
N H 4 + –N (mg m−2 BA)1191 ± 841601 ± 2800.392
ON (mg m−2 BA)1738 ± 3661243 ± 1300.127
TN (mg m−2 BA)2813 ± 4032746 ± 3880.923
Disclaimer/Publisher’s Note: The statements, opinions and data contained in all publications are solely those of the individual author(s) and contributor(s) and not of MDPI and/or the editor(s). MDPI and/or the editor(s) disclaim responsibility for any injury to people or property resulting from any ideas, methods, instructions or products referred to in the content.