Article

Development and Evaluation of a Thinning Tree Selection System Using Optimization Techniques Based on Multi-Platform LiDAR

1
Department of Forest Management, Kangwon National University, Chuncheon 24341, Republic of Korea
2
Forest Technology and Management Research Center, National Institute of Forest Science, Pocheon 11187, Republic of Korea
*
Author to whom correspondence should be addressed.
Forests 2025, 16(12), 1776; https://doi.org/10.3390/f16121776
Submission received: 22 September 2025 / Revised: 7 November 2025 / Accepted: 21 November 2025 / Published: 26 November 2025

Abstract

This study aimed to develop a thinning tree selection system by applying genetic algorithms based on precisely estimated tree-level forest structural parameters derived from LiDAR data. Conventional thinning tree selection methods have limitations due to their dependence on subjective judgement and field experience of operators, resulting in inconsistency and variations according to skill levels. To address these issues, tree positions, diameters at breast height (DBH), and tree heights were extracted by integrating terrestrial laser scanning (TLS) and Unmanned Aerial Vehicle Laser Scanning (ULS) data, forming a Multi-Platform LiDAR dataset. The derived DBH and Hegyi competition index were utilized as indicators for thinning tree selection. Optimization of tree selection was performed using a genetic algorithm, with an objective function designed to maximize the average DBH and minimize the average competition index of the remaining trees, and the system’s performance was compared with results obtained by forestry experts. The results showed that tree detection accuracy exceeded 99%, DBH estimation exhibited an RMSE of 0.74 cm, and tree height estimation showed an RMSE of approximately 2 m, demonstrating the construction of precise forest structural parameters. Compared to expert driven selection, the Genetic Algorithm-based thinning system produced a higher average DBH (30.06 cm vs. 29.26 cm) and a lower Hegyi competition index (1.31 vs. 1.41) under Scenario 3. This indicates superior performance in competition alleviation and growing space allocation among individual trees. Spatial statistical analysis revealed that while expert selection maintained the existing spatial clustering pattern of stand structure (Global Moran’s I = 0.16), the machine learning system achieved an almost random distribution (Global Moran’s I = −0.04) under Scenario 3. This study demonstrates the potential of overcoming the limitations of conventional thinning practices dependent on subjective judgement by introducing an objective, consistent, data-driven quantitative decision support system for precision forest management.

1. Introduction

Forests have been identified as playing a pivotal role in climate change mitigation through carbon storage and sequestration [1]. Moreover, forests provide a variety of ecosystem services, including the conservation of biodiversity, the provision of recreational areas, and the supply of timber [2]. In particular, forests capture CO2 through biomass growth and soil carbon accumulation, while forest management practices such as thinning intensity, rotation length, species selection, and the use of harvested wood products directly influence these carbon dynamics [3]. In order to enhance these functions, it is imperative to augment forest carbon storage capacity through the implementation of sustainable forest management practices, whilst simultaneously realizing ecological and economic values [4].
Thinning, among the various management practices aimed at achieving sustainable forest management, is a core silvicultural technique that secures growing space for trees, promotes the growth of superior individuals, and enhances stand stability [5,6]. The effectiveness of thinning is largely determined by decisions regarding thinning intensity and the number of trees to be removed, as well as the process of selecting individual trees for thinning [7,8]. Currently, the determination of the number of trees to be thinned can be conducted relatively objectively through numerical data such as yield tables. However, the selection of trees for thinning relies on the subjective judgement of field operators, resulting in variations in outcomes according to skill level and experience, which constitutes a significant limitation [9]. This has the potential to compromise the efficacy of prescribed thinning operations. Moreover, the forestry sector of Korea has recently been confronted with issues pertaining to labour shortages, which have been compounded by an ageing population. On a global scale, concerns regarding the sustainability of forestry labour have been exacerbated by the reluctance of individuals to engage in hazardous and arduous occupations (so-called ‘3D jobs’), the prevalence of low wages, and the process of urbanization [10,11].
Accordingly, in recent years, there has been a growing societal demand for the active adoption of emerging technologies such as ICT and AI in the forestry sector to enhance the efficiency and productivity of forest management [12,13]. In particular, the utilization of advanced remote sensing technologies, including LiDAR, has demonstrated the potential to realize objective and highly precise forest management. Michałowska et al. [14] established four height intervals from DTM data and applied rasterisation, Hough transform, and robust least-squares fitting of circle algorithms for each interval, achieving 87.2% accuracy in detecting 94.8% of individual tree positions. Hui et al. [15] proposed an algorithm that aims to enhance the accuracy of diameter at breast height (DBH) estimation. The proposed methodology involves converting cross-sectional points at breast height to polar coordinates, a process that is purported to remove outliers and facilitate the estimation of DBH through definite integral calculations, demonstrating high accuracy with an RMSE of 8.68 mm. Lee and Lee [16] estimated tree height by integrating Terrestrial Laser Scanning (TLS) and Unmanned Aerial Vehicle Laser Scanning (ULS) data in the process of estimating individual tree volume. This yielded results with a mean root mean square error (RMSE) of approximately 0.6 m, which demonstrated higher accuracy compared to conventional tree height measurement methods.
Building upon these technological advancements, recent research has increasingly focused on applying such high-resolution data to operational forest management. In response, there has been a paradigm shift from stand-level sampling surveys to precision forestry through the construction of detailed tree-level datasets, leading to various research endeavours. Fransson et al. [17] established thinning and harvesting strategies that maximize Land Expectation Value using individual tree information and genetic algorithms. Furthermore, Niemi et al. [18] proposed metaheuristic techniques that optimize thinning trees and residual trees by establishing various objective functions that consider economic and environmental goods and forest structure.
Whilst the extant research has focused chiefly on individual component technologies, such as LiDAR-based information extraction or thinning optimization, this study proposes an integrated system that encompasses the entire process, from LiDAR data collection and the construction of individual tree structural information, to thinning tree selection optimization based on metaheuristic algorithms. The objective of this approach is to practically implement precision forestry at the individual tree level and to achieve automation and objectification of the thinning decision-making process. The specific research objectives for implementing such a system are as follows:
  • Construction of individual tree position, DBH, and tree height information for large-scale areas using LiDAR;
  • Optimization of thinning tree selection utilizing precise forest structural information and genetic algorithms;
  • Evaluation of system applicability through comparison with tree selection results by forestry experts.
The system proposed in this study is expected to present a novel forest management paradigm that can simultaneously achieve objective and consistent thinning decision-making and spatial structure improvement effects by linking precise individual tree-level information with practical forest management decision-making processes, thereby addressing issues of declining forestry labour and skill-level disparities.

2. Materials and Methods

2.1. Study Area

The study area was designated as a 100 m × 100 m square plot within the Academic Forest of Kangwon National University (37°45′ N ∼ 37°51′ N, 127°47′ E ∼ 127°52′ E) located in Gangwon-do, Republic of Korea. A field survey of the sample plot revealed that the stand, composed of Pinus koraiensis, had an average tree height of 18.3 m, an average DBH of 28.3 cm, and a total of 769 trees. The study site is characterized as an even-aged plantation with a stand age of approximately 45 years, average elevation ranging from 540 to 600 m, located on a west-facing slope with a relatively gentle average gradient of approximately 19°. The area under consideration constitutes a plot that has reached the thinning stage, exhibiting high canopy density and underdeveloped understory vegetation typical of the species, thus rendering it suitable for the present research (Figure 1).

2.2. Materials

This study utilized TLS and ULS systems. TLS provides high precision and point density, whilst ULS enables the acquisition of high-precision data for the upper canopy (Figure 2).
TLS was conducted systematically at 10 m intervals across the 100 m × 100 m square plot. Each scanning position, established at 10 m intervals, was precisely located using a Vertex instrument to measure azimuth and distance from the scanning positions, resulting in scanning at a total of 121 points. The TLS equipment employed was the BLK 360 (Leica Geosystems, Heerbrugg, Switzerland). The BLK 360 is a compact TLS characterized by its relatively low cost and high portability, capable of collecting data with 4 mm accuracy at a 10 m range [19]. To define the point cloud data constructed using TLS in absolute coordinates, five Ground Control Point (GCP) targets were installed evenly across the perimeter and the centre of the study area, with their positions distributed across different elevation levels [20]. The GCPs were collected using an R12i GNSS-RTK system (Trimble, Westminster, CO, USA). Following these procedures, the constructed point cloud data exhibited a registration error of 3 mm and a georeferencing error of 36 mm, resulting in the construction of high-precision 3D forest spatial data.
The ULS equipment employed was the Hovermap (Emesent Pty Ltd., Brisbane, Australia) and Matrice 300 RTK (DJI, Shenzhen, China). ULS was performed at 30 m above the surface using a pre-constructed Digital Surface Model (DSM) of the study plot. The ULS time was set to 20 min, taking flight duration into consideration, and the flight speed was set to a low velocity of 2 m/s to collect high-precision data. Accordingly, the flight path was configured in a zigzag pattern covering the 1 ha study area eight times [21,22]. For ULS data, georeferencing was performed by establishing clear landing and takeoff areas and forest roads free of obstacles to enable clear identification of GCP targets. The georeferencing error for ULS was 14 mm, resulting in the construction of high-precision 3D forest spatial data [16].

2.3. Methods

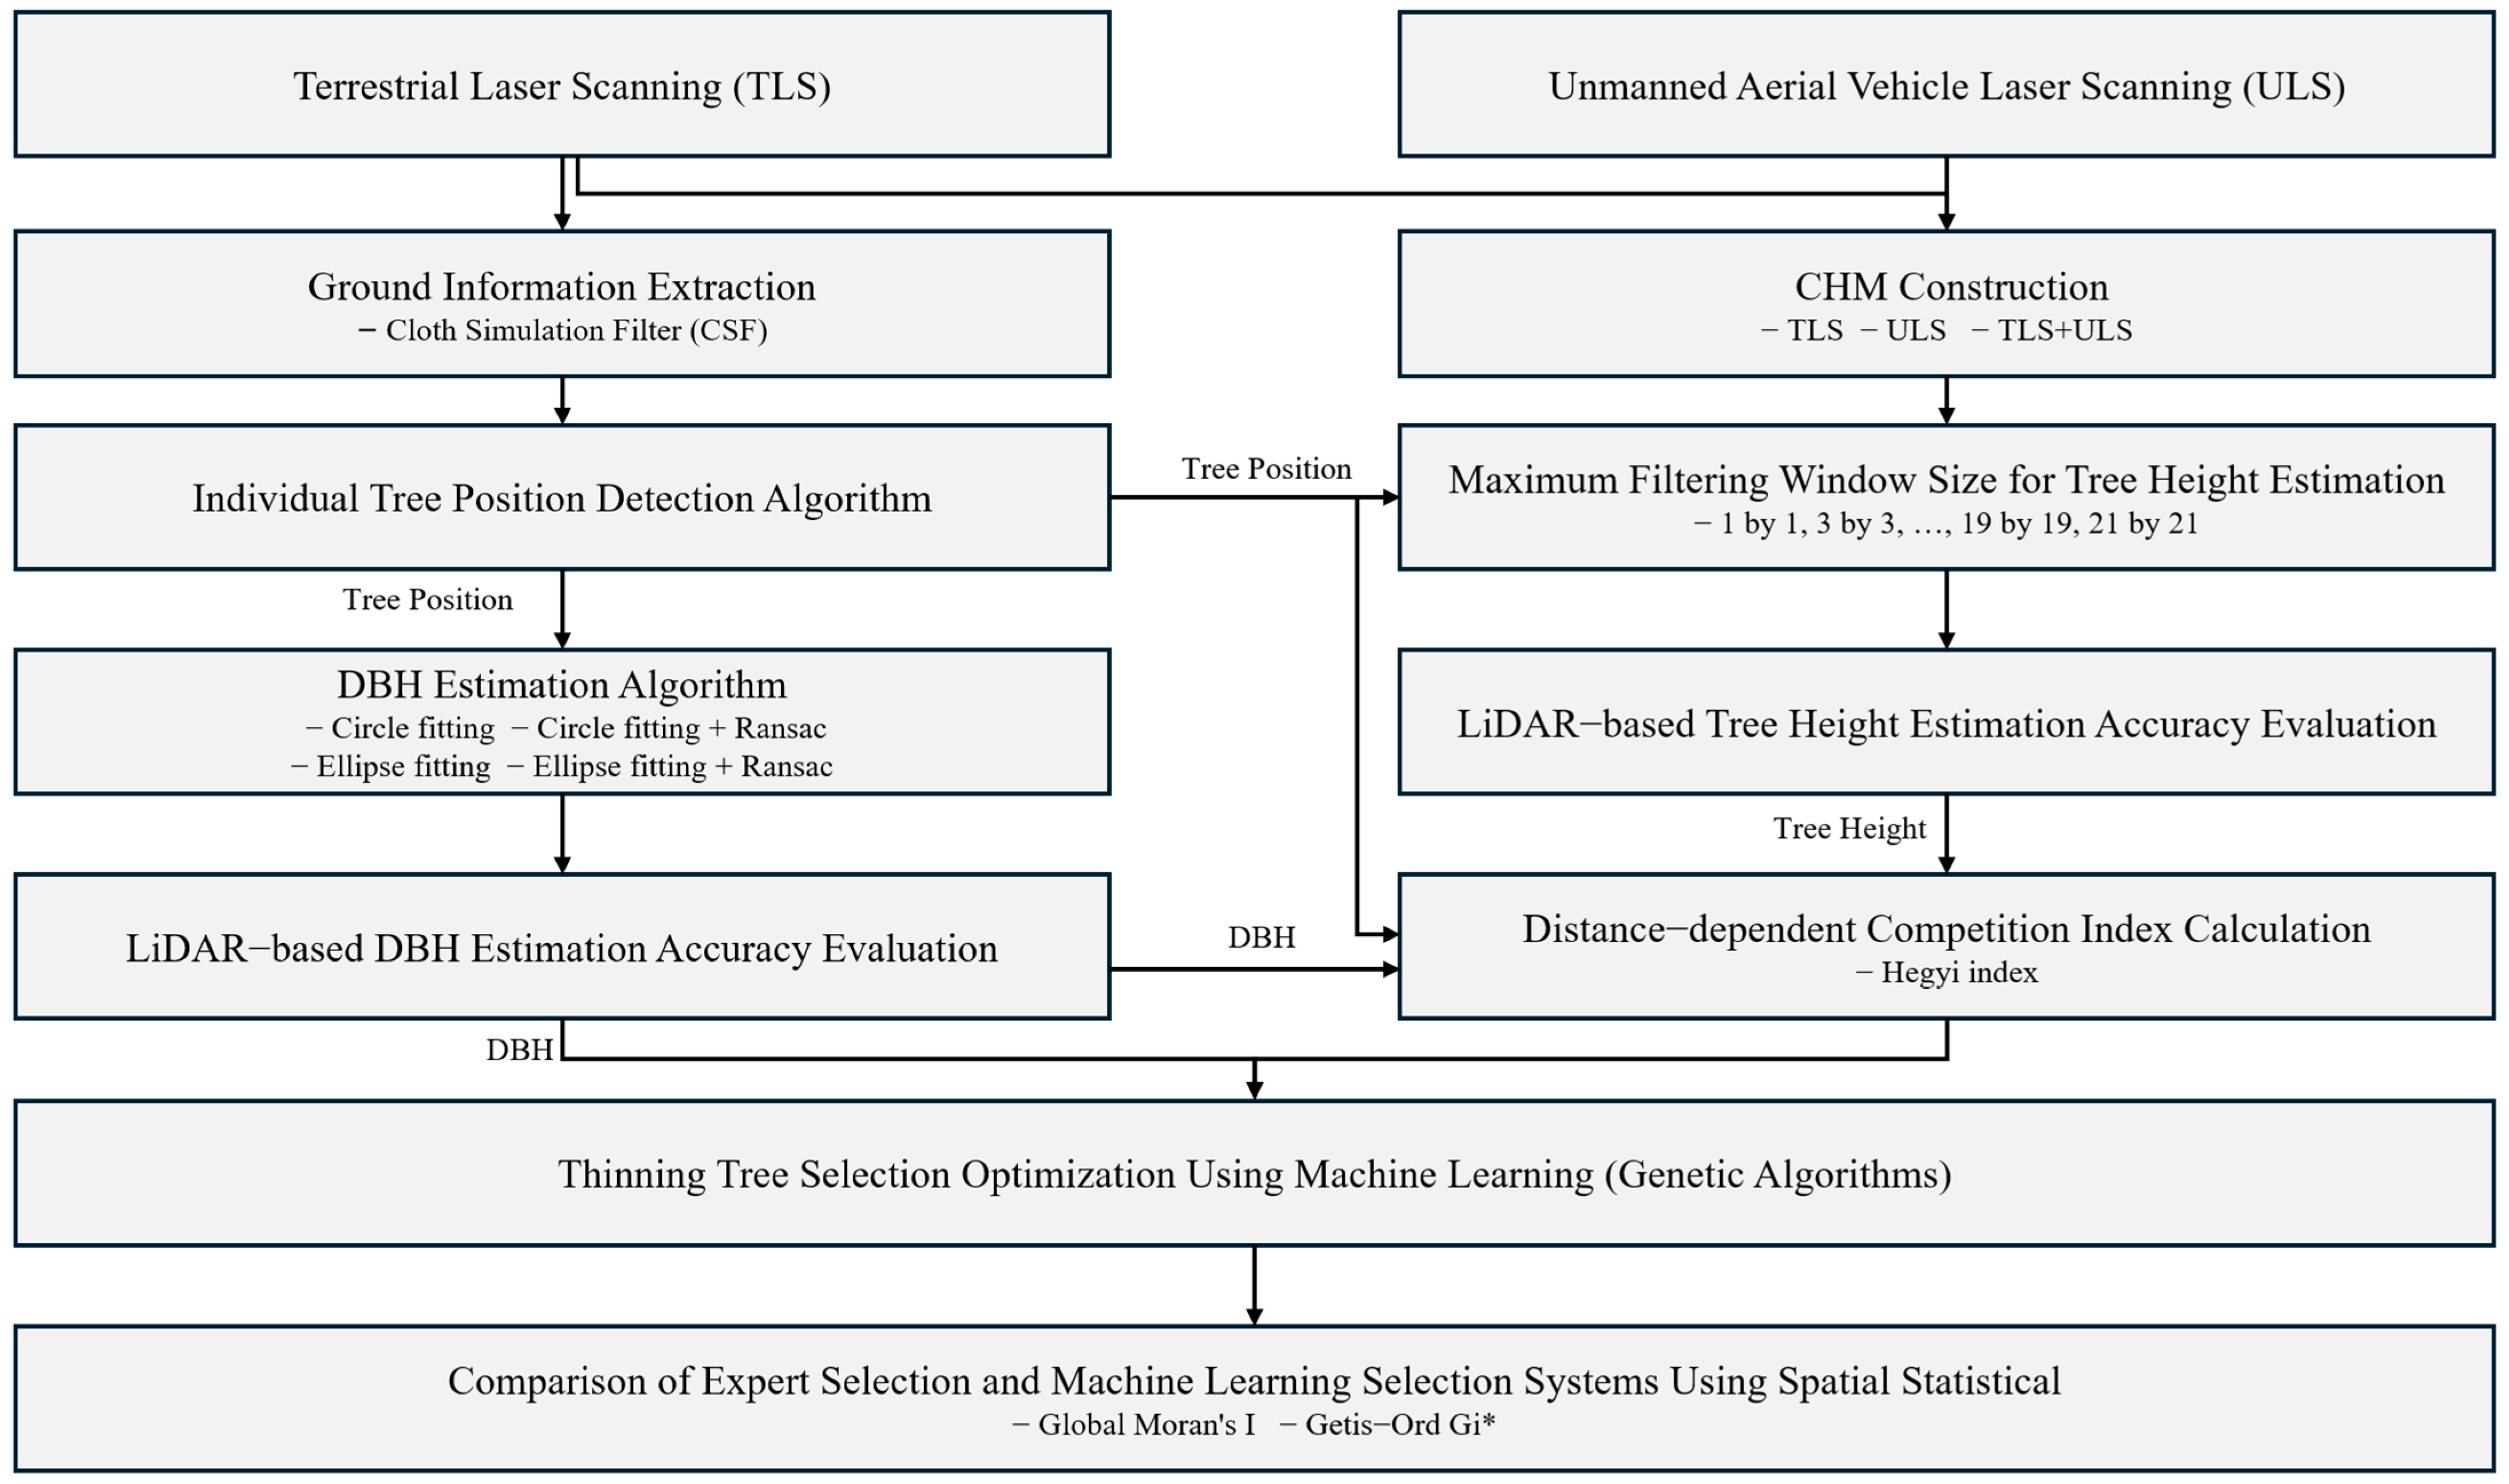
This study utilized Multi-Platform LiDAR data to estimate individual tree position, DBH, and tree height, and based on these parameters, developed and evaluated a thinning tree selection optimization system by applying genetic algorithms, one of the machine learning techniques. An individual tree position detection algorithm was developed as an iterative process that extracts stem height data and determines whether the established criteria for individual tree identification are satisfied. For DBH estimation, circular fitting and RANSAC algorithms, which have been utilized in existing research, were applied and their accuracy was compared [23]. Additionally, for tree height estimation, Canopy Height Models (CHM) were constructed according to LiDAR platform type, and maximum filters were applied with various window sizes to evaluate accuracy.
Variables for thinning tree selection were chosen as DBH to evaluate tree development status and competition index to assess competitive conditions. The competition index was calculated using the Hegyi index based on individual tree position, DBH, and tree height derived through the aforementioned processes. In the genetic algorithm-based tree selection optimization process, an objective function was established to maximize the difference between the average DBH and the average competition index of residual trees after thinning. Furthermore, four weighting scenarios were configured according to the importance of DBH and competition index, and these were compared with expert tree selection results conducted in actual field conditions (Figure 3).

2.3.1. Individual Tree Position Detection Using LiDAR Data

For individual tree position detection, stem regions were extracted to minimize the influence of ground and canopy points, such as branches and leaves. The stem regions were extracted by selecting points at distances between 0.3 m and 1.9 m from the ground surface, considering the characteristics of the study site. Ground information was constructed as a mesh using CSF (Cloth Simulation Filter), with parameters set as follows: Cloth resolution 0.1, Max iterations 900, and Classification threshold 0.1 [24,25].
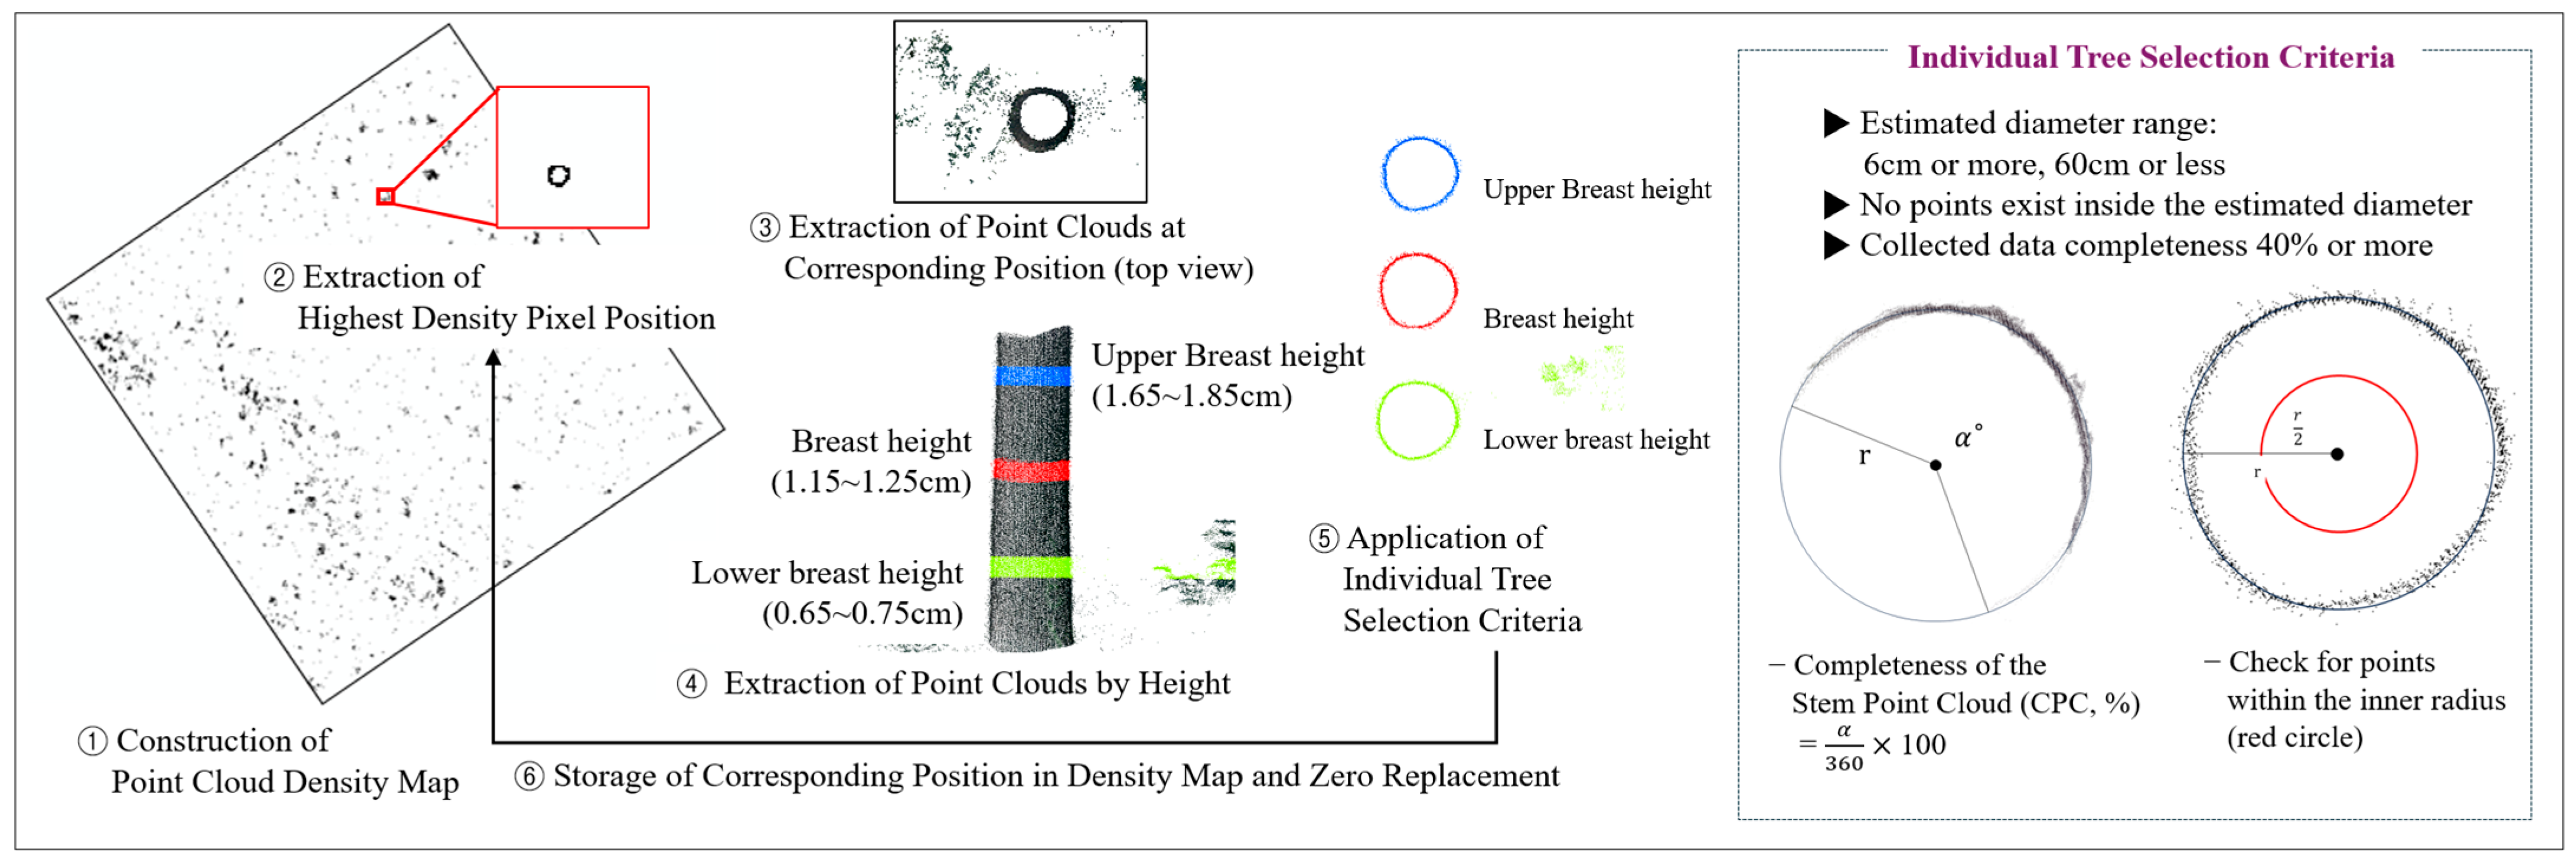
The algorithm for detecting individual tree positions utilized the pattern whereby stems consist of circular points distributed vertically, forming a cylindrical shape. Because of this morphological characteristic, when point density information was rasterized, pixels corresponding to stem locations showed higher density values. As the first step, a density map was generated from the stem point cloud data. Pixels with the highest density were assumed to represent potential tree positions, and points within a 30 cm radius from these locations were extracted. To verify the continuous circular distribution of stem points, additional points were extracted at lower, middle, and upper breast height levels (0.65–0.75 m, 1.15–1.25 m, and 1.65–1.75 m). If these cross-sectional point patterns met the selection criteria, the objects were identified as individual trees [26]. After identification, pixels corresponding to detected trees were removed from the density map. For undetected trees, the pixel with the next highest density value was selected, and the same process was repeated until all potential trees were evaluated
Three conditions were defined for individual tree selection criteria. The first condition established a diameter range of 6 cm to 60 cm, considering the stand characteristics of the study site. The reference diameter values were calculated using circular fitting with RANSAC algorithms and least squares methods [27]. The second condition examined the presence of points within individual trees, considering the characteristic that no points exist inside individual trees. The boundary for examining the presence of internal points was established based on half the radius of the estimated diameter [28]. Finally, the third condition was established to exclude cases where circles were fitted due to some understory vegetation points, requiring that the arc ratio (Completeness of the Stem Point Cloud; CPC) in the extracted diameter point cloud data be 40% or higher [29]. When all three conditions were satisfied at breast height level, upper breast height, and lower breast height, the centre point of the circle estimated at breast height was added and stored as the individual tree position (Figure 4).
To evaluate the accuracy of the individual tree position detection algorithm, actual individual tree position information collected using GNSS-RTK was utilized as reference data. The evaluation method involved comparing the individual tree positions detected by the algorithm with actual individual tree positions to construct an error matrix, followed by the use of Recall (Completeness) and Precision (Correctness) as defined below. Recall represents the ratio of detected individual trees among actually existing individual trees, indicating the completeness of detection results, whilst Precision signifies the ratio of actual reference individual trees among detected individual trees, representing the correctness of detection results [30].

2.3.2. DBH Estimation Using LiDAR Data

DBH estimation was conducted using circular fitting algorithms. The circular fitting algorithms employed Circle Fitting (CF) and Ellipse Fitting (EF) based on the least squares method, with the addition of Circle Fitting + RANSAC (RCF) and Ellipse Fitting + RANSAC (REF), which combined each method with RANSAC algorithms, resulting in a comparison of accuracy across four different methods [31,32].
Points used for DBH estimation were extracted from a height range of 1.15 m to 1.25 m above ground, based on the ground information constructed during individual tree position detection. Additionally, considering the DBH distribution of the stand, only points within a 30 cm radius from each individual tree centre were selected.
The least squares method applied to diameter estimation is an approach that derives the optimal solution by minimizing the sum of squared distances between given points and a circle. Accordingly, circular or elliptical equations were transformed into normal equation form, and the x, y coordinates of the extracted points were used to derive the optimal solution that minimizes the sum of squared distances between the points and the fitted circle.
The RANSAC algorithm is an iterative algorithm that predicts models by minimizing the influence of noise present within the data. The RANSAC algorithm procedure is performed iteratively, divided into hypothesis and verification stages. In the hypothesis stage, 10 points were randomly selected from the extracted points and CF and EF were applied. In the verification stage, the number of points with distances of 0.6 cm or less between the estimated circle and all points extracted for DBH estimation was established as the evaluation criterion. This criterion was established considering the expected error range at the 10 m shooting distance of the BLK360 equipment. The above algorithm procedure was repeated a total of 100 times, and the circle with the highest number of points within the threshold was selected as the final DBH estimation model [27].
Accuracy evaluation of the estimated DBH was conducted using RMSE between values measured in the field with D-tape and values estimated by circular fitting algorithms. Additionally, to evaluate general estimation accuracy, RMSE was calculated and compared for data with outliers removed. Outlier determination was based on the z-score of estimation errors, with cases where the absolute value of the z-score exceeded 2.58 being considered outliers.

2.3.3. Tree Height Estimation Using LiDAR Data

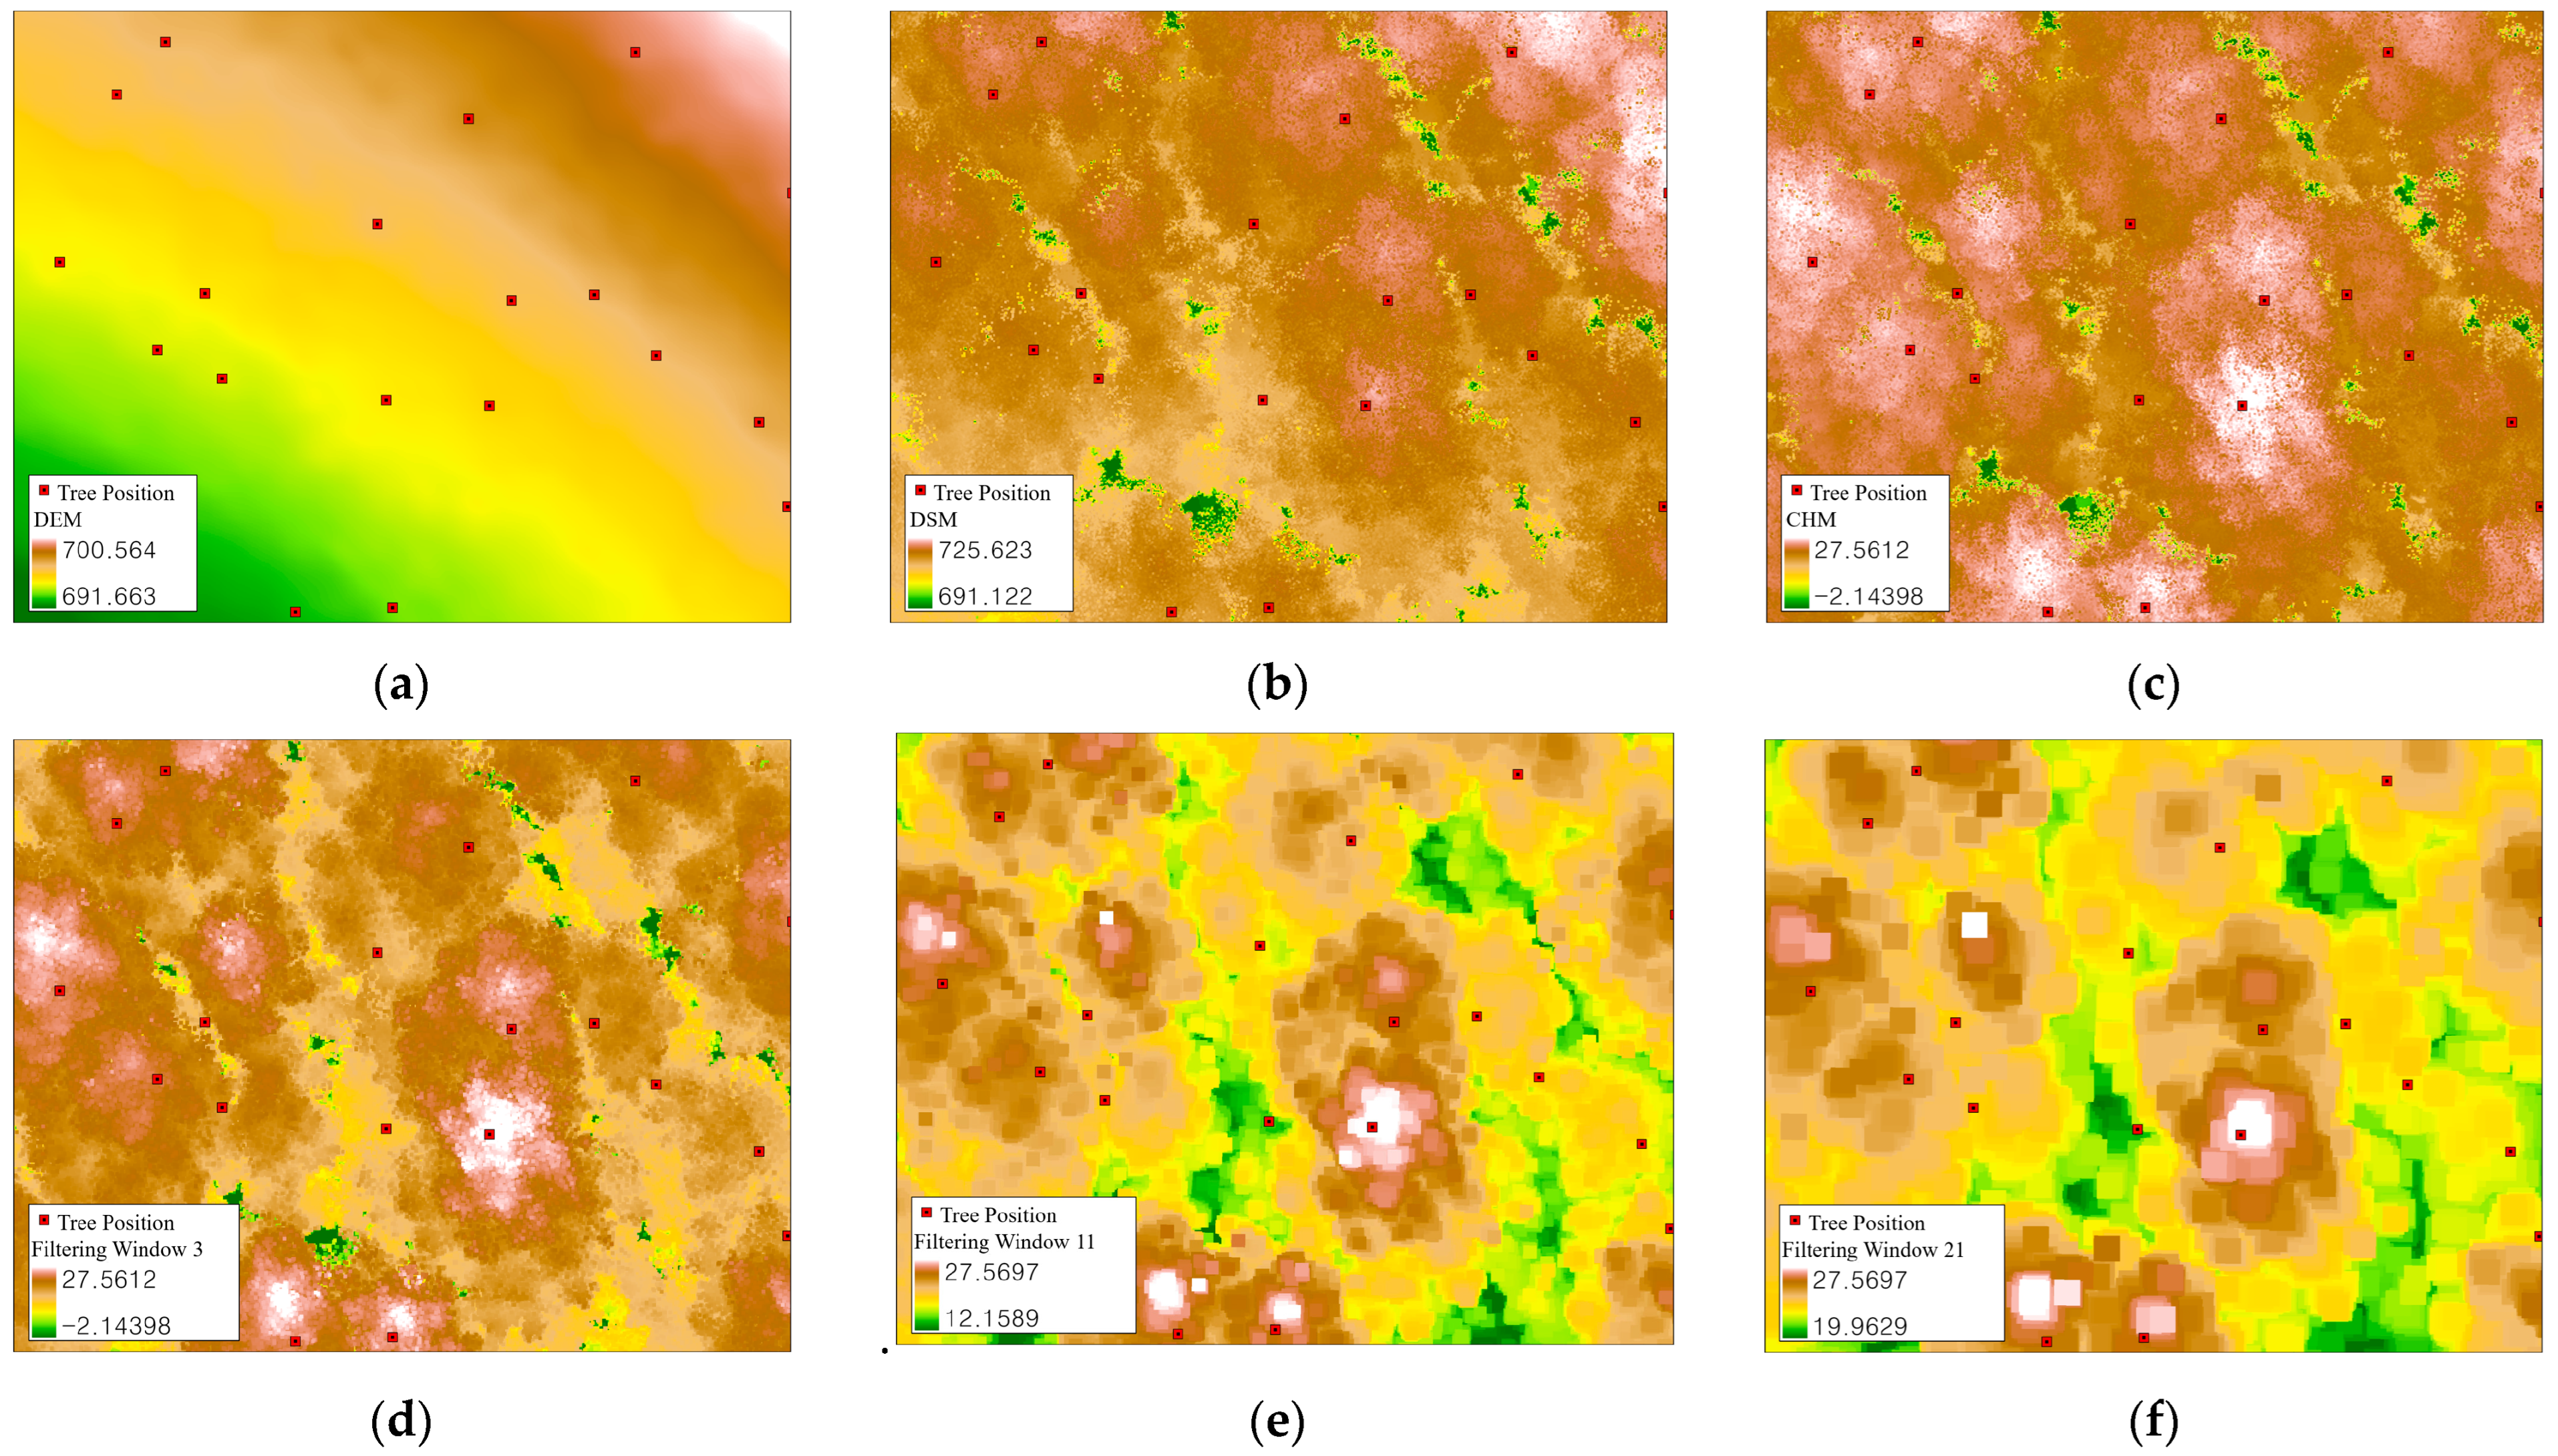
Tree height estimation was conducted and compared using multi-platform data (TLS + ULS) that integrated two single-platform datasets constructed through TLS and ULS. Digital Elevation Models (DEM) and Digital Surface Models (DSM) were constructed from each of the three datasets, and these two datasets were subtracted to generate Canopy Height Models (CHM) with 5 cm spatial resolution for each dataset. Tree height estimation using LiDAR data was performed by extracting CHM values at the centre coordinates of DBH derived during DBH estimation from the constructed CHM. However, although Individual Tree Detection-based approaches using LiDAR point clouds generally provide higher accuracy in tree height estimation, they require the adjustment of numerous parameters and are limited in their applicability to large-scale areas. Therefore, this study employed a CHM approach, which enables a simpler and more efficient estimation process. CHM offers continuous representations of canopy surface elevation, allowing rapid and consistent tree height estimation across extensive forest areas [28,29,30,31].
Meanwhile, the actual tree top position for tree height measurement may not coincide with the centre of DBH due to tree branching or leaning. To address this issue, maximum filtering was applied to the constructed CHM. Maximum filtering replaces the value of a given central pixel with the maximum value of either the central pixel or the surrounding pixels according to the window size. This approach enabled the assignment of tree top CHM values to the DBH centre coordinates even when the exact tree top position was not precisely located [32,33]. The window sizes for maximum filtering were set from 1 to 21, increasing by increments of 2, resulting in 1 by 1, 3 by 3, …, 19 by 19, 21 by 21 configurations. Here, 1 by 1 represents the original data. Eleven CHMs were constructed for each dataset according to window size, and tree heights were estimated and evaluated accordingly. Accuracy evaluation of the estimated tree heights was conducted using the coefficient of determination and RMSE between values measured in the field with Vertex and values estimated using each CHM (Figure 5).

2.3.4. Variable Setting for Thinning Tree Selection Optimization

Thinning is a representative forest management technique for securing growing space for trees within stands and promoting the growth of residual trees. The methods for selecting trees for thinning include quantitative thinning, improvement thinning, and systematic thinning. Among these, quantitative thinning is a method that determines thinning volume according to a specific thinning rate or target density, focusing on quantitative control, whilst improvement thinning is a quality-oriented approach that determines thinning targets based on the growth status of individual trees. In field practice, mixed thinning is predominantly utilized, whereby the total thinning volume is calculated through quantitative thinning, followed by the application of improvement thinning criteria to select trees for removal [34].
Accordingly, this study considered the thinning practices implemented in Korea and aimed to incorporate both the developmental status and competitive status of trees in thinning tree selection. The developmental status of trees was evaluated based on DBH. DBH serves as the most fundamental and critical indicator reflecting the growth status of trees. Therefore, trees with smaller DBH were regarded as having lower developmental status and were designated as thinning targets.
Additionally, distance-dependent competition indices were utilized to quantitatively assess the competitive status among individual trees. This index is based on the size of the subject tree and the distance to surrounding trees, and is particularly effective in reflecting the intensity of competition among individual trees in plantation forests [35,36]. The competition index used in this study employed the Hegyi competition index, which has been effectively utilized for thinning tree selection in previous research, and the sight angle for competitor tree selection was set to 70°, consistent with previous studies [37].

2.3.5. Optimization of Thinning Tree Selection Using Genetic Algorithms

This study employed genetic algorithms, an optimization technique within machine learning algorithms, to establish a tree selection system based on quantitative evaluation. Genetic algorithms are optimization methods that find optimal solutions by mimicking evolutionary processes. Genetic algorithms are optimization techniques that solve problems by adopting various elements from actual evolutionary processes [38,39]. This algorithm represents solutions to problems in genetic format and progressively finds optimal solutions through evolutionary principles. Genetic algorithms have the characteristic of effectively and universally handling more complex problems by simulating natural selection and genetic variation processes. A chromosome biologically refers to a collection containing genetic material, and in genetic algorithms, it represents a single solution. In this study, chromosomes were defined as lists of thinning trees. Additionally, genes are elements that constitute chromosomes, and in this study, they correspond to individual tree information. The degree to which each chromosome is suitable for a solution is called fitness, and fitness is calculated according to the objective function defined for problem-solving [40,41].
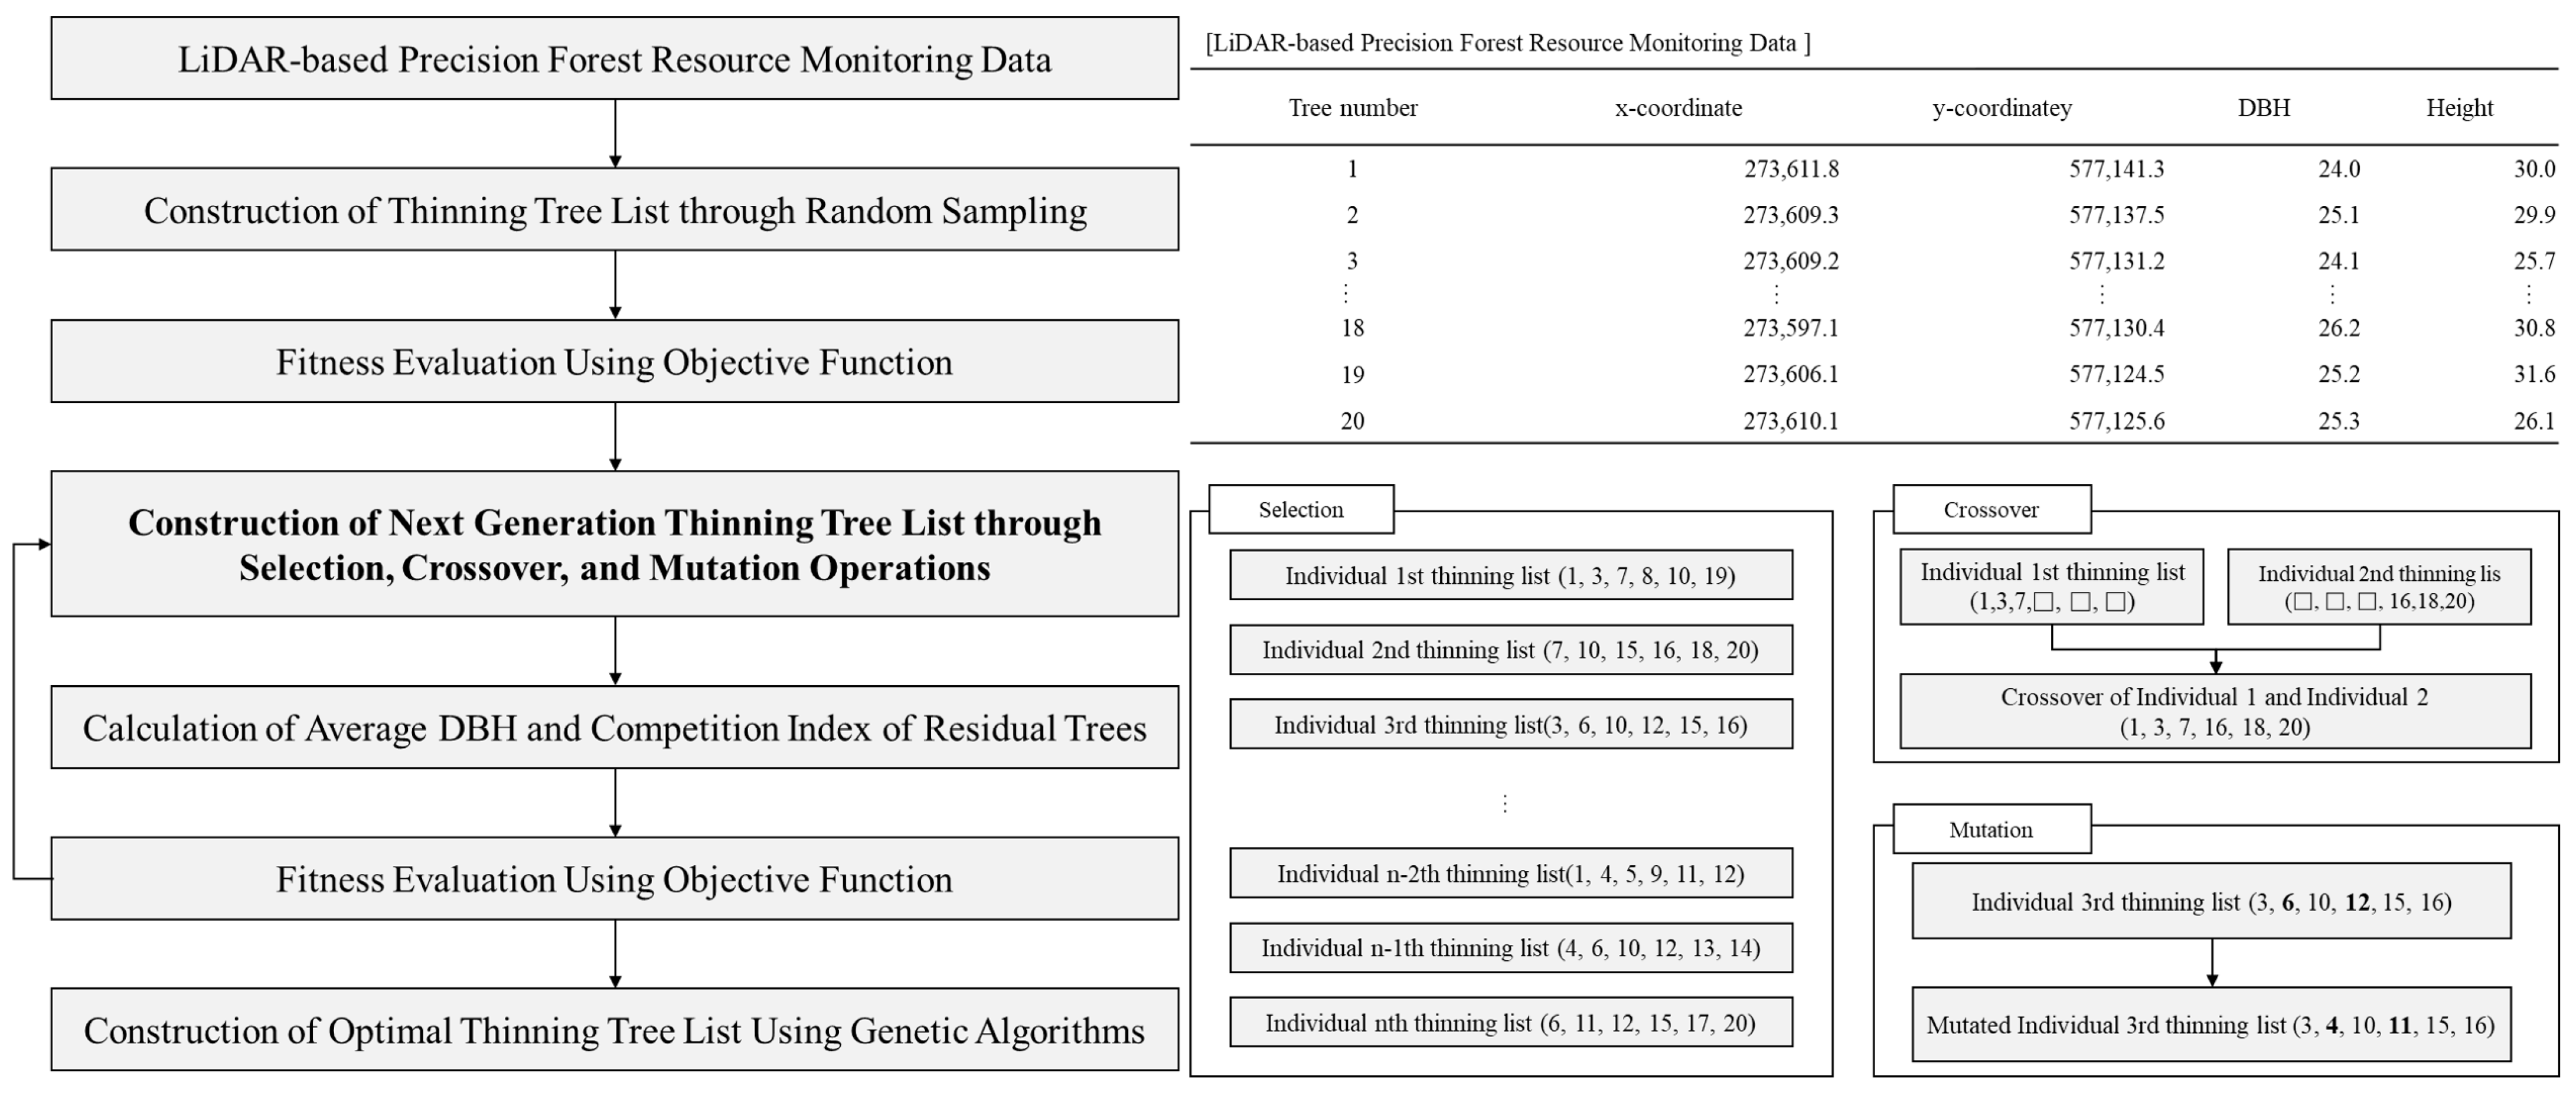
Genetic algorithms evaluate fitness through objective functions to find optimal solutions. Through selection, crossover, and mutation operations, the algorithm continuously updates chromosome-corresponding thinning tree lists, ultimately aiming to construct the thinning tree list with the highest fitness. Selection is the method of choosing chromosomes to be passed from one generation to the next, and this study employed the tournament selection method. The tournament selection method selects the chromosome with the highest fitness among multiple randomly selected chromosomes [42]. Crossover is an operation inspired by the recombination process of genetic information between actual parents and offspring, where two chromosomes are selected and a single chromosome composed of non-overlapping genes is determined as the chromosome for the next generation. In other words, the thinning trees from two selected thinning tree lists are recombined to pass one thinning tree list to the next generation. The crossover probability in this study was set to 0.6. Mutation is an operation where genes in a chromosome are randomly modified to transform into a different chromosome. Mutation operations can effectively prevent falling into local optima and facilitate the search for global optima. The mutation probability in this study was set to 0.2. Additionally, the algorithm was designed to prevent the same individual tree from being selected twice as a thinning tree during crossover and mutation operations (Figure 6).
Genetic algorithms begin with an initial thinning tree list constructed through random sampling, and new generations are created as the thinning tree list is modified through selection, crossover, and mutation operations. During this generation process, the fitness that serves as the reference value is calculated according to the objective function set for the specific purpose. In this study, the objective function was established using competition indices that can assess the competitive status of trees and diameter at DBH that can evaluate the developmental status in thinning tree selection [43]. First, considering the purpose of thinning, the objective function was set so that its value increases as the developmental status of residual trees improves and their competitive status decreases (Equation (1)). Additionally, to compare tree selection results according to the weights of competition indices and DBH in the established objective function, scenarios based on different weights were configured (Table 1).
M a x   Z = w 0 D B H ¯ w 1 C I ¯
C I ¯ = Average competition index of residual trees, D B H ¯ = Average diameter at breast height of residual trees.
Table 1. Weight settings for competition index and DBH in objective functions by thinning scenarios.
CategoryDBH Weight (w0)Competition Index Weight (w1)
Scenario 10.20.8
Scenario 20.40.6
Scenario 30.60.4
Scenario 40.80.2

2.3.6. Comparison and Evaluation of Thinning Tree Selection Results Using Expert and Machine Learning Tree Selection Systems

To evaluate the thinning tree selection results of the machine learning tree selection system, expert tree selection data were collected by commissioning forestry experts currently working in the forest industry to perform thinning tree selection for the entire 1 ha study site. The number of residual trees selected through expert selection was set to 400 trees, referring to the number of standing trees after thinning in the Guidelines for Sustainable Forest Resource Management in Korea [44].
Thinning tree selection using the tree selection system was conducted in an 80 m × 80 m thinning target area with a 10 m buffer zone applied to the entire 1 ha study site for competition index calculation. The number of residual trees in the machine learning tree selection system was set equal to the number of residual trees selected by experts in the thinning target area. Accordingly, 231 trees out of 492 trees were selected as thinning trees in the thinning target area.
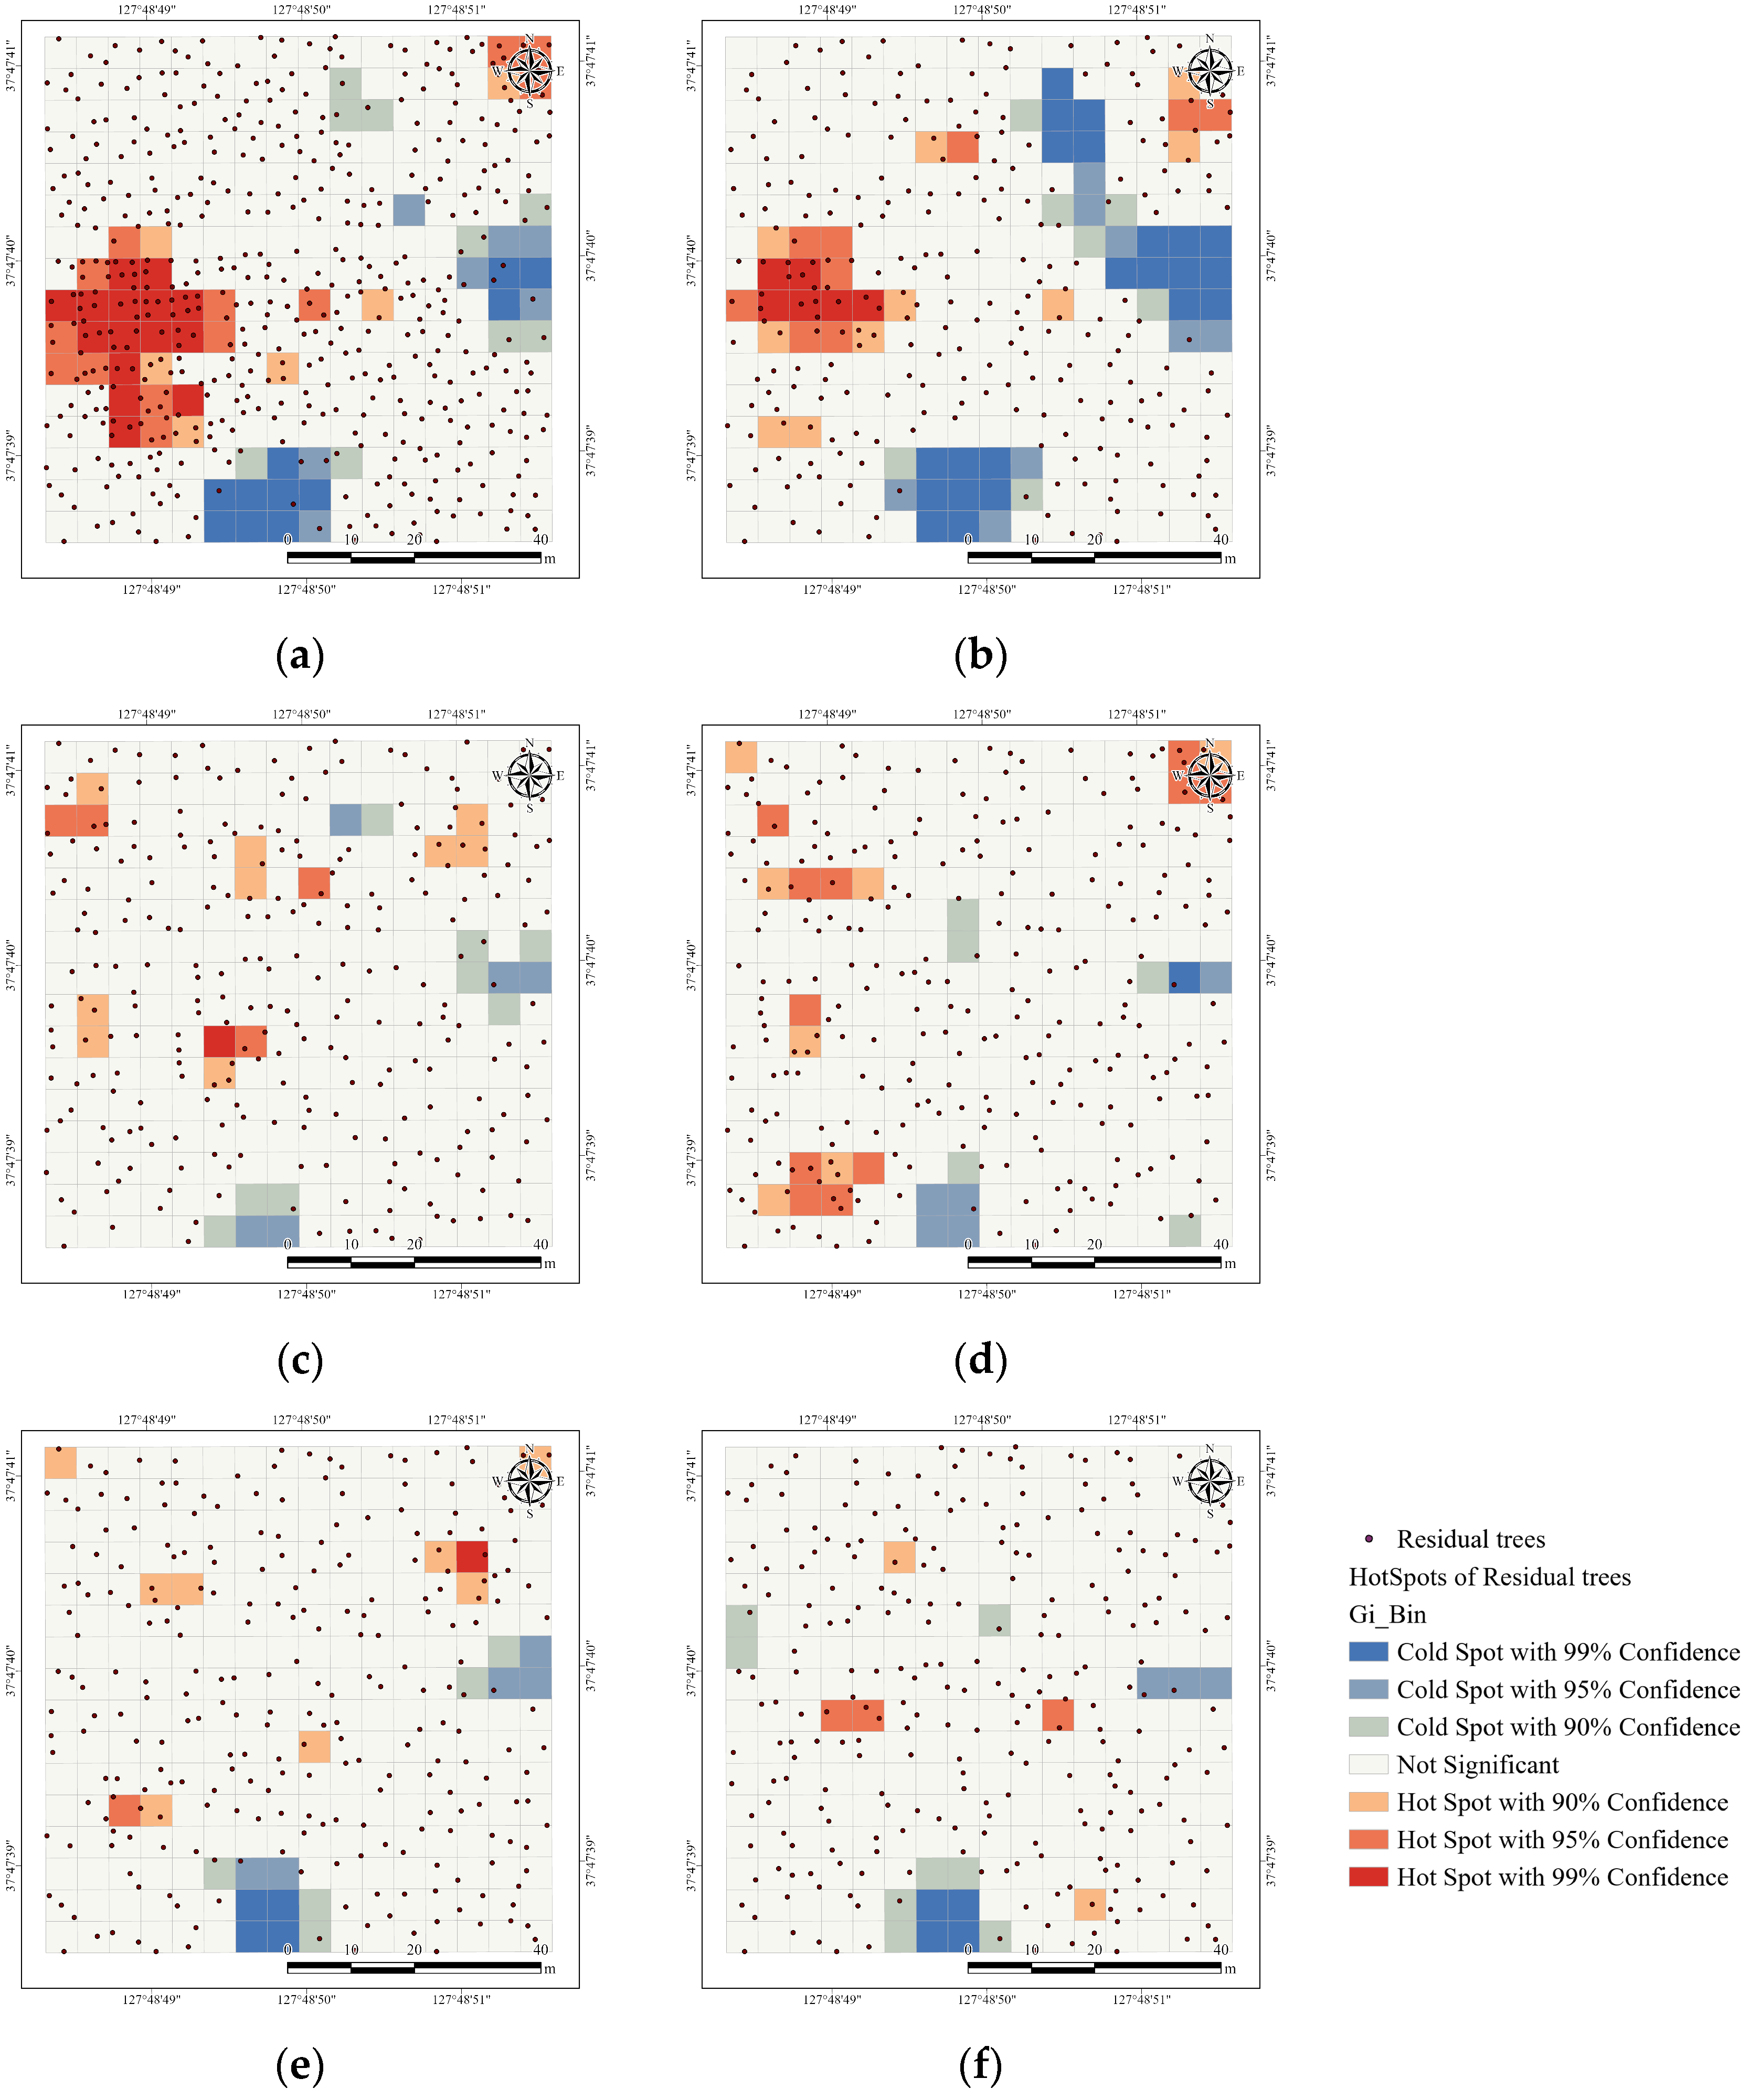
Accordingly, the average DBH and competition index of residual trees derived through expert selection were compared with the average DBH and competition index of residual trees optimized through the machine learning thinning tree selection method. Additionally, to evaluate the spatial distribution of residual trees, Getis-Ord Gi* analysis was performed based on the number of residual trees aggregated in 5 m grid units, and spatial autocorrelation was compared using the Global Moran’s I index [45,46]. Through this approach, the study aimed to statistically test whether the spatial distribution characteristics of residual trees significantly differed between the two selection methods and to analyze differences in spatial concentration and dispersion patterns.
G i * = j = 1 n w i j x j X ¯ j = 1 n w i j s n j = 1 n w i j 2     j = 1 n w i j 2 n 1
x i = Attribute value of i, s = Standard deviation, n = Total number of cases, w i j = Spatial Weight (value of spatial weight matrix).
T h e   c a s e   w h e r e   i   i s   a d j a c e n t   t o   j   :   1               T h e   c a s e   w h e r e   I   i s   n o t   a d j a c e n t   t o   j   : 0

3. Results and Discussion

3.1. Individual Tree Detection Using LiDAR

The individual tree position detection algorithm developed in this study detected a total of 739 individual trees, of which 4 trees were falsely detected as individual trees from non-tree points. Additionally, all individual trees except one out of the 736 individual trees within the study site were correctly detected. The F1-score of the algorithm was over 99%, demonstrating effective applicability for individual tree detection (Table 2).
Meanwhile, the one undetected individual tree was located in a steeply sloped area where the lower portion of the tree was occluded, resulting in missing points from the lower breast height area. Additionally, false detection cases occurred when understory vegetation and terrain points met the individual tree selection criteria. The individual tree detection algorithm in this study extracts diameters at three height points to test conditions, and it was characterized by being influenced by understory vegetation and terrain features when the height was low, and by branches and leaves of the crown when point extraction was at higher elevations.
The individual tree detection algorithm proposed in this study achieved very high accuracy in constructing individual tree position information, with both Precision and Recall exceeding 99%. Compared to previous individual tree detection studies, Michałowska et al. [14] reported an accuracy of 94.8%, Lin et al. [47] reported an F1 score of 0.91, and Liu et al. [26] detected 64 out of 66 trees in their study case. Accordingly, the accuracy and applicability of the individual tree detection algorithm in this study are judged to be higher than those of previous studies. In previous research, there were cases where individual trees were undetected due to missing stem points caused by LiDAR occlusion effects, but this study aimed to minimize diameter occlusion by collecting data at 10 m intervals across the entire 1 ha study site [14]. Additionally, unlike existing studies, this research presented a simple and effective individual tree detection approach by creating a two-dimensional density map using all points across the study site to derive individual tree candidates, then making final decisions on points that meet detection conditions as individual trees. The detection algorithm in this study can effectively extend and apply the algorithm to various forest conditions by setting diameter extraction heights relatively high when understory vegetation is well-developed and low in forest stands with developed branches and leaves. In particular, considering that research cases detecting individual tree positions with high accuracy at the forest stand level are still limited, the algorithm presented in this study is expected to contribute to precision forestry data construction.

3.2. Evaluation of DBH Estimation Accuracy According to Circle Fitting Algorithms

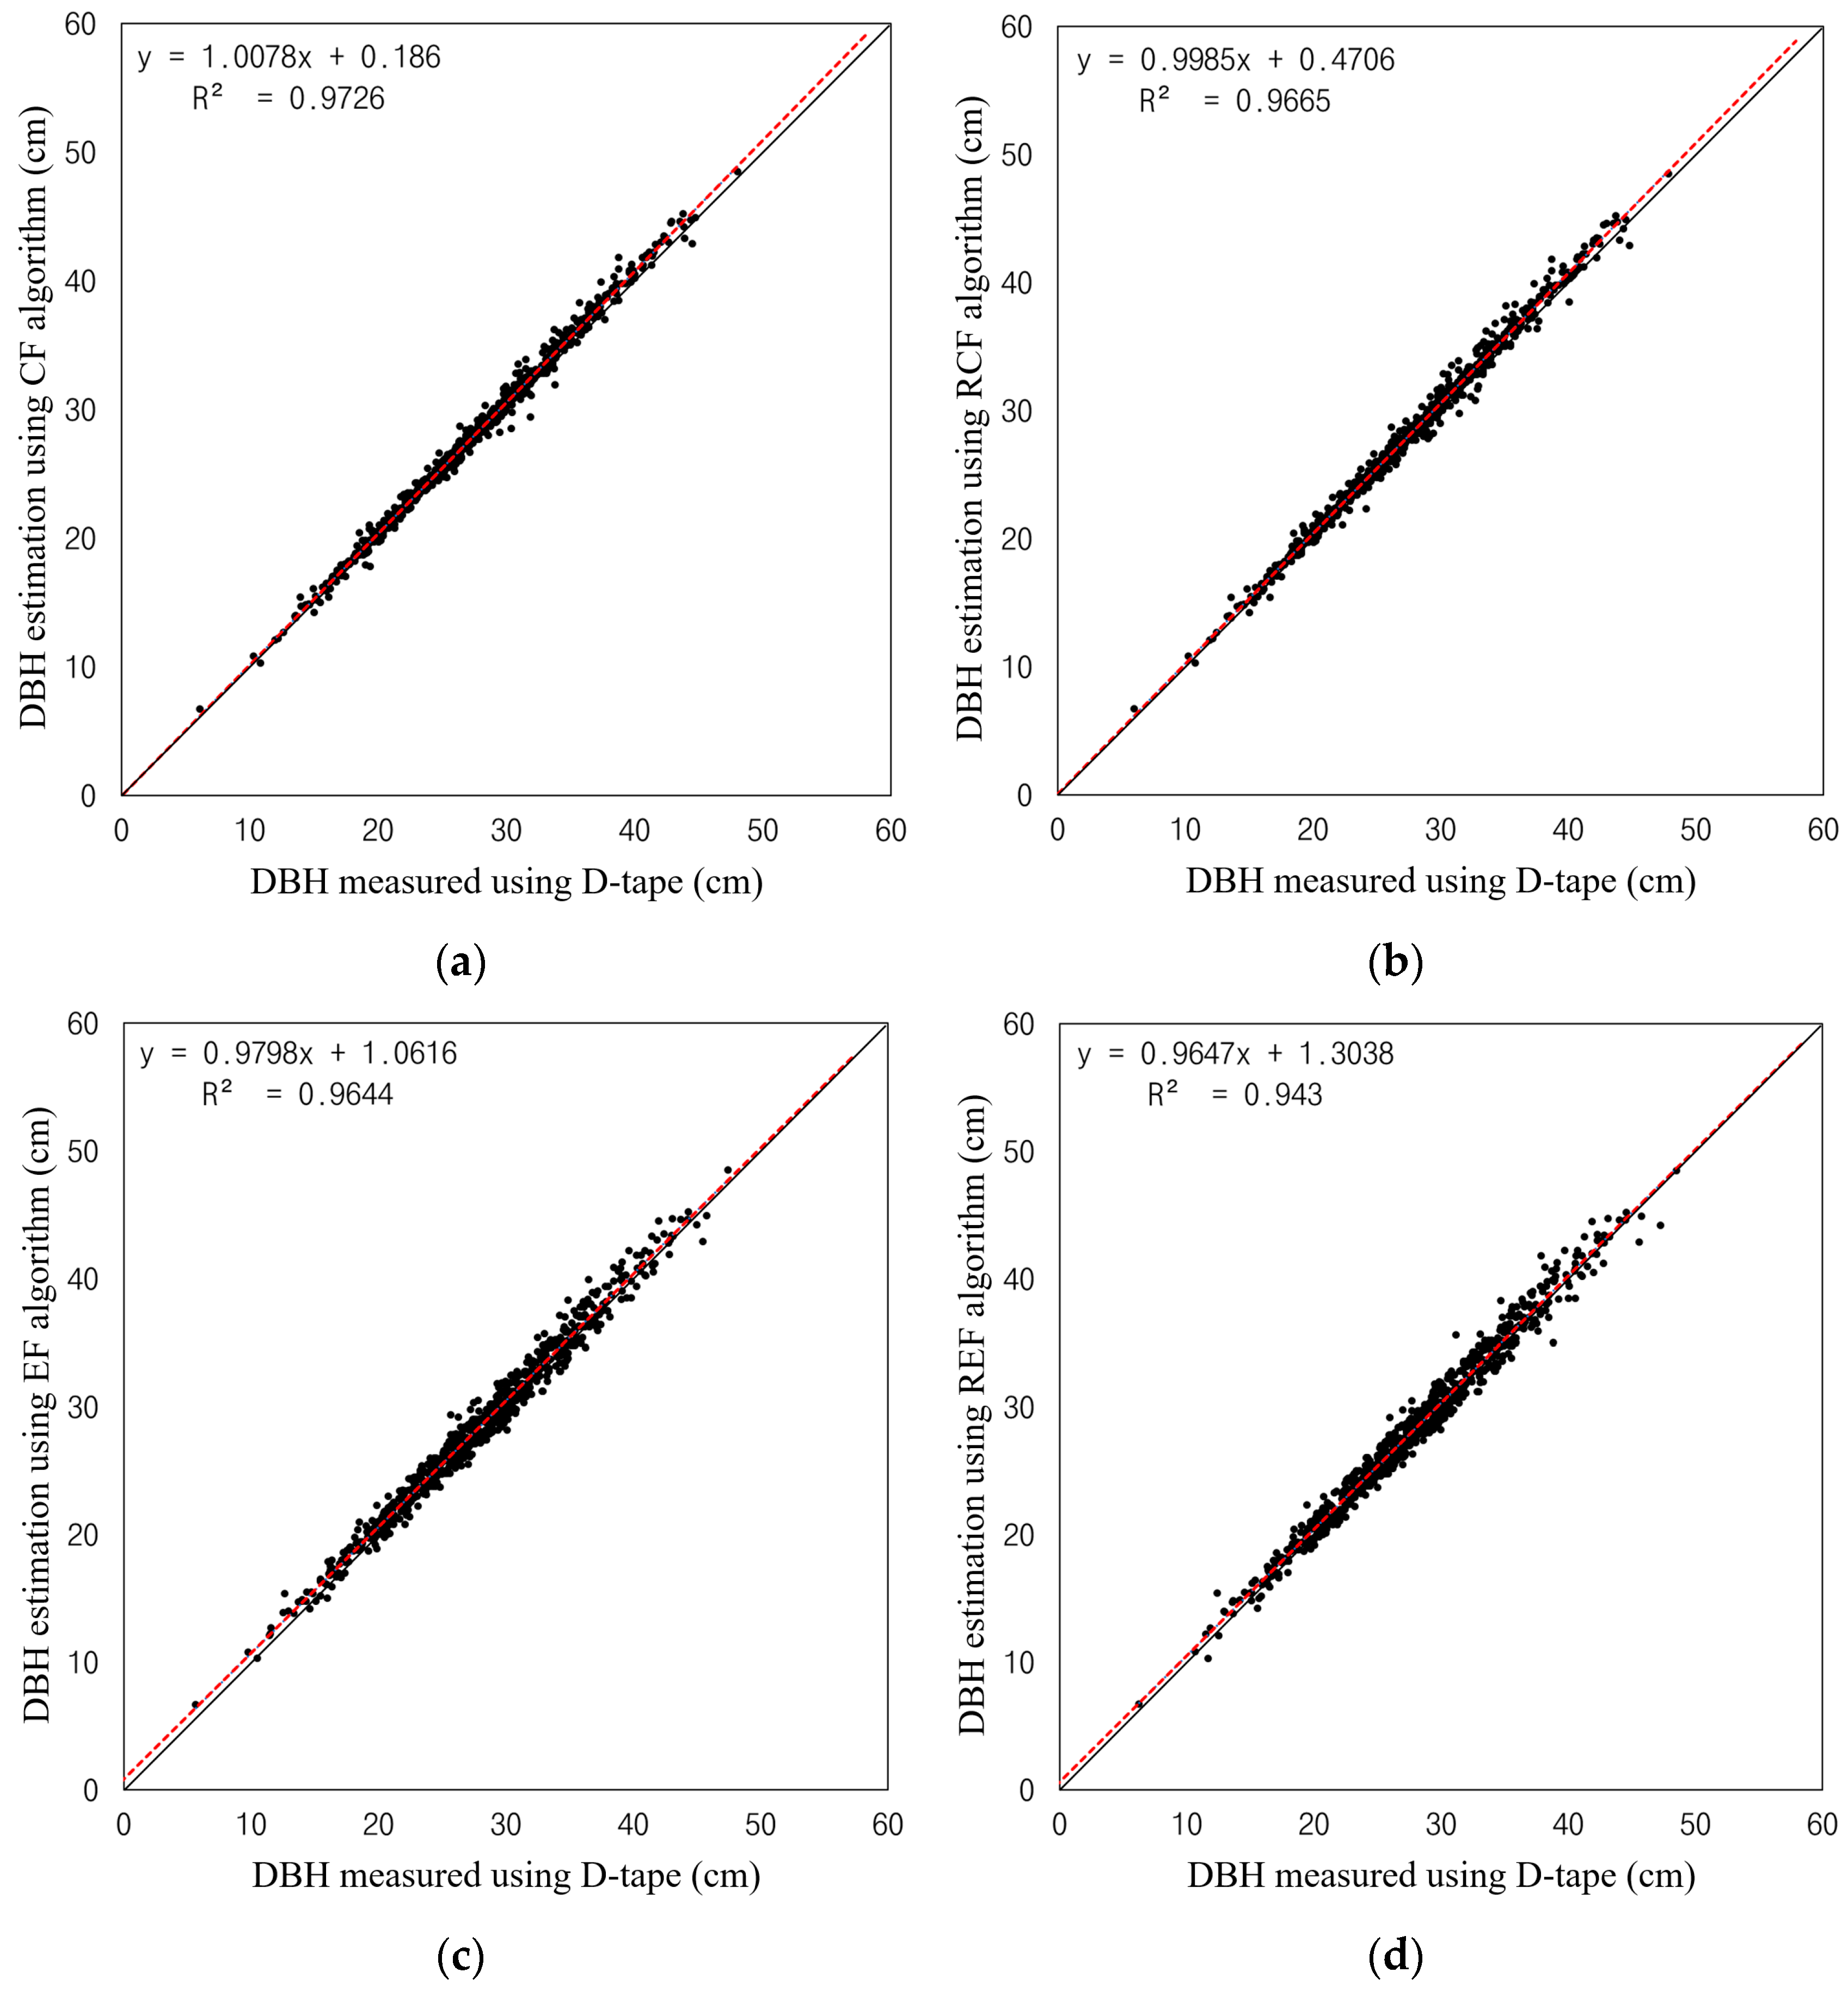
The evaluation of DBH estimation accuracy revealed that CF had the highest accuracy among the four methods, regardless of outlier inclusion. Particularly, the CF method showed the lowest values with an RMSE of 1.21 cm when outliers were included and 0.74 cm after outlier removal, and the number of outliers was also the smallest at 9 out of 736 total trees, along with REF. According to existing research, it has been reported that accuracy can be improved in complex forests by applying RANSAC to reduce the influence of noise points [23,48]. However, for the managed Korean pine forest in this study, which had virtually no high branches and understory vegetation, simple CF utilizing all points without RANSAC was more effective (Table 3, Figure 7). In particular, RANSAC algorithms take longer computation time compared to simple least squares methods because they estimate diameter through iterative processes [49]. Therefore, an appropriate diameter estimation algorithm selection is necessary according to the noise level of the study site
Meanwhile, when EF was used, the number of outliers was the highest at 13 trees, and there was one case out of 736 trees where DBH estimation was impossible. This occurred because no solution existed for the normal equation when applying the least squares method, which happened when point shapes differed significantly from elliptical forms due to the influence of branches or understory vegetation. However, even in such cases, DBH estimation was possible for all individual trees when RANSAC was applied, making the combination with RANSAC essential when utilizing EF.
In previous studies, TLS-based DBH estimation accuracy (RMSE) was reported to range from 0.2 to 1.6 cm depending on data acquisition conditions and algorithms, and the results of this study were similar to this range [21,50,51,52,53]. Additionally, considering cases where DBH measurements are taken in 1 cm or 2 cm increments when establishing forest management plans in Korea, the accuracy of RMSE 0.74 cm is judged to have high applicability. The outliers that occurred in this study were cases where the DBH was very small, resulting in few points constituting the stem and thus being heavily influenced by surrounding points, such as branches, and cases where branching occurred near the breast height position, increasing errors [54].

3.3. Tree Height Estimation and Accuracy Evaluation Using Multi-Platform LiDAR Data

The accuracy, according to the Maximum filtering window size, improved significantly until the window size reached 5 by 5, but thereafter, even when the window size was increased, the variation in RMSE was small, distributed at less than approximately 0.2 m. Meanwhile, tree height estimation using TLS showed significant accuracy improvement as the window size increased. This is attributed to the characteristic of TLS data where points from the upper canopy are missing due to occlusion effects, leading to underestimation of tree height, and the Maximum filtering effectively addressed this underestimation problem [55]. Additionally, when only ULS was used, tree height estimation accuracy was low, which was due to the very high canopy closure of the study site, making it difficult to accurately construct ground information using ULS alone [35,56]. Meanwhile, TLS + ULS utilizing Multi-Platform LiDAR data could construct points for both upper and lower forest sections, resulting in high accuracy for both all individual trees and dominant trees. Therefore, it is judged that the fusion of terrestrial LiDAR and aerial LiDAR data is necessary for accurate tree height estimation in areas with high canopy closure (Figure 8).
Visualization of tree height estimation errors according to filter size using Box plots revealed that for the original data (1 by 1), based on TLS + ULS, the RMSE was highest at 2.24 m for all individual trees and 2.89 m for dominant trees, with a tendency toward underestimation of tree height. However, after applying Maximum filtering, the underestimation of tree height was improved. When the window size was 11 by 11, the accuracy was similarly distributed to the 21 by 21 case, indicating that the purpose of Maximum filtering could be achieved with 11 by 11 alone. Notably, the RMSE distribution patterns for all individual trees and dominant trees differed according to window size. As the window size increased, the RMSE for dominant trees in TLS + ULS data decreased from 1.53 m (11 by 11) to 1.46 m (21 by 21), showing increased accuracy. Conversely, the RMSE for all individual trees increased from 1.93 m (11 by 11) to 2.06 m (21 by 21), actually showing decreased accuracy. This is attributed to the overestimation of intermediate and suppressed trees due to the influence of surrounding dominant trees when the window size becomes excessively large [57]. Therefore, it is judged that the process of setting an optimal window size considering site characteristics is important (Figure 9, Table 4).
Methods for estimating tree height using LiDAR data include approaches utilizing CHM and methods that measure tree height by segmenting individual trees from point clouds [58,59]. Point cloud-based tree height measurement methods have limitations in applying to large-scale areas due to high costs and time requirements in the individual tree segmentation process [60]. Additionally, ITD algorithms primarily used in CHM-based methods detect tree tops mainly from dominant trees. Therefore, there were limitations in detecting intermediate and suppressed trees and matching them with individual tree positions detected from TLS data [61]. Within these limitations, this study is significant in that it presented a practical alternative that can effectively improve tree height estimation accuracy using simple Maximum filtering alone, without complex point cloud processing or ITD algorithms. In particular, the overall individual tree RMSE of 1.93 m and dominant tree RMSE of 1.53 m obtained through Multi-Platform LiDAR are judged to have sufficiently high field applicability considering the general error rates that occur during field tree height measurements [16,62]

3.4. Optimal Thinning Tree Selection and Evaluation Using Genetic Algorithms

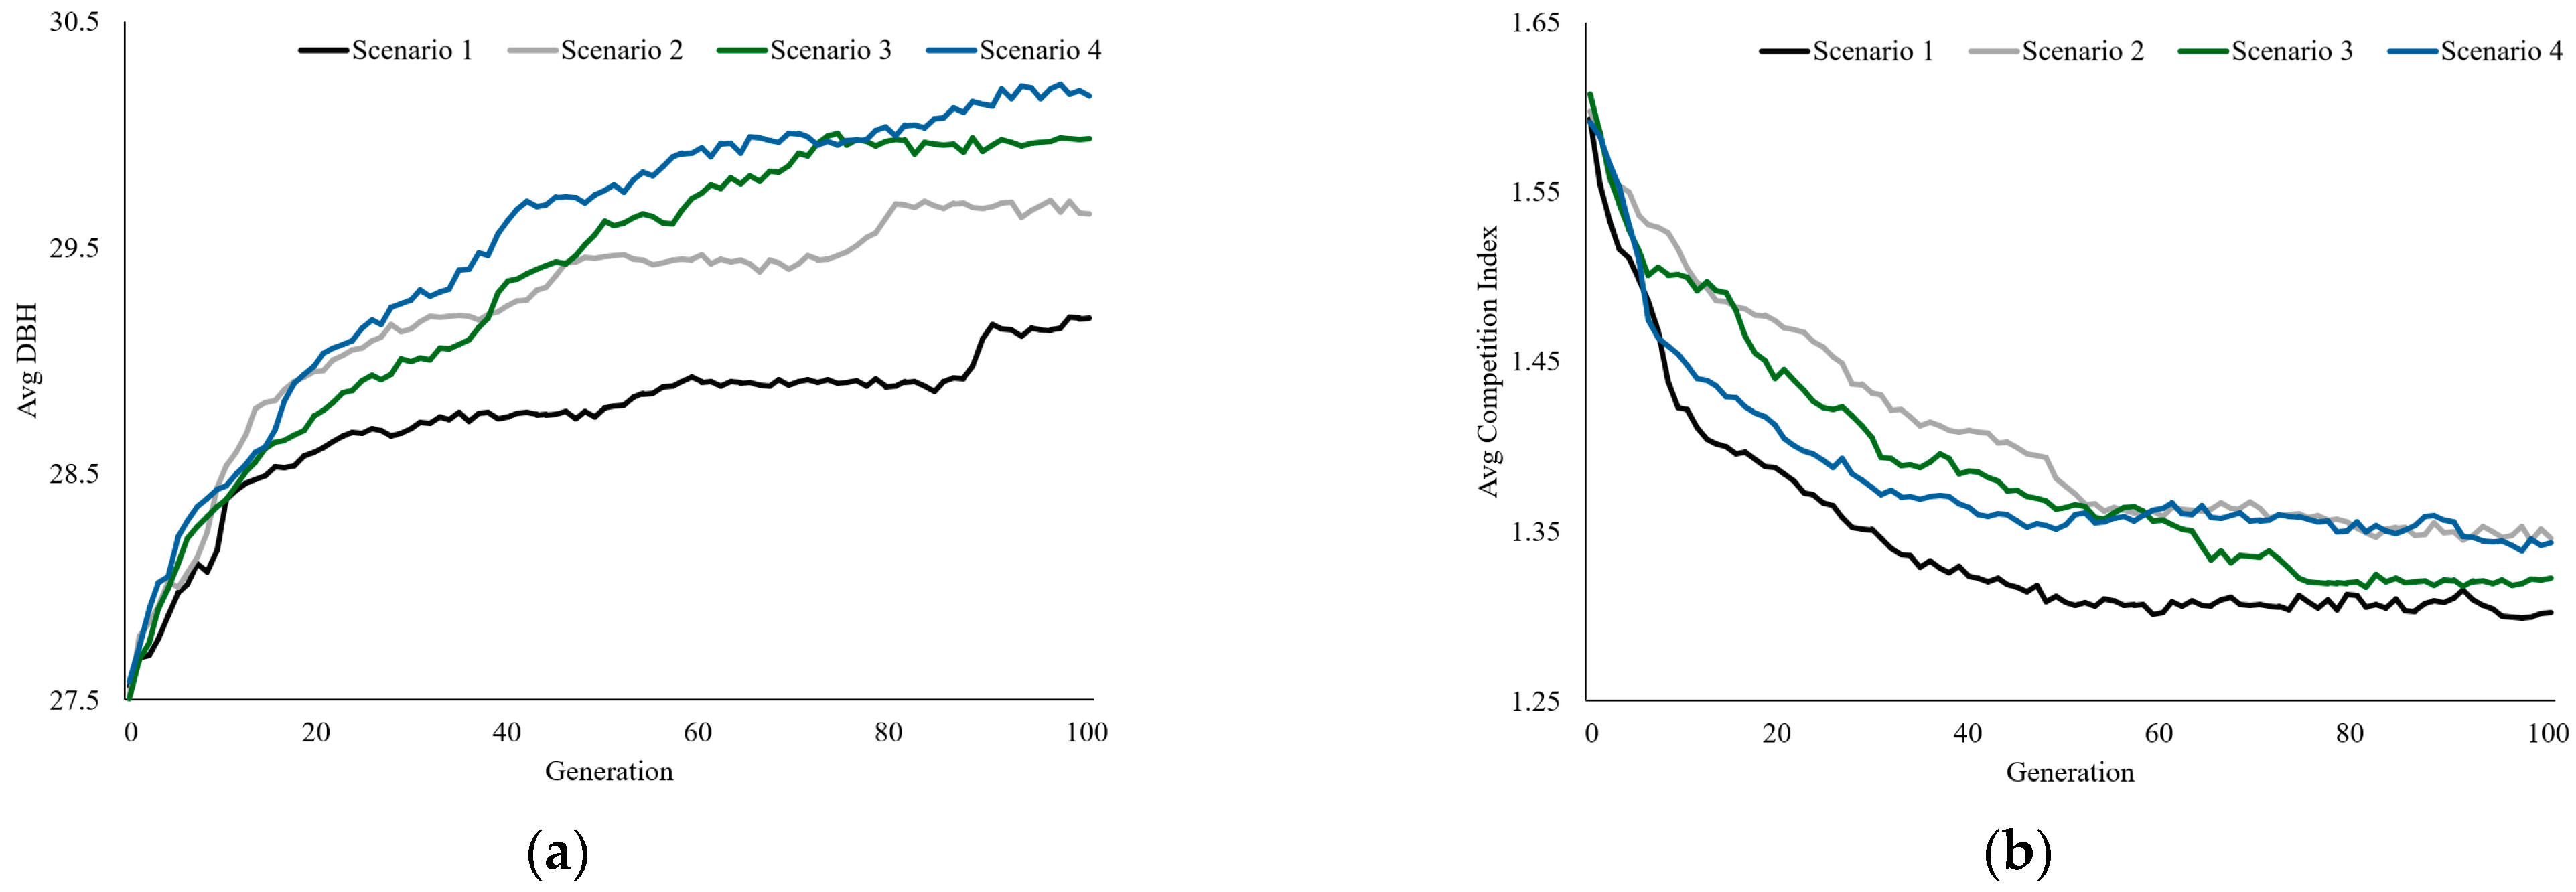
To examine whether genetic algorithms were optimized according to objective functions for each scenario, the changes in average DBH and competition index of residual trees by generation up to 100 generations were visualized. The results varied depending on the weights set for each scenario.
In Scenario 1, the average DBH of residual trees was distributed at low levels, and the average competition index showed a pattern of gradually decreasing over generations. Scenario 4 also showed a similar pattern to Scenario 1, but both the average DBH and competition index were higher. Examining the average competition index of optimized residual trees by scenario, it was distributed as 1.29 in Scenario 1 and 1.34 in Scenario 4, which had a low weight for the competition index. These values were distributed lower than 1.41, the average competition index of residual trees in expert selection results (Table 5).
The objective functions by scenario show that as scenarios increase from 1 to 4, the weight of the competition index decreases while the weight of DBH increases. These changes in objective functions by scenario influenced the average DBH and competition index of residual trees according to generation number, showing a pattern where the average DBH and competition index of residual trees by generation increased as scenarios progressed from 1 to 4. Accordingly, the machine learning tree selection system is expected to be useful for optimal thinning tree selection by adjusting the weights of tree developmental status and competitive status according to users’ thinning purposes and practices (Figure 10). The optimized outcomes of lower competition indices and higher average DBH directly contribute to enhanced forest productivity by ensuring better resource availability and growth capacity for residual trees. This improvement translates to increased potential for volume increment and carbon sequestration over the rotation period [63].

3.5. Comparison of Expert Selection and Machine Learning Tree Selection System Using Spatial Statistical Techniques

Global Moran’s I analysis results showed that both before thinning (0.1608) and expert selection results (0.1583) exhibited statistically significant positive spatial autocorrelation (z-score > 4.9, p-value < 0.001). This indicates that residual trees are distributed, forming spatially consistent clusters. In contrast, the four scenarios of the machine learning tree selection system showed Moran’s I indices that were negative or close to zero (z-score −0.07~−1.15, p-value 0.25~0.94), indicating a random distribution without significant spatial autocorrelation. Accordingly, it is judged that residual trees from the machine learning tree selection system are distributed more spatially uniformly compared to expert selection, enabling better securing of growing space for individual trees (Table 6).
The Getis-Ord Gi* analysis results also showed that the residual tree distribution from expert selection formed Hotspots and Coldspots similar to the pre-thinning distribution, with spatial concentration tendencies partially maintained. Particularly, the spatial locations of major Hotspots and Coldspots were similarly distributed between pre-thinning and expert selection results. This is attributed to experts considering the regional forest structure of the stand before thinning when making selections. In contrast, the scenarios of the machine learning tree selection system showed relatively uniform distribution of Hotspots and Coldspots overall. This is attributed to the machine learning tree selection system selecting thinning trees based on quantitative evaluation indicators that include competition indices. These results suggest that using the machine learning tree selection system can effectively resolve spatial clustering of individual trees (Figure 11).
The machine learning tree selection system demonstrates three fundamental advantages over expert selection, representing a novel paradigm shift from local, sequential decision-making to global, simultaneous optimization in forest thinning operations.
First, while expert selection evaluates trees sequentially from a local perspective within a limited visual range, our system uniquely processes all 492 trees simultaneously through genetic algorithm optimization. Through 100 generations with 32 candidate solutions per generation (3200 total evaluations), the algorithm systematically explores the solution space and identifies the global optimum that maximizes residual tree quality while minimizing competition intensity. This comprehensive search process resulted in a near-random spatial distribution (Moran’s I = −0.04, p = 0.25 in Scenario 3), effectively eliminating the clustering patterns maintained by expert selection (Moran’s I = 0.16, p < 0.001). The ability to evaluate and compare thousands of alternative thinning scenarios represents a fundamental advantage that is practically impossible through conventional field-based assessment.
Second, the quantitative optimization achieved measurable improvements: 2.7% increase in average DBH (30.06 cm vs. 29.26 cm) and 7.1% reduction in competition index (1.31 vs. 1.41) compared to expert selection. More importantly, Getis-Ord Gi* analysis revealed that while expert selection maintained pre-existing hotspot and coldspot patterns, our system achieved substantially more uniform distribution, ensuring consistent growing space allocation across the entire stand. This represents the first application of metaheuristic optimization to individual tree-level thinning selection based on high-resolution LiDAR data, addressing a critical gap between precision forest inventory and operational management decisions.
Third, the system provides consistent, reproducible results independent of operator expertise, addressing practical challenges of declining forestry labour and variable skill levels. By systematically evaluating 3200 alternative solutions through objective fitness criteria, the algorithm eliminates the subjective variability inherent in expert judgement while maintaining the flexibility to adjust optimization priorities through scenario-based weighting.
In summary, this study uniquely integrates Multi-Platform LiDAR-derived individual tree information with genetic algorithm optimization to achieve: (1) exhaustive evaluation of thousands of thinning alternatives impossible through manual assessment, (2) quantitatively superior outcomes in both tree quality and spatial distribution, and (3) consistent, data-driven decision-making applicable regardless of operator skill level. These advantages demonstrate the transformative potential of optimization-based approaches to overcome fundamental limitations of conventional thinning practices.

4. Conclusions

This study aimed to estimate individual tree positions, DBH, and tree height using LiDAR to evaluate the developmental and competitive status of trees, and to select optimal thinning trees according to objective functions using genetic algorithms. Through this approach, the study sought to present objective and quantitative methods to overcome the qualitative and subjective limitations of existing thinning tree selection processes.
The results of constructing forest resource information using LiDAR showed that the individual tree detection algorithm achieved both detection rate and accuracy exceeding 99%. Additionally, when CF was applied for DBH estimation, after removing 9 outliers out of 736 trees, the RMSE was 0.74 cm, demonstrating very high accuracy. Meanwhile, tree height showed the highest accuracy when using fused TLS and ULS data, with an RMSE of approximately 2 m. These high-precision individual tree parameters enabled the reliable calculation of competition indices for optimization.
Machine learning-based thinning tree selection optimization utilized forest resource information from LiDAR to calculate competition indices and performed optimization using the average competition index and DBH values of residual trees. Through this process, optimal DBH and competition indices were derived for each scenario according to objective functions. Accordingly, it is judged that this approach can be usefully applied by adjusting the weights of tree developmental status and competitive status according to users’ thinning purposes and practices. Importantly, compared to expert selection results, the machine learning system not only achieved comparable outcomes but demonstrated clear superiority in both consistency and spatial balance. Specifically, Scenario 3 achieved 2.7% higher average DBH (30.06 cm vs. 29.26 cm), 7.1% lower competition index (1.31 vs. 1.41), and transformed a spatially clustered distribution (Moran’s I = 0.16) into a near-random distribution (Moran’s I = −0.04), delivering reproducible results with optimized uniform distribution of residual trees.
This study has significant implications in that it can present consistent thinning criteria through data-driven, objective, and quantitative evaluation, replacing the thinning tree selection process that previously relied on qualitative judgment. In particular, by combining LiDAR and machine learning techniques to implement a tree selection system that fundamentally outperforms expert-based approaches in spatial optimization while maintaining operator-independent consistency, it is expected to serve as fundamental data for realizing individual tree-level forest management. Furthermore, it is expected to contribute to advancing forest management systems through management strategy development via pre-thinning simulations and prediction of spatial structure improvement effects.

Author Contributions

Conceptualization, Y.L. and J.L.; methodology, Y.L. and J.L.; software, Y.L.; validation, Y.L. and J.L.; formal analysis, Y.L.; investigation, Y.L., W.S. and S.L.; resources, Y.L.; data curation, Y.L.; writing—original draft preparation, Y.L., W.S. and S.L.; writing—review and editing, J.L.; visualization, Y.L.; supervision, J.L.; project administration, J.L.; funding acquisition, J.L. All authors have read and agreed to the published version of the manuscript.

Funding

This study was carried out with the support of ‘R&D Program for Forest Science Technology’ (Project No. RS-2025-02213492 and 2021359A00-2223-BD01) provided by Korea Forest Service (Korea Forestry Promotion Institute).

Data Availability Statement

The data used to support the findings of this study are available from the corresponding author upon request.

Conflicts of Interest

The authors declare no conflicts of interest.

Abbreviations

The following abbreviations are used in this manuscript:
TLSTerrestrial Laser Scanning
ULSUnmanned Aerial Vehicle Laser Scanning
DBHDiameter at Breast Height
RMSERoot Mean Square Error
GCPGround Control Point
DSMDigital Surface Models
DEMDigital Elevation Models
CHMCanopy Height Models

References

  1. Fuller, M.R.; Ganjam, M.; Baker, J.S.; Abt, R.C. Advancing forest carbon projections requires improved convergence between ecological and economic models. Carbon Balance Manag. 2025, 20, 2. [Google Scholar] [CrossRef]
  2. Loehle, C.; Miller, D.A.; Kovach, A.I.; Larsen-Gray, A.L.; Akresh, M.E.; McDonald, J.E.; Cheeseman, A.E.; King, D.; Petzinger, S.M.; Kanter, J. Forest Management Is Key for Conserving Biodiversity and Providing Ecosystem Services in the United States. Forests 2024, 15, 2087. [Google Scholar] [CrossRef]
  3. Ameray, A.; Bergeron, Y.; Valeria, O.; Girona, M.M.; Cavard, X. Forest Carbon Management: A Review of Silvicultural Practices and Management Strategies Across Boreal, Temperate and Tropical Forests. In Current Forestry Reports; Springer: Berlin/Heidelberg, Germany, 2021. [Google Scholar]
  4. Lundholm, A.; Black, K.; Corrigan, E.; Nieuwenhuis, M. Evaluating the impact of future global climate change and bioeconomy scenarios on ecosystem services using a strategic forest management decision support system. Front. Ecol. Evol. 2020, 8, 200. [Google Scholar] [CrossRef]
  5. Moreau, G.; Chagnon, C.; Achim, A.; Caspersen, J.; D’Orangeville, L.; Sánchez-Pinillos, M.; Thiffault, N. Opportunities and limitations of thinning to increase resistance and resilience of trees and forests to global change. Forestry 2022, 95, 595–615. [Google Scholar] [CrossRef]
  6. Zhang, H.; Liu, S.; Yu, J.; Li, J.; Shangguan, Z.; Deng, L. Thinning increases forest ecosystem carbon stocks. For. Ecol. Manag. 2024, 555, 121702. [Google Scholar] [CrossRef]
  7. Pretzsch, H. Density and growth of forest stands revisited. Effect of the temporal scale of observation, site quality, and thinning. For. Ecol. Manag. 2020, 460, 117879. [Google Scholar] [CrossRef]
  8. Lee, D.S.; Choi, J.K. Comparison of stand structure and growth characteristics between Korean white pine plantation and oak-dominated natural deciduous forest by thinning treatment. J. Ecol. Environ. 2022, 46, 85–98. [Google Scholar] [CrossRef]
  9. Spinelli, R.; Magagnotti, N.; Pari, L.; Soucy, M. Comparing tree selection as performed by different professional figures. For. Sci. 2016, 62, 213–219. [Google Scholar] [CrossRef]
  10. Park, J.K.; Lee, K.W. Individual tree detection and modeling using terrestrial and drone-mounted laser scanners. J. Korea Acad.-Ind. Coop. Soc. 2022, 23, 36–41. [Google Scholar] [CrossRef]
  11. Šporčić, M.; Landekić, M.; Šušnjar, M.; Pandur, Z.; Bačić, M.; Mijoč, D. Deliberations of forestry workers on current challenges and future perspectives on their profession—A case study from Bosnia and Herzegovina. Forests 2023, 14, 817. [Google Scholar] [CrossRef]
  12. Liu, T.; Sun, Y.; Wang, C.; Zhang, Y.; Qiu, Z.; Gong, W.; Lei, S.; Tong, X.; Duan, X. Unmanned aerial vehicle and artificial intelligence revolutionizing efficient and precision sustainable forest management. J. Clean. Prod. 2021, 311, 127546. [Google Scholar] [CrossRef]
  13. Singh, R.; Gehlot, A.; Akram, S.V.; Thakur, A.K.; Buddhi, D.; Das, P.K. Forest 4.0: Digitalization of forest using the Internet of Things (IoT). J. King Saud Univ.-Comput. Inf. Sci. 2022, 34, 5587–5601. [Google Scholar] [CrossRef]
  14. Michałowska, M.; Rapiński, J.; Janicka, J. Tree position estimation from TLS data using hough transform and robust least-squares circle fitting. Remote Sens. Appl. Soc. Environ. 2023, 29, 100863. [Google Scholar] [CrossRef]
  15. Hui, Z.; Lin, L.; Jin, S.; Xia, Y.; Ziggah, Y.Y. A reliable dbh estimation method using terrestrial lidar points through polar coordinate transformation and progressive outlier removal. Forests 2024, 15, 1031. [Google Scholar] [CrossRef]
  16. Lee, Y.K.; Lee, J.S. Advancing Stem Volume Estimation Using Multi-Platform LiDAR and Taper Model Integration for Precision Forestry. Remote Sens. 2025, 17, 785. [Google Scholar] [CrossRef]
  17. Fransson, P.; Franklin, O.; Lindroos, O.; Nilsson, U.; Brännström, Å. A simulation-based approach to a near-optimal thinning strategy: Allowing harvesting times to be determined for individual trees. Can. J. For. Res. 2020, 50, 320–331. [Google Scholar] [CrossRef]
  18. Niemi, M.T.; Vauhkonen, J.; Uusitalo, J. Trade-off analysis for multi-objective boreal forest thinning. For. Int. J. For. Res. 2025, cpaf027. [Google Scholar] [CrossRef]
  19. Wardius, Y.; Hein, S. Terrestrial laser scanning vs. manual methods for assessing complex forest stand structure: A comparative analysis on plenter forests. Eur. J. For. Res. 2024, 143, 635–649. [Google Scholar] [CrossRef]
  20. Zimmerman, T.; Jansen, K.; Miller, J. Analysis of UAS Flight Altitude and Ground Control Point Parameters on DEM Accuracy along a Complex, Developed Coastline. Remote Sens. 2020, 12, 2305. [Google Scholar] [CrossRef]
  21. Storch, M.; Jarmer, T.; Adam, M.; de Lange, N. Systematic approach for remote sensing of historical conflict landscapes with UAV-based laserscanning. Sensors 2021, 22, 217. [Google Scholar] [CrossRef]
  22. Iheaturu, C.J.; Hepner, S.; Batchelor, J.L.; Agonvonon, G.A.; Akinyemi, F.O.; Wingate, V.R.; Speranza, C.I. Integrating UAV LiDAR and multispectral data to assess forest status and map disturbance severity in a West African forest patch. Ecol. Inform. 2024, 84, 102876. [Google Scholar] [CrossRef]
  23. Lee, Y.; Lee, J. Evaluation of Accuracy in Estimating Diameter at Breast Height Based on the Scanning Conditions of Terrestrial Laser Scanning and Circular Fitting Algorithm. Forests 2024, 15, 313. [Google Scholar] [CrossRef]
  24. Zhang, W.; Qi, J.; Wan, P.; Wang, H.; Xie, D.; Wang, X.; Yan, G. An easy-to-use airborne LiDAR data filtering method based on cloth simulation. Remote Sens. 2016, 8, 501. [Google Scholar] [CrossRef]
  25. Bailey, G.; Li, Y.; McKinney, N.; Yoder, D.; Wright, W.; Herrero, H. Comparison of ground point filtering algorithms for high-density point clouds collected by terrestrial LiDAR. Remote Sens. 2022, 14, 4776. [Google Scholar] [CrossRef]
  26. Liu, G.; Wang, J.; Dong, P.; Chen, Y.; Liu, Z. Estimating individual tree height and diameter at breast height (DBH) from terrestrial laser scanning (TLS) data at plot level. Forests 2018, 9, 398. [Google Scholar] [CrossRef]
  27. Olofsson, K.; Holmgren, J.; Olsson, H. Tree stem and height measurements using terrestrial laser scanning and the RANSAC algorithm. Remote Sens. 2014, 6, 4323–4344. [Google Scholar] [CrossRef]
  28. Rodríguez-Puerta, F.; Gómez-García, E.; Martín-García, S.; Pérez-Rodríguez, F.; Prada, E. UAV-Based LiDAR Scanning for Individual Tree Detection and Height Measurement in Young Forest Permanent Trials. Remote Sens. 2022, 14, 170. [Google Scholar] [CrossRef]
  29. Xiang, B.; Wielgosz, M.; Kontogianni, T.; Peters, T.; Puliti, S.; Astrup, R.; Schindler, K. Automated forest inventory: Analysis of high-density airborne LiDAR point clouds with 3D deep learning. Remote Sens. Environ. 2024, 305, 114078. [Google Scholar] [CrossRef]
  30. Chen, Q.; Gao, T.; Zhu, J.; Wu, F.; Li, X.; Lu, D.; Yu, F. Individual Tree Segmentation and Tree Height Estimation Using Leaf-Off and Leaf-On UAV-LiDAR Data in Dense Deciduous Forests. Remote Sens. 2022, 14, 2787. [Google Scholar] [CrossRef]
  31. Sačkov, I. Forest inventory based on canopy height model derived from airborne laser scanning data. Cent. Eur. For. J. 2022, 68, 224–231. [Google Scholar] [CrossRef]
  32. Chen, Q.; Baldocchi, D.; Gong, P.; Kelly, M. Isolating individual trees in a savanna woodland using small footprint lidar data. Photogramm. Eng. Remote Sens. 2006, 72, 923–932. [Google Scholar] [CrossRef]
  33. Lisiewicz, M.; Kamińska, A.; Kraszewski, B.; Stereńczak, K. Correcting the results of CHM-based individual tree detection algorithms to improve their accuracy and reliability. Remote Sens. 2022, 14, 1822. [Google Scholar] [CrossRef]
  34. Lee, Y.K.; Lee, J.S.; Park, J.W. A study on classification of crown classes and selection of thinned trees for major conifers using machine learning techniques. J. Korean Soc. For. Sci. 2022, 111, 302–310. [Google Scholar]
  35. Moore, J.A.; Budelsky, C.A.; Schlesinger, R.C. A new index representing individual tree competitive status. Can. J. For. Res. 1973, 3, 495–500. [Google Scholar] [CrossRef]
  36. Martin, G.L.; Ek, A.R. A comparison of competition measures and growth models for predicting plantation red pine diameter and height growth. For. Sci. 1984, 30, 731–743. [Google Scholar] [CrossRef]
  37. Lee, Y.K.; Lee, J.S.; Han, S.K.; Ji, H.V.; Park, J.W. Selection of Trees for Thinning Using Machine Learning Algorithms and Competition Indices. Forests 2025, 16, 65. [Google Scholar] [CrossRef]
  38. Miller, B.L.; Goldberg, D.E. Genetic algorithms, tournament selection, and the effects of noise. Complex Syst. 1995, 9, 193–212. [Google Scholar]
  39. Fotakis, D.G.; Sidiropoulos, E.; Myronidis, D.; Ioannou, K. Spatial genetic algorithm for multi-objective forest planning. For. Policy Econ. 2012, 21, 12–19. [Google Scholar] [CrossRef]
  40. Kaya, A.; Bettinger, P.; Boston, K.; Akbulut, R.; Ucar, Z.; Siry, J.; Merry, K.; Cieszewski, C. Optimisation in forest management. Curr. For. Rep. 2016, 2, 1–17. [Google Scholar] [CrossRef]
  41. Castro, I.; Salas-González, R.; Fidalgo, B.; Farinha, J.T.; Mendes, M. Optimising Forest Management Using Multi-Objective Genetic Algorithms. Sustainability 2024, 16, 10655. [Google Scholar] [CrossRef]
  42. Thompson, M.P.; Hamann, J.D.; Sessions, J. Selection and penalty strategies for genetic algorithms designed to solve spatial forest planning problems. Int. J. For. Res. 2009, 2009, 527392. [Google Scholar] [CrossRef]
  43. Shanin, V.; Hökkä, H.; Grabarnik, P. Testing the performance of some competition indices against experimental data and outputs of spatially explicit simulation models. Forests 2021, 12, 1415. [Google Scholar] [CrossRef]
  44. Korea Forest Service. Sustainable Forest Resource Management Guidelines; Directive No. 1454, Partially Amended; Korea Forest Service: Daejeon, Republic of Korea, 2020. Available online: https://www.law.go.kr (accessed on 14 October 2024).
  45. Rossi, F.; Becker, G. Creating forest management units with Hot Spot Analysis (Getis-Ord Gi*) over a forest affected by mixed-severity fires. Aust. For. 2019, 82, 166–175. [Google Scholar] [CrossRef]
  46. Ord, J.K.; Getis, A. Local spatial autocorrelation statistics: Distributional issues and an application. Geogr. Anal. 1995, 27, 286–306. [Google Scholar] [CrossRef]
  47. Lin, Y.C.; Shao, J.; Shin, S.Y.; Saka, Z.; Joseph, M.; Manish, R.; Fei, S.; Habib, A. Comparative analysis of multi-platform, multi-resolution, multi-temporal LiDAR data for forest inventory. Remote Sens. 2022, 14, 649. [Google Scholar] [CrossRef]
  48. Kuželka, K.; Surový, P. Noise Analysis for Unbiased Tree Diameter Estimation from Personal Laser Scanning Data. Remote Sens. 2024, 16, 1261. [Google Scholar] [CrossRef]
  49. Martínez-Otzeta, J.M.; Rodríguez-Moreno, I.; Mendialdua, I.; Sierra, B. Ransac for robotic applications: A survey. Sensors 2022, 23, 327. [Google Scholar] [CrossRef]
  50. Panagiotidis, D.; Abdollahnejad, A.; Slavík, M. 3D point cloud fusion from UAV and TLS to assess temperate managed forest structures. Int. J. Appl. Earth Obs. Geoinf. 2022, 112, 102917. [Google Scholar] [CrossRef]
  51. Zhou, R.; Sun, H.; Ma, K.; Tang, J.; Chen, S.; Fu, L.; Liu, Q. Improving estimation of tree parameters by fusing ALS and TLS point cloud data based on canopy gap shape feature points. Drones 2023, 7, 524. [Google Scholar] [CrossRef]
  52. Stovall, A.E.; MacFarlane, D.W.; Crawford, D.; Jovanovic, T.; Frank, J.; Brack, C. Comparing mobile and terrestrial laser scanning for measuring and modelling tree stem taper. For. Int. J. For. Res. 2023, 96, 705–717. [Google Scholar] [CrossRef]
  53. Compeán-Aguirre, J.L.; López-Serrano, P.M.; Silván-Cárdenas, J.L.; Martínez-García-Moreno, C.A.; Vega-Nieva, D.J.; Corral-Rivas, J.J.; Pompa-García, M. Evaluation of two-dimensional DBH estimation algorithms using TLS. Forests 2024, 15, 1964. [Google Scholar] [CrossRef]
  54. He, M.; Hu, Y.; Zhao, J.; Li, Y.; Wang, B.; Zhang, J.; Noguchi, H. Exploring Stand Parameters Using Terrestrial Laser Scanning in Pinus tabuliformis Plantation Forests. Remote Sens. 2025, 17, 1228. [Google Scholar] [CrossRef]
  55. Shimizu, K.; Nishizono, T.; Kitahara, F.; Fukumoto, K.; Saito, H. Integrating terrestrial laser scanning and unmanned aerial vehicle photogrammetry to estimate individual tree attributes in managed coniferous forests in Japan. Int. J. Appl. Earth Obs. Geoinf. 2022, 106, 102658. [Google Scholar] [CrossRef]
  56. Nègre, P.; Mahé, K.; Cornacchini, J. Unmanned aerial vehicle (UAV) paired with LiDAR sensor to detect bodies on surface under vegetation cover: Preliminary test. Forensic Sci. Int. 2025, 369, 112411. [Google Scholar] [CrossRef]
  57. Lee, Y.K.; Woo, H.S.; Lee, J.S. Forest Inventory Assessment Using Integrated Light Detection and Ranging (LiDAR) Systems: Merged Point Cloud of Airborne and Mobile Laser Scanning Systems. Sens. Mater. 2022, 34, 4583–4597. [Google Scholar] [CrossRef]
  58. Mielcarek, M.; Stereńczak, K.; Khosravipour, A. Testing and evaluating different LiDAR-derived canopy height model generation methods for tree height estimation. Int. J. Appl. Earth Obs. Geoinf. 2018, 71, 132–143. [Google Scholar] [CrossRef]
  59. Weiser, H.; Schäfer, J.; Winiwarter, L.; Krašovec, N.; Fassnacht, F.E.; Höfle, B. Individual tree point clouds and tree measurements from multi-platform laser scanning in German forests. Earth Syst. Sci. Data 2022, 14, 2989–3012. [Google Scholar] [CrossRef]
  60. Henrich, J.; van Delden, J.; Seidel, D.; Kneib, T.; Ecker, A.S. TreeLearn: A deep learning method for segmenting individual trees from ground-based LiDAR forest point clouds. Ecol. Inform. 2024, 84, 102888. [Google Scholar] [CrossRef]
  61. Sparks, A.M.; Smith, A.M. Accuracy of a lidar-based individual tree detection and attribute measurement algorithm developed to inform forest products supply chain and resource management. Forests 2021, 13, 3. [Google Scholar] [CrossRef]
  62. Jurjević, L.; Liang, X.; Gašparović, M.; Balenović, I. Is field-measured tree height as reliable as believed–Part II, A comparison study of tree height estimates from conventional field measurement and low-cost close-range remote sensing in a deciduous forest. ISPRS J. Photogramm. Remote Sens. 2020, 169, 227–241. [Google Scholar] [CrossRef]
  63. Tenzin, J.; Tenzin, K.; Hasenauer, H. Individual tree basal area increment models for broadleaved forests in Bhutan. For. Int. J. For. Res. 2017, 90, 367–380. [Google Scholar] [CrossRef]
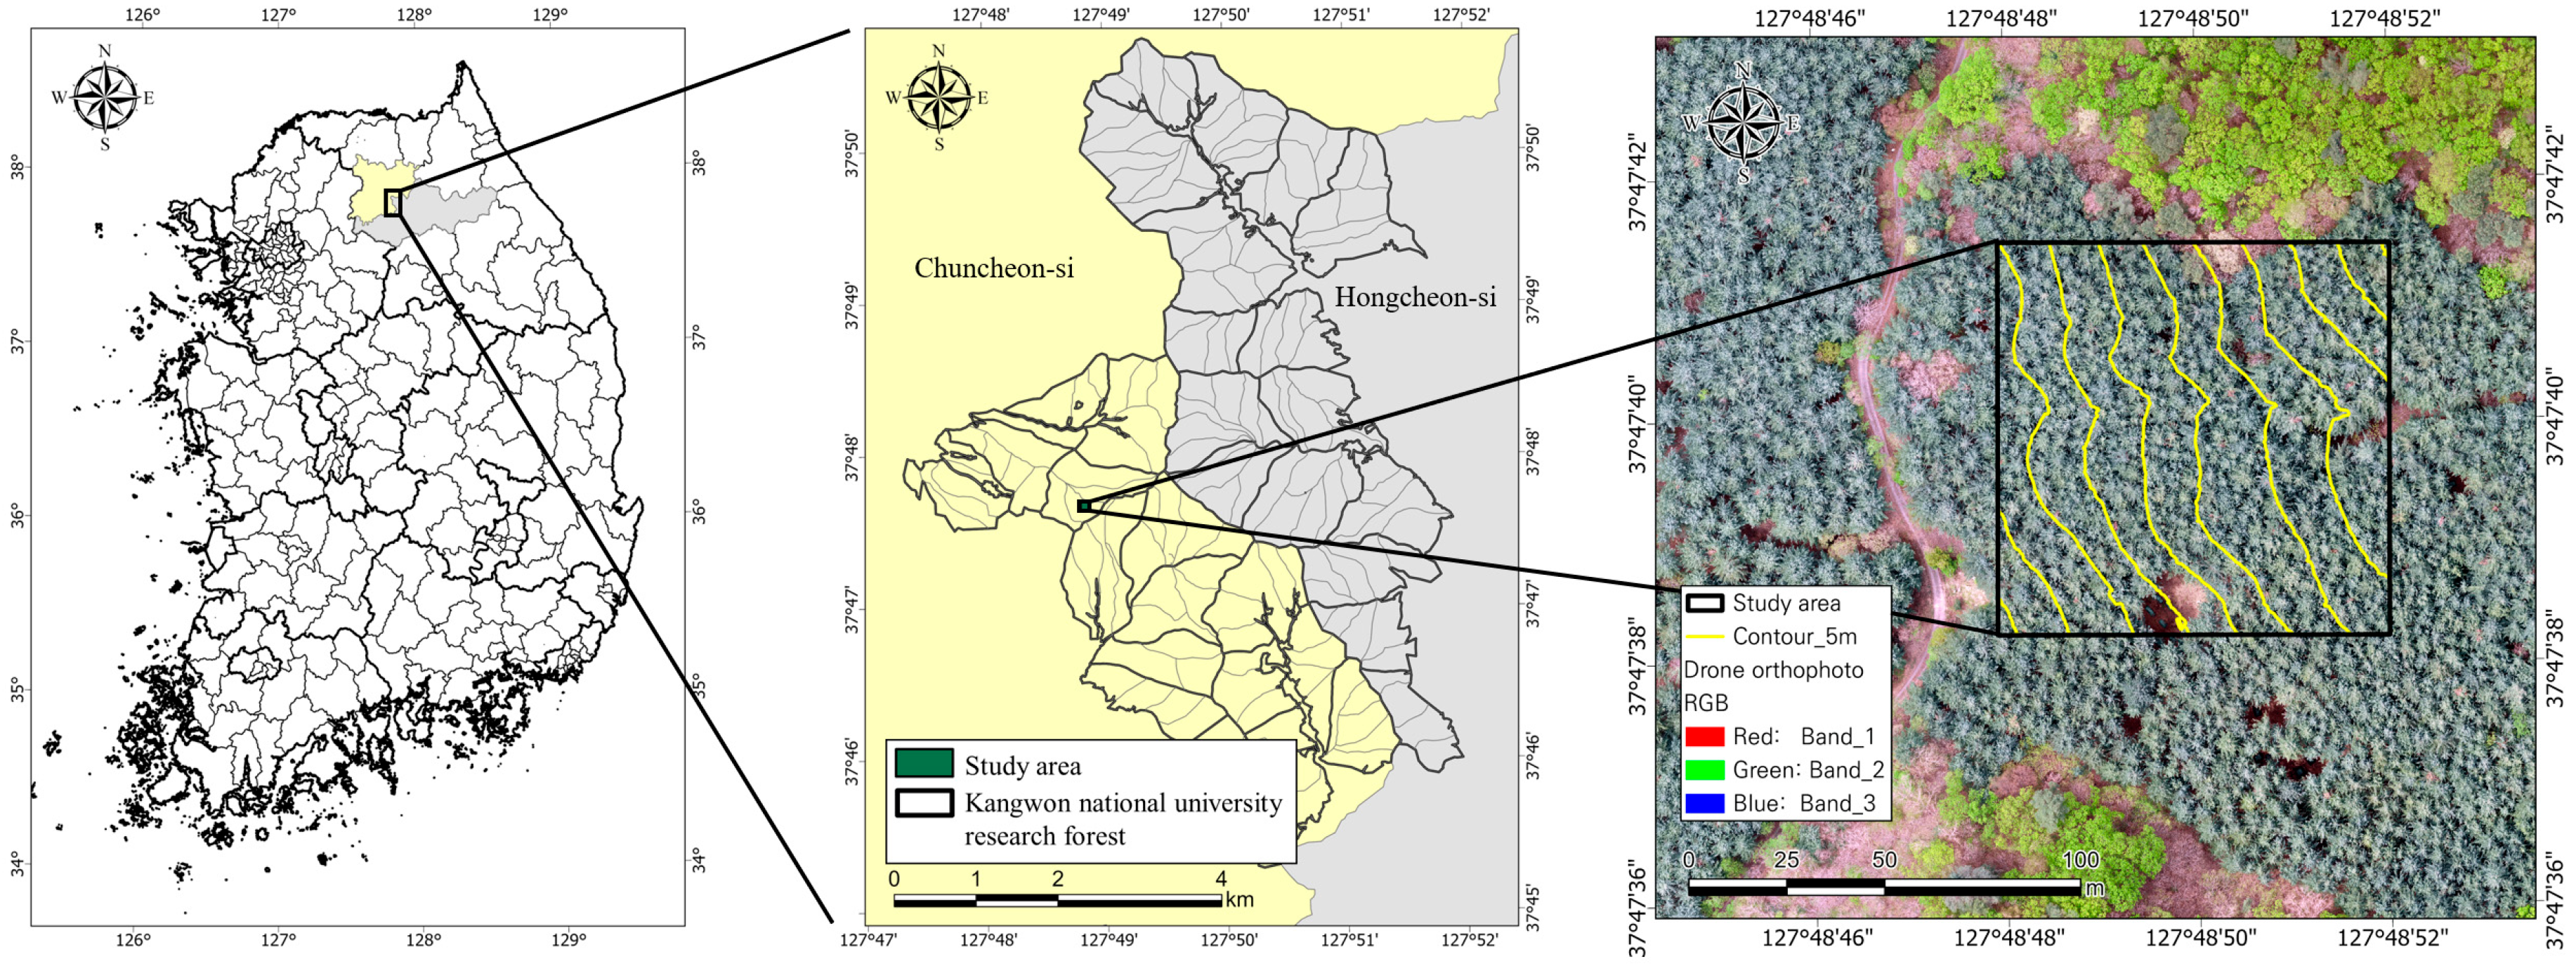
Figure 1. Location of the Study Area, the Academic Forest of Kangwon National University.
Forests 16 01776 g001
Figure 2. Construction of 3D forest spatial data using Multi-Platform LiDAR: (a) left: planar view of the study site from the Terrestrial Laser Scanning (TLS) dataset, right: enlarged frontal view of forest structures; (b) left: planar view of the study site from the Unmanned Aerial Vehicle Laser Scanning (ULS) dataset, right: enlarged frontal view of forest structures.
Forests 16 01776 g002
Figure 3. Schematic diagram of thinning tree selection system development study utilizing LiDAR-based forest structural parameter estimation data and genetic algorithms.
Forests 16 01776 g003
Figure 4. Individual tree selection criteria workflow: diameter threshold filtering, internal void detection, and stem point cloud completeness evaluation.
Forests 16 01776 g004
Figure 5. Tree height estimation workflow showing (a) Digital Elevation Model (DEM); (b) Digital Surface Model (DSM); (c) Canopy Height Model (CHM); Maximum filtering results with window sizes of (d) 3 × 3; (e) 11 × 11; (f) 21 × 21.
Forests 16 01776 g005
Figure 6. Schematic diagram of tree selection system development using genetic algorithms.
Forests 16 01776 g006
Figure 7. Evaluation of DBH Estimation Accuracy According to LiDAR-based Algorithms (a) CF; (b) RCF; (c) EF; (d) REF.
Forests 16 01776 g007
Figure 8. Variation in RMSE according to Maximum filter size (a) Overall trees; (b) Dominant trees.
Forests 16 01776 g008
Figure 9. Variation in Error according to Maximum filtering window size (Error Bars Represent Standard Deviation) (a) Window size 1; (b) Window size 11; (c) Window size 21.
Forests 16 01776 g009
Figure 10. Optimization convergence of genetic algorithm for different thinning scenarios: (a) Average DBH convergence across generations; (b) Competition Index reduction across generations.
Forests 16 01776 g010
Figure 11. Hot spot analysis of residual tree spatial distribution using Getis-Ord Gi statistic: (a) before thinning; (b) expert selection; (c) scenario 1; (d) scenario 2; (e) scenario 3; (f) scenario 4.
Forests 16 01776 g011
Table 2. Confusion matrix and performance metrics of the developed tree detection algorithm.
Actual
TrueFalse
PredictedPositive7354
Negative10
Overall accuracy99.32%
Precision99.46%
Recall99.86%
F1-score99.66%
Table 3. Comparison of DBH estimation accuracy according to outlier inclusion.
Estimation
Method
With OutliersWithout OutliersRMSE
Difference
Number of TreesRMSENumber of TreesRMSE
CF7361.217270.740.47
RCF7361.767260.820.94
EF7351.397221.040.36
REF7361.687271.020.66
Table 4. Comparison of Tree Height Estimation RMSE for Overall and Dominant Trees Using TLS, ULS, and TLS + ULS Across Different Window Sizes.
Tree GroupOverallDominant
Window size1112111121
TLS3.272.001.843.812.221.86
ULS2.642.342.382.892.212.12
TLS + ULS2.241.932.062.321.531.46
Table 5. Comparison of residual tree DBH and competition index across scenarios.
CategoryDBHCompetition Index
MeanSDMeanSD
Machine Learning Tree Selection
System
Scenario 129.216.511.290.53
Scenario 229.716.631.340.59
Scenario 330.066.281.310.53
Scenario 430.256.091.340.53
Expert Selection29.265.931.410.61
Table 6. Comparison of Global Moran’s I spatial autocorrelation of residual trees across scenarios.
CategoryBefore ThinningExpert SelectionScenario 1Scenario 2Scenario 3Scenario 4
Moran’s Index0.160.16−0.03−0.01−0.04−0.03
Expected Index−0.00−0.00−0.00−0.00−0.00−0.00
Variance0.000.000.000.000.000.00
z-score5.014.93−0.74−0.07−1.15−0.82
p-value0.000.000.460.940.250.41
Disclaimer/Publisher’s Note: The statements, opinions and data contained in all publications are solely those of the individual author(s) and contributor(s) and not of MDPI and/or the editor(s). MDPI and/or the editor(s) disclaim responsibility for any injury to people or property resulting from any ideas, methods, instructions or products referred to in the content.