1. Introduction
Forests provide essential benefits to both the environment and human society through climate change mitigation, biodiversity conservation, and economic development [
1]. The growing stock volume (GSV), defined as the stem volume of all living trees of the forest [
2], is a key indicator for estimating forest biomass and carbon sequestration [
3]. Accurate estimates of GSV are crucial for monitoring forest dynamics, supporting sustainable forest management, and informing allowable harvest levels [
4,
5]. Reliable GSV information not only supports decision-making but also provides a foundation for international policy frameworks for sustainable development and climate change mitigation.
The most accurate method for estimating GSV involves field measurements of tree attributes such as height and diameter at breast height (DBH), followed by the application of species-specific or regionally calibrated allometric equations [
6,
7]. Nevertheless, because field data collection is constrained by time and labor requirements, obtaining comprehensive measurements across all forests at the national scale is challenging. To address these limitations, remote sensing data have increasingly been used. Remote sensing data provide valuable information on forest attributes across a wide range of spatial and temporal scales [
8]. Numerous studies have explored the use of remote sensing data for GSV and above-ground biomass estimation. Previous studies demonstrated that incorporating remote sensing data improved estimation accuracy over field-based approaches alone [
9]. The Sentinel-2 mission, for instance, has gained prominence owing to its free accessibility and minimum spatial resolution, promoting its widespread adoption as a data source in forestry research.
Recent advances in machine learning (ML) have further enhanced the capacity of remote sensing-based GSV estimation. Algorithms such as support vector regression, neural networks, random forest (RF), and boosting approaches such as extreme gradient boosting (XGBoost) and categorical boosting (CatBoost) have been tested to identify effective modeling strategies. However, despite these advances, most previous studies were restricted to regional case studies, ignoring the need for approaches applicable at the national scale [
10,
11].
This study develops and compares ML models for nationwide GSV estimation in South Korea. It achieves the following: (1) constructs estimation variables from multi-temporal Sentinel-2 composites and ancillary environmental data; (2) trains multiple ML algorithms, including RF, k-nearest neighbors (kNN), XGBoost, and CatBoost; (3) evaluates and compares model performance against independent test datasets; and (4) generates wall-to-wall maps of the nationwide GSV distribution to visualize broad-scale forest resource patterns. By conducting a comparative analysis across multiple ML approaches, this research provides methodological insights into large-scale GSV estimation and contributes to the generation of spatially explicit forest information. The results are expected to promote sustainable forest management in South Korea and provide a basis for future integration of national forest information into global monitoring frameworks.
2. Study Area and Data
2.1. Study Area
This study was conducted across the territory of South Korea, comprising a total land area of approximately 100,412 km
2. Approximately 63% of the country (63,400 km
2) is covered by forests [
12]. The nation is characterized by predominantly mountainous terrain, largely structured by the Baekdudaegan mountain range that runs north–south through the peninsula. As
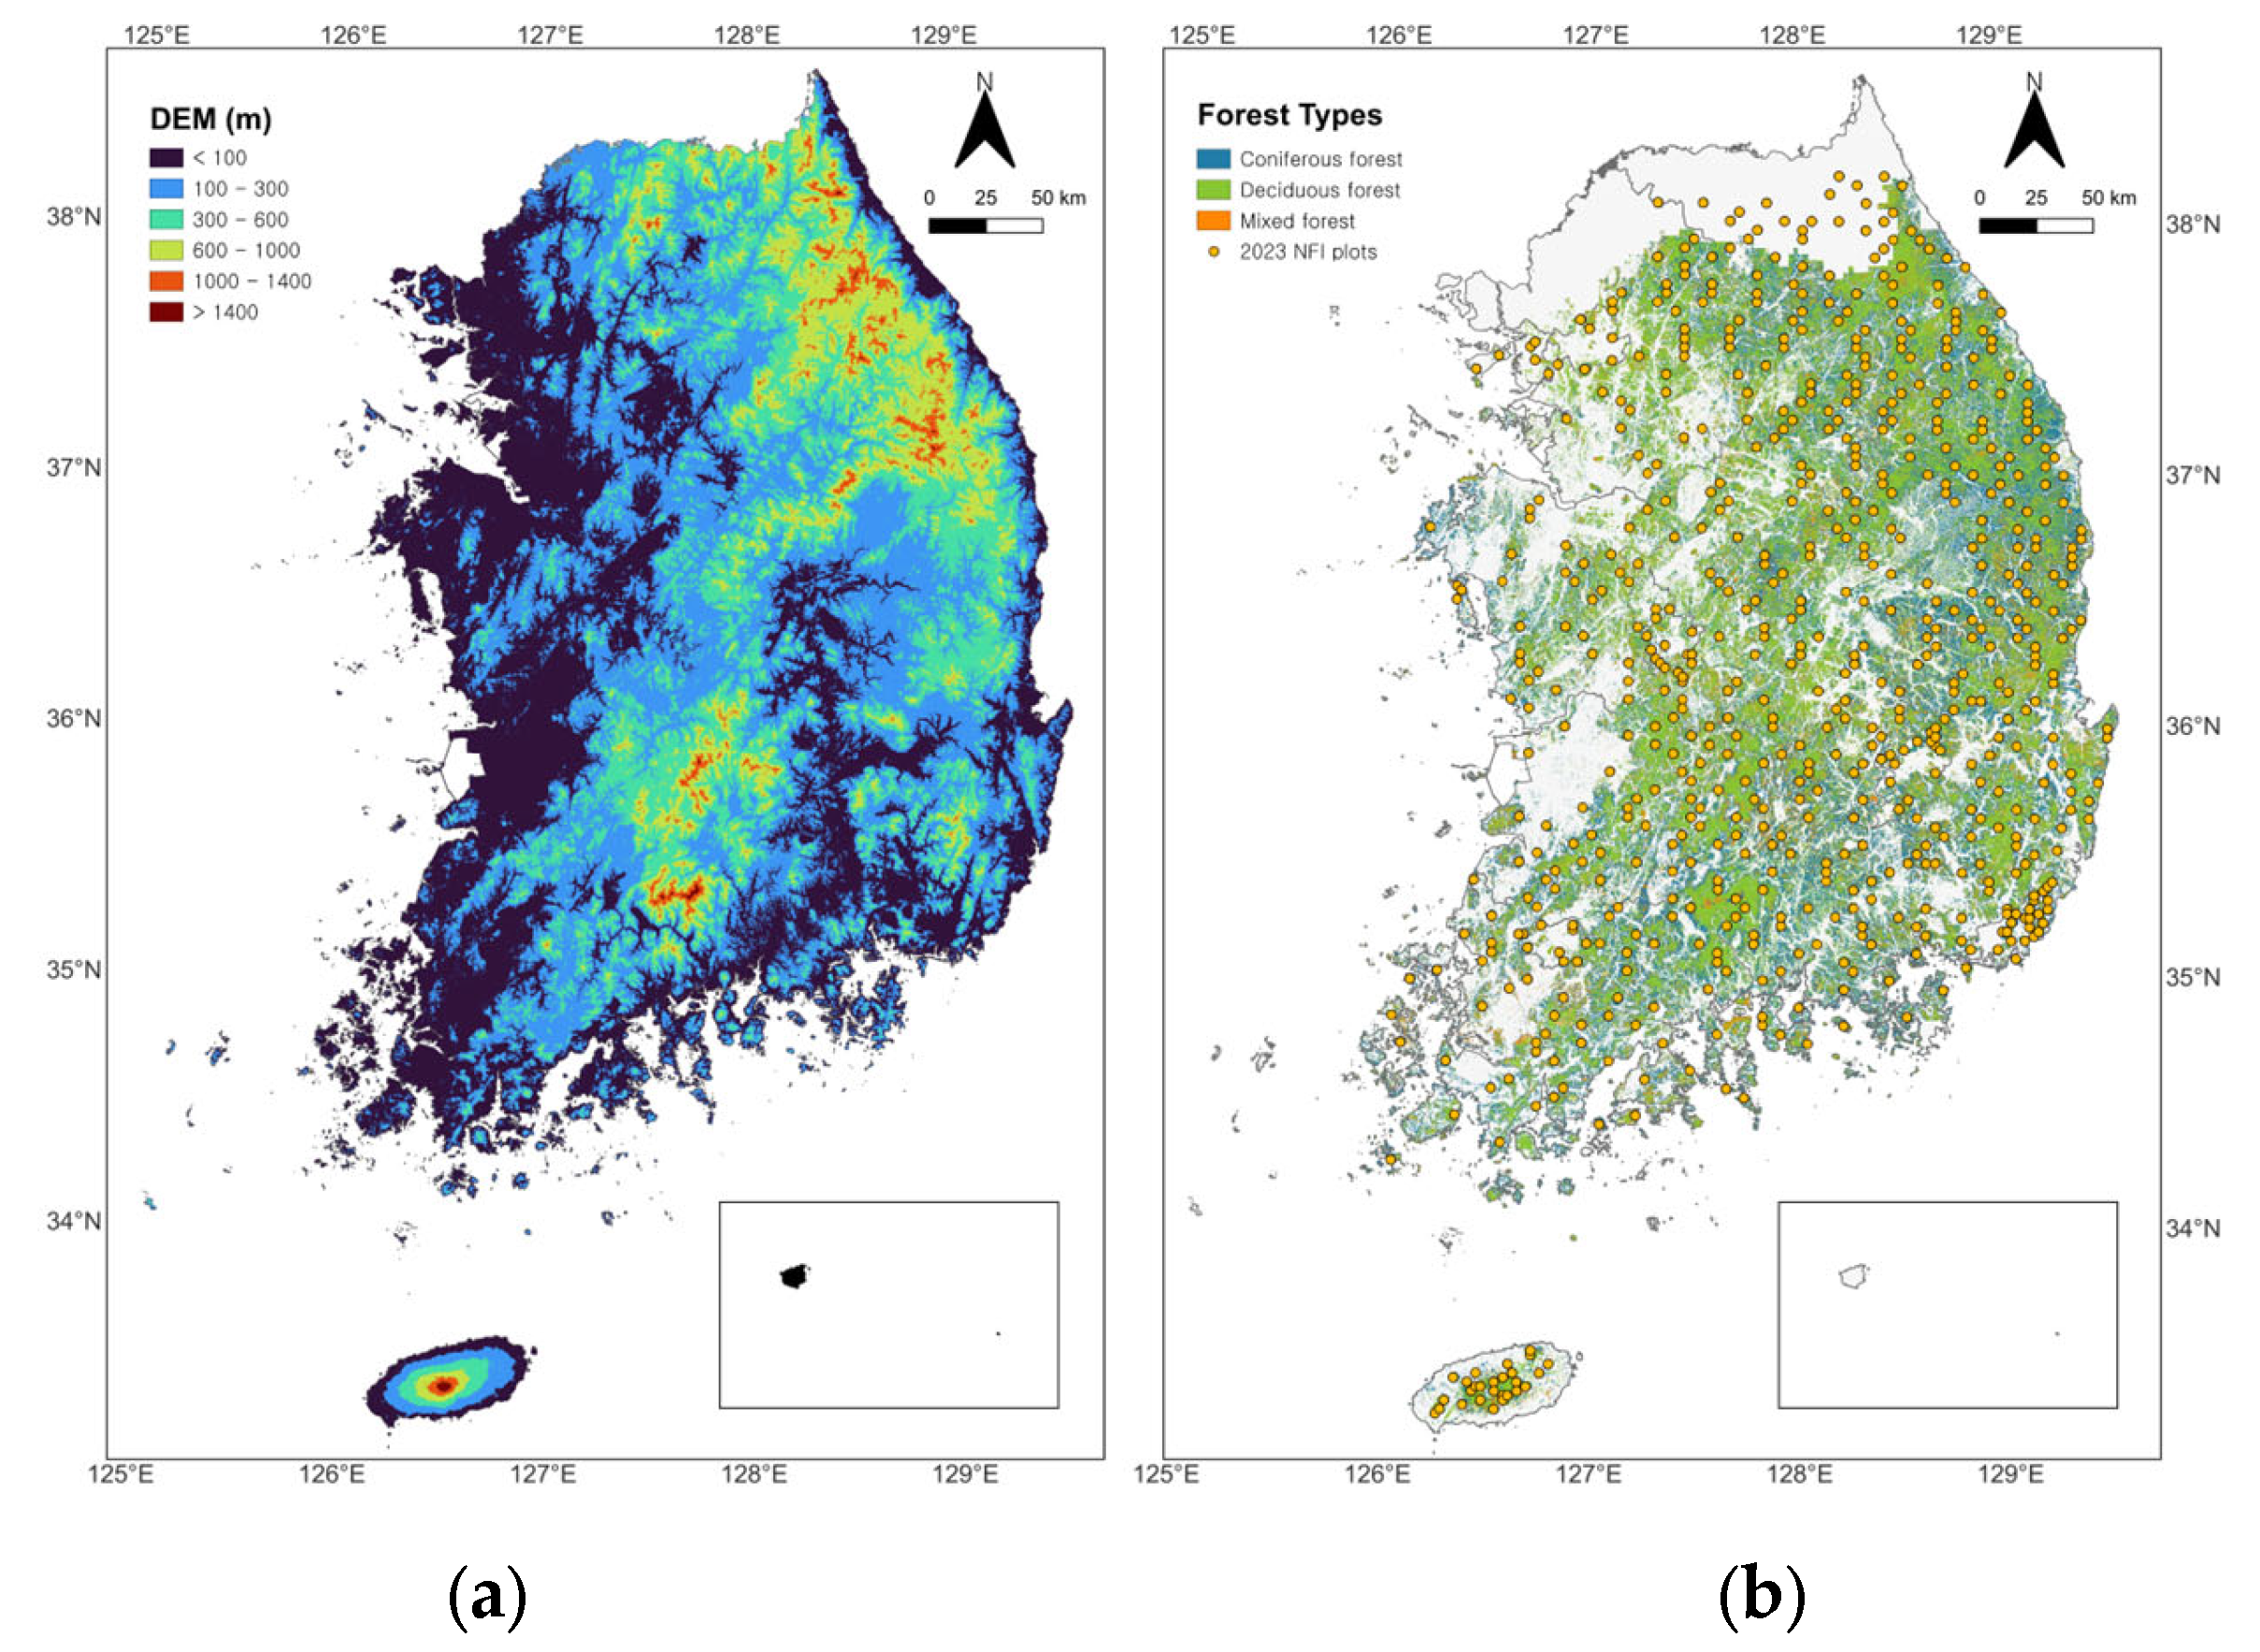
Figure 1a shows, the mountain range forms pronounced climatic and ecological gradients. Geographically, South Korea is located between 33°06′–38॰27′ N and 125॰04′–131॰52′ E, bounded by the sea on three sides. The climate is temperate with four distinct seasons influenced by East Asian monsoons, with annual precipitation ranging from 1000 to 1800 mm concentrated in the summer.
In terms of vegetation, South Korea primarily belongs to the temperate deciduous broadleaf forest zone. However, extensive afforestation and reforestation efforts since the mid-20th century have created large areas of mixed coniferous and deciduous stands. Dominant species include
Pinus densiflora Sieb. & Zucc.,
Quercus mongolica Fisch. Ex Ledeb.,
Larix kaempferi (Lamb.) Carr., and
Pinus koraiensis Sieb. & Zucc. As
Figure 1b shows, this ecological heterogeneity contributes to considerable spatial variation in forest structure and GSV. The primary data for model training and testing were obtained from the 2023 national forest inventory (NFI) plots. These plots are distributed nationwide, providing point-based observations across different forest environments.
2.2. Research Data
2.2.1. Sentinel-2 Satellite Data
Sentinel-2 multi-spectral instrument surface reflectance data (Level-2A), originally provided by the European Space Agency (Paris, France) through the Copernicus program, were accessed via the Google Earth Engine. To represent forest conditions during the leaf-on growing season, imagery acquired between April and September 2023 was used. Scenes containing over 10% cloud cover were excluded, and additional cloud and shadow pixels were masked using the Sentinel-2 scene classification layer. Median compositing, which is widely applied in forest remote sensing to reduce residual cloud contamination and atmospheric noise, was implemented. Similar approaches have been adopted in recent growing stock studies, such as the case of Kunming City, where median composites from optical and microwave remote sensing data were generated in the Google Earth Engine to represent annual forest conditions while minimizing cloud effects [
13]. The final composites included blue (B2), green (B3), red (B4), red-edge (B5), and near-infrared (B8) bands, resampled to a spatial resolution of 10 m. All raster data were reprojected to a common coordinate system (Korea 2000/Unified Coordinate System, EPSG: 5179) to ensure spatial consistency across the study area.
2.2.2. Ground Data
Ground reference data were obtained from the NFI (Korea Forest Service, Daejeon, Republic of Korea), which uses a five-year monitoring system to re-measure permanent plots at regular intervals. The 8th NFI cycle started in 2021 and will continue until 2025. In this study, we only use the plots surveyed in 2023. In total, 2356 plots were available nationwide, and after performing preprocessing and removing invalid records, 2182 plots were retained for analysis.
Each cluster plot comprises four circular subplots: a 0.04 ha subplot (radius 11.3 m) containing trees with DBH ≥ 6 cm and <30 cm, an extended 0.08 ha subplot (radius 16 m) for trees with DBH ≥ 30 cm, and a 0.003 ha subplot (radius 3.1 m) for seedlings (DBH < 6 cm). These field measurements were used to calculate GSV (m3/ha), which served as the main response variable. Additionally, stand-level attributes such as dominant and co-dominant height and forest type were recorded, providing ancillary information that could be integrated with remote sensing and environmental predictors.
2.2.3. Auxiliary Data
Auxiliary topographic predictors were derived from a 10 m resolution DEM provided by the National Geographic Information Institute (Suwon, Republic of Korea). Elevations were directly extracted, and slopes were calculated using gradient-based derivatives. Topographic factors are key determinants of forest growth because elevation and slope reflect climatic gradients, soil conditions, and species composition. Previous studies have demonstrated that DEM-derived variables can improve the prediction of biomass or growing stock by accounting for spatial variability [
14], particularly in mountainous environments [
15]. Considering the complex mountainous terrain of South Korea, DEM-based predictors were included to complement Sentinel-2 spectral information and NFI attributes.
Additionally, for nationwide GSV mapping, the national forest map provided by the Korea Forest Service was used. The original vector-based data were rasterized to a 10-m resolution to ensure consistency with other spatial predictors.
3. Methods
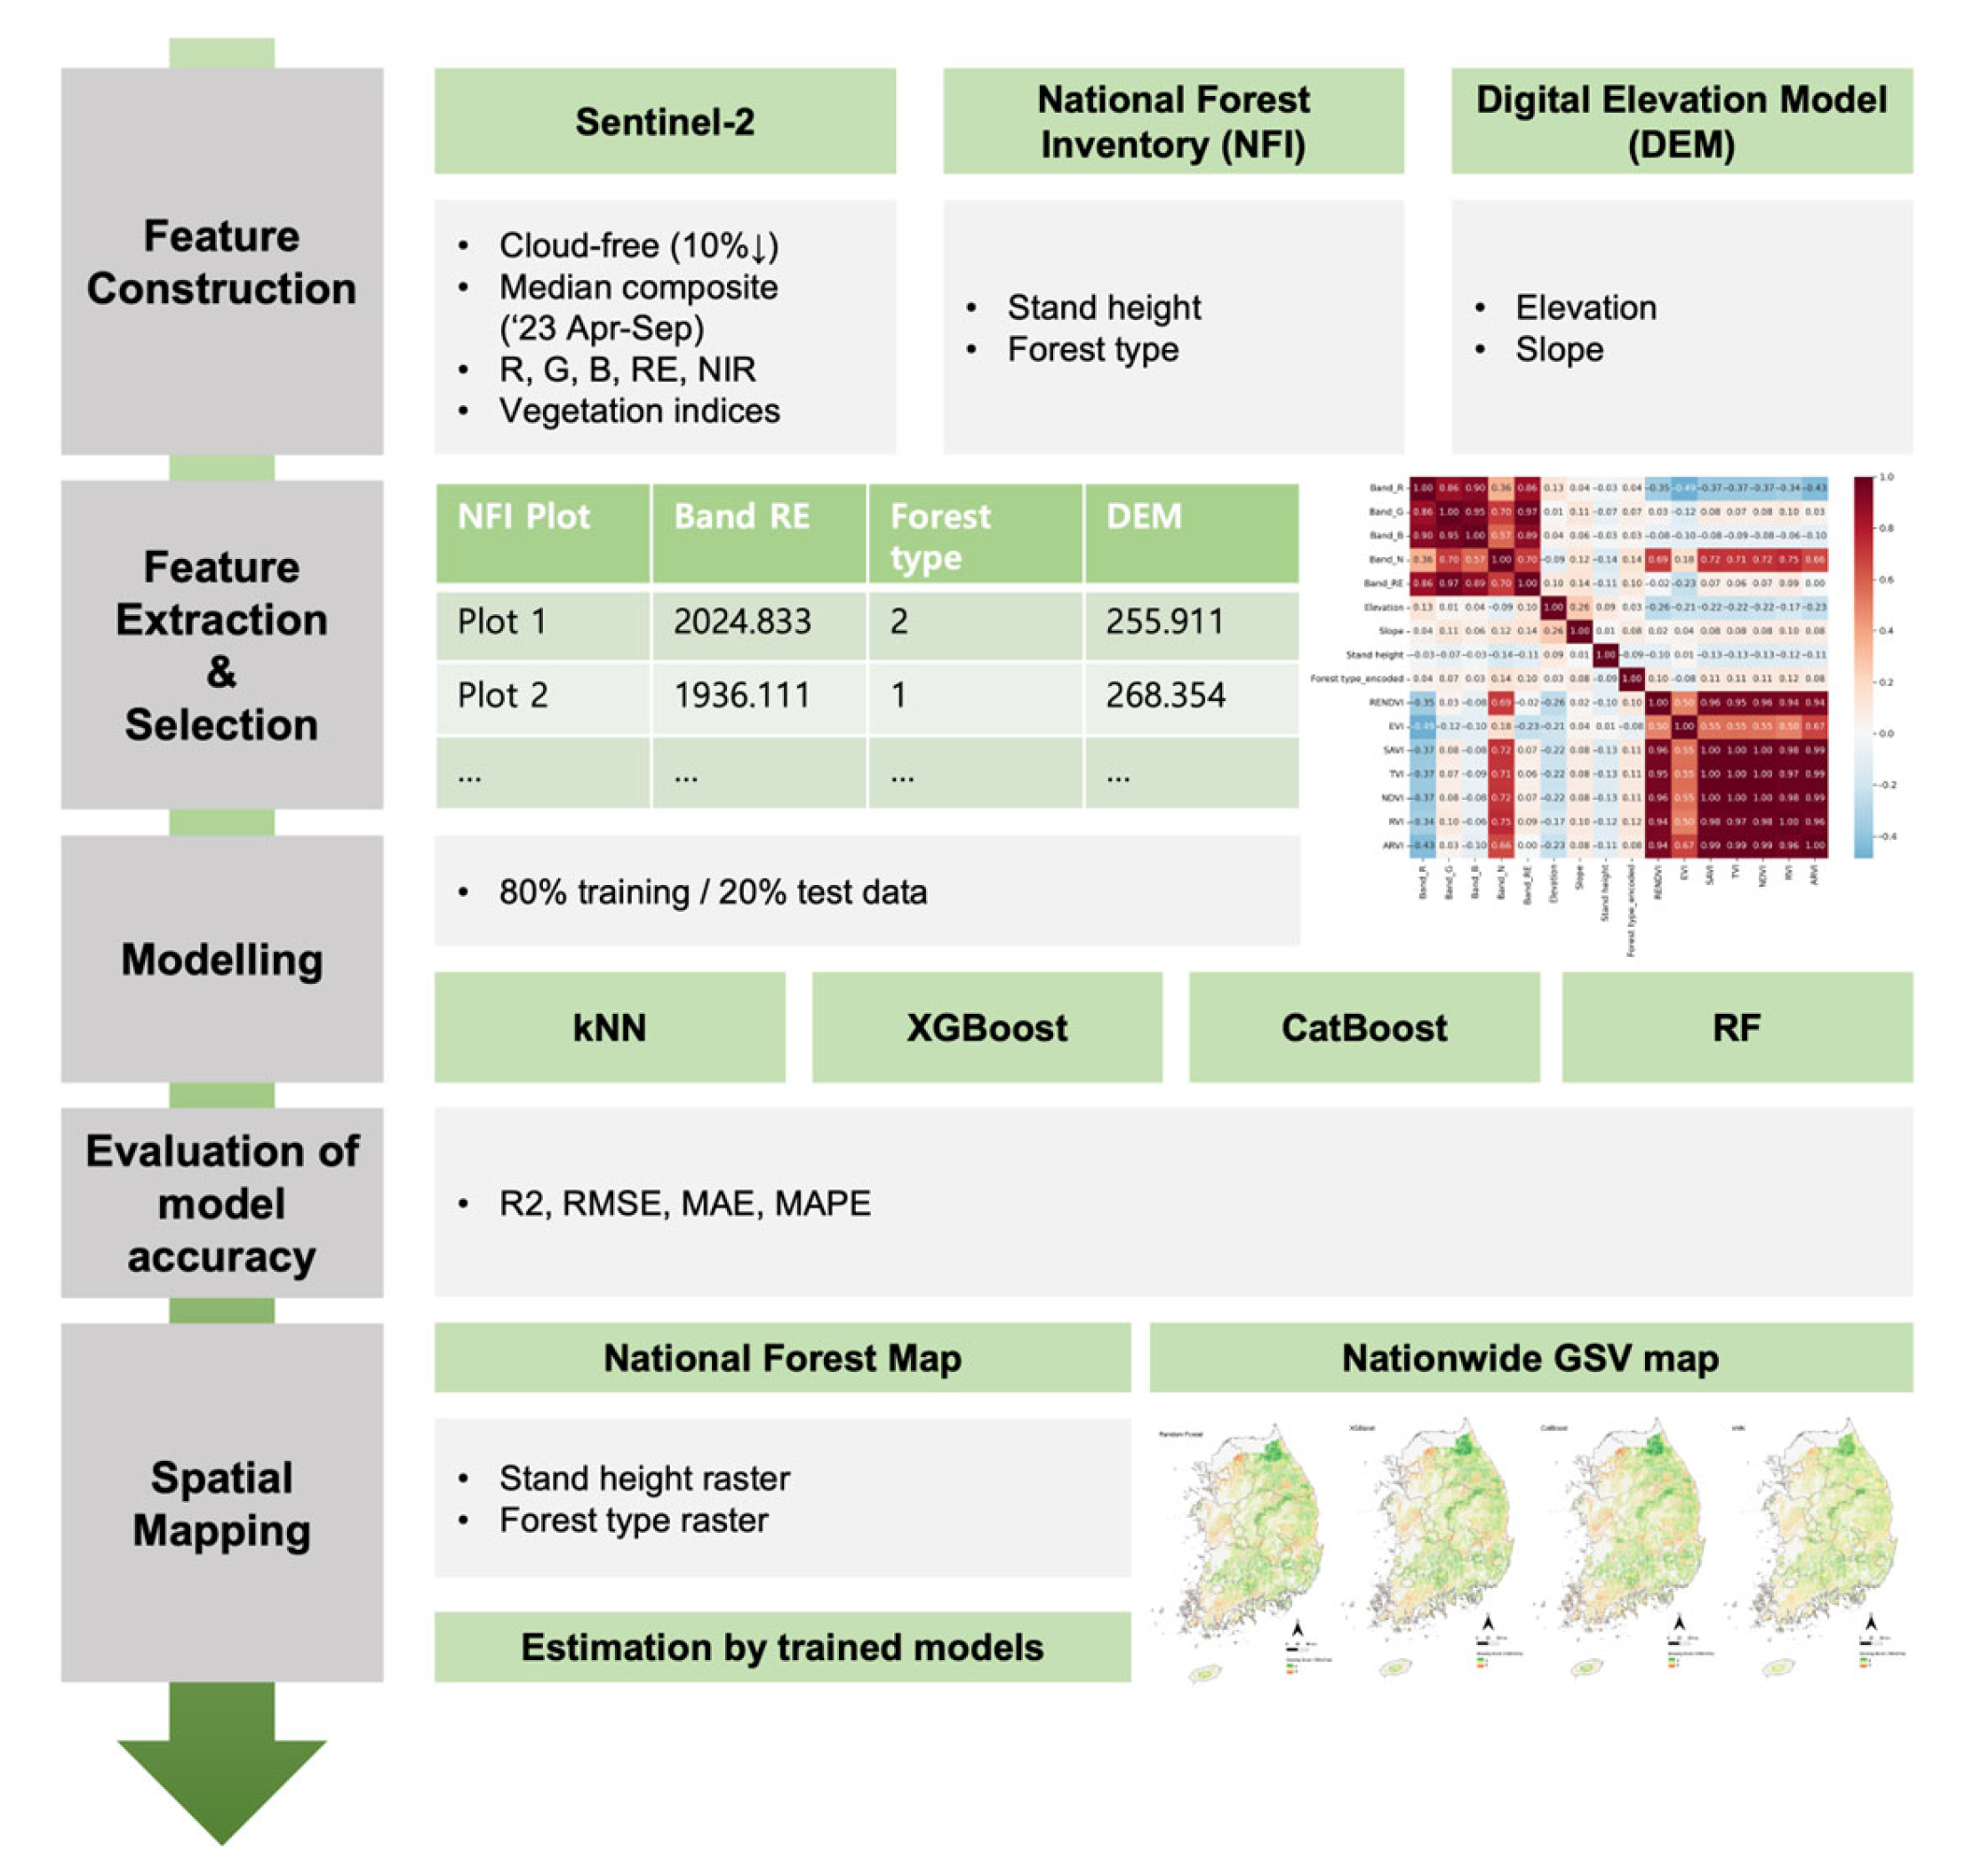
To estimate forest GSV at the national scale, this study used the Sentinel-2A, NFI, and DEM as data sources. Four ML algorithms comprising kNN, RF, XGBoost, and CatBoost were implemented for the study. The performances of each algorithm model were compared through cross-validation, and the most optimized algorithm was applied to generate wall-to-wall GSV estimations for all forest pixels across South Korea. The overall workflow of the study is illustrated in
Figure 2.
3.1. Data Preprocessing and Variable Construction
For each NFI plot, predictor variables were compiled by combining remotely sensed and field-based data. Mean spectral values from Sentinel-2A bands (red, green, blue, near infrared, and red edge), topographic variables, and slopes and elevations derived from a DEM were extracted within an 11.3 m buffer around each plot to represent plot-level conditions. Additionally, normalized difference vegetation index (NDVI), enhanced vegetation index (EVI), red-edge NDVI (RENDVI), soil-adjusted vegetation index (SAVI), and atmospherically resistant vegetation index (ARVI) were computed from the spectral bands. Furthermore, stand attributes from the NFI (stand height and forest type) were incorporated as auxiliary predictors, whereas GSV (m3/ha) from the NFI served as the response variable.
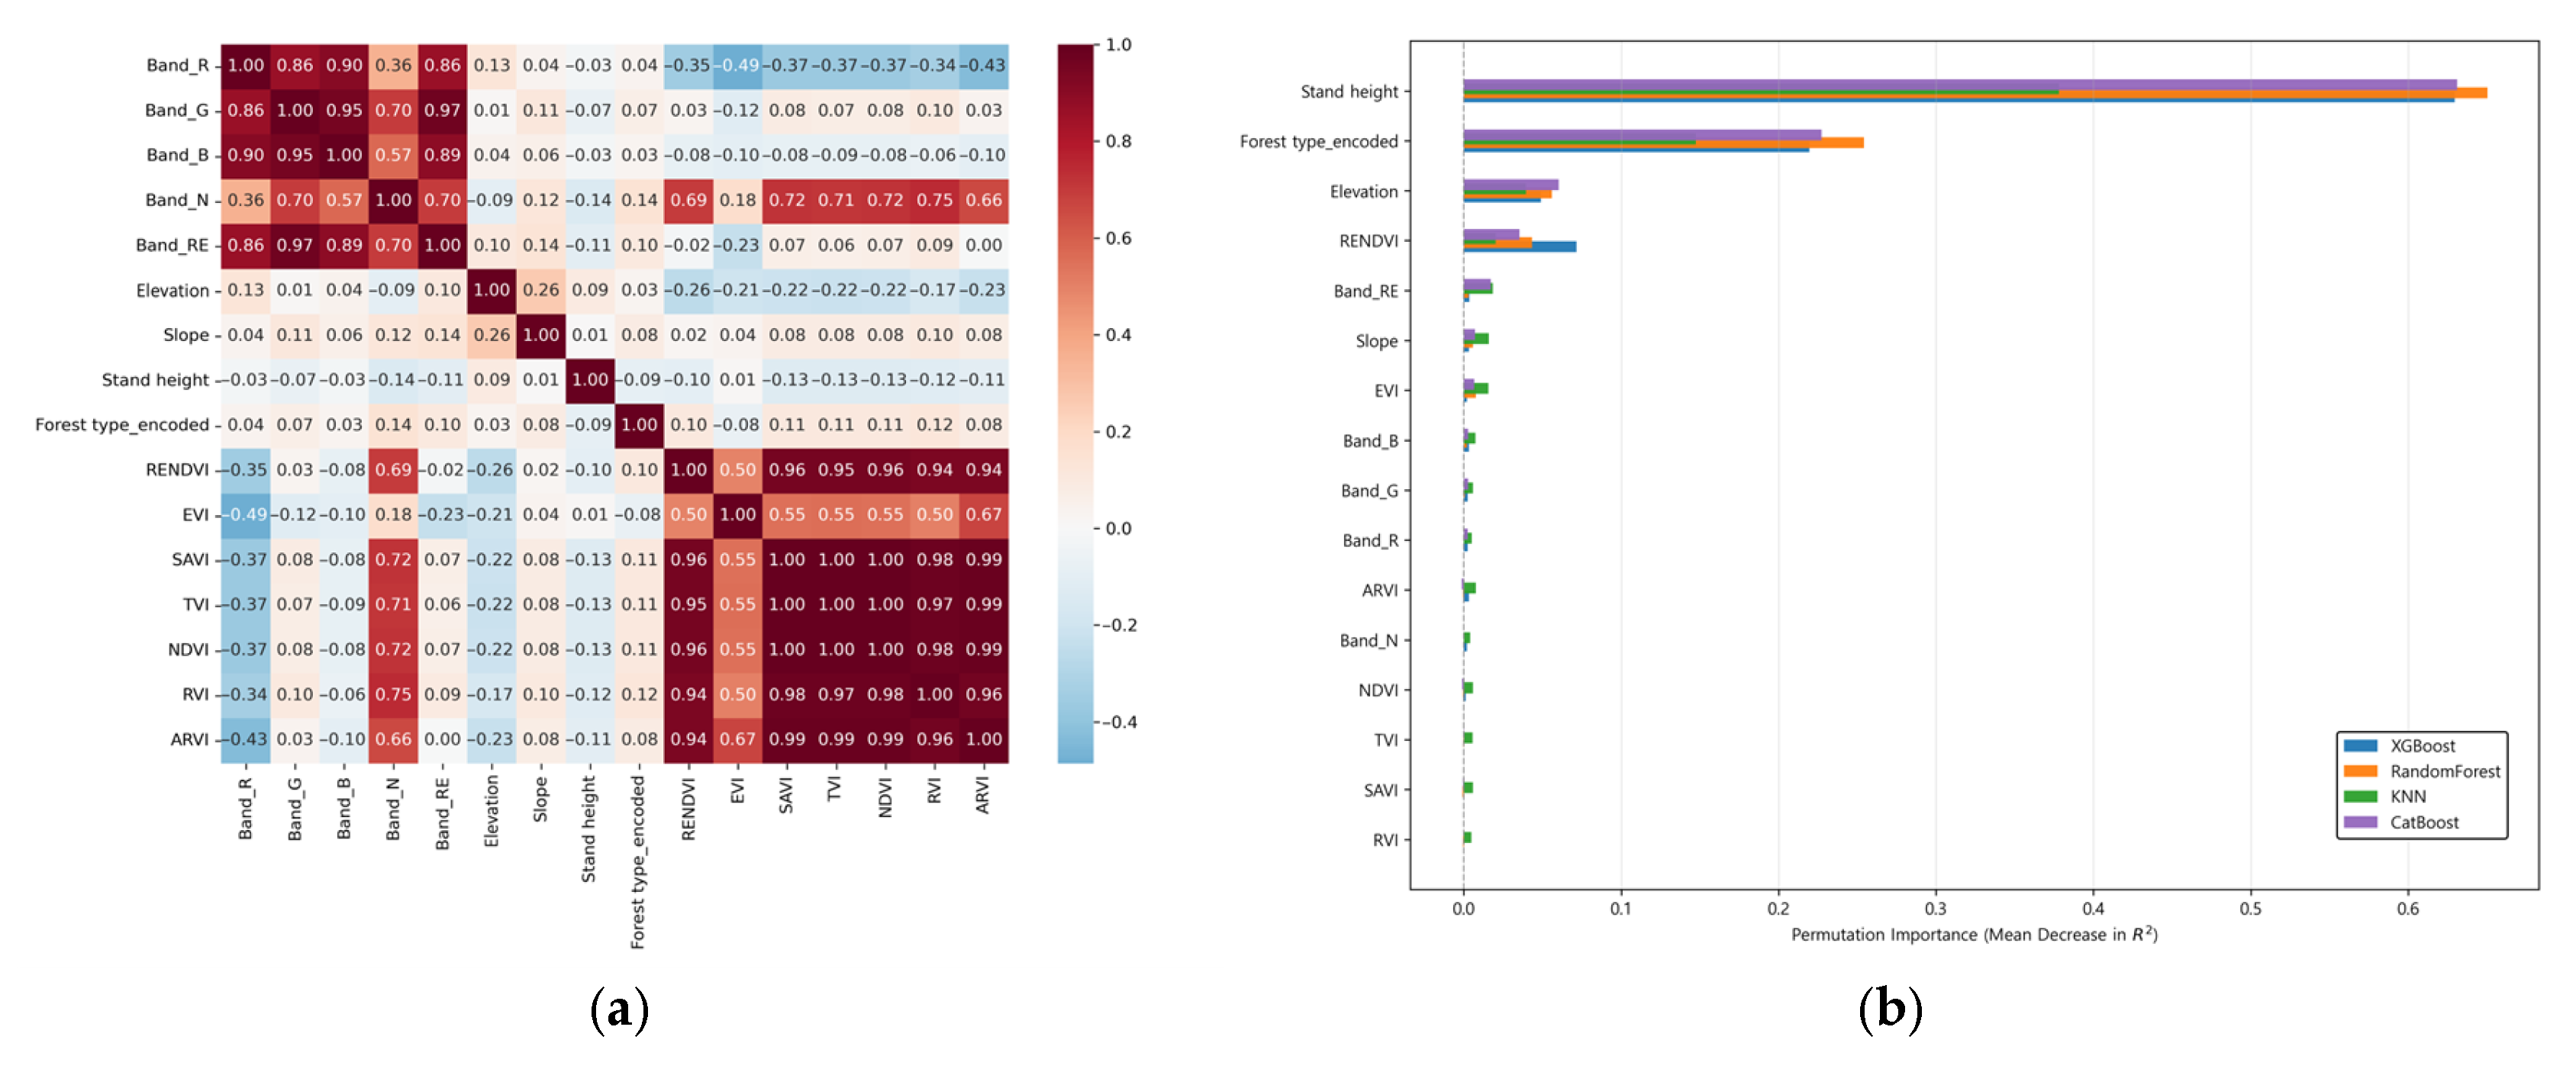
To minimize redundancy and identify the most informative predictors, both the correlation matrix and the cross-validated permutation importance were examined (
Figure 3). Based on these analyses, the final predictor set comprised stand height, forest type, EVI, RENDVI, Elevation, slope, and the Sentinel-2 red-edge band (
Table 1).
3.2. Modeling Methods and Estimation of GSV
3.2.1. kNN
The kNN algorithm is a nonparametric method that predicts response values based on the weighted average of the
k most similar observations in the training set [
16]. Its simplicity and nonparametric nature allow straightforward multivariate estimations without distributional assumptions. kNN has been widely applied in forestry owing to its straightforward implementation and robustness when handling multisource datasets [
17,
18]. The algorithm was included in this study due to its long-standing use in forest resource estimation, particularly in national forest inventories [
19]. The selection of
k and the weighting scheme strongly influence predictive performance, with higher
k values generally reducing variance at the expense of increased bias. We implemented kNN models using the scikit-learn package in Python (version. 3.12) [
20]. The number of neighbors (
k) and the weighting function were optimized via a 10-fold cross-validated grid search.
3.2.2. RF
RF is a tree-based ensemble learning algorithm that has been widely applied to forest structural attribute estimation using remotely sensed data [
21,
22]. The RF approach constructs multiple regression trees using bootstrap samples of the training dataset. At each node, a random subset of predictor variables is considered for splitting. The final prediction is obtained by averaging the outputs of all trees [
23]. We implemented RF models using the scikit-learn package. Model optimization was performed by conducting a 10-fold cross-validated grid search to tune the number of trees, maximum depth, and the number of samples per split.
3.2.3. XGBoost
XGBoost is a gradient boosting framework that constructs trees sequentially, where each new tree corrects the residuals of the previous ensemble [
24]. The algorithm incorporates regularization to prevent overfitting and supports shrinkage learning rates, column subsampling, and early stopping. XGBoost has demonstrated strong performance in remote sensing applications, particularly when handling high-dimensional feature sets derived from multispectral and ancillary data [
25]. We implemented XGBoost using the xgboost library in Python. Model optimization was conducted via a 10-fold cross-validated grid search over key hyperparameters, including the number of trees, learning rate, and maximum depth.
3.2.4. CatBoost
CatBoost is a gradient boosting algorithm specifically designed to handle categorical variables efficiently and mitigate prediction shift through ordered boosting [
26]. Unlike other tree-based ensemble methods, CatBoost can directly incorporate categorical predictors without requiring one-hot or label encoding, reducing the risk of information loss and target leakage. In this study, CatBoost was included because the dataset contained categorical predictors such as forest type. We implemented CatBoost models using the catboost library in Python, and hyperparameters were optimized via a 10-fold cross-validated grid search.
3.3. Performance Evaluation
Model performance was evaluated using four statistical metrics: coefficient of determination (R
2), root mean squared error (RMSE), mean absolute error (MAE), and mean absolute percentage error (MAPE). R
2 indicates the proportion of variance explained by the model, whereas RMSE and MAE measure the absolute magnitude of prediction errors. MAPE expresses the error relative to the observed values as a percentage. These metrics are defined as follows:
where
is the observed value (NFI),
is the estimated value,
is the mean of the observed values, and
n is the number of samples.
To ensure a robust evaluation, hyperparameter tuning was performed via 10-fold cross-validation within the search ranges. The full hyperparameter grids and the final selected optimal values are summarized in
Table A1.
Furthermore, for the final model accuracy assessment, an independent testing dataset was generated through spatially balanced sampling to reduce spatial autocorrelation. In this procedure, NFI plots were first grouped according to their corresponding 100 km × 100 km spatial tiles. Within each tile group, the data were then split into training (80%) and testing (20%) subsets. Plots in each group were ordered by their plot ID, and testing samples were selected at regular intervals to achieve an even spatial distribution within each block. This block-sampling strategy provided a geographically balanced division of training and testing datasets while minimizing local clustering and reducing spatial autocorrelation across the study area.
Additionally, performance was visually assessed using predicted-observed scatterplots. Variable importance was further analyzed using the permutation importance approach, which estimates the decrease in model accuracy when the values of each predictor are randomly permuted.
3.4. Spatial Estimation
Trained models were applied to generate wall-to-wall estimations of GSV across South Korea. The final predictor layers (EVI, RENDVI, DEM, slope, stand height, forest type, and red-edge band), which corresponded to the independent variables used in model training, were prepared at a spatial resolution of 10 m and provided as inputs to the models. Although NFI attributes such as stand height and forest type are only available at the plot level, nationwide mapping requires spatially continuous layers. Consequently, we used rasterized stand height and forest type layers from the national forest map. These wall-to-wall datasets were then combined with Sentinel-2 indices and DEM-based predictors to generate nationwide GSV maps.
4. Results
4.1. Model Performance
The performances of the four ML models are summarized in
Table 2. RF achieved the highest predictive accuracy, XGBoost and CatBoost produced comparable results with slightly higher error values, and kNN yielded the lowest accuracy, confirming the limitations of distance-based methods on this predictor set.
4.2. Comparison of Estimated and Observed Values
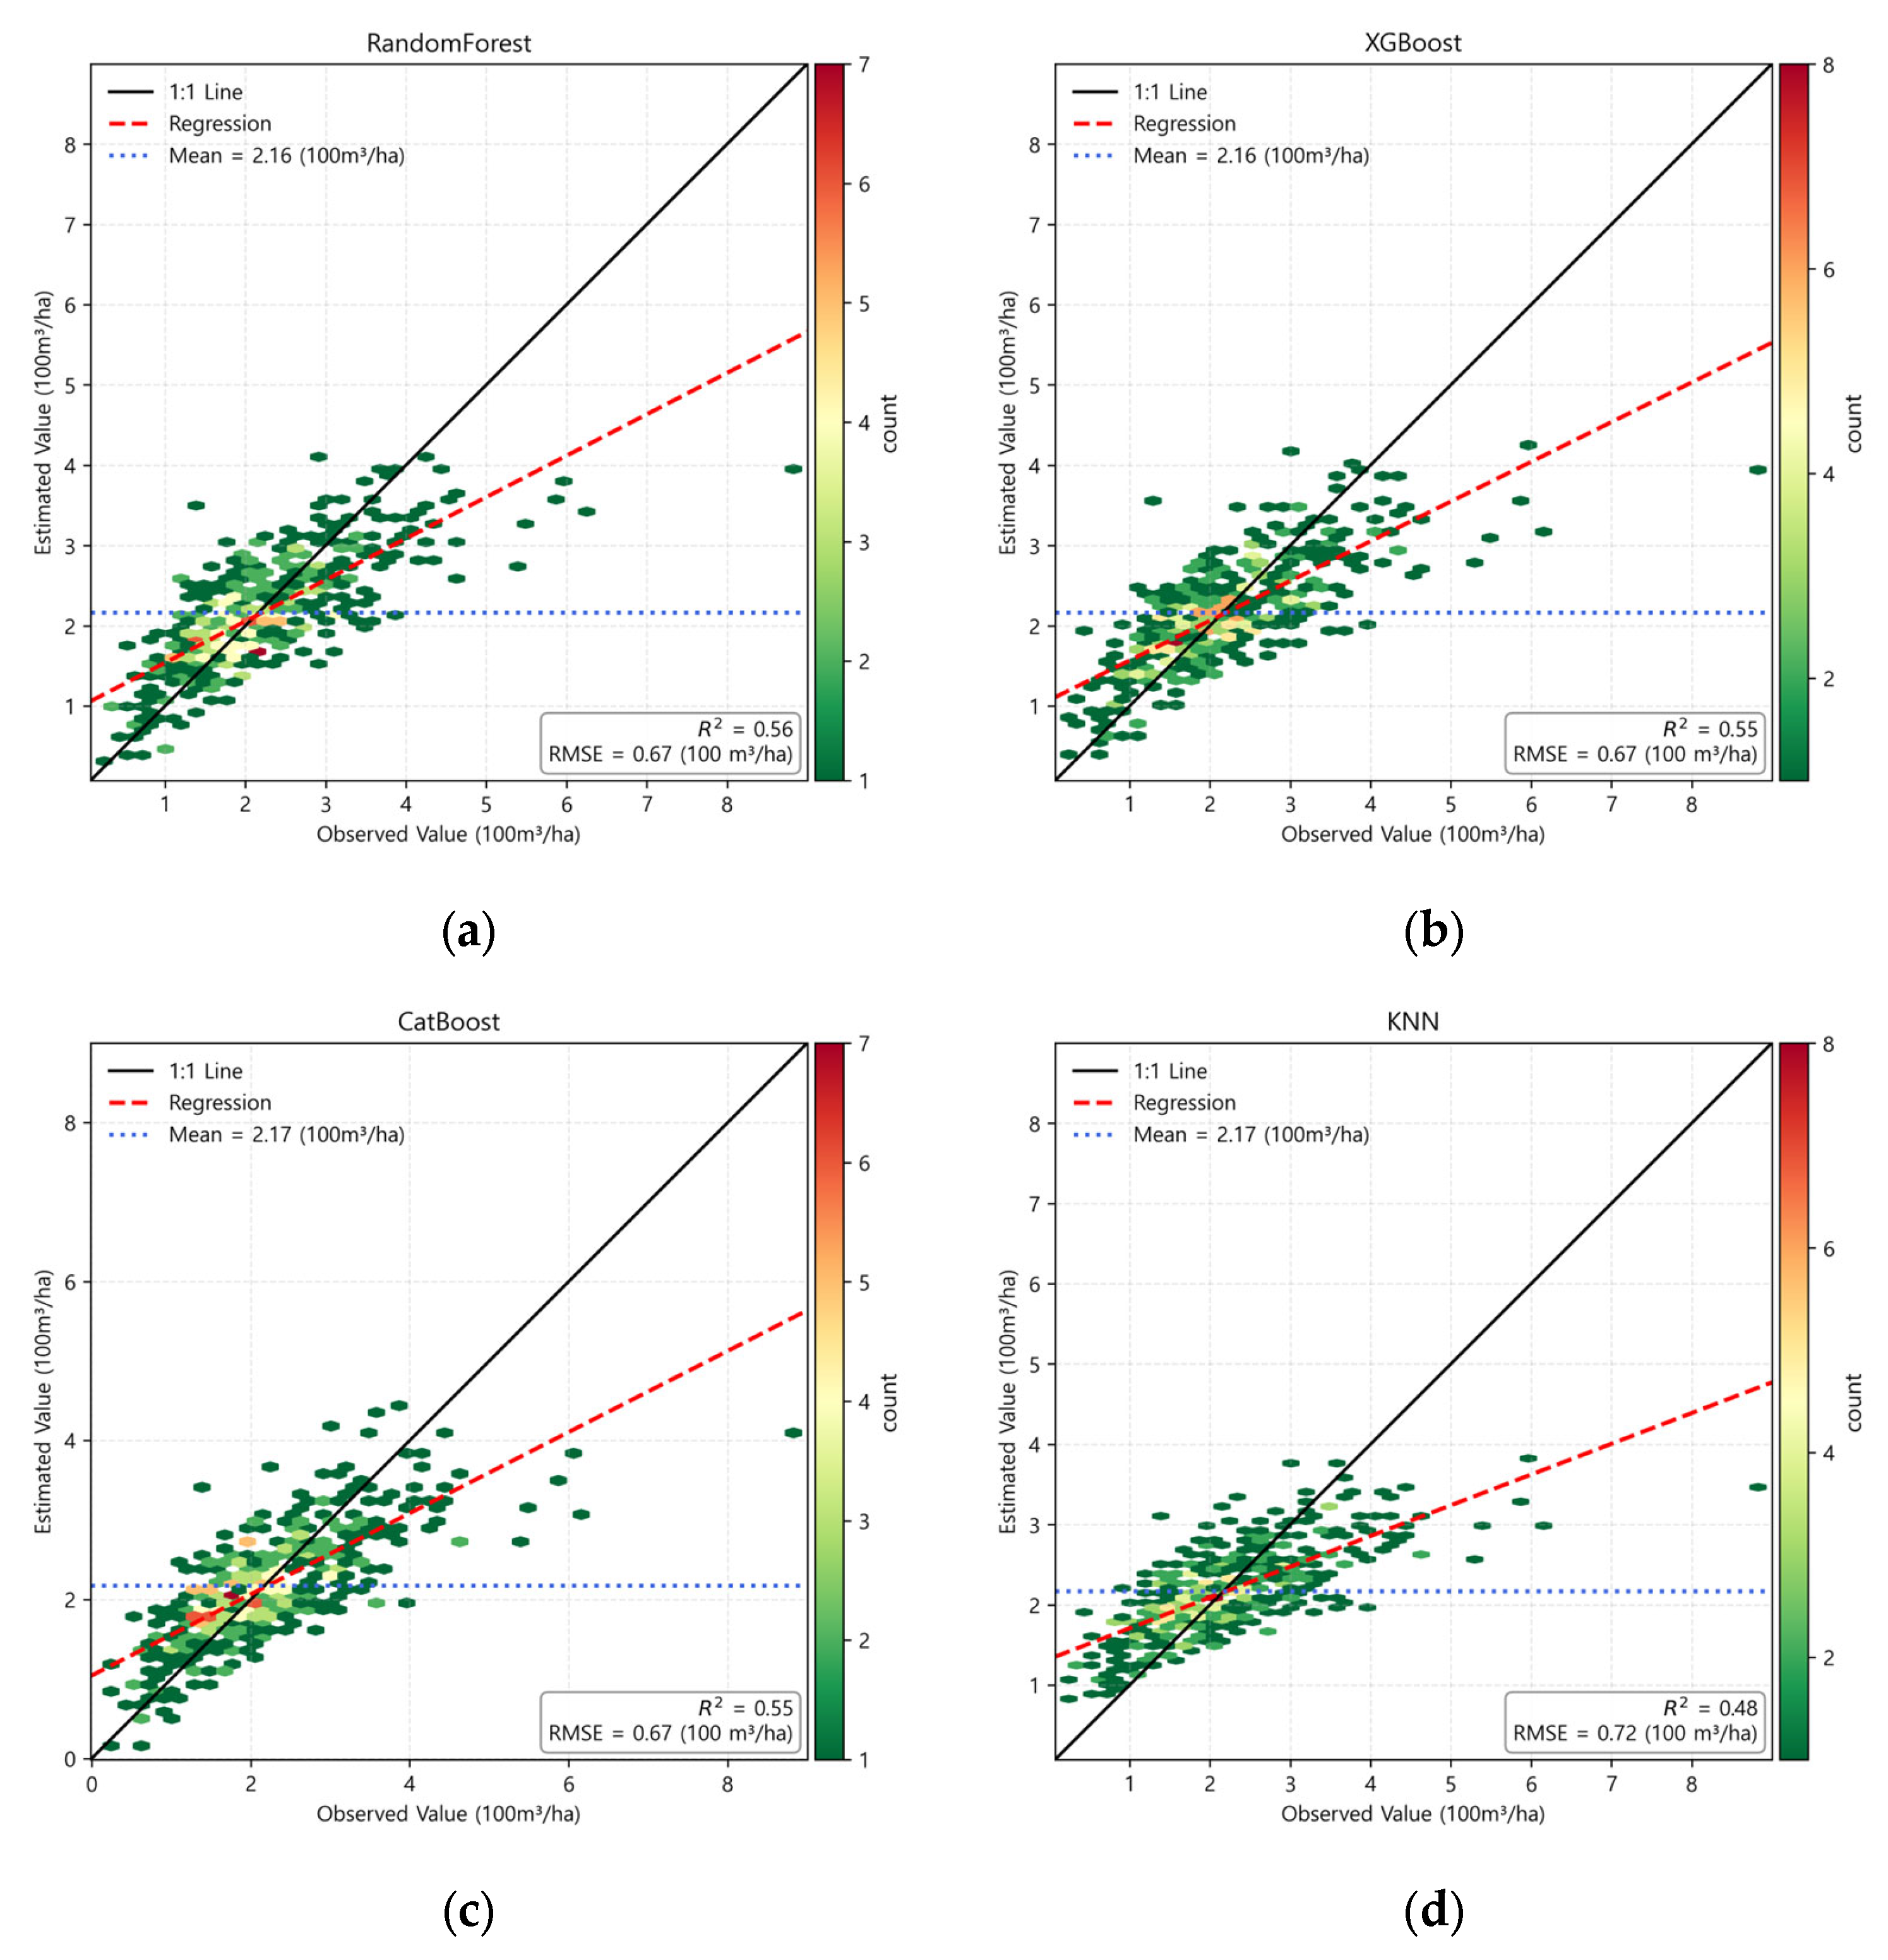
Hexbin density plots of estimated versus observed GSV (
Figure 4) provide a visual comparison of model performance. RF, XGBoost, and CatBoost exhibited similar estimation patterns, with regression lines close to the 1:1 line. In contrast, the regression line for kNN had a lower slope, indicating a systematic underestimation of high-volume plots and greater dispersion, consistent with its weaker predictive accuracy relative to the ensemble methods.
4.3. Variable Importance
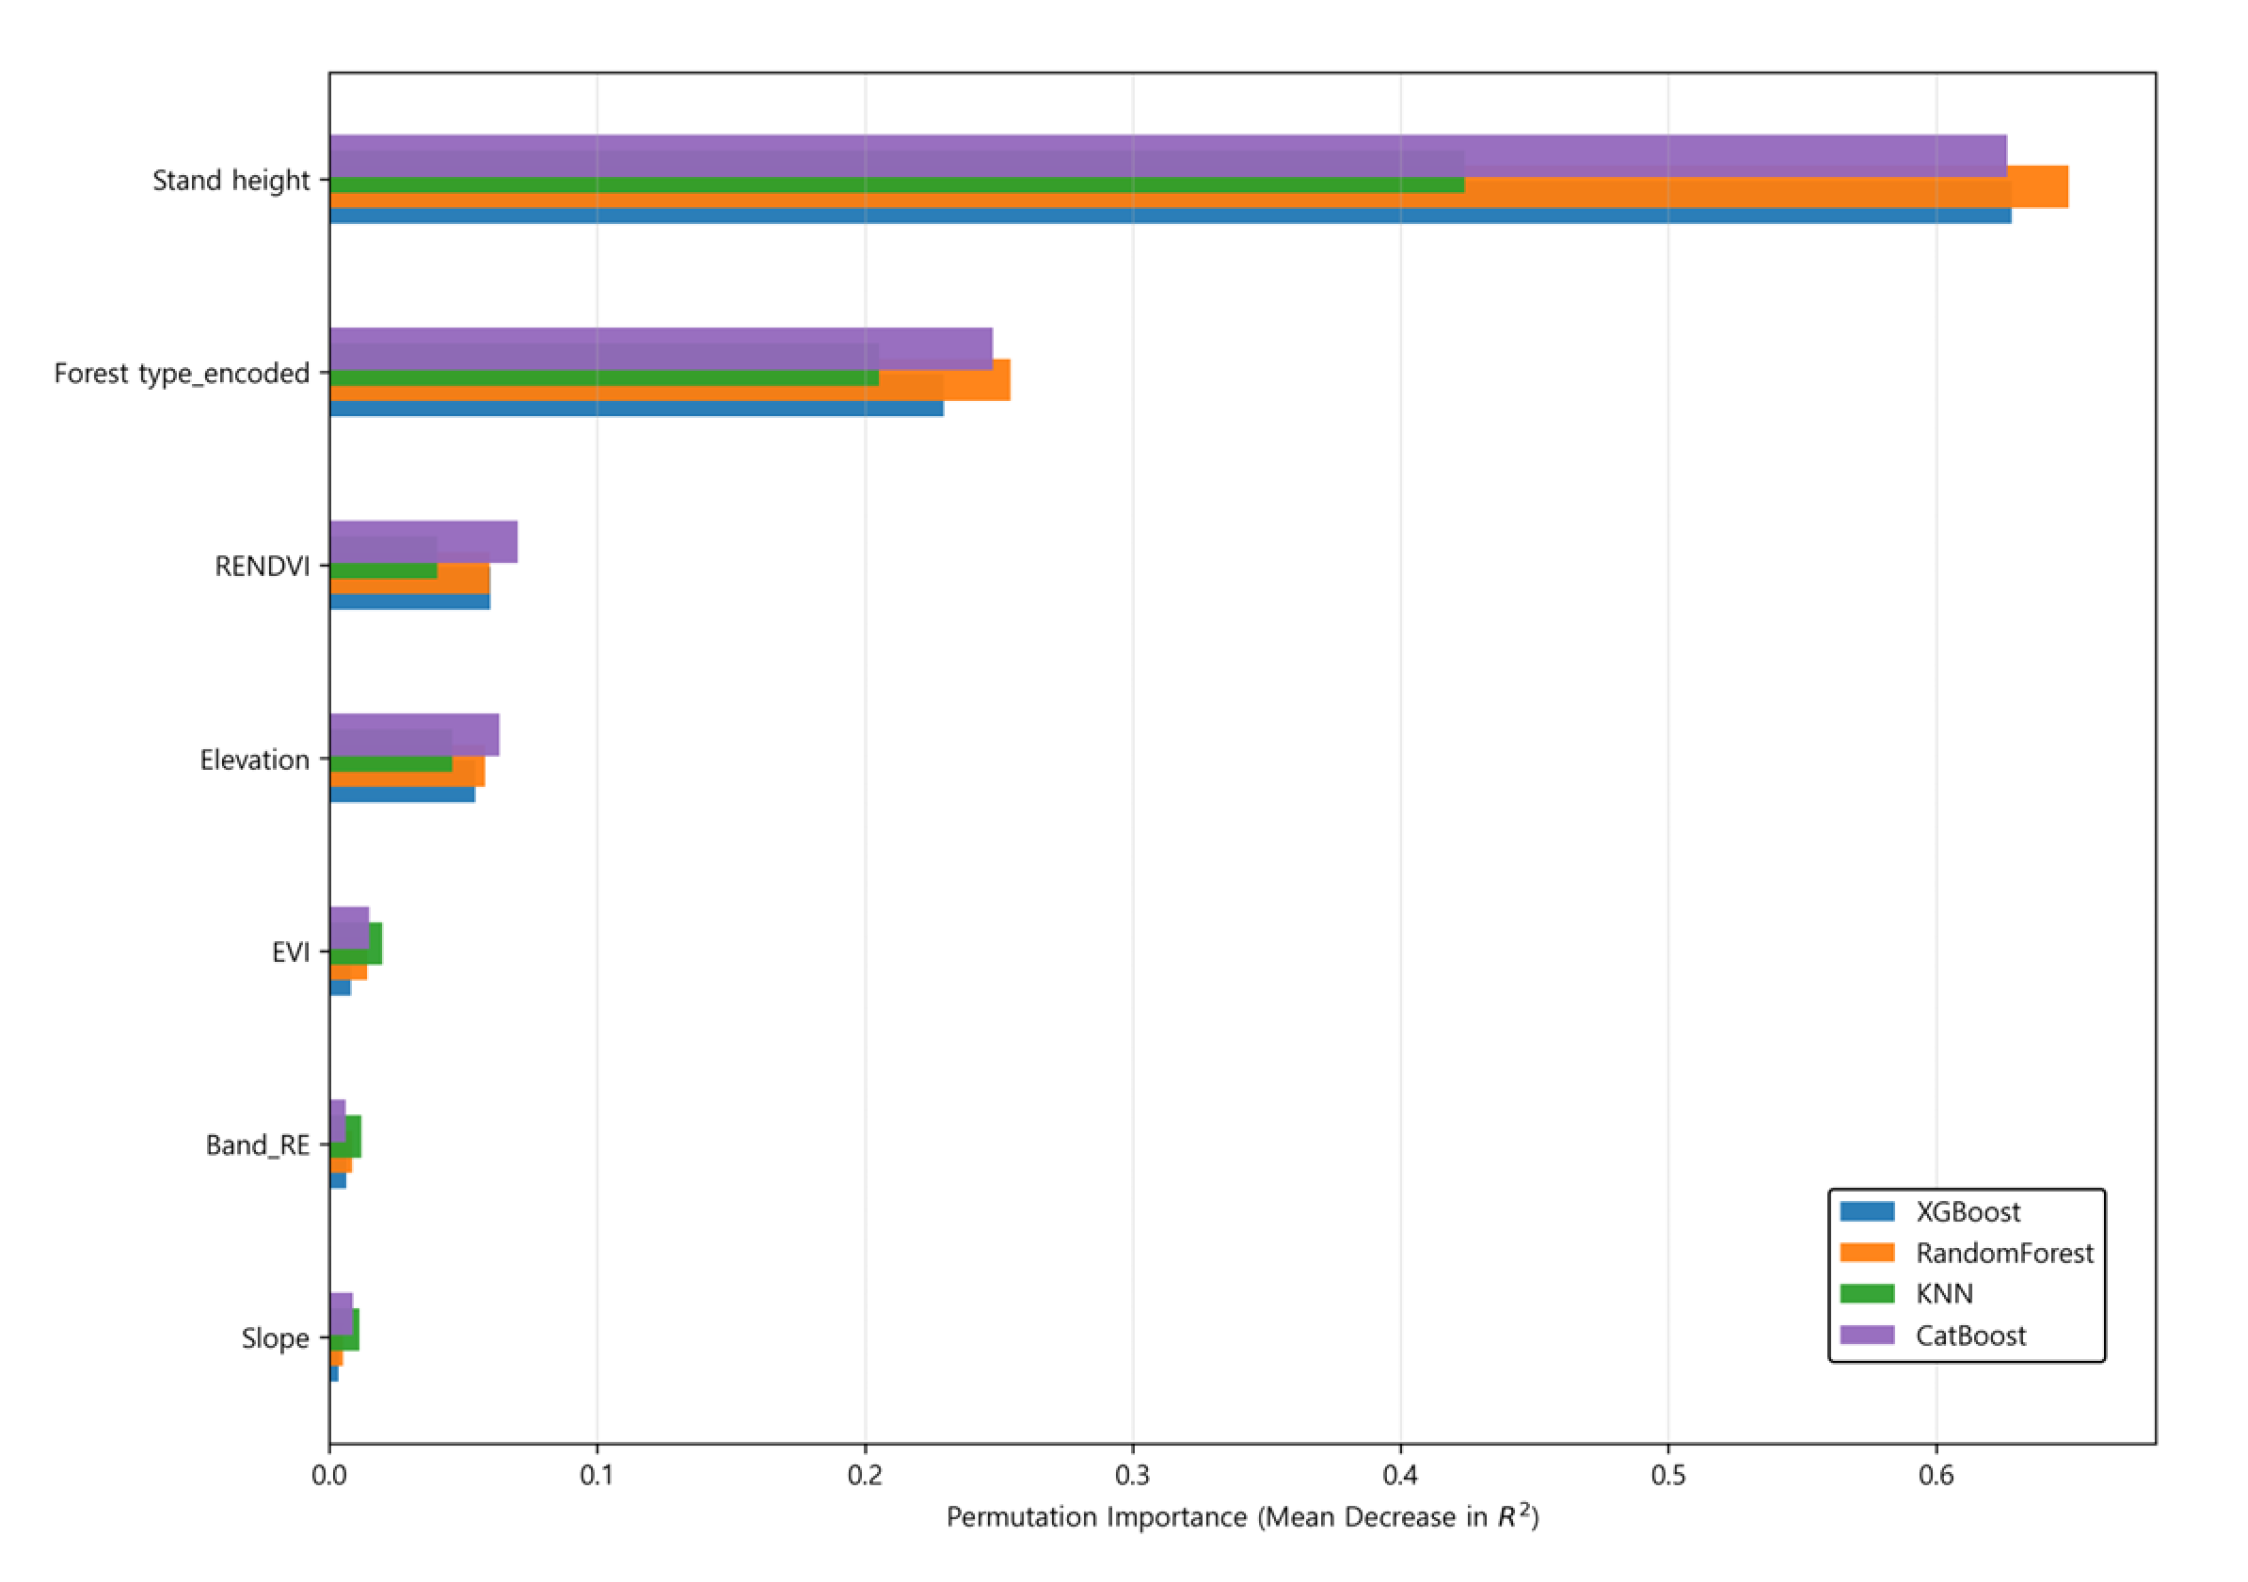
Permutation importance analysis was conducted to identify the most influential predictors across models (
Figure 5). Stand height was consistently the dominant predictor, producing the largest reduction in performance when permuted. Forest type ranked as the next most important variable, highlighting the role of species composition in explaining GSV variability. RENDVI and elevation had moderate contributions, followed by EVI. By contrast, the red-edge band and slope had minimal importance. The results suggest that structural attributes and categorical information were the strongest predictors, whereas vegetation indices and topographic variables provided complementary contributions.
4.4. Spatial Analysis of GSV
4.4.1. Generation of GSV Estimation Map
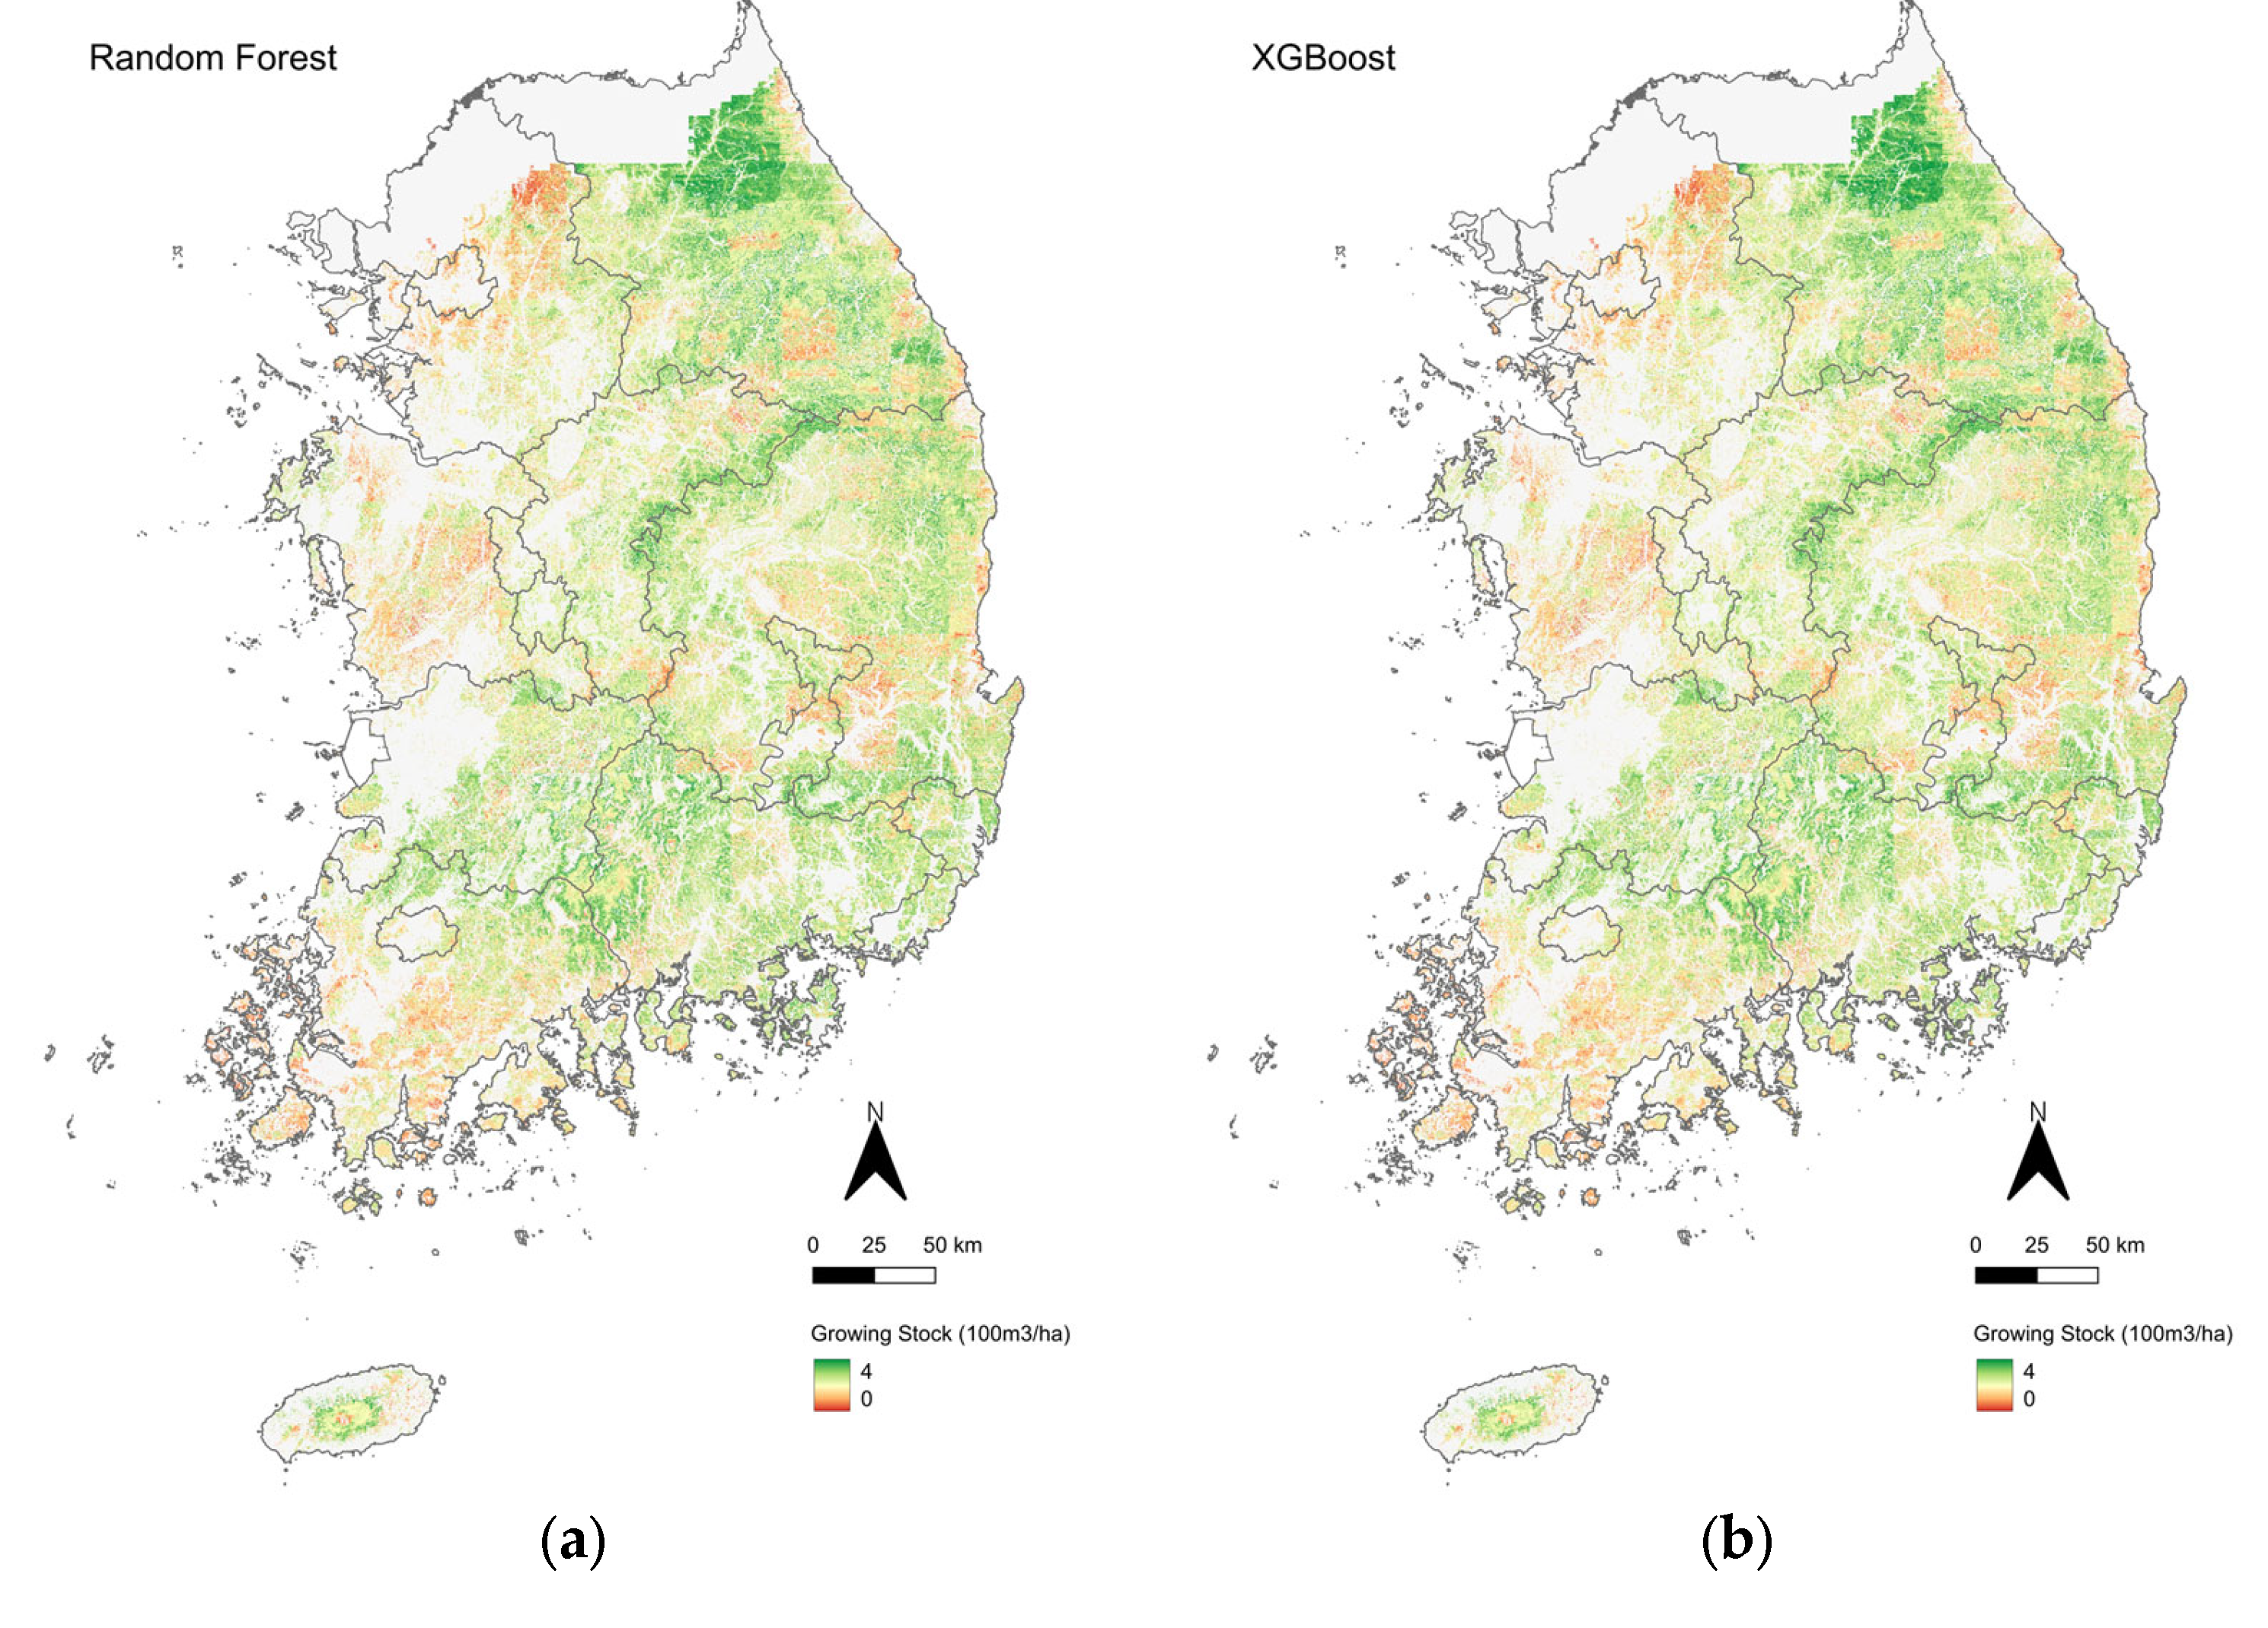
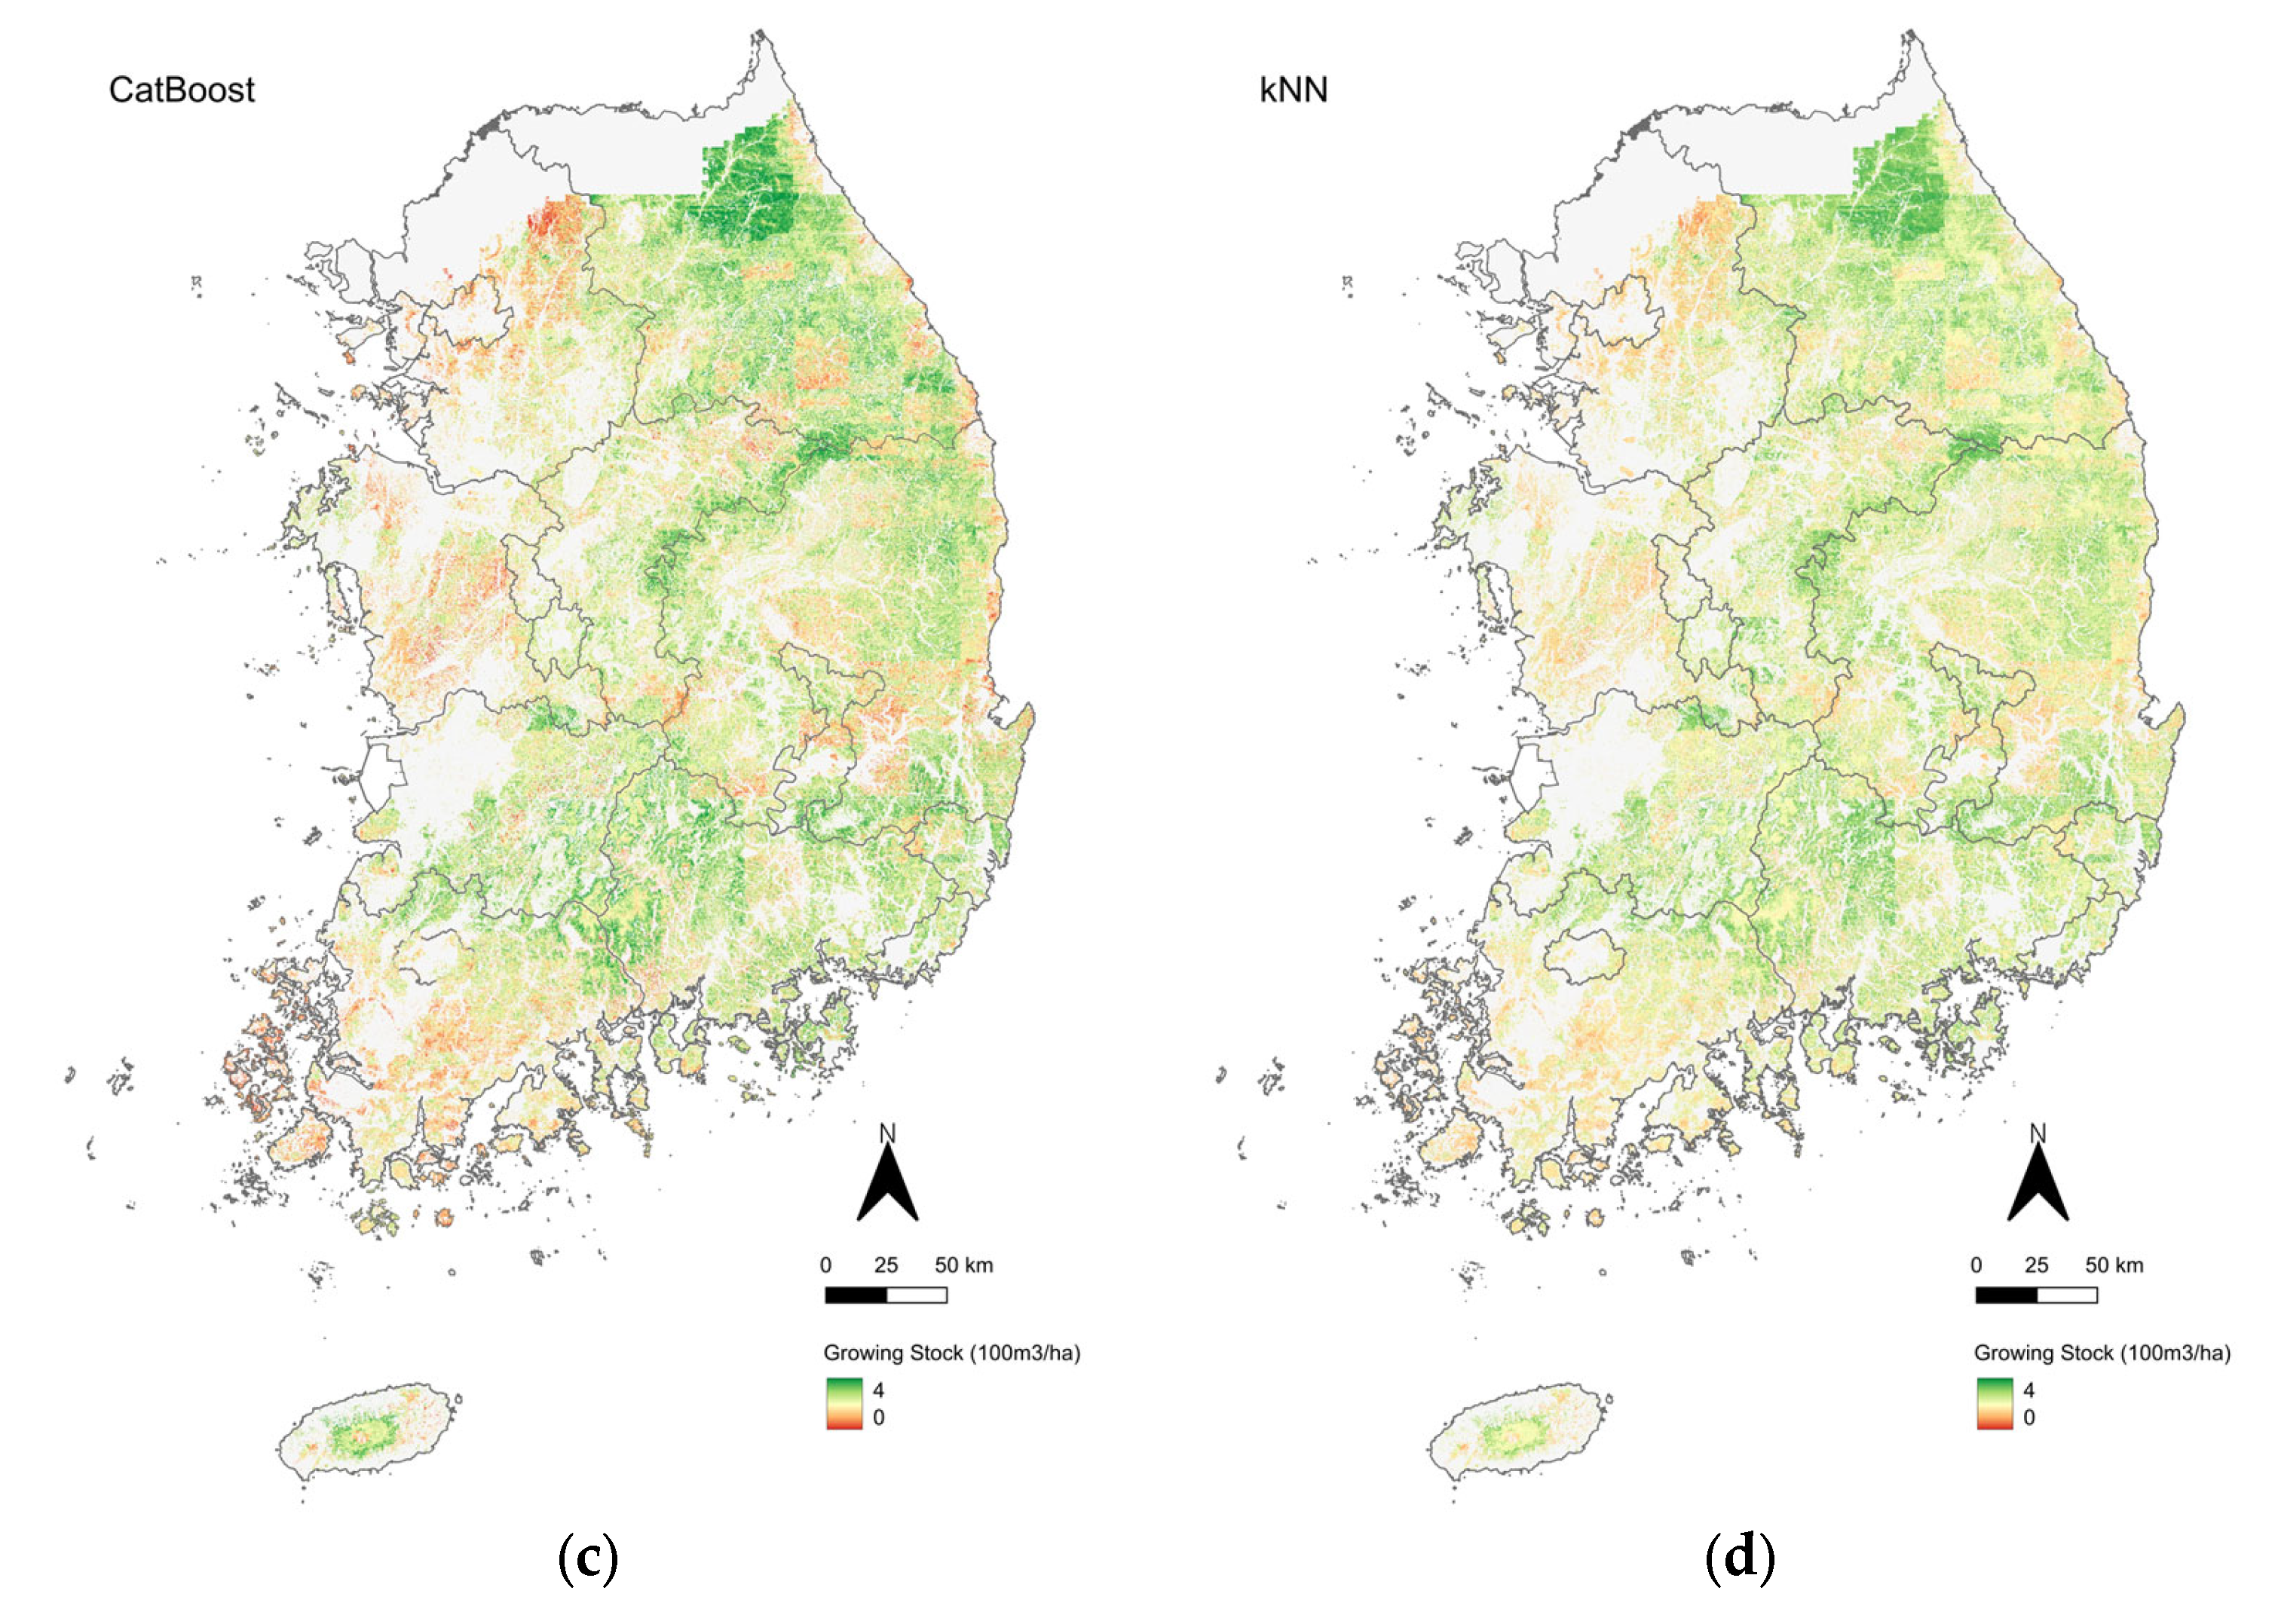
The nationwide estimation maps (
Figure 6) revealed consistent spatial patterns of GSV distribution across South Korea. Higher values were concentrated along the Baekdudaegan mountain range and other major high-elevation areas, whereas lower volumes were observed in lowland and coastal regions. Ensemble models (RF, XGBoost, and CatBoost) highlighted these mountainous patterns more distinctly, whereas the kNN map exhibited reduced spatial variability, with less pronounced representation of major mountain ranges. These results indicate that tree-based ensemble methods captured broad-scale spatial heterogeneity better than the distance-based kNN approach.
Descriptive statistics derived from the estimation maps (
Table 3) indicated that all models underestimated maximum GSV values compared with the NFI observations. Mean and median values were relatively consistent across models and close to the NFI, exhibiting only minor differences. However, standard deviations (StdDevs) revealed clearer distinctions: kNN estimations showed the lowest values, indicating an under-representation of spatial heterogeneity, whereas ensemble models better approximated the observed variability.
4.4.2. Accuracy Assessment of GSV Estimation Map
To further evaluate model performance, errors were stratified according to estimated GSV ranges and key predictor variables. When the test plots were grouped into estimated GSV intervals (
Figure 7), all models achieved minimum RMSEs in the 100–200 m
3/ha range, whereas errors increased toward both lower and higher extremes. kNN showed the lowest RMSE within 100–200 m
3/ha, but its performance deteriorated rapidly for higher values, and it completely failed to produce estimates above 400 m
3/ha. Ensemble methods (RF, XGBoost, CatBoost) generated estimations across the full range, although their errors increased substantially in the extreme ranges.
Errors were also compared by grouping the NFI plots according to stand height and forest type, identified in the permutation importance analysis as the two most influential predictors. As summarized in
Table 4, RMSE values tended to increase with taller stands, particularly in the 20–25 and 25–30 m ranges. Among forest types, coniferous forests exhibited the highest RMSE across models, whereas deciduous and mixed forests yielded lower errors.
5. Discussion
5.1. Overview and Implications of Results
Previous studies have attempted to improve GSV estimation accuracy by integrating remote sensing data and ML techniques, which have led to enhanced predictive performance [
3,
27,
28,
29]. However, most of these applications have remained confined to local or regional scales [
10,
11,
30,
31]. Research on nationwide GSV estimation is limited, particularly in South Korea. Therefore, this study compares and evaluates the performances of multiple ML models for national-scale GSV estimation.
Although the overall accuracy was moderate (R
2 ≈ 0.55), this level of performance is reasonable given the nationwide scale and complex mountainous terrain of South Korea. A comparable study [
32], which also excluded airborne laser scanning data and modeled structurally heterogeneous Mediterranean forests, reported model R
2 values ranging from 0.35 to 0.47 for a study area of 48,657 km
2 in central Italy. In contrast, the present study covers the entire territory of South Korea (100,412 km
2), characterized by diverse forest structures. These findings confirm that, under complex terrain and without airborne laser scanning-derived canopy metrics, moderate model accuracies are typical even in regional-scale studies. In this context, the obtained accuracy is meaningful for nationwide forest resource monitoring.
Beyond statistical performance metrics, this study also provides spatially continuous GSV estimation maps, revealing broad distribution patterns of forest resources. The results can inform the selection of suitable predictor variables and algorithms for GSV estimation in South Korea, and the nationwide maps can be further developed to help establish a national forest monitoring system and contribute to international reporting on forest resources and climate policy.
5.2. Limitations and Future Directions
5.2.1. Limitations of Model Performance
Among the four algorithms evaluated, RF achieved the highest accuracy, XGBoost and CatBoost produced comparable results, and kNN performed the least effectively. This ranking is consistent with previous research underscoring the robust performance of RF in forest resource estimation [
33,
34,
35,
36].
Stratified RMSE analysis further verified systematic tendencies across the GSV range. Errors were minimal within the 100–200 m
3/ha range but increased toward both extremes, with kNN failing to estimate values exceeding 400 m
3/ha. These limitations highlight the struggles of distance-based methods in extrapolating beyond the reference data distribution [
37].
Although kNN exhibited the lowest performance in this study, it has been widely used in forest resource estimation and has also been used in preparing NFI data for countries such as Finland and Sweden [
38,
39,
40,
41,
42,
43]. Its advantages include straightforward multivariate prediction without distributional assumptions, but extrapolation beyond the reference data range inherently causes under- or overestimation. These weaknesses are likely amplified in South Korea, where forests are structurally complex, spanning diverse species compositions, uneven stand ages, and variable densities [
44]. By contrast, boreal forests in Finland and Sweden are typically more even-aged and less diverse, shaped by intensive plantation management [
45,
46]; this helps explain the comparatively lower performance of kNN in this study.
5.2.2. Limitations of Ground and Auxiliary Data
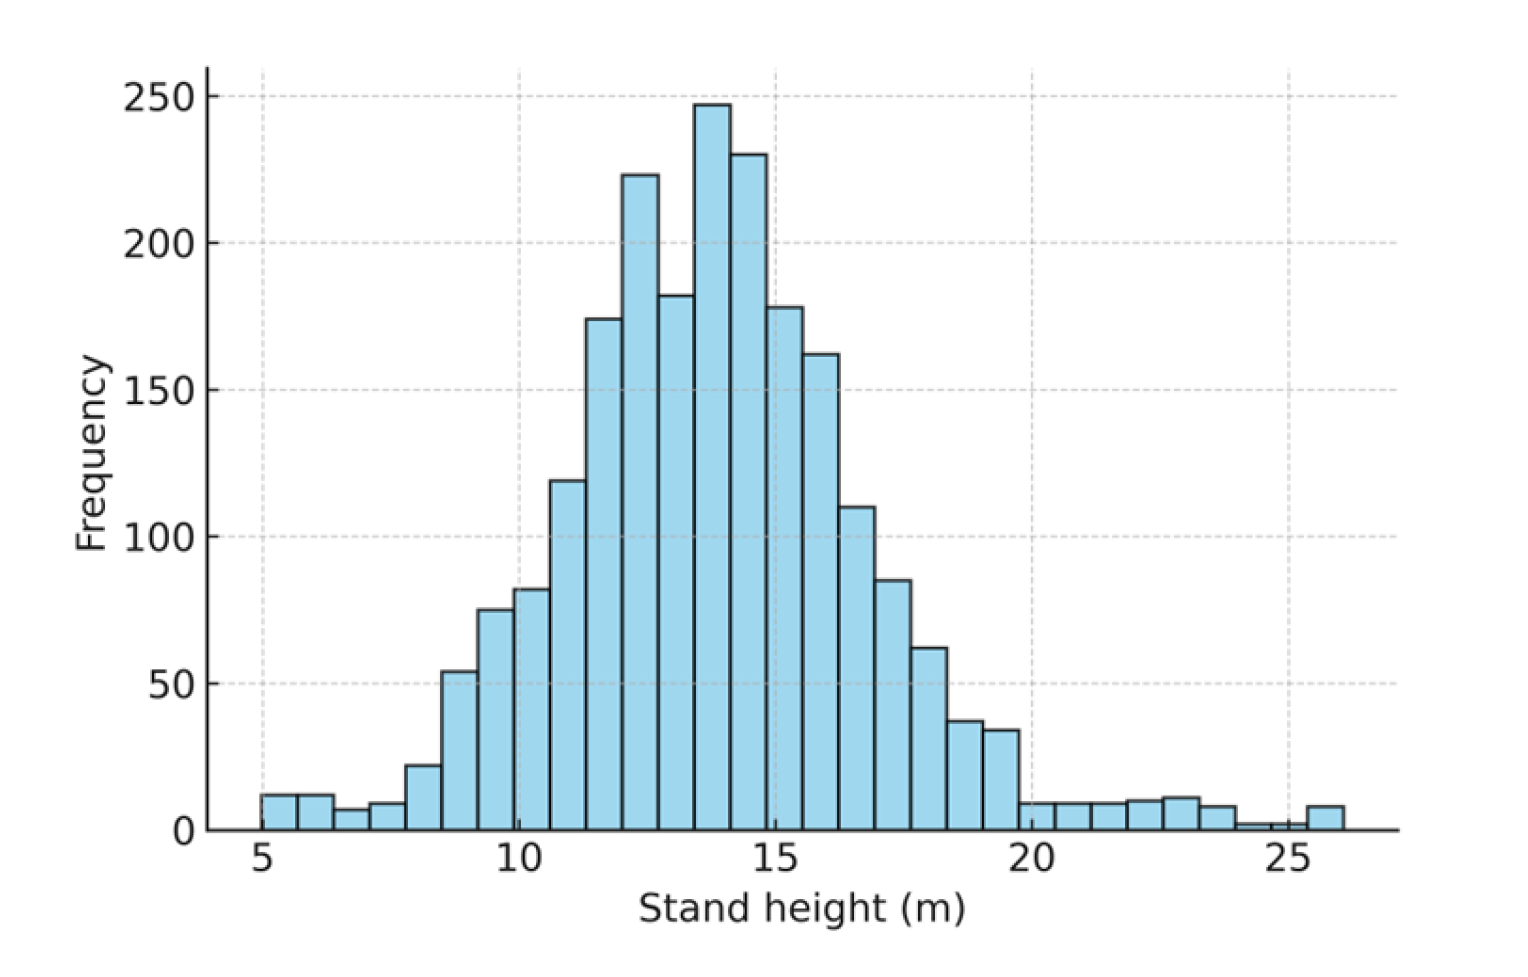
According to the results, stand height emerged as the most influential predictor, showing a clear relationship with model errors. Notably, RMSE values increased sharply in taller stands (
Table 4), reflecting the limited representation of such conditions in the NFI data (
Figure 8). The uneven distribution of tall-stand samples limits data representativeness, forcing the models to extrapolate beyond the dominant data range. Such extrapolation increases uncertainty, particularly for distance-based methods such as kNN, and contributes to the systematic underestimation of high-volume plots [
37,
47].
An analysis of forest types further supports this interpretation. Coniferous forests yielded the highest error rates, whereas deciduous and mixed stands yielded lower errors. This discrepancy could be attributed to the broader distribution of stand heights observed in the NFI data of coniferous forests, which increases within-class variability and reduces the stability of estimations.
Moreover, stand height in the NFI data was derived from the mean of dominant and co-dominant trees within each plot. This aggregation may not fully capture the structural heterogeneity of stands, particularly in uneven-aged mixed-species plots. Even plots with similar GSVs may have divergent height patterns, with some having large volumes but relatively low heights and vice versa (
Figure 9). These inconsistencies reflect the limited precision of the current height data.
In addition, the stand height and forest type layers used as predictors were extracted from the national forest map rather than measured directly in the field. As these layers generalize stand conditions at the polygon level, they may contribute to additional uncertainty in the wall-to-wall GSV predictions and partly explain the underestimation of spatial variability.
5.2.3. Limitations of Remote Sensing Data
Limitations of remote sensing data could also contribute to the observed error patterns. According to previous studies, vegetation indices such as RENDVI and EVI tended to saturate in high-GSV plots, indicating that spectral responses change negligibly despite further increases in GSV, consequently reducing their ability to differentiate dense forest conditions [
48,
49]. In low-GSV plots, estimation errors may also be linked to sparse canopy cover, where spectral signals are likely influenced by understory vegetation and soil background, potentially reducing the sensitivity of optical predictors to tree volume [
50,
51].
Previous studies have demonstrated that light detection and ranging (LiDAR) and synthetic aperture radar (SAR) provide more reliable measurements of canopy height and biomass [
52,
53,
54,
55]. To enhance structural sensitivity, multi-sensor fusion approaches combining optical, LiDAR, or SAR data have been proposed [
56,
57,
58,
59,
60,
61]. Moreover, hybrid inference and geostatistical frameworks have been proposed to reduce estimation uncertainty and support large-scale forest inventory updates [
62,
63].
Advances in LiDAR and SAR are improving the precision of canopy height retrievals. This is expected to further enhance model accuracy because stand height is a key determinant of GSV estimation. For instance, the European Space Agency BIOMASS mission, which uses a P-band SAR sensor, is primarily designed to reduce uncertainties in global biomass estimates by exploiting the sensitivity of long wavelengths to woody components beneath the canopy and providing tomographic 3D information [
64]. These capabilities are expected to provide unprecedented structural insights that can substantially refine large-scale GSV and canopy height estimates.
Furthermore, because DBH, wood density, and species identity are important predictors for biomass and volume estimation [
65,
66], their integration into modeling frameworks could further improve estimation accuracy. Thus, future research in South Korea should integrate LiDAR and SAR with refined, species-level NFI variables to better observe forest heterogeneity, mitigate the structural limits of optical sensors, and improve the reliability of nationwide GSV estimates for sustainable management and climate reporting.
6. Conclusions
This study evaluated the performance of multiple ML algorithms in estimating GSV across South Korea using Sentinel-2A imagery and NFI data. Tree-based ensemble models (RF, XGBoost, CatBoost) outperformed the distance-based kNN, with RF achieving the highest accuracy. Stand height was identified as the most influential predictor, followed by forest type and topographic variables, underscoring the importance of structural attributes in nationwide GSV estimation. The accuracy of the models was moderate (R2 ≈ 0.55), reflecting both the limitations of current predictor precision and the structural complexity of South Korean forests.
The nationwide GSV maps revealed that ensemble methods generally captured spatial heterogeneity more effectively, whereas kNN produced lower variability and failed to represent the full range of GSV. Errors tended to increase in tall stands and coniferous forests, likely due to their limited representation in the NFI data and the structural complexity of these forest types. These results suggest that improving the representation of such conditions in training data and integrating more detailed structural predictors could help reduce uncertainties.
By extending GSV estimation and mapping to the national scale, this study provides a methodological framework for characterizing large-scale forest resource distribution in South Korea. The nationwide GSV maps generated in this study provide a practical baseline for forest monitoring and management. They can be used to identify regions with low or high stock to guide restoration and conservation programs. When these maps are interpreted together with information on stand age, growth rate, and forest structure, they can also inform regional planning for sustainable harvesting and yield regulation. In addition, the maps offer a reference for monitoring changes in forest carbon stocks and for supporting national climate reporting. Improvements in predictor variables could increase the applicability of the framework to national forest monitoring and enable broader contributions to sustainable forest management and climate reporting in the long term.
Author Contributions
Conceptualization, E.S. and S.-E.C.; methodology, E.S. and S.-E.C.; validation, E.S. and S.-E.C.; data curation, E.S.; writing—original draft preparation, E.S.; writing—review and editing, S.-E.C.; visualization, E.S.; supervision, H.W.; project administration, H.W. All authors have read and agreed to the published version of the manuscript.
Funding
This research was conducted with support from the National Institute of Forest Science research on forest-specific information based on the integration of CAS500-4 satellite data (FM0103-2021-04-2025).
Data Availability Statement
The data is available from the corresponding author upon request.
Conflicts of Interest
The authors declare no conflicts of interest.
Abbreviations
The following abbreviations are used in this manuscript:
| ARVI | Atmospherically resistant vegetation index |
| CatBoost | Categorical boosting |
| DBH | Diameter at breast height |
| DEM | Digital elevation model |
| EVI | Enhanced vegetation index |
| GSV | Growing stock volume |
| kNN | k-nearest neighbors |
| LiDAR | Light detection and ranging |
| MAE | Mean absolute error |
| MAPE | Mean absolute percentage error |
| ML | Machine learning |
| NDVI | Normalized difference vegetation index |
| NFI | National forest inventory |
| R2 | Coefficient of determination |
| RENDVI | Red-edge NDVI |
| RF | Random forest |
| RMSE | Root mean squared error |
| SAR | Synthetic aperture radar |
| SAVI | Soil-adjusted vegetation index |
| StdDev | Standard deviation |
| XGBoost | Extreme gradient boosting |
Appendix A
Table A1.
Search ranges and optimized hyperparameter values for each model.
Table A1.
Search ranges and optimized hyperparameter values for each model.
| Model | Hyperparameter | Search Range | Optimized Value |
|---|
| kNN | n_neighbors | [15–34] | 28 |
| weights | [uniform, distance] | distance |
| Random Forest | n_estimators | [500, 800] | 500 |
| max_depth | [None, 20] | 20 |
| min_samples_leaf | [1, 2] | 1 |
| min_samples_split | [2, 5] | 5 |
| max_features | [0.8, sqrt] | 0.8 |
| XGBoost | n_estimators | [100, 200] | 100 |
| max_depth | [4, 6] | 4 |
| learning_rate | [0.05, 0.10] | 0.05 |
| subsample | [0.8, 1.0] | 0.8 |
| CatBoost | iterations | [1500] | 1500 |
| learning_rate | [0.03, 0.05] | 0.03 |
| depth | [5, 6] | 5 |
| l2_leaf_reg | [10, 18, 25] | 25 |
| rsm | [0.70, 0.85] | 0.85 |
| bagging_temperature | [0.5, 0.9] | 0.5 |
References
- Psistaki, K.; Tsantopoulos, G.; Paschalidou, A.K. An overview of the role of forests in climate change mitigation. Sustainability 2024, 16, 6089. [Google Scholar] [CrossRef]
- Sarre, A. Global Forest Resources Assessment, 2020: Main Report; Food and Agriculture Organization of the United Nations: Rome, Italy, 2020. [Google Scholar]
- Wang, X.; Zhang, C.; Qiang, Z.; Xu, W.; Fan, J. A new forest growing stock volume estimation model based on AdaBoost and random forest model. Forests 2024, 15, 260. [Google Scholar] [CrossRef]
- Debeljak, M.; Poljanec, A.; Ženko, B. Modelling forest growing stock from inventory data: A data mining approach. Ecol. Indic. 2014, 41, 30–39. [Google Scholar] [CrossRef]
- Zhou, Y.; Feng, Z. Estimation of forest stock volume using sentinel-2 msi, landsat 8 oli imagery and forest inventory data. Forests 2023, 14, 1345. [Google Scholar] [CrossRef]
- Nogueira, L.R.; Engel, V.L.; Parrotta, J.A.; de Melo, A.C.G.; Ré, D.S. Allometric equations for estimating tree biomass in restored mixed-species Atlantic Forest stands. Biota Neotrop. 2014, 14, e20130084. [Google Scholar] [CrossRef]
- Mulatu, A.; Negash, M.; Asrat, Z. Species-specific allometric models for reducing uncertainty in estimating above ground biomass at Moist Evergreen Afromontane Forest of Ethiopia. Sci. Rep. 2024, 14, 1147. [Google Scholar] [CrossRef]
- Maselli, F.; Chiesi, M.; Mura, M.; Marchetti, M.; Corona, P.; Chirici, G. Combination of optical and LiDAR satellite imagery with forest inventory data to improve wall-to-wall assessment of growing stock in Italy. Int. J. Appl. Earth Obs. Geoinf. 2014, 26, 377–386. [Google Scholar] [CrossRef]
- Puliti, S.; Breidenbach, J.; Schumacher, J.; Hauglin, M.; Klingenberg, T.F.; Astrup, R. Above-ground biomass change estimation using national forest inventory data with Sentinel-2 and Landsat. Remote Sens. Environ. 2021, 265, 112644. [Google Scholar] [CrossRef]
- Li, M.; Li, Z.; Liu, Q.; Chen, E. Growing Stock Volume Estimation in Forest Plantations Using Unmanned Aerial Vehicle Stereo Photogrammetry and Machine Learning Algorithms. Forests 2025, 16, 663. [Google Scholar] [CrossRef]
- Zhang, T.; Lin, H.; Long, J.; Zhang, M.; Liu, Z. Analyzing the saturation of growing stem volume based on ZY-3 stereo and multispectral images in planted coniferous forest. IEEE J. Sel. Top. Appl. Earth Obs. Remote Sens. 2021, 15, 50–61. [Google Scholar] [CrossRef]
- Korea Forest Service. Forest Basic Statistics; Korea Forest Service: Daejeon, Republic of Korea, 2021. (In Korean) [Google Scholar]
- Zhang, J.; Wang, C.; Wang, J.; Huang, X.; Zhou, Z.; Zhou, Z.; Cheng, F. Study on Forest Growing Stock Volume in Kunming City Considering the Relationship Between Stand Density and Allometry. Forests 2025, 16, 891. [Google Scholar] [CrossRef]
- Rodríguez-Veiga, P.; Saatchi, S.; Tansey, K.; Balzter, H. Magnitude, spatial distribution and uncertainty of forest biomass stocks in Mexico. Remote Sens. Environ. 2016, 183, 265–281. [Google Scholar] [CrossRef]
- Zhang, H.; Zhu, J.; Wang, C.; Lin, H.; Long, J.; Zhao, L.; Fu, H.; Liu, Z. Forest growing stock volume estimation in subtropical mountain areas using PALSAR-2 L-band PolSAR data. Forests 2019, 10, 276. [Google Scholar] [CrossRef]
- Cover, T.; Hart, P. Nearest neighbor pattern classification. IEEE Trans. Inf. Theory 1967, 13, 21–27. [Google Scholar] [CrossRef]
- McRoberts, R.E. Estimating forest attribute parameters for small areas using nearest neighbors techniques. For. Ecol. Manag. 2012, 272, 3–12. [Google Scholar] [CrossRef]
- Wilson, B.T.; Lister, A.J.; Riemann, R.I. A nearest-neighbor imputation approach to mapping tree species over large areas using forest inventory plots and moderate resolution raster data. For. Ecol. Manag. 2012, 271, 182–198. [Google Scholar] [CrossRef]
- Tomppo, E.; Haakana, M.; Katila, M.; Peräsaari, J. Multi-Source National Forest Inventory: Methods and Applications; Springer: Berlin/Heidelberg, Germany, 2008. [Google Scholar]
- Pedregosa, F.; Varoquaux, G.; Gramfort, A.; Michel, V.; Thirion, B.; Grisel, O.; Blondel, M.; Prettenhofer, P.; Weiss, R.; Dubourg, V.; et al. Scikit-learn: Machine learning in Python. J. Mach. Learn. Res. 2011, 12, 2825–2830. [Google Scholar]
- Cutler, D.R.; Edwards, T.C., Jr.; Beard, K.H.; Cutler, A.; Hess, K.T.; Gibson, J.; Lawler, J.J. Random forests for classification in ecology. Ecology 2007, 88, 2783–2792. [Google Scholar] [CrossRef]
- Belgiu, M.; Drăguţ, L. Random forest in remote sensing: A review of applications and future directions. ISPRS J. Photogramm. Remote Sens. 2016, 114, 24–31. [Google Scholar] [CrossRef]
- Breiman, L. Random forests. Mach. Learn. 2001, 45, 5–32. [Google Scholar] [CrossRef]
- Chen, T.; Guestrin, C. Xgboost: A scalable tree boosting system. In Proceedings of the 22nd Acm Sigkdd International Conference on Knowledge Discovery and Data Mining, San Francisco, CA, USA, 13–17 August 2016. [Google Scholar]
- Wang, D.; Xing, Y.; Fu, A.; Tang, J.; Chang, X.; Yang, H.; Yang, S.; Li, Y. Mapping Forest Aboveground Biomass Using Multi-Source Remote Sensing Data Based on the XGBoost Algorithm. Forests 2025, 16, 347. [Google Scholar] [CrossRef]
- Prokhorenkova, L.; Gusev, G.; Vorobev, A.; Dorogush, A.V.; Gulin, A. CatBoost: Unbiased boosting with categorical features. In Proceedings of the 2018 Conference on Neural Information Processing Systems, Montréal, QC, Canada, 3–8 December 2018. [Google Scholar]
- Zhao, Y.; Guo, F.; Wang, Y.; Huang, J.; Peng, D. Estimating forest growing stock volume using feature selection and advanced remote sensing algorithm. Remote Sens. Appl. Soc. Environ. 2025, 37, 101458. [Google Scholar] [CrossRef]
- Vangi, E.; D’Amico, G.; Francini, S.; Borghi, C.; Giannetti, F.; Corona, P.; Marchetti, M.; Travaglini, D.; Pellis, G.; Vitullo, M.; et al. Large-scale high-resolution yearly modeling of forest growing stock volume and above-ground carbon pool. Environ. Model. Softw. 2023, 159, 105580. [Google Scholar] [CrossRef]
- Ye, Q.; Yu, S.; Liu, J.; Zhao, Q.; Zhao, Z. Aboveground biomass estimation of black locust planted forests with aspect variable using machine learning regression algorithms. Ecol. Indic. 2021, 129, 107948. [Google Scholar] [CrossRef]
- Lindgren, N.; Olsson, H.; Nyström, K.; Nyström, M.; Ståhl, G. Data assimilation of growing stock volume using a sequence of remote sensing data from different sensors. Can. J. Remote Sens. 2022, 48, 127–143. [Google Scholar] [CrossRef]
- Suleymanov, A.; Bogdan, E.; Gaysin, I.; Volkov, A.; Tuktarova, I.; Belan, L.; Shagaliev, R. Spatial high-resolution modelling and uncertainty assessment of forest growing stock volume based on remote sensing and environmental covariates. For. Ecol. Manag. 2024, 554, 121676. [Google Scholar] [CrossRef]
- Chirici, G.; Giannetti, F.; McRoberts, R.E.; Travaglini, D.; Pecchi, M.; Maselli, F.; Chiesi, M.; Corona, P. Wall-to-wall spatial prediction of growing stock volume based on Italian National Forest Inventory plots and remotely sensed data. Int. J. Appl. Earth Obs. Geoinf. 2020, 84, 101959. [Google Scholar] [CrossRef]
- Fassnacht, F.E.; Hartig, F.; Latifi, H.; Berger, C.; Hernández, J.; Corvalán, P.; Koch, B. Importance of sample size, data type and prediction method for remote sensing-based estimations of aboveground forest biomass. Remote Sens. Environ. 2014, 154, 102–114. [Google Scholar] [CrossRef]
- Cosenza, D.N.; Korhonen, L.; Maltamo, M.; Packalen, P.; Strunk, J.L.; Næsset, E.; Gobakken, T.; Soares, P.; Tomé, M. Comparison of linear regression, k-nearest neighbour and random forest methods in airborne laser-scanning-based prediction of growing stock. For. Int. J. For. Res. 2021, 94, 311–323. [Google Scholar] [CrossRef]
- Packalen, P.; Temesgen, H.; Maltamo, M. Variable selection strategies for nearest neighbor imputation methods used in remote sensing based forest inventory. Can. J. Remote Sens. 2012, 38, 557–569. [Google Scholar] [CrossRef]
- Wu, C.; Shen, H.; Shen, A.; Deng, J.; Gan, M.; Zhu, J.; Xu, H.; Wang, K. Comparison of machine-learning methods for above-ground biomass estimation based on Landsat imagery. J. Appl. Remote Sens. 2016, 10, 35010. [Google Scholar] [CrossRef]
- Breidenbach, J.; Næsset, E.; Gobakken, T. Improving k-nearest neighbor predictions in forest inventories by combining high and low density airborne laser scanning data. Remote Sens. Environ. 2012, 117, 358–365. [Google Scholar] [CrossRef]
- Lin, C.; Doyog, N.D. Applying a four-way factorial experimental model to diagnose optimum kNN parameters for precise aboveground biomass mapping. IEEE J. Sel. Top. Appl. Earth Obs. Remote Sens. 2024, 18, 479–495. [Google Scholar] [CrossRef]
- Balazs, A.; Tuominen, S.; Kangas, A. Enhancing forest inventory Accuracy: Comparing 3D-CNN and k-NN with genetic algorithm Approaches using ALS data across boreal bioregions. Comput. Electron. Agric. 2025, 237, 110576. [Google Scholar] [CrossRef]
- Haakana, M.; Tuominen, S.; Heikkinen, J.; Peltoniemi, M.; Lehtonen, A. Spatial patterns of biomass change across Finland in 2009–2015. BioRxiv 2022. [Google Scholar] [CrossRef]
- Fridman, J.; Holm, S.; Nilsson, M.; Nilsson, P.; Ringvall, A.H.; Ståhl, G. Adapting National Forest Inventories to changing requirements–the case of the Swedish National Forest Inventory at the turn of the 20th century. Silva Fenn. 2014, 48, 1095. [Google Scholar] [CrossRef]
- Bell, D.M.; Wilson, B.T.; Werstak, C.E., Jr.; Oswalt, C.M.; Perry, C.H. Examining k-nearest neighbor small area estimation across scales using national forest inventory data. Front. For. Glob. Change 2022, 5, 763422. [Google Scholar] [CrossRef]
- Miettinen, J.; Breidenbach, J.; Adame, P.; Adolt, R.; Alberdi, I.; Antropov, O.; Arnarsson, Ó.; Astrup, R.; Berger, A.; Bogason, J.; et al. Pan-European forest maps produced with a combination of earth observation data and national forest inventory plots. Data Brief 2025, 60, 111613. [Google Scholar] [CrossRef]
- Park, J.; Kim, H.S.; Jo, H.K.; Jung, I.B. The influence of tree structural and species diversity on temperate forest productivity and stability in Korea. Forests 2019, 10, 1113. [Google Scholar] [CrossRef]
- Klein, J.; Low, M.; Thor, G.; Sjögren, J.; Lindberg, E.; Eggers, S. Tree species identity and composition shape the epiphytic lichen community of structurally simple boreal forests over vast areas. PLoS ONE 2021, 16, e0257564. [Google Scholar] [CrossRef]
- Kellomäki, S.; Peltola, H.; Nuutinen, T.; Korhonen, K.T.; Strandman, H. Sensitivity of managed boreal forests in Finland to climate change, with implications for adaptive management. Philos. Trans. R. Soc. B Biol. Sci. 2008, 363, 2339–2349. [Google Scholar] [CrossRef]
- Magnussen, S.; Tomppo, E.; McRoberts, R.E. A model-assisted k-nearest neighbour approach to remove extrapolation bias. Scand. J. For. Res. 2010, 25, 174–184. [Google Scholar] [CrossRef]
- Liu, Z.; Long, J.; Lin, H.; Xu, X.; Liu, H.; Zhang, T.; Ye, Z.; Yang, P. Combination Strategies of Variables with Various Spatial Resolutions Derived from GF-2 Images for Mapping Forest Stock Volume. Forests 2023, 14, 1175. [Google Scholar] [CrossRef]
- Aklilu Tesfaye, A.; Gessesse Awoke, B. Evaluation of the saturation property of vegetation indices derived from sentinel-2 in mixed crop-forest ecosystem. Spat. Inf. Res. 2021, 29, 109–121. [Google Scholar] [CrossRef]
- Rautiainen, M.; Lukeš, P. Spectral contribution of understory to forest reflectance in a boreal site: An analysis of EO-1 Hyperion data. Remote Sens. Environ. 2015, 171, 98–104. [Google Scholar] [CrossRef]
- Wang, H.; Muller, J.D.; Tatarinov, F.; Yakir, D.; Rotenberg, E. Disentangling soil, shade, and tree canopy contributions to mixed satellite vegetation indices in a sparse dry forest. Remote Sens. 2022, 14, 3681. [Google Scholar] [CrossRef]
- Simard, M.; Pinto, N.; Fisher, J.B.; Baccini, A. Mapping forest canopy height globally with spaceborne lidar. J. Geophys. Res. Biogeosci. 2011, 116, G04021. [Google Scholar] [CrossRef]
- Dubayah, R.; Blair, J.B.; Goetz, S.; Fatoyinbo, L.; Hansen, M.; Healey, S.; Hofton, M.; Hurtt, G.; Kellner, J.; Luthcke, S.; et al. The Global Ecosystem Dynamics Investigation: High-resolution laser ranging of the Earth’s forests and topography. Sci. Remote Sens. 2020, 1, 100002. [Google Scholar] [CrossRef]
- Potapov, P.; Li, X.; Hernandez-Serna, A.; Tyukavina, A.; Hansen, M.C.; Kommareddy, A.; Pickens, A.; Turubanova, S.; Tang, H.; Silva, C.E.; et al. Mapping global forest canopy height through integration of GEDI and Landsat data. Remote Sens. Environ. 2021, 253, 112165. [Google Scholar] [CrossRef]
- Santoro, M.; Beaudoin, A.; Beer, C.; Cartus, O.; Fransson, J.E.S.; Hall, R.J.; Pathe, C.; Schmullius, C.; Schepaschenko, D.; Shvidenko, A.; et al. Forest growing stock volume of the northern hemisphere: Spatially explicit estimates for 2010 derived from Envisat ASAR. Remote Sens. Environ. 2015, 168, 316–334. [Google Scholar] [CrossRef]
- Zhang, N.; Chen, M.; Yang, F.; Yang, C.; Yang, P.; Gao, Y.; Shang, Y.; Peng, D. Forest height mapping using feature selection and machine learning by integrating multi-source satellite data in Baoding City, North China. Remote Sens. 2022, 14, 4434. [Google Scholar] [CrossRef]
- Shendryk, I.; Hellström, M.; Klemedtsson, L.; Kljun, N. Low-density LiDAR and optical imagery for biomass estimation over boreal forest in Sweden. Forests 2014, 5, 992–1010. [Google Scholar] [CrossRef]
- Li, H.; Kato, T.; Hayashi, M.; Wu, L. Estimation of forest aboveground biomass of two major conifers in Ibaraki Prefecture, Japan, from palsar-2 and sentinel-2 data. Remote Sens. 2022, 14, 468. [Google Scholar] [CrossRef]
- Lang, N.; Schindler, K.; Wegner, J.D. Country-wide high-resolution vegetation height mapping with Sentinel-2. Remote Sens. Environ. 2019, 233, 111347. [Google Scholar] [CrossRef]
- Becker, A.; Russo, S.; Puliti, S.; Lang, N.; Schindler, K.; Wegner, J.D. Country-wide retrieval of forest structure from optical and SAR satellite imagery with deep ensembles. ISPRS J. Photogramm. Remote Sens. 2023, 195, 269–286. [Google Scholar] [CrossRef]
- Omoniyi, T.O.; Sims, A. Enhancing the precision of forest growing stock volume in the estonian national forest inventory with different predictive techniques and remote sensing data. Remote Sens. 2024, 16, 3794. [Google Scholar] [CrossRef]
- Su, H.; Shen, W.; Wang, J.; Ali, A.; Li, M. Machine learning and geostatistical approaches for estimating aboveground biomass in Chinese subtropical forests. For. Ecosyst. 2020, 7, 64. [Google Scholar] [CrossRef]
- Condés, S.; McRoberts, R.E. Updating national forest inventory estimates of growing stock volume using hybrid inference. For. Ecol. Manag. 2017, 400, 48–57. [Google Scholar] [CrossRef]
- Banda, F.; Giorgi, E.; Piantanida, R.; D’Aria, D.; Mazzucchelli, P. BIOMASS Forest Height Products Format Specification; European Space Agency (ESA): Paris, France, 2025; p. 68. [Google Scholar]
- Chave, J.; Réjou-Méchain, M.; Búrquez, A.; Chidumayo, E.; Colgan, M.S.; Delitti, W.B.C.; Duque, A.; Eid, T.; Fearnside, P.M.; Goodman, R.C.; et al. Improved allometric models to estimate the aboveground biomass of tropical trees. Glob. Change Biol. 2014, 20, 3177–3190. [Google Scholar] [CrossRef]
- Paul, K.I.; Roxburgh, S.H.; Chave, J.; England, J.R.; Zerihun, A.; Specht, A.; Lewis, T.; Bennett, L.T.; Baker, T.G.; Adams, M.A.; et al. Testing the generality of above-ground biomass allometry across plant functional types at the continent scale. Glob. Change Biol. 2016, 22, 2106–2124. [Google Scholar] [CrossRef]
| Disclaimer/Publisher’s Note: The statements, opinions and data contained in all publications are solely those of the individual author(s) and contributor(s) and not of MDPI and/or the editor(s). MDPI and/or the editor(s) disclaim responsibility for any injury to people or property resulting from any ideas, methods, instructions or products referred to in the content. |
© 2025 by the authors. Licensee MDPI, Basel, Switzerland. This article is an open access article distributed under the terms and conditions of the Creative Commons Attribution (CC BY) license (https://creativecommons.org/licenses/by/4.0/).
